
Abstract
The AKT-mTOR pathway is activated in diabetic nephropathy. Renin-angiotensin system modulators exert beneficial effects on the diabetic kidney. We explored the action of losartan on AKT-mTOR phosphorylation in glomeruli and podocytes. Diabetes mellitus was induced to Sprague-Dawley rats by streptozotocin. Five months later, the rats were commenced on losartan and euthanized 2 months later. Kidneys were processed for immunofluorescence studies. Glomeruli were isolated for Western blot analysis. Diabetes increased activated forms of AKT and mTOR both in glomeruli and podocytes. In diabetic rats, losartan decreased phosphorylated/activated forms of AKT (Thr308) and mTOR (Ser2448) in glomeruli but decreased only activated mTOR in podocytes. However, in both glomeruli and podocytes of healthy animals, an inverse pattern was evident. In conclusion, a new body of evidence indicates the differential activation of AKT-mTOR in glomeruli and podocytes of healthy and diabetic animals in response to losartan.
Type 1 diabetes mellitus is an autoimmune disease, one of the most common in childhood worldwide. Pancreatic beta cells are destroyed due to genetic and/or environmental factors, resulting in insulin deficiency (Forlenza and Rewers 2011). The ensuing hyperglycemia is the trigger to a cascade of complications that affect target organs, including the kidney. Diabetic nephropathy may be clinically silent in early stages with only structural changes. As it progresses, urinary albumin excretion increases, and clinical signs become evident with further worsening of the underlying renal lesions, causing a significant burden on patients’ lives (Mogensen et al. 1983).
The glomerulus and the podocyte have a central role in the pathophysiology of diabetic nephropathy (Wolf et al. 2005). Furthermore, despite the suppression of the systemic renin-angiotensin system (RAS), the intrarenal RAS is activated, causing detrimental effects in the kidney (Carey and Siragy 2003).
In an attempt to slow the disease progression, it has been demonstrated that type 1 diabetic patients with microalbuminuria or overt nephropathy gain a substantial benefit from angiotensin-converting enzyme (ACE) inhibitors (Microalbuminuria Captopril Study Group 1996; Hovind et al. 2001).
Evidence linking angiotensin II and increased mTOR activity has been found in cell culture (Hafizi et al. 2004). mTOR, a serine/threonine kinase, exists as a component of two multiprotein signaling complexes, mTOR complex-1 (mTORC1) and mTOR complex-2 (mTORC2). Phosphatidylinositol-3 kinase (PI3K) receives input from growth factors and amino acids and leads to phosphorylation of Thr308 on AKT/pkB (protein kinase B), a key regulator of cellular proliferation, survival, and growth (Hers et al. 2011). Activated AKT leads to mTORC1 activation, through reversion of a series of inhibitory signals, via the tuberous sclerosis (TSC) system (Lieberthal and Levine 2009). AKT can also directly activate mTORC1 by phosphorylating mTOR at Ser2448, without the involvement of the TSC complex (Sekulić et al. 2000).
AMP-activated protein kinase (AMPK), an energy sensor, is activated in low glucose conditions and inhibits mTOR (Inoki et al. 2003). Moreover, mTORC2 has been shown to phosphorylate AKT at Ser473, which further activates AKT (Sarbassov et al. 2005).
Studies that assessed the role of rapamycin, a specific mTOR inhibitor, in diabetic animals revealed that mTOR and AKT are activated in the diabetic kidney, mediating pathologic changes (Lieberthal and Levine 2009).
Because the tissue microenvironment sets the scene for cell function, we studied the effect of losartan on the PI3K-AKT-mTOR pathway in the glomerulus and the podocytes of the diabetic kidney.
To our knowledge, no data currently exist on the effects of losartan on the PI3K-AKT-mTOR pathway in type 1 diabetic nephropathy in vivo. Therefore, we investigated (a) the glomerular content of total AKT (tAKT), phosphorylated (p)AKT Thr308, pAKT Ser473, mTOR, and activated mTOR phosphorylated at residue Ser2448 and (b) the podocytic content of the aforementioned molecules, employing co-localization analysis with the podocyte-specific marker nephrin.
Materials and Methods
Animals
Male Sprague-Dawley rats were provided by the Hellenic Pasteur Institute (Athens, Greece). Diabetes mellitus was induced by intraperitoneal injection of streptozotocin (Sigma-Aldrich; St. Louis, MO), 65 mg/kg−1 body weight (BW) in 0.1 M citrate buffer, to rats aged 8 to 10 weeks. Three days later, blood glucose was measured by a glucometer, and rats having values >350 mg/dl−1 were considered diabetic and included in the study. The animals received, subcutaneously, glargine insulin every other day, individually adjusted to maintain blood glucose levels between 350 and 500 mg/dl−1.
The animals had access to standard rat feed and water ad libitum and were housed in a room with stable humidity and temperature and a 12-hour dark-light cycle. All experiments were performed according to current European Union legislation on handling and housing of laboratory animals and were approved by our university ethics committee.
Experimental Design
Five months after diabetes induction, the animals were divided into 4 groups: diabetic animals (Dm; n=6), diabetic animals on losartan potassium (LKT Laboratories; St. Paul, MN) daily (50 mg/kg−1 BW in drinking water) (DmRx; n=6), healthy control animals (Ctrl; n=6), and healthy control animals on losartan potassium daily (50 mg/kg–-1 BW in drinking water) (CtrlRx; n=6). After 2 months of losartan administration, the animals were anesthetized with an intraperitoneal injection of 50 mg/kg−1 BW sodium pentobarbital and killed by exsanguination. The kidneys were excised and put in ice-cold PBS after removal of the capsule.
Glomeruli Isolation
Glomeruli were isolated by sequential sieving, employing sieves (Retsch, Haan, Germany) with different pore sizes: 150 µm, 106 µm, and 75 µm. Isolated glomeruli were retained on the bottom screen of a 75-µm pore size. Purity of the glomerular isolate was estimated at >95% (Troyer and Kreisberg 1990).
Western Blot Analysis of the Glomerular Isolate
Isolated glomeruli were homogenized in Ripa buffer containing protease inhibitors (Roche Diagnostics; Indianapolis, IN) and centrifuged at 13,000 × g for 15 min. The supernatant was collected and stored at −80C.
The samples were electrophorized (5 µg of total protein/lane) on SDS-PAGE and transferred to nitrocellulose membranes. The membranes were blocked with 5% BSA (Sigma-Aldrich) in TBS 1× Tween-20 (0.1%) and blotted overnight at 4C with the following antibodies: rabbit Akt pAb (1:500), rabbit Ser473 pAkt mAb (1:500), rabbit Thr308 pAkt mAb (1:500) (all from Cell Signaling Technology; Boston, MA), and guinea pig antinephrin (1:500) (Progen GmbH; Heidelberg, Germany). Appropriate horseradish peroxidase–linked antibodies (Cell Signaling Technology) were applied for 60 min at room temperature. Each experiment was performed twice. Signal were developed with enhanced chemiluminescence (GenScript; Piscataway, NJ). The ImageJ program (National Institutes of Health; Bethesda, MD) was used for densitometry of the bands. Equal loading was evaluated by staining nitrocellulose membranes with Ponceau-S (Sigma-Aldrich) before applying primary or secondary antibody solutions.
Indirect Immunofluorescence Studies
Tissue was embedded in OCT Compound (SAKURA; Osaka, Japan), snap frozen in liquid nitrogen, and stored at −80C. Then, 5-µm-thick sections were fixed with 4% paraformaldehyde for 13 min and washed 3 times with PBS Tween-20 (0.05%) for 5 min each and then with Triton X100 (0.1%) for 10 min, followed by 3 washes. Blocking was performed with normal goat serum (Life Technologies; Carlsbad, CA) for 60 min at room temperature, and then AffiniPure Fab fragment goat anti–rat IgG (Jackson ImmunoResearch; Suffolk, UK) was applied (0.2 mg/ml) on the sections for 90 min at room temperature.
The sections were incubated overnight at 4C with the following primary antibodies: rabbit Akt pAb (1:100), rabbit Ser473 pAkt mAb (1:100), rabbit Thr308 pAkt mAb (1:800), rabbit mTOR mAb (1:150), rabbit Ser2448 phospho-mTOR mAb (1:100) (all from Cell Signaling), and guinea pig nephrin pAb (1:200) (Progen GmbH).
The secondary antibodies, goat anti–guinea pig Dylight 649 (1:350; Jackson ImmunoResearch) and goat anti–rabbit Alexa Fluor 488 (1:800; Invitrogen, Carlsbad, CA), were applied for 40 min at room temperature.
The slides were observed on a Leica confocal microscope (Leica GmbH; Wetzlar, Germany) using the 40× objective. Each co-localization experiment was performed twice. At least 50 glomeruli were examined per animal in each co-localization experiment.
We examined the presence of rat IgG molecules within glomeruli of the animals by incubating sections with goat anti–rat Dylight 488 IgG (H+L; Jackson ImmunoResearch) at 1:100 for 1 hr at ambient temperature. In diabetic animals, the presence of linear deposition within the glomerulus was evident, indicating indigenous IgG deposition. We managed to block nonspecific labeling due to IgG deposition by applying unconjugated AffiniPure Fab fragment goat anti–rat IgG at the concentration and for the duration described above. After omitting primary antibodies, nonspecific signal was absent. The ImageJ program was used for fluorescence intensity measurement of nephrin, tAKT, Ser473 pAKT, Thr308 pAKT, mTOR, and Ser2448 phospho-mTOR.
Co-localization Analysis
Pearson’s coefficient (Cell Profiler Software; Cambridge, MA) was used for association strength estimation of tAKT and nephrin, Ser473 pAKT (pAKT473) and nephrin, Thr308 pAKT (pAKT308) and nephrin, mTOR and nephrin, and Ser2448 phospho-mTOR (pTOR2448) and nephrin (Lamprecht et al. 2007).
Statistical Analysis
SPSS version 19 (SPSS, Inc., an IBM Company, Chicago, IL) was used for data processing and analysis. Data distribution was examined. In case of normality, one-way analysis of variance with Bonferroni correction for multiple comparisons was used. In case of non-normality, logarithmic transformation of data was performed. If after logarithmic transformation the data distribution was other than normal, the Kruskal-Wallis test for independent samples was applied. The Mann-Whitney U test was employed for estimating statistical significance among two different groups. Statistical significance was set at p<0.05.
Results
Mean mTOR Protein Content and Activation
Estimation of Glomerular mTOR Protein
At the glomerular level, diabetes mellitus increased mTOR (12% increase in Dm rats vs. Ctrl rats, p<0.05; Fig. 1). Losartan caused a slight but not significant reduction in glomerular mTOR levels when comparing Dm with DmRx. However, the absence of a significant difference when comparing Ctrl with DmRx indicates that losartan indeed lowered glomerular mTOR levels toward normal.
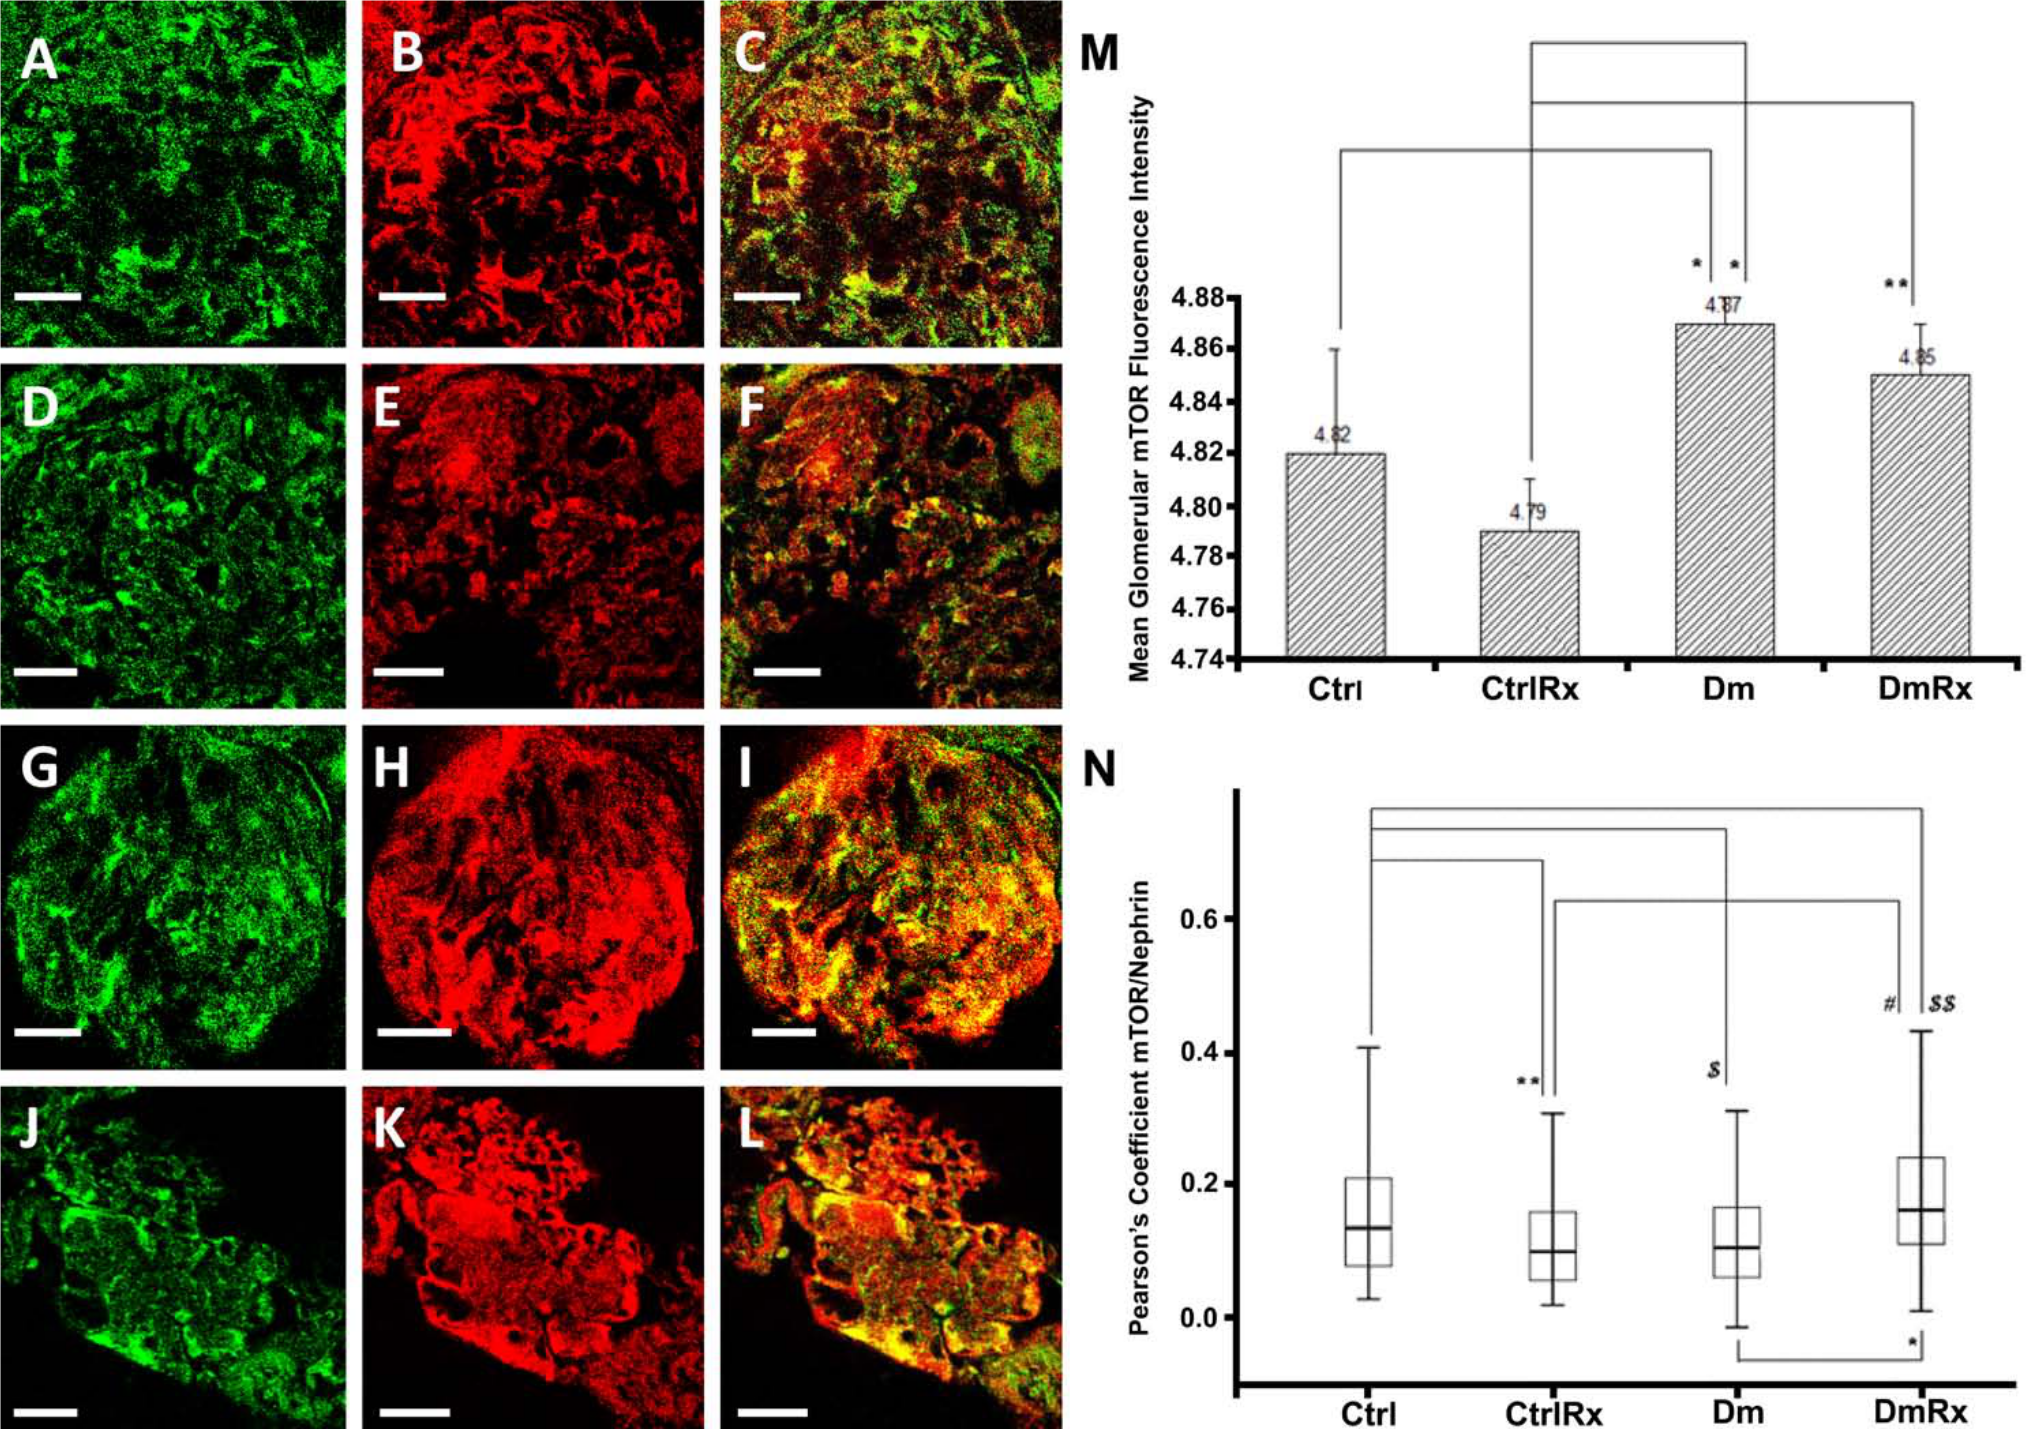
(A–L) Glomerular mTOR (in green) and nephrin (in red) co-localization (in yellow). Ctrl (A, B, C), CtrlRx (D, E, F), Dm (G, H, I), and DmRx (J, K, L) groups. Mean glomerular mTOR fluorescence intensity (M). mTOR/nephrin Pearson’s coefficient, representing podocytic mTOR in groups under study (N). Ctrl, control rats; CtrlRx, control losartan-treated rats; Dm, diabetic rats; DmRx, diabetic losartan-treated rats. Mean mTOR fluorescence intensity graph bars represent mean after logarithmic transformation + standard error (*p<0.001, **p=0.002). Pearson’s coefficient represents median (*p<0.001, **p=0.003, $p=0.005, $$p=0.029, #p=0.001). Scale bars, 30 µm.
Estimation of Glomerular mTOR Activation
For glomerular-activated mTOR (pTOR2448), losartan did not lead to any change in the control groups. When comparing diabetic animals with diabetic animals receiving losartan, there was a significant decrease in pTOR2448 in the treatment group (31.8% decrease in DmRx rats vs. Dm rats, p<0.05; Fig. 2). As to the effect of diabetes on pTOR2448 status, when comparing diabetic rats with healthy rats as well as treated diabetic rats with treated healthy rats, there was a significant increase in pTOR2448 in diabetic rats (58.4% and 20.2%, respectively, p<0.05 for both comparisons; Fig. 2). However, the glomerular levels of mTOR followed the same tendency (Fig. 1). Given the fact that mTOR protein levels did not differ between Ctrl and CtrlRx rats, as well as between Ctrl and DmRx rats, while pTOR2448 levels were the same between Ctrl and CtrlRx rats but increased in DmRx rats, it can be concluded that in diabetes, there is increased glomerular mTOR phosphorylation at Ser2448. On the other hand, losartan treatment in diabetic rats partially restored pTOR2448 glomerular content.
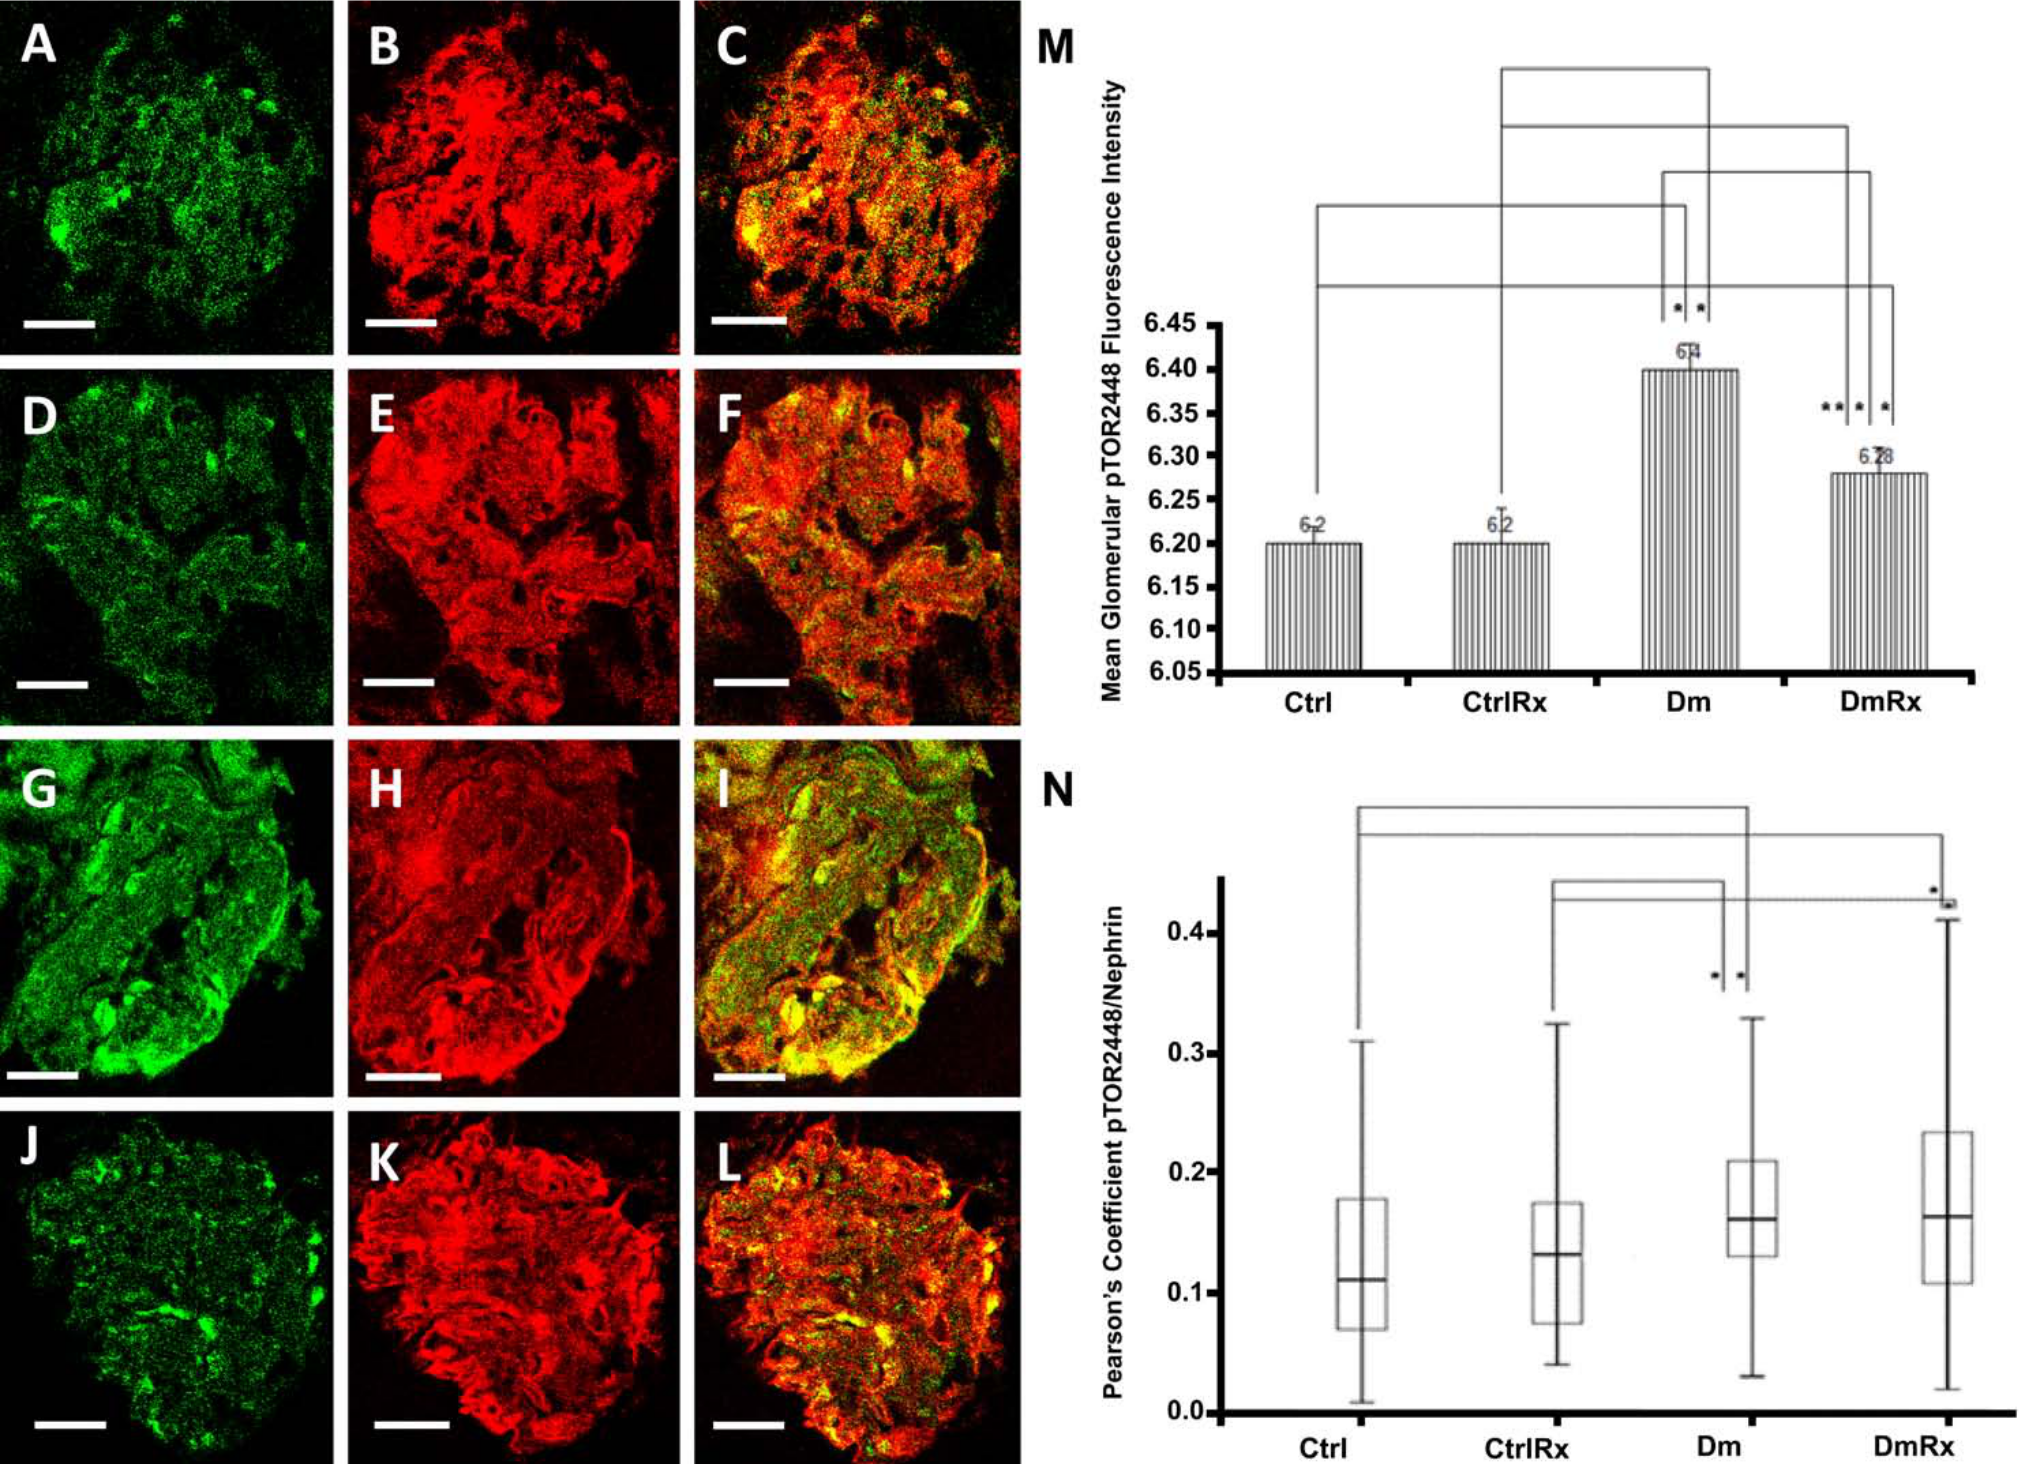
(A–L) Glomerular pTOR2448 (in green) and nephrin (in red) co-localization (in yellow). Ctrl (A, B, C), CtrlRx (D, E, F), Dm (G, H, I), and DmRx (J, K, L) groups. Mean glomerular pTOR2448 fluorescence intensity (M). pTOR2448/nephrin Pearson’s coefficient, representing podocytic pTOR2448 in groups under study (N). Ctrl, control rats; CtrlRx, control losartan-treated rats; Dm, diabetic rats; DmRx, diabetic losartan-treated rats. Mean pTOR2448 fluorescence intensity graph bars represent mean after logarithmic transformation + standard error (*p<0.001, **p=0.01). Pearson’s coefficient represents median (*p<0.001). Scale bars, 30 µm.
Estimation of mTOR Protein Content within Podocytes
Nephrin was used as a podocytic marker. Western blot (WB) experiments did not show any differences in nephrin protein levels among the study groups (Fig. 3). Podocytes of DmRx rats had more mTOR protein content than all other study groups (61.4%, 53%, and 21% increase compared with CtrlRx, Dm, and Ctrl rats, respectively, p<0.05; Fig. 1). Furthermore, CtrlRx rats had lower mTOR protein levels in their podocytes than Ctrl rats (36% decrease, p<0.05; Fig. 1). Diabetes was associated with decreased levels of mTOR in podocytes (28% decrease in Dm rats vs. Ctrl rats, p<0.05; Fig. 1). Losartan caused a decrease in podocytic mTOR levels in the control group, whereas it increased podocytic mTOR in the diabetic group. Therefore, losartan displays differential effects in the podocytic mTOR content between healthy and diabetic rats.
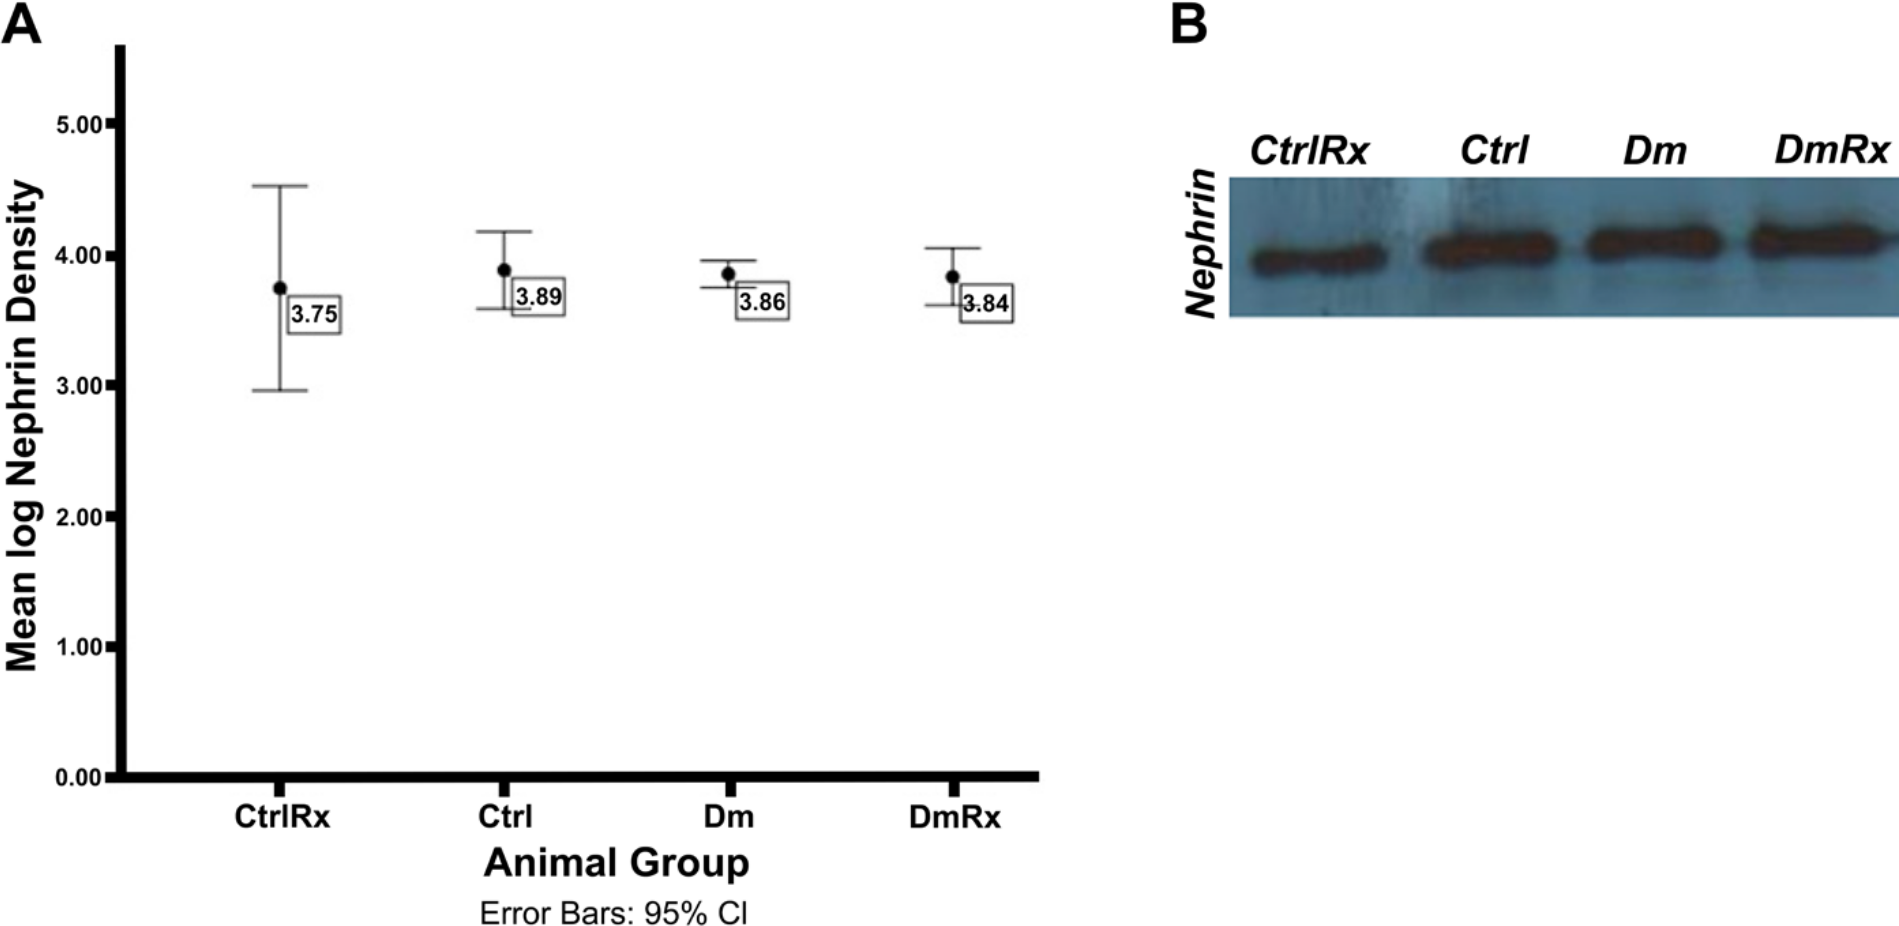
Immunoblotting of glomerular nephrin status in groups under study: graph (A) and blot (B). Ctrl, control rats; CtrlRx, control losartan-treated rats; Dm, diabetic rats; DmRx, diabetic losartan-treated rats. Circles represent mean values (95% confidence interval [CI]; all p=1). No difference is observed among animal groups.
Estimation of mTOR Protein Activation within Podocytes
mTOR activation was examined by measuring pTOR2448 in podocytes (Fig. 2).
Although the absolute podocytic pTOR2448 levels were similar in Ctrl and CtrlRx groups, the lower levels of mTOR in the CtrlRx group (Fig. 1) indicate a relative increase in Ser2448 phosphorylation in CtrlRx rats. As to the effect of losartan on diabetic rats, the observed effect was reversed: although there was no difference in podocytic pTOR2448 between Dm and DmRx groups (Fig. 2), the increased mTOR podocytic content in DmRx rats (Fig. 1) indicates a relative decrease in Ser2448 phosphorylation by losartan in DmRx podocytes.
Because podocytic mTOR content was lower in Dm versus Ctrl groups while the respective pTOR2448 content was higher (44.5% increase in Dm vs. Ctrl rats, p<0.05; Fig. 2), it is inferred that diabetes resulted in increased podocytic pTOR2448 levels (effective mTOR concentration).
Mean tAKT Protein Content and Activation
We considered tAKT to be activated when phosphorylated at Ser473 (pAKT473) and at Thr308 (pAKT308).
Glomerular tAKT Protein Content
In the glomerulus, tAKT levels were increased in diabetic animals receiving losartan (9.6% increase compared with Dm rats, p<0.05; Figs. 4, 5), whereas they were decreased in healthy animals receiving losartan (25.8% decrease in CtrlRx vs. Ctrl rats, p<0.05; Figs. 4, 5). Dm rats showed an increase in glomerular tAKT compared with Ctrl rats that was statistically significant only by WB and not by immunofluorescence (IF).
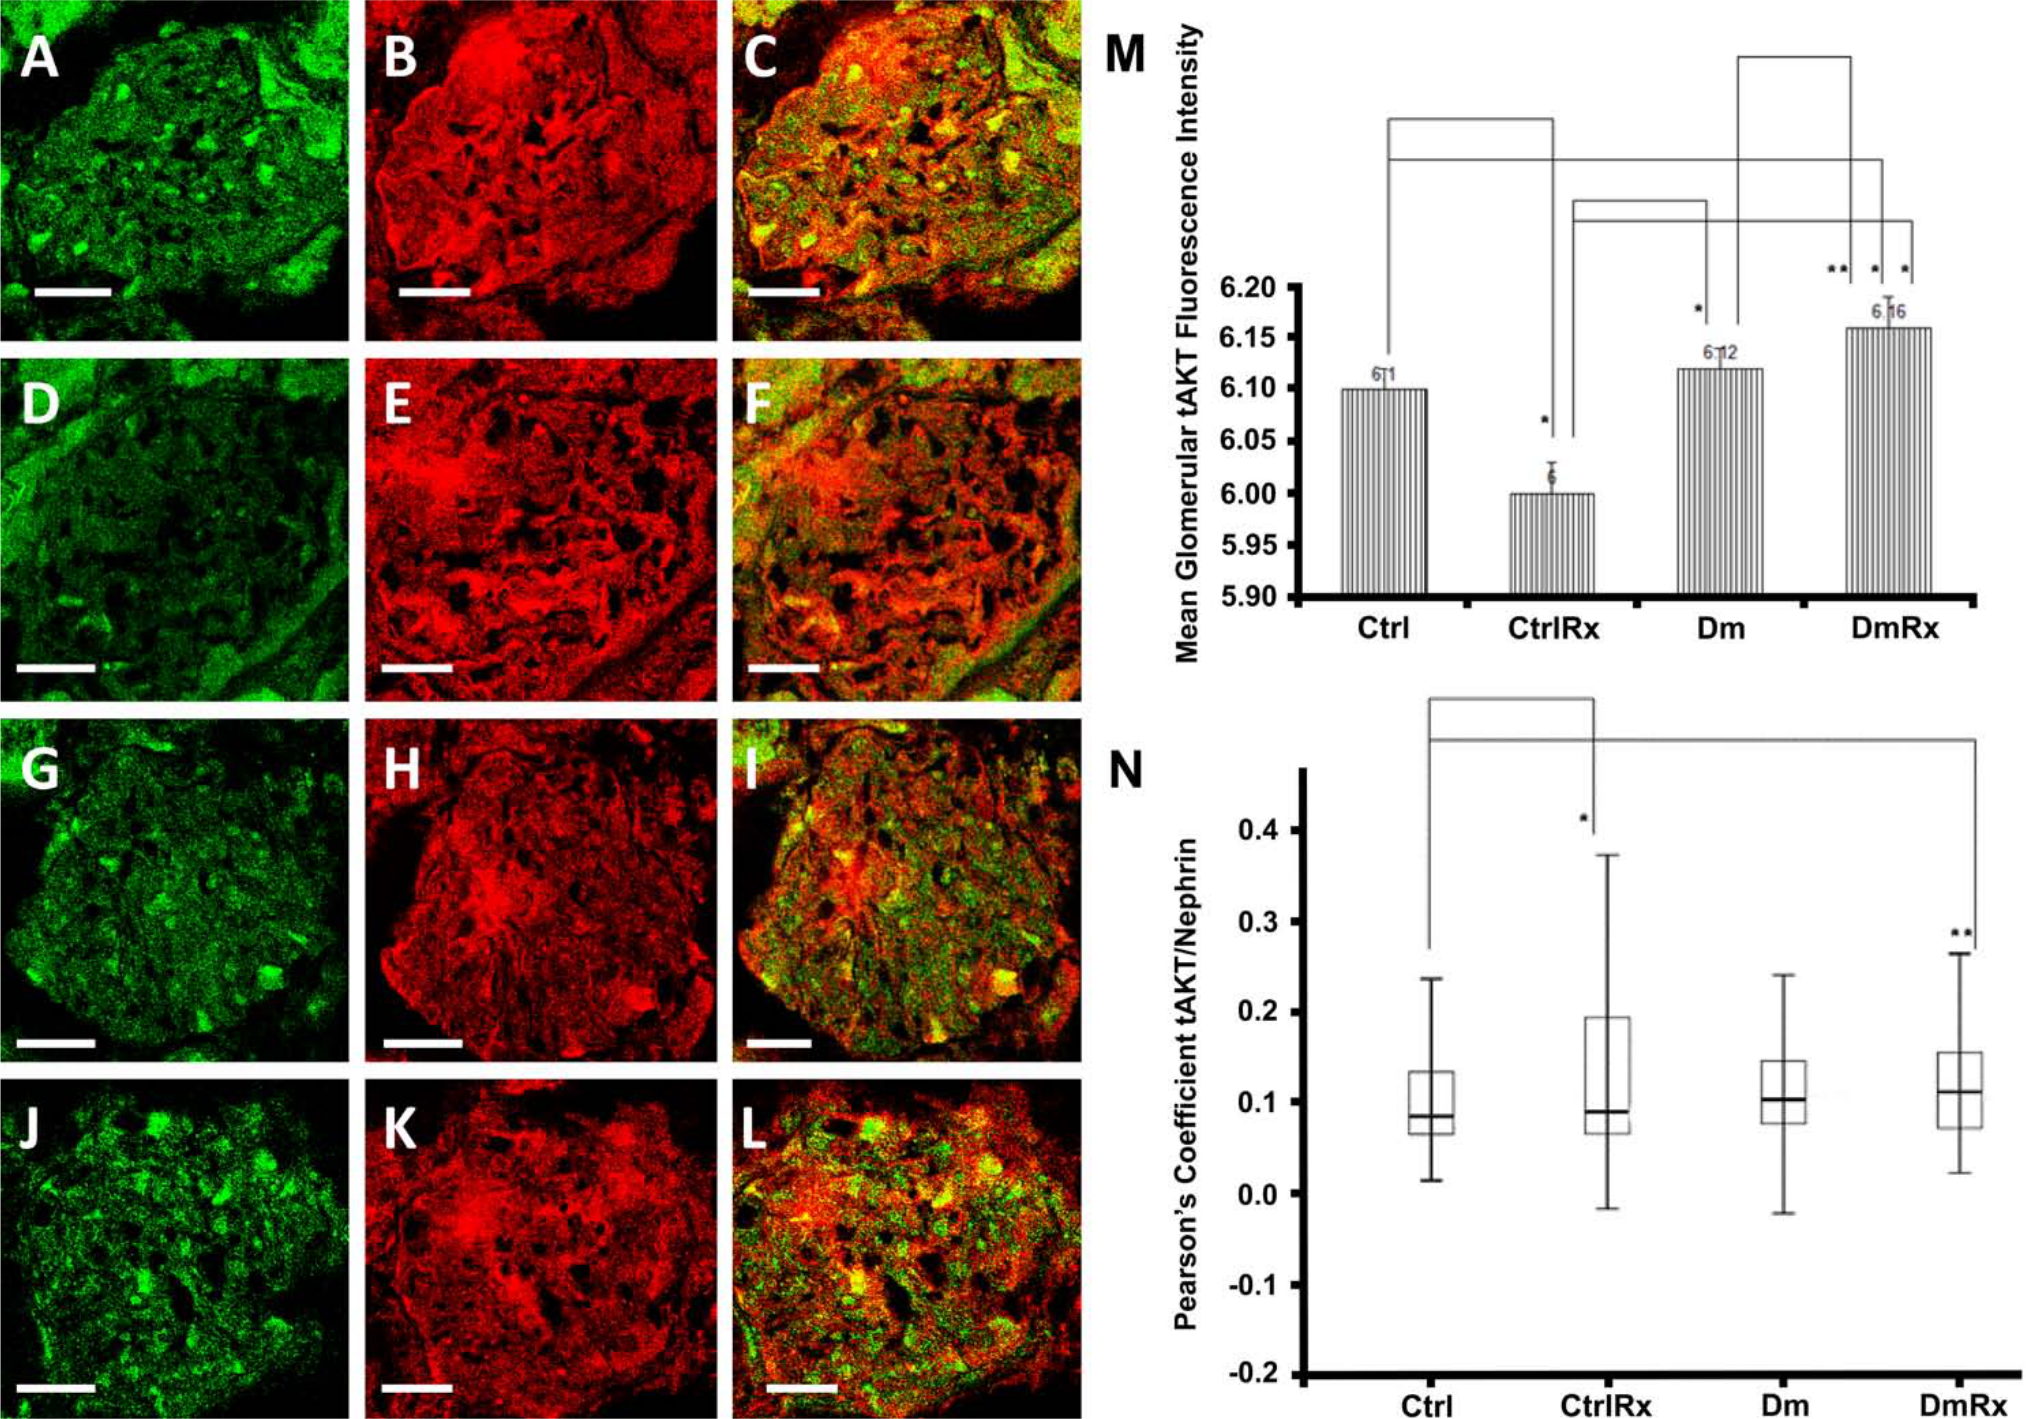
(A–L) Glomerular tAKT (in green) and nephrin (in red) co-localization (in yellow). Ctrl (A, B, C), CtrlRx (D, E, F), Dm (G, H, I), and DmRx (J, K, L). Mean glomerular tAKT fluorescence intensity (M). tAKT/nephrin Pearson’s coefficient, representing podocytic tAKT in groups under study (N). Ctrl, control rats; CtrlRx, control losartan-treated rats; Dm, diabetic rats; DmRx, diabetic losartan-treated rats. Mean tAKT fluorescence intensity graph bars represent mean after logarithmic transformation + standard error (*p<0.001, **p=0.044). Pearson’s coefficient represents median (*p=0.017, **p=0.014). Scale bars, 30 µm.
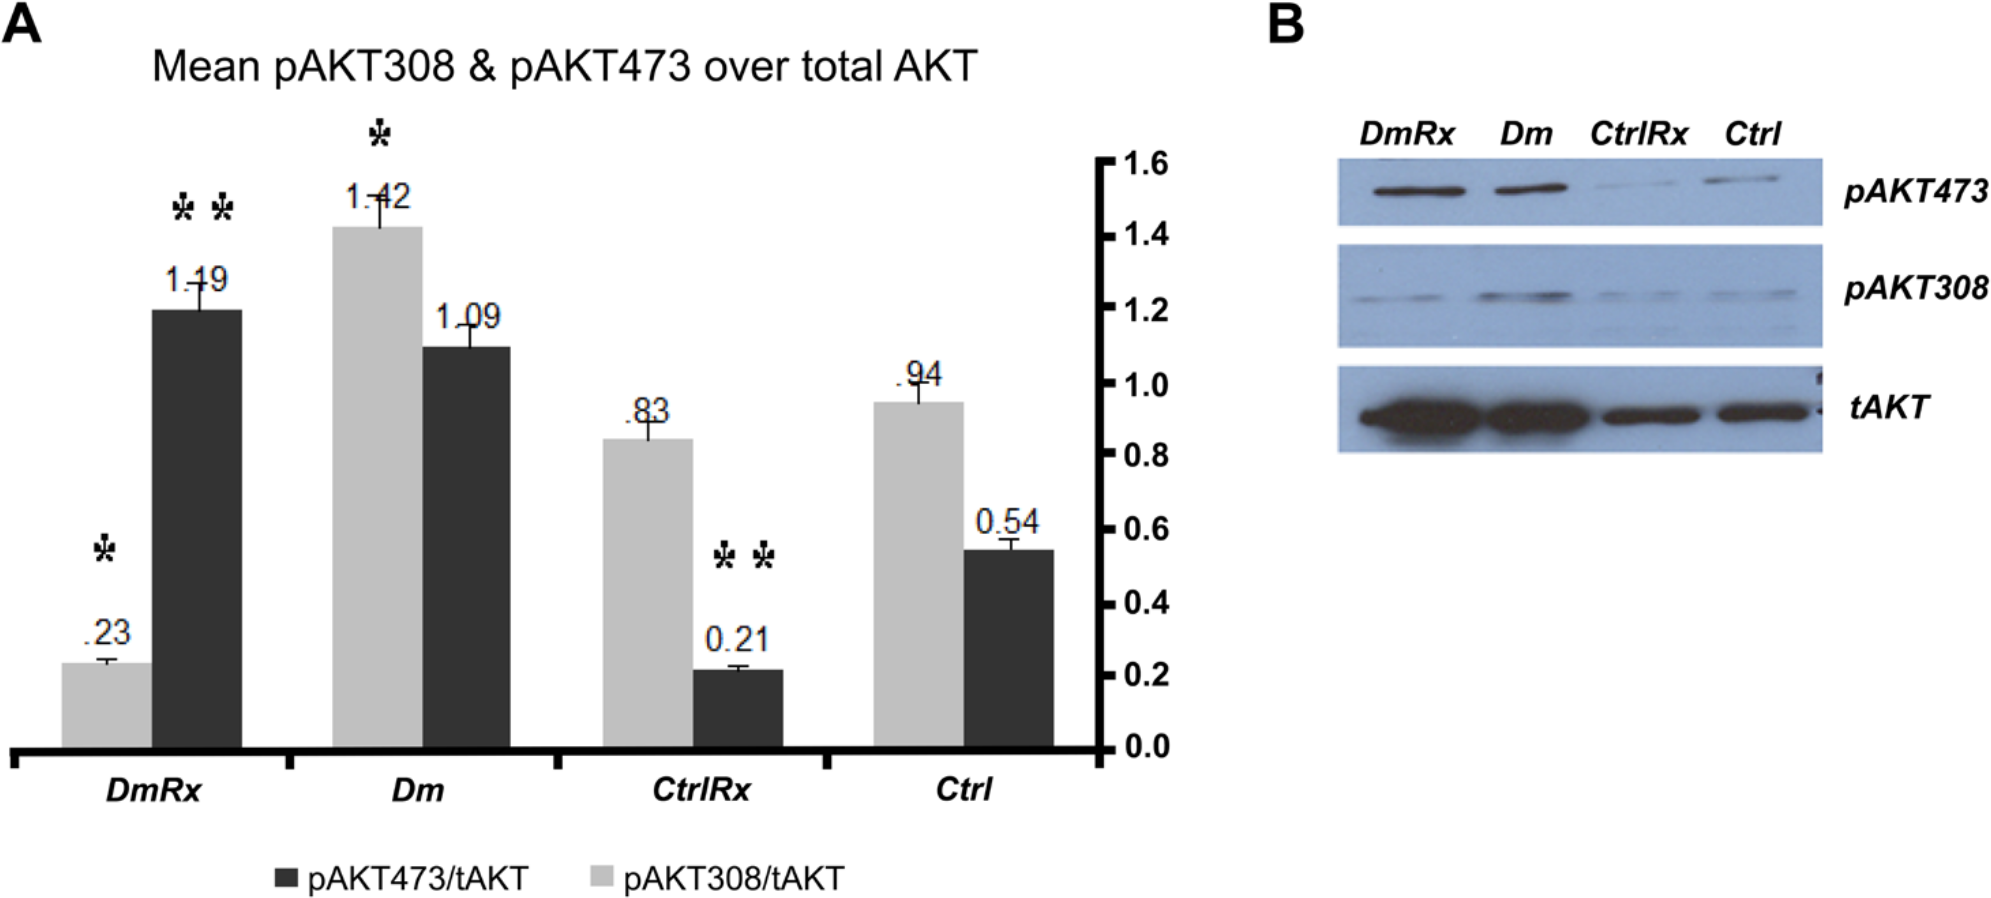
Immunoblotting of glomerular tAKT, pAKT473, and pAKT308 phosphorylation status in groups under study: graph (A) and blot (B). Ctrl, control rats; CtrlRx, control losartan-treated rats; Dm, diabetic rats; DmRx, diabetic losartan-treated rats. Bars represent mean values + standard error (**pAKT473/tAKT: Ctrl vs. CtrlRx vs. DmRx [p<0.05], CtrlRx vs. Dm vs. DmRx [p<0.05]; *pAKT308/tAKT: Ctrl vs. Dm vs. DmRx [p<0.05], CtrlRx vs. Dm vs. DmRx [p<0.05], Dm vs. DmRx [p<0.05]).
Podocytic tAKT Content
Losartan caused a minimal increase (5.8%) in podocytic tAKT levels in the CtrlRx rats when compared with Ctrl rats (p<0.05; Fig. 4). There was not any significant effect of losartan on podocytic tAKT in diabetic rats. Diabetes per se caused an increase in podocytic tAKT levels (taking into consideration a 5.8% and 31.5% increase in tAKT levels when comparing Ctrl with CtrlRx or DmRx, respectively, p<0.05; Fig. 4).
Glomerular AKT Phosphorylation at Ser473
There was a significant difference in pAKT473 in healthy rats versus the healthy treated group (23% decrease in CtrlRx vs. Ctrl rats; Figs. 5, 6), but the same trend also existed in tAKT levels. Therefore, based on IF, we cannot conclude as to the effect of losartan on glomerular pAKT473. Based on WB, losartan reduced glomerular pAKT473 in healthy rats. Diabetes caused a slight increase in pAKT473 compared with Ctrl rats, but the difference was not statistically significant based on both IF and WB. Given the fact that tAKT protein content was lower in Dm rats than in DmRx rats, the same levels of pAKT473 in the glomeruli of Dm and DmRx rats led us to conclude that losartan to some extent withheld phosphorylation of tAKT at Ser473 in diabetic rats (Figs. 5, 6).
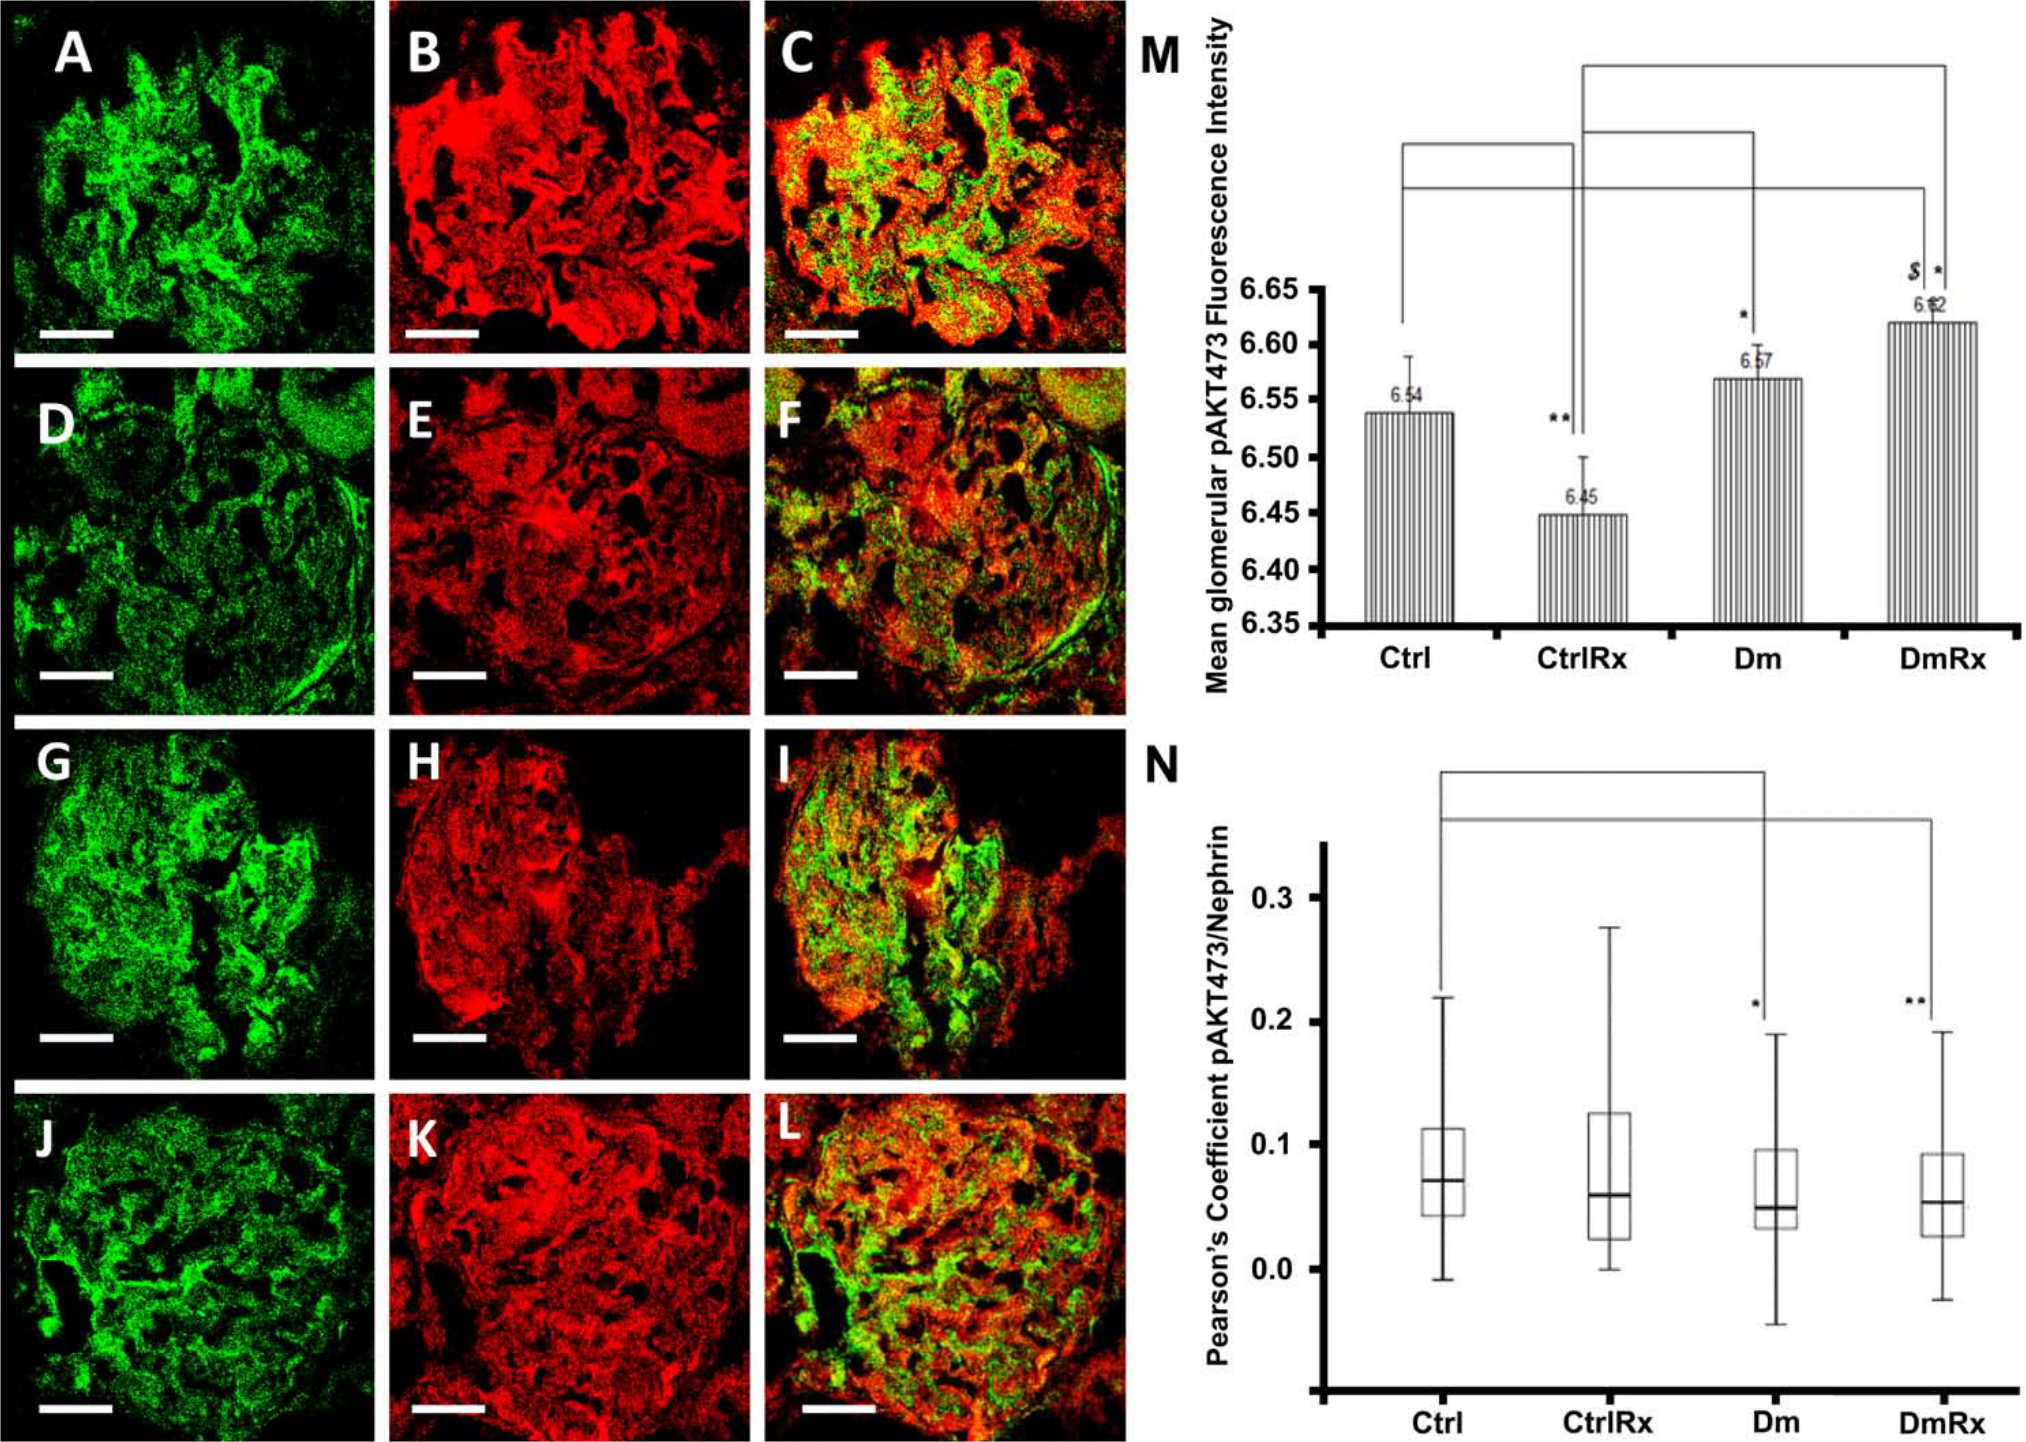
(A–L) Glomerular pAKT473 (in green) and nephrin (in red) co-localization (in yellow). Ctrl (A, B, C), CtrlRx (D, E, F), Dm (G, H, I), and DmRx (J, K, L) groups. Mean glomerular pAKT473 fluorescence intensity (M). pAKT473/nephrin Pearson’s coefficient, representing podocytic pAKT473 in groups under study (N). Ctrl, control rats; CtrlRx, control losartan-treated rats; Dm, diabetic rats; DmRx, diabetic losartan-treated rats. Mean pAKT473 fluorescence intensity graph bars represent mean after logarithmic transformation + standard error (*p<0.001, **p=0.011, $p=0.018). Pearson’s coefficient represents median (*p=0.016, **p=0.013). Scale bars, 30 µm.
Podocytic AKT Phosphorylation at Ser473
Given the fact that Dm rats had the same levels of podocytic tAKT as the Ctrl rats, the observed decrease in podocytic pAKT473 (44% in Dm vs. Ctrl rats, p<0.05; Figs. 4, 6) indicates suppressed Ser473 phosphorylation within podocytes of diabetic rats. Podocytic pAKT473 levels were unchanged in diabetic animals on losartan. Regarding the healthy rats, although the levels of pAKT473 in the Ctrl group were similar to that in the CtrlRx group, because of the higher quantity of tAKT in CtrlRx, losartan diminished pAKT473 in podocytes of healthy rats.
Glomerular AKT Phosphorylation at Thr308
Diabetes clearly increased phosphorylation of AKT at Thr308 as determined by IF and WB. This effect was negated by losartan (Figs. 5, 7).
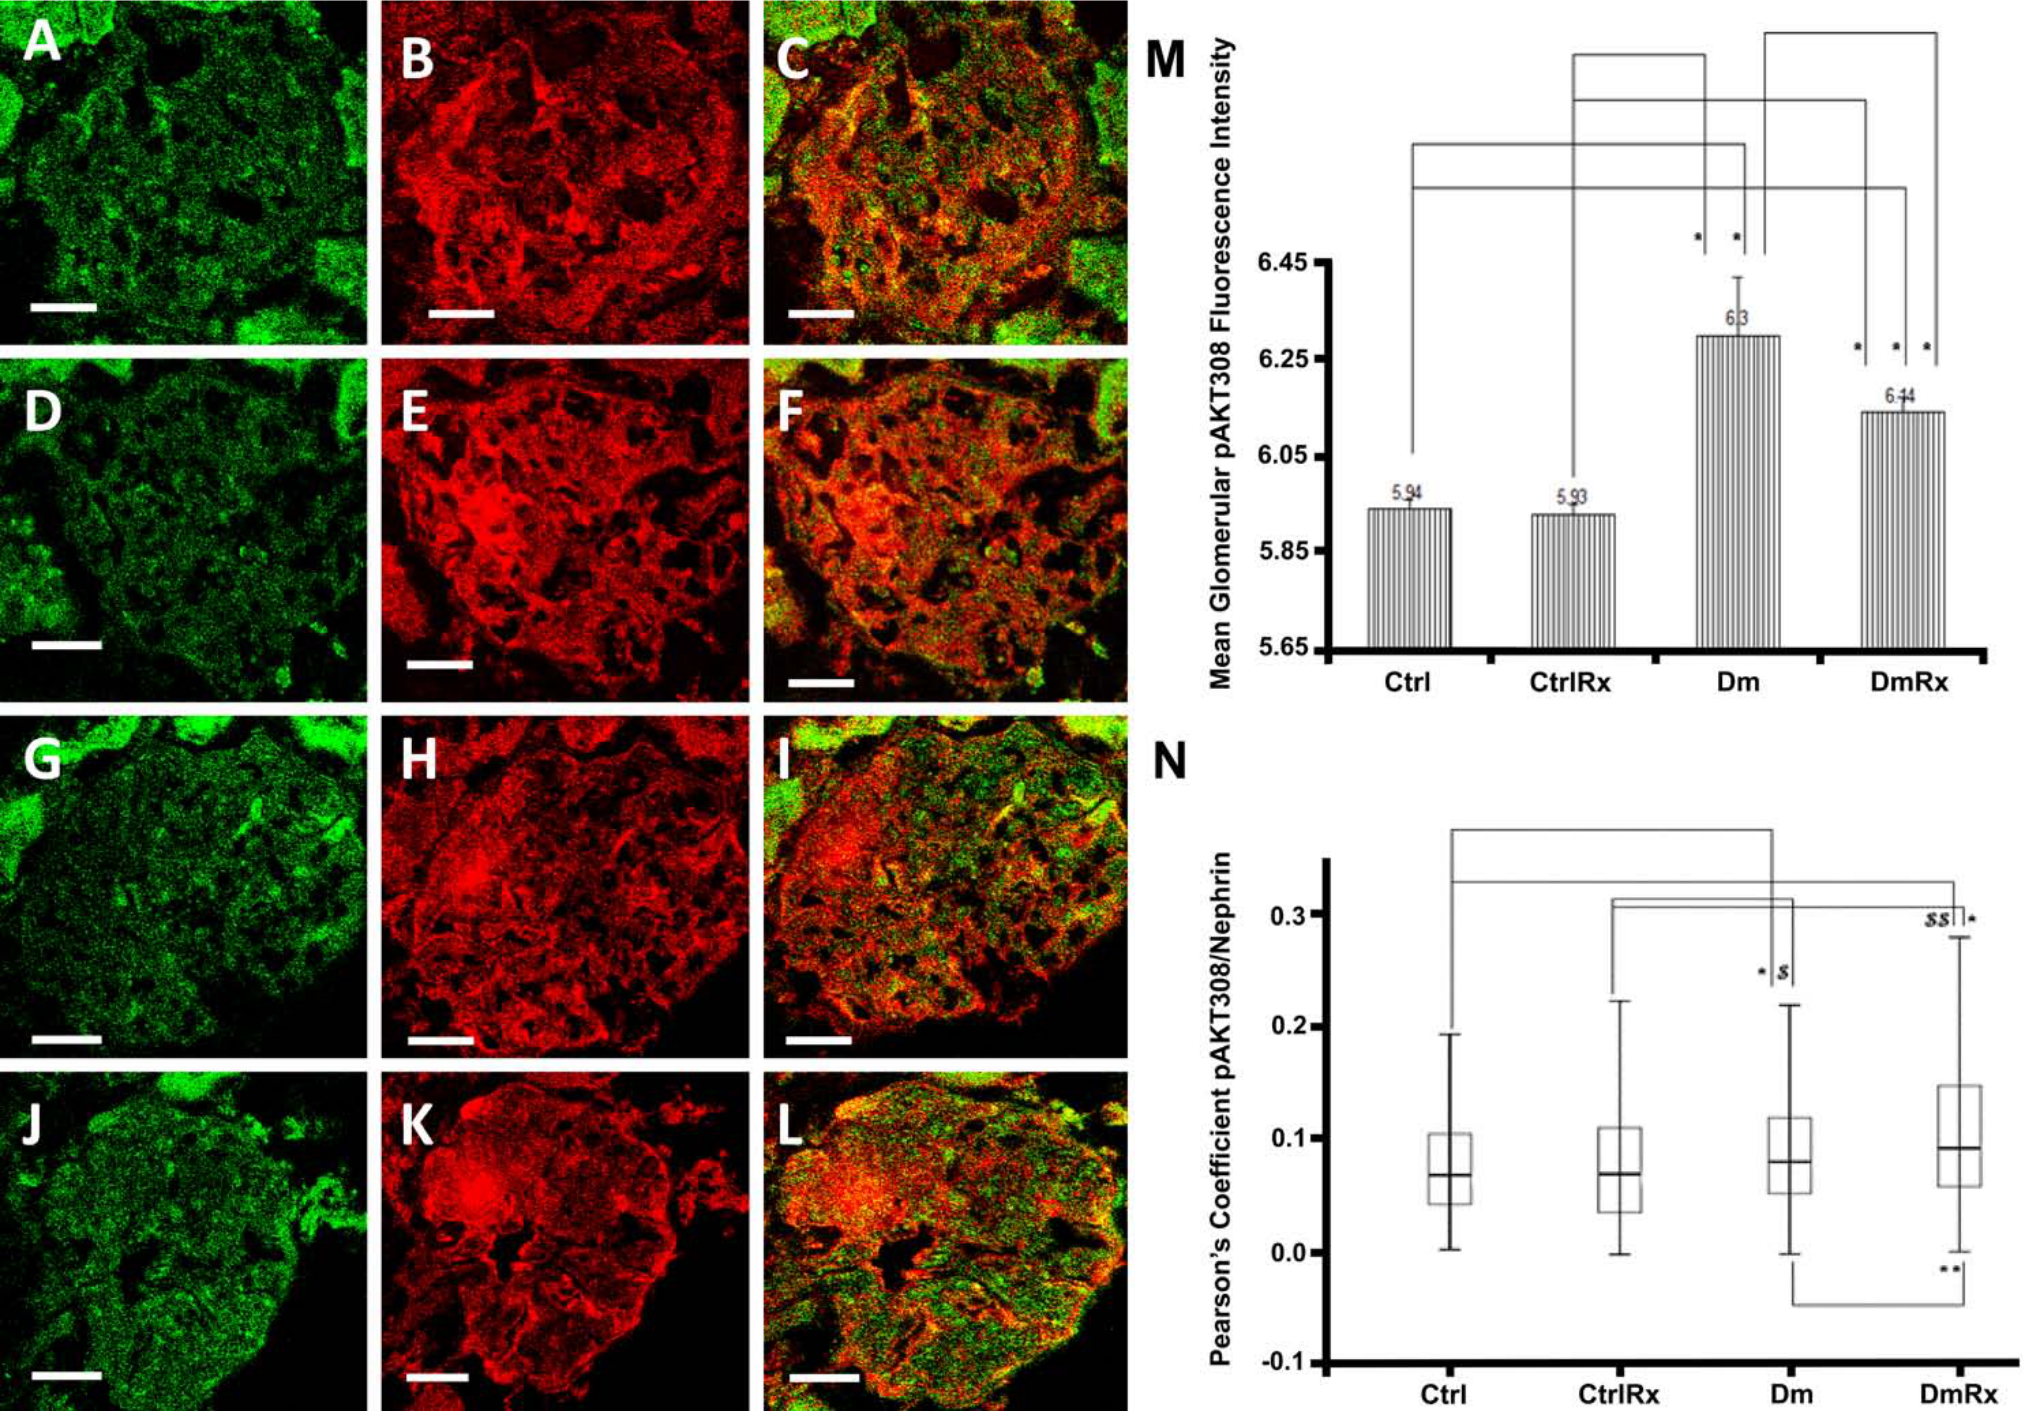
(A–L) Glomerular pAKT308 (in green) and nephrin (in red) co-localization (in yellow). Ctrl (A, B, C), CtrlRx (D, E, F), Dm (G, H, I), and DmRx (J, K, L) groups. Mean glomerular pAKT308 fluorescence intensity (M). pAKT308/nephrin Pearson’s coefficient, representing podocytic pAKT308 in groups under study (N). Ctrl, control rats; CtrlRx, control losartan-treated rats; Dm, diabetic rats; DmRx, diabetic losartan-treated rats. Mean pAKT308 fluorescence intensity graph bars represent mean after logarithmic transformation + standard error (*p<0.001). Pearson’s coefficient represents median (*p<0.001, **p=0.007, $p=0.016, $$p=0.001). Scale bars, 30 µm.
Podocytic AKT Phosphorylation at Thr308
Despite the absence of change in pAKT308 in the Ctrl and CtrlRx groups, because of the higher level of tAKT in CtrlRx, losartan caused a decrease in pAKT308. In diabetic animals, losartan caused a slight increase in podocytic pAKT308 because the levels of pAKT308 were higher in DmRx compared with Dm (13.8% increase, p<0.05; Fig. 7), whereas the respective levels of tAKT had no difference (Fig. 4). As a result of higher fluorescence intensity of pAKT308 in the Dm versus Ctrl groups (Fig. 7), although the quantity of podocytic tAKT was the same (Fig. 4), diabetes resulted in increased podocytic pAKT308.
Discussion
Activated angiotensin 1 (AT1) receptors exert their actions through G proteins, leading to recruitment of inositol trisphosphate (IP3) to the cytoplasmic side of the plasma membrane (Dostal et al. 1997). In human cardiomyocytes, angiotensin II binding to its receptor leads to PI3K activation.
Losartan, a selective AT1 receptor antagonist (Kang et al. 1994), decreased AKT phosphorylation at Thr308 in aortic tissue in a mouse model of streptozotocin-induced diabetes (Nemoto et al. 2011). Furthermore, Wistar rat cardiomyocytes silenced for the AT1 receptor showed decreased phosphorylation of AKT at Ser473 and Thr308 when incubated with T3 thyroid hormone. AT1 receptor signaling also leads to mTOR activation (Diniz et al. 2009), indicating downstream activation of the whole PI3K-AKT-mTOR pathway. In the aforementioned system, losartan exerted similar actions to AT1 receptor gene silencing.
Earlier studies assessed the effect of rapamycin on the AKT-mTOR pathway and renal morphology and function in diabetic nephropathy (Nagai et al. 2005; Yang et al. 2007; Mori et al. 2009). Evidence is lacking as to the effect of losartan on the AKT-mTOR pathway in the kidney.
AKT is also phosphorylated at Ser473 by mTORC2, which further activates AKT. mTORC2 is positively regulated by the TSC1/TSC2 complex. It is known that mTORC2 receives input from growth factors. However, there are sites phosphorylated by mTORC2 that are not regulated by growth factors (Huang and Manning 2009).
Although AKT becomes fully activated by both phosphorylations, the one at Ser473 is not necessary for mTORC1 activation (Lieberthal and Levine 2009). Furthermore, there is a body of evidence to suggest that AKT phosphorylation at Ser473 does not reflect the activation status of mTORC2. In fact, it could be a readout of PI3K activity (Huang and Manning 2009). AMPK senses signals for glucose depletion and subsequently suppresses mTORC1. In diabetic nephropathy, mTORC1 activity is increased through AMPK, and its downstream signaling pathways contribute to characteristic histopathological changes (Lieberthal and Levine 2009).
Our results indicate that diabetes increased glomerular pAKT308, mTOR, and pTOR2448 protein content (Fig. 8). These findings are in accordance with those from previous studies. It has been demonstrated that mTOR and its downstream effectors are highly activated in experimental diabetic nephropathy (Mori et al. 2009). Furthermore, studies show that AKT and mTOR are activated in diabetic animals, causing renal structural damage (Lloberas et al. 2006; Yang et al. 2007). The above-mentioned findings were highlighted by the use of rapamycin, a specific mTOR inhibitor that abrogated the detrimental effects of mTOR signaling.
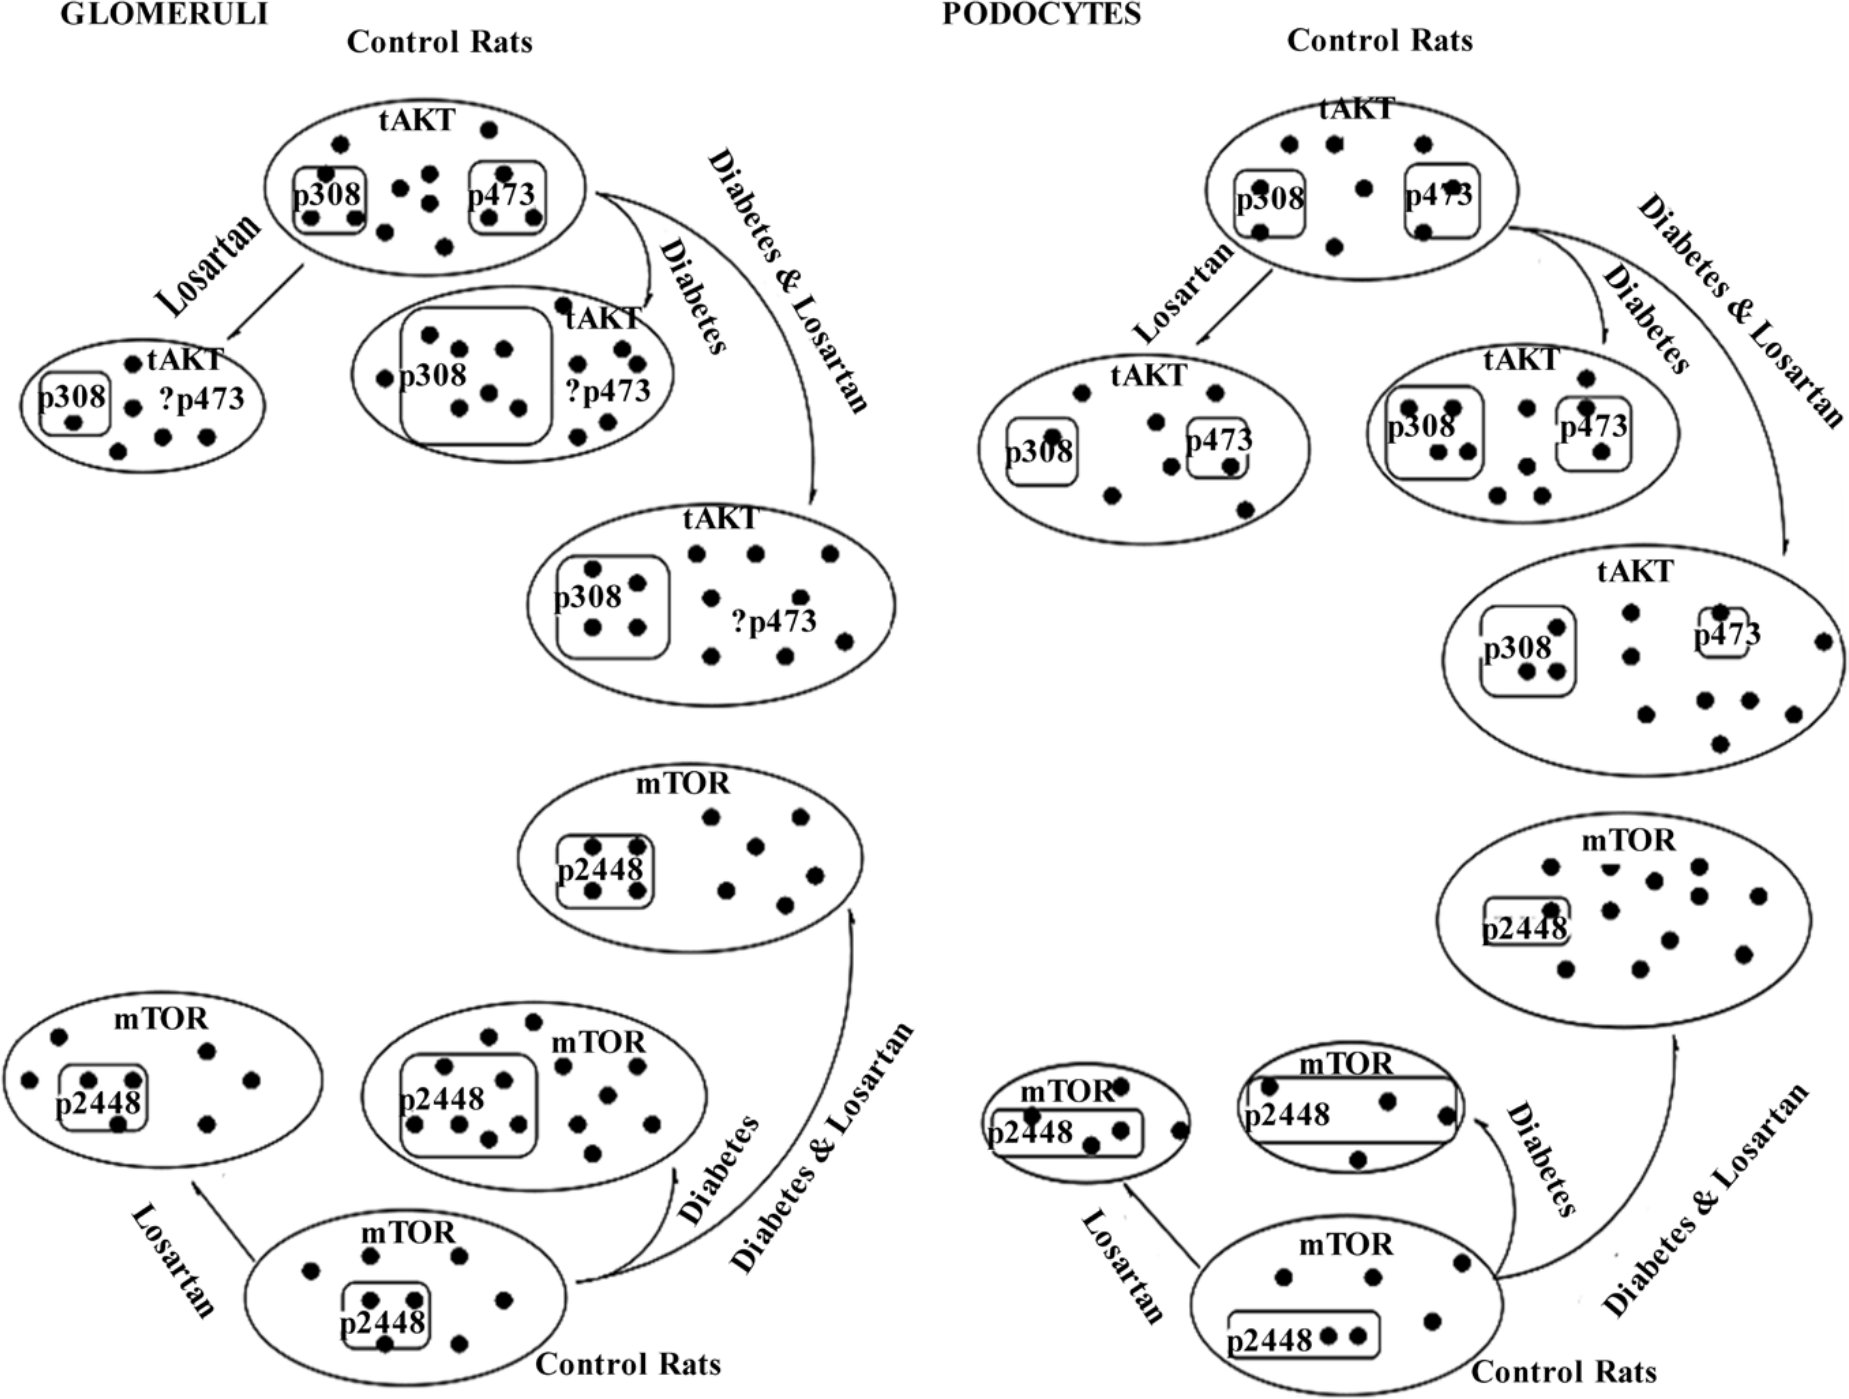
Overall comparison of changes caused by losartan at the glomerular level (left panel) and at the podocytic level (right panel). Area of ellipse represents total protein levels (tAKT, mTOR) in variable states (losartan, diabetes, diabetes and losartan) in glomeruli or podocytes. Area of rectangle(s) within ellipse represents phosphorylated protein levels (pAKT308, pAKT473, pTOR2448) in variable states in the glomeruli or podocytes. Black circles (•) represent protein molecules.
In addition, evidence suggests that AKT is phosphorylated and the downstream signaling molecules of mTOR induced in isolated diabetic rat glomeruli. Immunohistochemically, it was shown that activated AKT was localized in the mesangium (Nagai et al. 2005).
In our experiments, in losartan-treated diabetic animals, glomeruli showed decreased mTOR, pTOR2448, pAKT308, and pAKT473 but increased AKT protein levels. It is evident that losartan in diabetic animals could reverse the effects of signaling events leading to mTOR and AKT activation in non-treated diabetic rats (Fig. 8).
In the present study, we used the podocyte-specific protein nephrin for co-localization studies with molecules under study. Nephrin has an extracellular domain participating in the formation of the slit diaphragm, an intramembrane domain as well as a cytoplasmic domain (Patrakka and Tryggvason 2007). The antibody used for nephrin detection recognizes an epitope localized within the cytoplasmic domain of this protein, which has been shown to interact with PI3K and modulate the PI3K-AKT-mTOR pathway at the level of the slit diaphragm (Zhu et al. 2008). On the other hand, nephrin has been shown to be dislocated in sites other than the podocytic foot processes within the cytoplasm in experimental models of diabetic nephropathy. Furthermore, experimental data concerning nephrin protein levels in diabetic nephropathy are conflicting (Inoki et al. 2011). In the present model, we found no difference in total protein levels among the study groups.
In podocytes, we observed that diabetes caused an increase in total AKT, pAKT308, and pTOR2448 protein levels, indicating activation of the pathway despite a decrease in mTOR and pAKT473 levels. Although losartan administration in diabetic animals increased podocytic mTOR, it actually decreased its activation, as manifested by the decreased Ser2448 phosphorylation of mTOR. Podocytic AKT and pAKT473 protein levels did not change as a result of losartan administration in diabetic rats. Differences observed between protein levels at the glomerular and podocytic compartments might reveal a differential regulation in signal transduction within separate glomerular compartments. Because the glomerulus comprises mainly three types of cells, the above observed differences between the glomerulus and the podocytes could be attributed to different effects of diabetes and/or losartan on these cell populations. In our set of experiments, concordance between WB and IF further validates our data.
Previous studies have shown that mTORC1 activation is a hallmark of diabetic nephropathy in a mouse model of diabetes in which podocyte-specific deletion of raptor was performed (Gödel et al. 2011). mTOR activation within podocytes exerts deleterious effects in streptozotocin-induced diabetes in mice, and specific inhibition of podocytic mTORC1 prevents the progression of diabetic nephropathy (Gödel et al. 2011). Surprisingly, the pTOR2448 protein levels within podocytes of CtrlRx rats were increased when compared with Ctrl rats. In contrast, the relative pTOR2448 protein levels in DmRx rats were lower compared with that in Dm rats. These observed differences indicate differential actions of losartan in podocytes in the presence or absence of diabetes. Furthermore, such actions are of lower magnitude in treated control animals than in treated diabetic animals because the podocytic content of proteins under study is lower in non-diabetic rats (Fig. 8). Analogous conclusions could be drawn concerning glomeruli in non-diabetic rats. In addition, there is an increase in mTOR activation in podocytes from CtrlRx rats as compared with that in glomeruli from CtrlRx rats. Once more, evidence suggests the differential regulation of AKT/mTOR signaling among the podocytic and other cellular compartments within the glomerulus in both diabetic and non-diabetic rats.
Thus, as we set out to prove, we clearly noted a differential pattern of in situ activation of the AKT-mTOR pathway in glomeruli and podocytes as a result of diabetes mellitus and losartan.
The PI3K-AKT-mTOR pathway is involved in the pathogenesis of renal injury in diabetes mellitus through cell hypertrophy and matrix production. Losartan influences the protein levels of its components in a beneficial way, suggesting a crosstalk between the renin-angiotensin system and the PI3K-AKT-mTOR pathway.
Footnotes
Declaration of Conflicting Interests
The author(s) declared no potential conflicts of interest with respect to the research, authorship, and/or publication of this article.
Funding
The author(s) received no financial support for the research, authorship, and/or publication of this article.