
Abstract
Stromal collagen alignment has been shown to have clinical significance in a variety of cancers and in other diseases accompanied by fibrosis. While much of the biological and clinical importance of collagen changes has been demonstrated using second harmonic generation (SHG) imaging in experimental settings, implementation into routine clinical pathology practice is currently prohibitive. To translate the assessment of collagen organization into routine pathology workflow, a surrogate visualization method needs to be examined. The objective of the present study was to quantitatively compare collagen metrics generated from SHG microscopy and commonly available picrosirius red stain with standard polarization microscopy (PSR-POL). Each technique was quantitatively compared with established image segmentation and fiber tracking algorithms using human pancreatic cancer as a model, which is characterized by a pronounced stroma with reorganized collagen fibers. Importantly, PSR-POL produced similar quantitative trends for most collagen metrics in benign and cancerous tissues as measured by SHG. We found it notable that PSR-POL detects higher fiber counts, alignment, length, straightness, and width compared with SHG imaging but still correlates well with SHG results. PSR-POL may provide sufficient and additional information in a conventional clinical pathology laboratory for certain types of collagen quantification.
Keywords
Introduction
Basic research and clinical evaluation of cancer tissue focuses primarily on identification of malignant epithelial cells; however, the importance of the stroma is now appreciated as a key mediator of carcinogenesis.1,2 A major component of the tumor-associated stroma, fibrillar collagen, has been shown to impact cancer cell behavior through biochemical and biophysical cues. Collagen normally provides the underlying structural framework of homeostatic tissues, but alterations in specific properties such as alignment have been observed in cancer and other pathological processes. For example, researchers have identified a unique “tumor-associated collagen signature” (TACS) in breast cancer defined as bundles of straightened, aligned collagen fibers that are oriented perpendicular to the tumor boundary. 3 Mechanistically, it is hypothesized that aligned collagen fibers form pathways that facilitate cancer cell migration away from the tumor and toward vasculature during the metastatic process.3,4 While there is significant research work ongoing on the role of collagen in live, dynamic in vitro and in vivo animal models of a wide array of cancers,5–10 many groups, including ours, are also focused on investigating the potential clinical utility of collagen properties in routinely fixed and processed human tissues. Toward clinical translation, it has already been shown that the detection of TACS in routine histopathological evaluation of breast cancer can serve as an optical biomarker and be predictive of disease recurrence and patient survival. 11 The clinical importance of collagen organization has also been investigated in pancreatic, 12 esophageal, 13 and ovarian cancers. 14 Accordingly, there is great interest by basic and clinical researchers alike in examining and quantifying properties of stromal collagen fibers such as overall alignment as well as individual metrics including length, width, and straightness.
Many alternative methods exist to visualize collagen in the context of routine histopathological sections. For example, established histology dyes (Masson’s trichrome, Movat’s pentachrome, picrosirius red [PSR]),15–18 antibody detection, 19 polarization-based widefield imaging, 20 and second harmonic generation (SHG) imaging21,22 have all been employed. Other imaging methods often associated with collagen imaging either do not offer the appropriate resolution for the assessment of collagen organization, such as optical coherence tomography,23,24 or require non-routine sample preparation methods and offer limited field of view, such as transmission electron microscopy, 25 scanning electron microscopy, 26 and atomic force microscopy. 27 Of the imaging methods that are compatible with histopathological samples, SHG is highly specific to the non-centrosymmetric structure of fibrillar collagen. 28 SHG has become a particular focus for this reason and a variety of others, including high resolution, good signal-to-noise ratio, ability to work nondestructively on stained and unstained tissues, and power to extract additional information such as polarization properties and forward–backward scattering ratios. However, there is concern over the distinction whether SHG can be used for routine collagen visualization and quantification in more routine pathology tissues versus whether it is required. Undoubtedly, SHG has great advantages in terms of imaging depth and higher-order information, but for most of the reported histopathological studies done with standard 5-µm-thick pathology sections, these advantages are not of primary interest.11–13,29 In addition, SHG is not readily accessible in the clinical setting due to high cost, lack of clinical interfaces, and relatively slow acquisition workflows.
To this end, we wanted to determine whether a more accessible technique could provide similar quantitative information about collagen alignment and fiber structure in histopathological samples as to what SHG can provide. Collagen fibers are composed of molecules that are hierarchically ordered in a parallel orientation resulting in inherent birefringent properties and also contain a large proportion of basic amino acid residues. Catering to both of these properties, sirius red is an elongated, acidic dye molecule that efficiently aligns and binds parallel to collagen fibers, thereby enhancing its innate birefringence. Due to its ability to specifically visualize collagen, as well as its ready availability in many research and pathology laboratories, PSR was chosen as a potential candidate. In this study, we systematically imaged collagen in tissue regions from 92 pancreatic cancer patients using PSR with a standard polarization widefield microscope followed by subsequent SHG imaging and then quantified collagen properties from both sets of data using well-established software tools for collagen quantification.29,30 Pancreatic cancer was decided on as a rational cancer model because it remains one of the most deadly human malignancies and has been the subject of recent studies correlating collagen organization to disease progression. 31 In addition, in the context of the tumor microenvironment, an extreme collagen-rich stromal response is a hallmark of pancreatic cancer and can account for up to 90% of the tumor mass. 32 Furthermore, characteristic changes in collagen alignment have been documented, 12 and other stromal cues have been correlated to patient prognosis. 33 Consistent with previous SHG trends, 12 we found that key collagen properties, such as alignment, were computed to be higher in pancreatic cancer tissues compared with normal adjacent tissues using picrosirius red stain with standard polarization microscopy (PSR-POL). Interestingly, all of the collagen measurements that we considered were computed to be significantly higher in the PSR-POL images relative to SHG images. While the exact reasons underlying the differences remain to be determined, our data suggest that PSR-POL can extract similar, if not additional and complementary, information about collagen compared with SHG. Due to a relatively low clinical adaptability barrier, PSR could serve as a viable alternative technique for interrogating and quantifying certain collagen properties in histopathological tissues in conjunction with established fiber tracking algorithms.
Materials and Methods
Patient Tissue Staining With Picrosirius Red
To quantitatively compare collagen in multiple patients, a tissue microarray (TMA) 34 available at the University of Wisconsin Comprehensive Carbone Cancer Center was utilized. This TMA was constructed (IRB No. 2011-0840-CR003) from pancreatic cancer surgical tissues acquired at the University of Wisconsin Hospital and Clinics between 1987 and 2012. All patients underwent curative-intent resection and were not treated in the neoadjuvant setting. Hematoxylin and eosin (H&E) sections were prepared from formalin-fixed paraffin embedded (FFPE) blocks originally used for diagnosis and reviewed by board-certified pathologists to identify different representative tumor regions. Blocks were then punched using a 1-mm-diameter core and inserted into a recipient FFPE block using a Beecher Instruments (Sun Prairie, WI) MTA-1 manual tissue arrayer. 5-μm-thick sections were cut from the TMA blocks on a microtome and adhered to standard glass slides. A PSR solution was formulated by dissolving 0.1-g Fast Green FCF (F7258; Sigma-Aldrich, St. Louis, MO) and 0.1-g Sirius Red F3B (S03695; Pfaltz & Bauer, Waterbury, CT) in 100 ml of saturated picric acid. After deparaffinization and rehydration, the TMA sections were covered with one to two drops of the PSR solution for 60 min at 40C. The slides were then rinsed with acidified water, dehydrated through three changes of 100% ethanol and three changes of xylene, and coverslipped with toluene-based Richard-Allan mounting medium (Thermo Fisher Scientific, Waltham, MA). Representative human breast and prostate cancer tissues were also stained using the same protocol.
Picrosirius Red Microscopy
The PSR-stained tissues were digitalized using an Aperio slide scanner (Leica Biosystems, Vista, CA) to enable easy pathology review for region of interest (ROI) selection. For the pancreatic cancer TMA, two to three ROIs containing cancer cells and associated stroma were annotated on 92 patient tumors. All PSR imaging was performed on a traditional transmission pathology microscope (BX53; Olympus Corp.) using a 20× objective (UPlanFL N NA = 0.50; Olympus Corp.) without polarizers (PSR) and with linear polarizers (PSR-POL). Halogen lamp intensity was kept constant for both image types, and an exposure time that optimized the signal-to-noise ratio was chosen and kept constant within each image type. All images were digitally captured using cellSens acquisition platform (Olympus Corp.). To control for intrinsic tissue birefringence, we also imaged unstained pancreatic tissue without and with polarized light (Supplementary Fig. S1).
Second Harmonic Generation Microscopy
The same ROIs were imaged using a custom-built SHG microscope developed by the Laboratory for Optical and Computational Instrumentation known as CAMM (Compact Automated Multiphoton Microscope). The CAMM was designed to screen histology samples for cancer-associated changes in collagen fiber properties. 29 Tissue landmarks were used to align the field of view and assure the exact same ROIs were imaged as on the PSR-stained sections. SHG signal was generated using 780-nm excitation light from a Ti:sapphire femtosecond laser and detected in the forward direction after spectrally filtering (390/18 BP; Semrock, Inc., Rochester, NY) using a 20× objective (S Fluor NA = 0.75; Nikon Corp.). All images were acquired at 1024 × 1024 resolution using WiscScan software (http://loci.wisc.edu/software/wiscscan) with consistent parameters. Fifteen of the pancreatic cancer ROIs were also imaged using a backward-detection SHG microscope. For this, the SHG signal was generated using 890-nm excitation light and collected with the same objective after filtering (445/20 BP; Semrock, Inc.).
Fiber Segmentation and Measurement
PSR-POL images were converted to 8-bit, cropped, and downsized in the ImageJ-based analysis package Fiji 35 to align with the field of view and pixel resolution of the SHG images. CT-FIRE fiber analysis software 30 (http://loci.wisc.edu/software/ctfire) was then applied to the SHG and PSR-POL images using default settings after thresholding background (20–255 for SHG, 5–255 for PSR-POL). Quantitative information computed by CT-FIRE for each image type included the individual fiber metrics of length, width, and straightness. Collective fiber properties of alignment and total count were also computed for the entire image.
Statistics
For every CT-FIRE metric, a patient value was calculated by averaging the mean values for the two to three ROIs. All data were verified to follow Gaussian sampling using the Shapiro–Wilk normality test. Values obtained using SHG and PSR-POL were compared using a repeated-measures paired t-test and Pearson correlation analysis in GraphPad Prism (GraphPad Software, Inc., La Jolla, CA). A value of p<0.05 (two-tailed) was considered statistically significant.
Results and Discussion
Histological examination of biopsied or resected tissue by surgical pathology remains the current “gold standard” for cancer diagnosis, staging, and patient prognostication. In practice, several large tissue sections are routinely examined, but only the epithelial elements are taken into consideration in determining grade and stage of the tumor, and consequently, only these inform decisions regarding clinical management. Collagen has long been qualitatively appreciated as a mainstay tissue component of tumors, but its features have yet to be incorporated into pathologists’ overall assessment. With the burgeoning evidence for collagen structure and organization as important players in progression of multiple cancer types, there is growing interest by pathologists to integrate quantitative information about collagen and other features of the tumor microenvironment with traditional qualitative observations to provide a more nuanced characterization of the tissue under examination.
To date, basic research of collagen has been greatly accelerated by SHG imaging, a laser scanning microscopy technique that can provide high-resolution, quantifiable images of discrete collagen fibers without the need for exogenous staining. However, the technology currently is poorly suited for pathology workflows due to an array of issues including expense, instrumentation complexity and footprint, technically demanding operation, and clinical acceptance. Furthermore, collagen assessment needs further clinical validation. To adopt assessment of collagen structure and organization to pathological practice, a surrogate technique that provides certain types of collagen quantification information similar to that of SHG imaging and can be used routinely in the pathology laboratory needs to be identified. Although H&E is the most common histological stain used in clinical pathological practice, several complementary dyes are routinely used in surgical pathology labs that are capable of visualizing stromal collagen (Fig. 1). Masson’s trichrome and Movat’s pentachrome are used to visualize connective tissue on the basis of color, but their specificity to collagen is limited. PSR also differentially stains connective tissue with a rich red color, and it can be combined with conventional widefield polarization microscopy to greatly enhance the birefringence of collagen fibers (Supplementary Fig. S1) and specifically visualize them with a green–yellow–orange–red spectrum. 36 PSR has already been exploited to understand collagen changes in cancer and other pathologies associated with fibrosis.16,18,37–39 Consistent with our previous observations, 12 stromal collagen appears more elongated and aligned in the immediate stroma surrounding malignant ducts compared with normal pancreas ducts when examined using PSR-POL (Fig. 2). Highly remodeled collagen was also observed in breast (Supplementary Fig. S2) 11 and prostate (Supplementary Fig. S3) 38 cancers using PSR-POL.
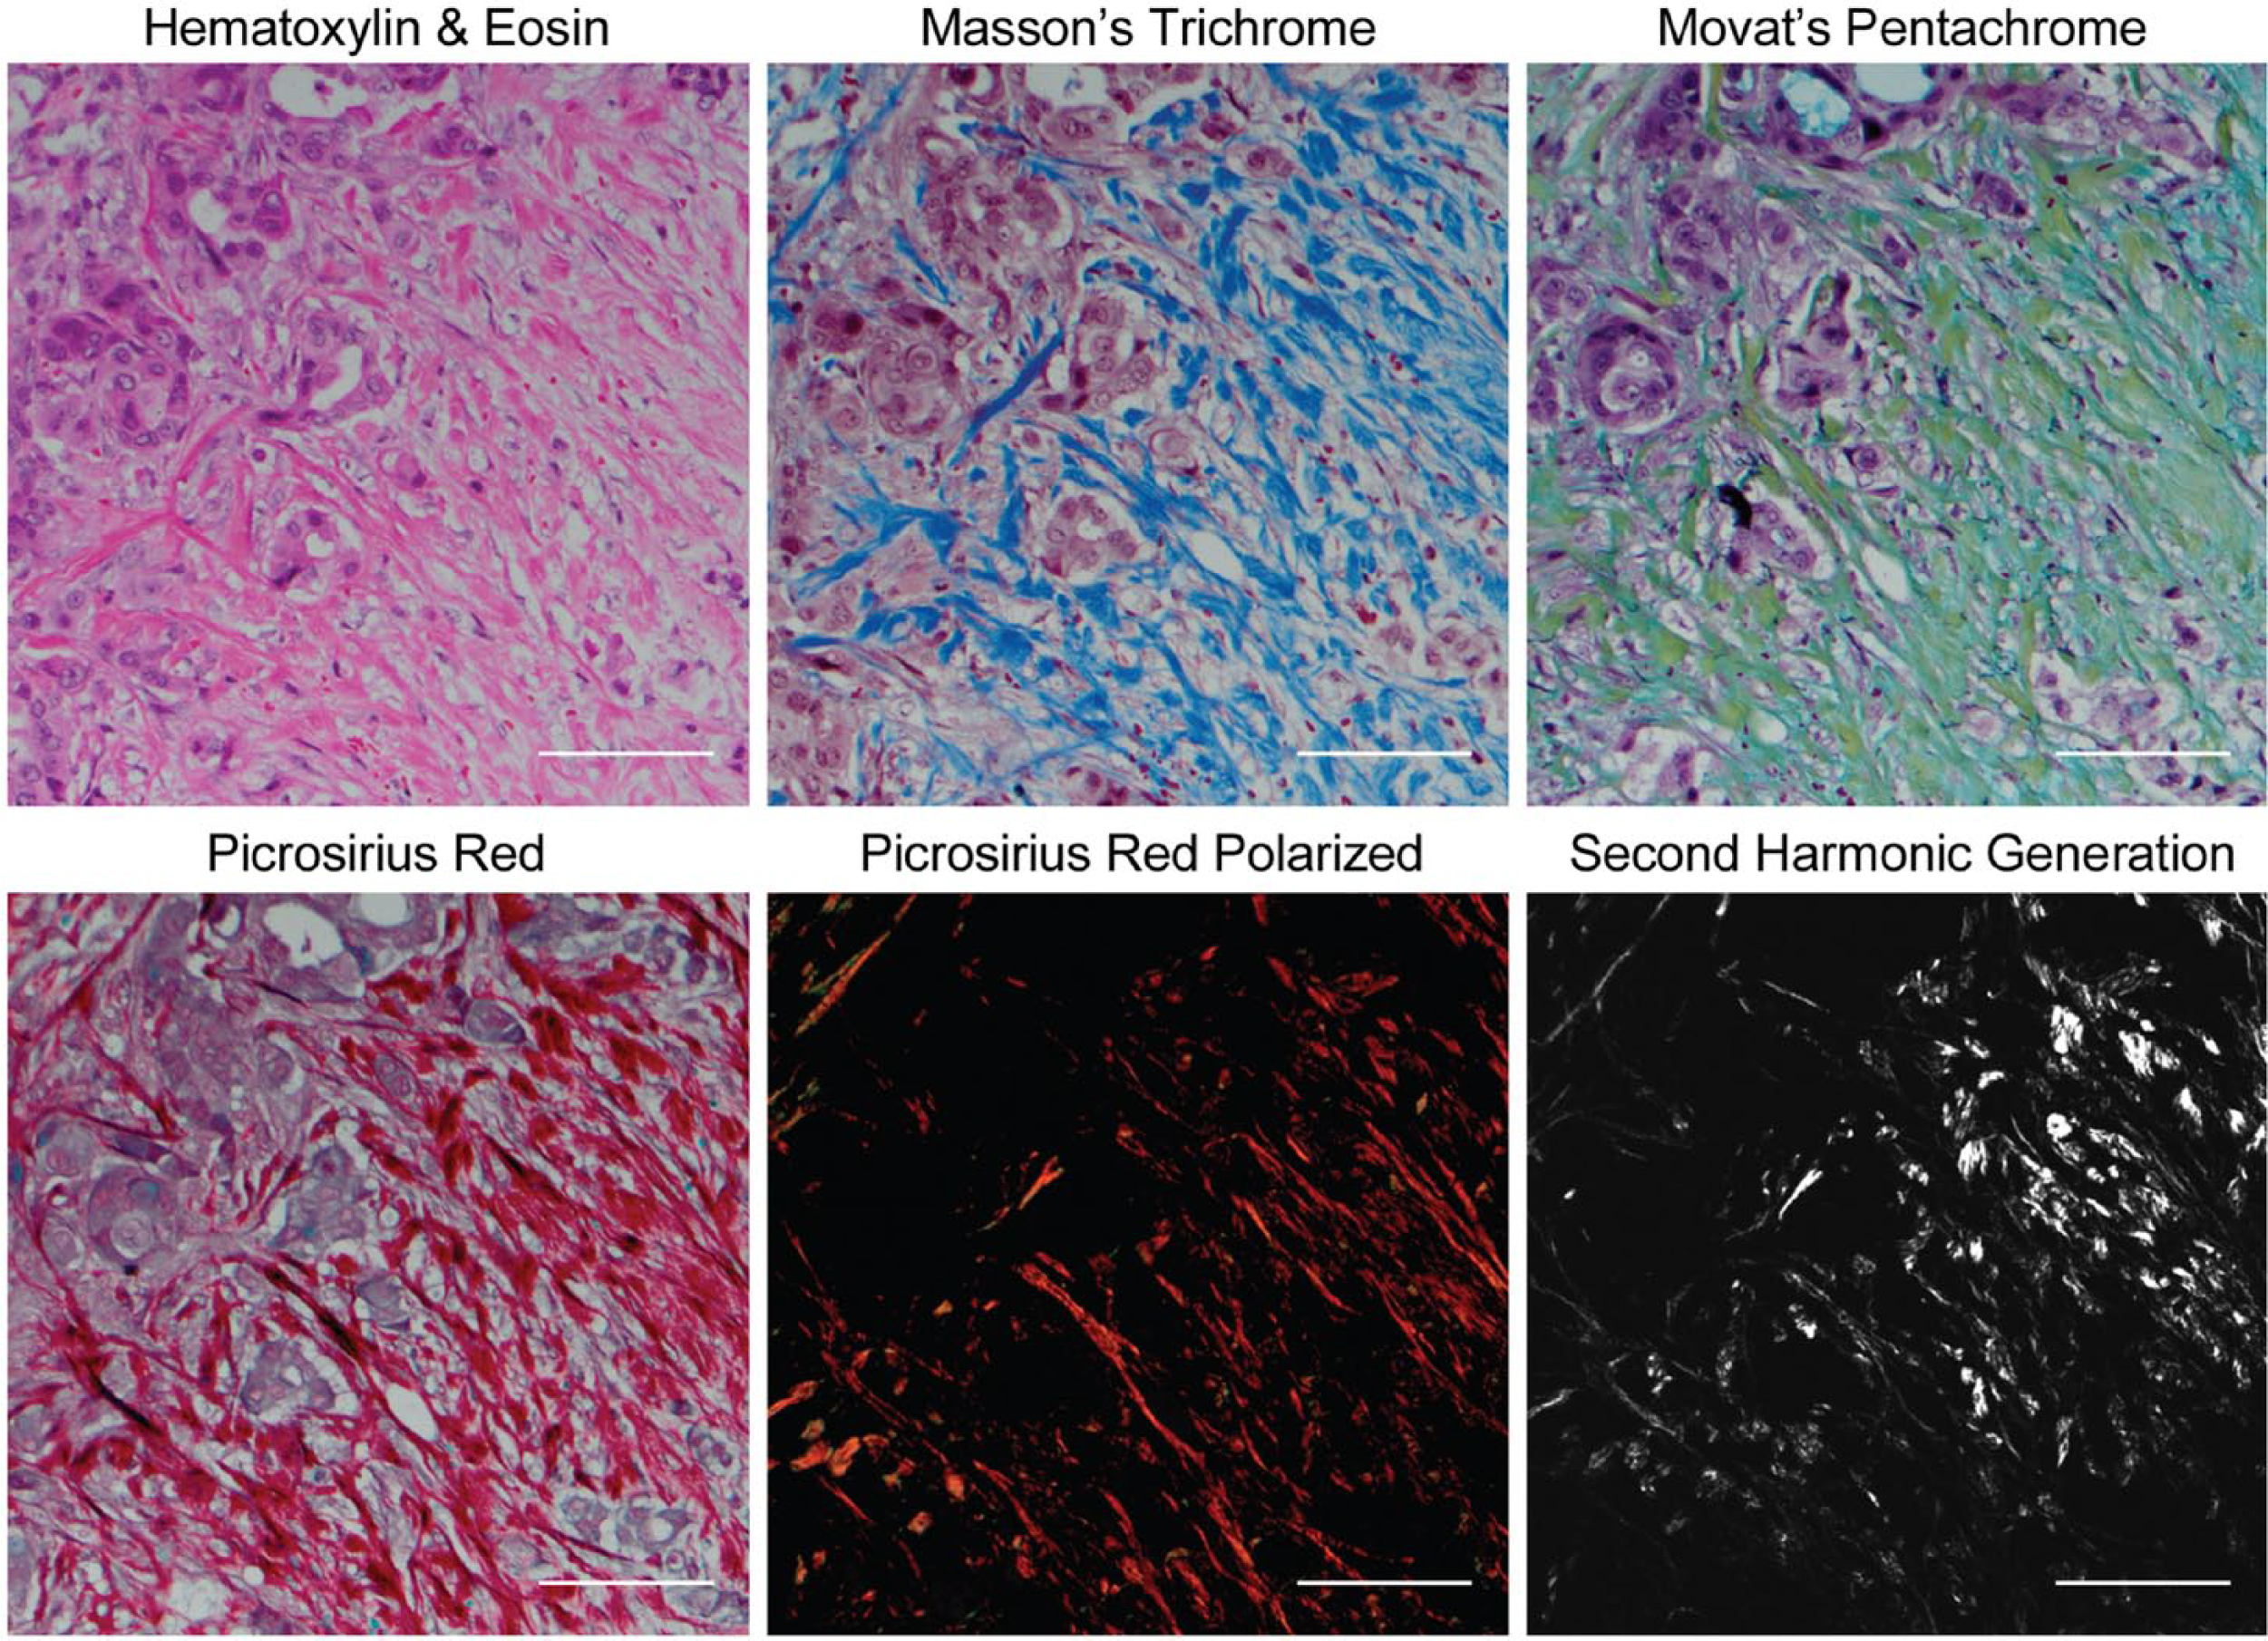
Panel of commonly used histological dyes and microscopy methods to visualize collagen complementary to standard hematoxylin and eosin staining in thin sections. Also shown is second harmonic generation, which remains the experimental “gold standard.” All staining was done on serial sections of pancreatic cancer tissue. Scale bars = 100 µm.
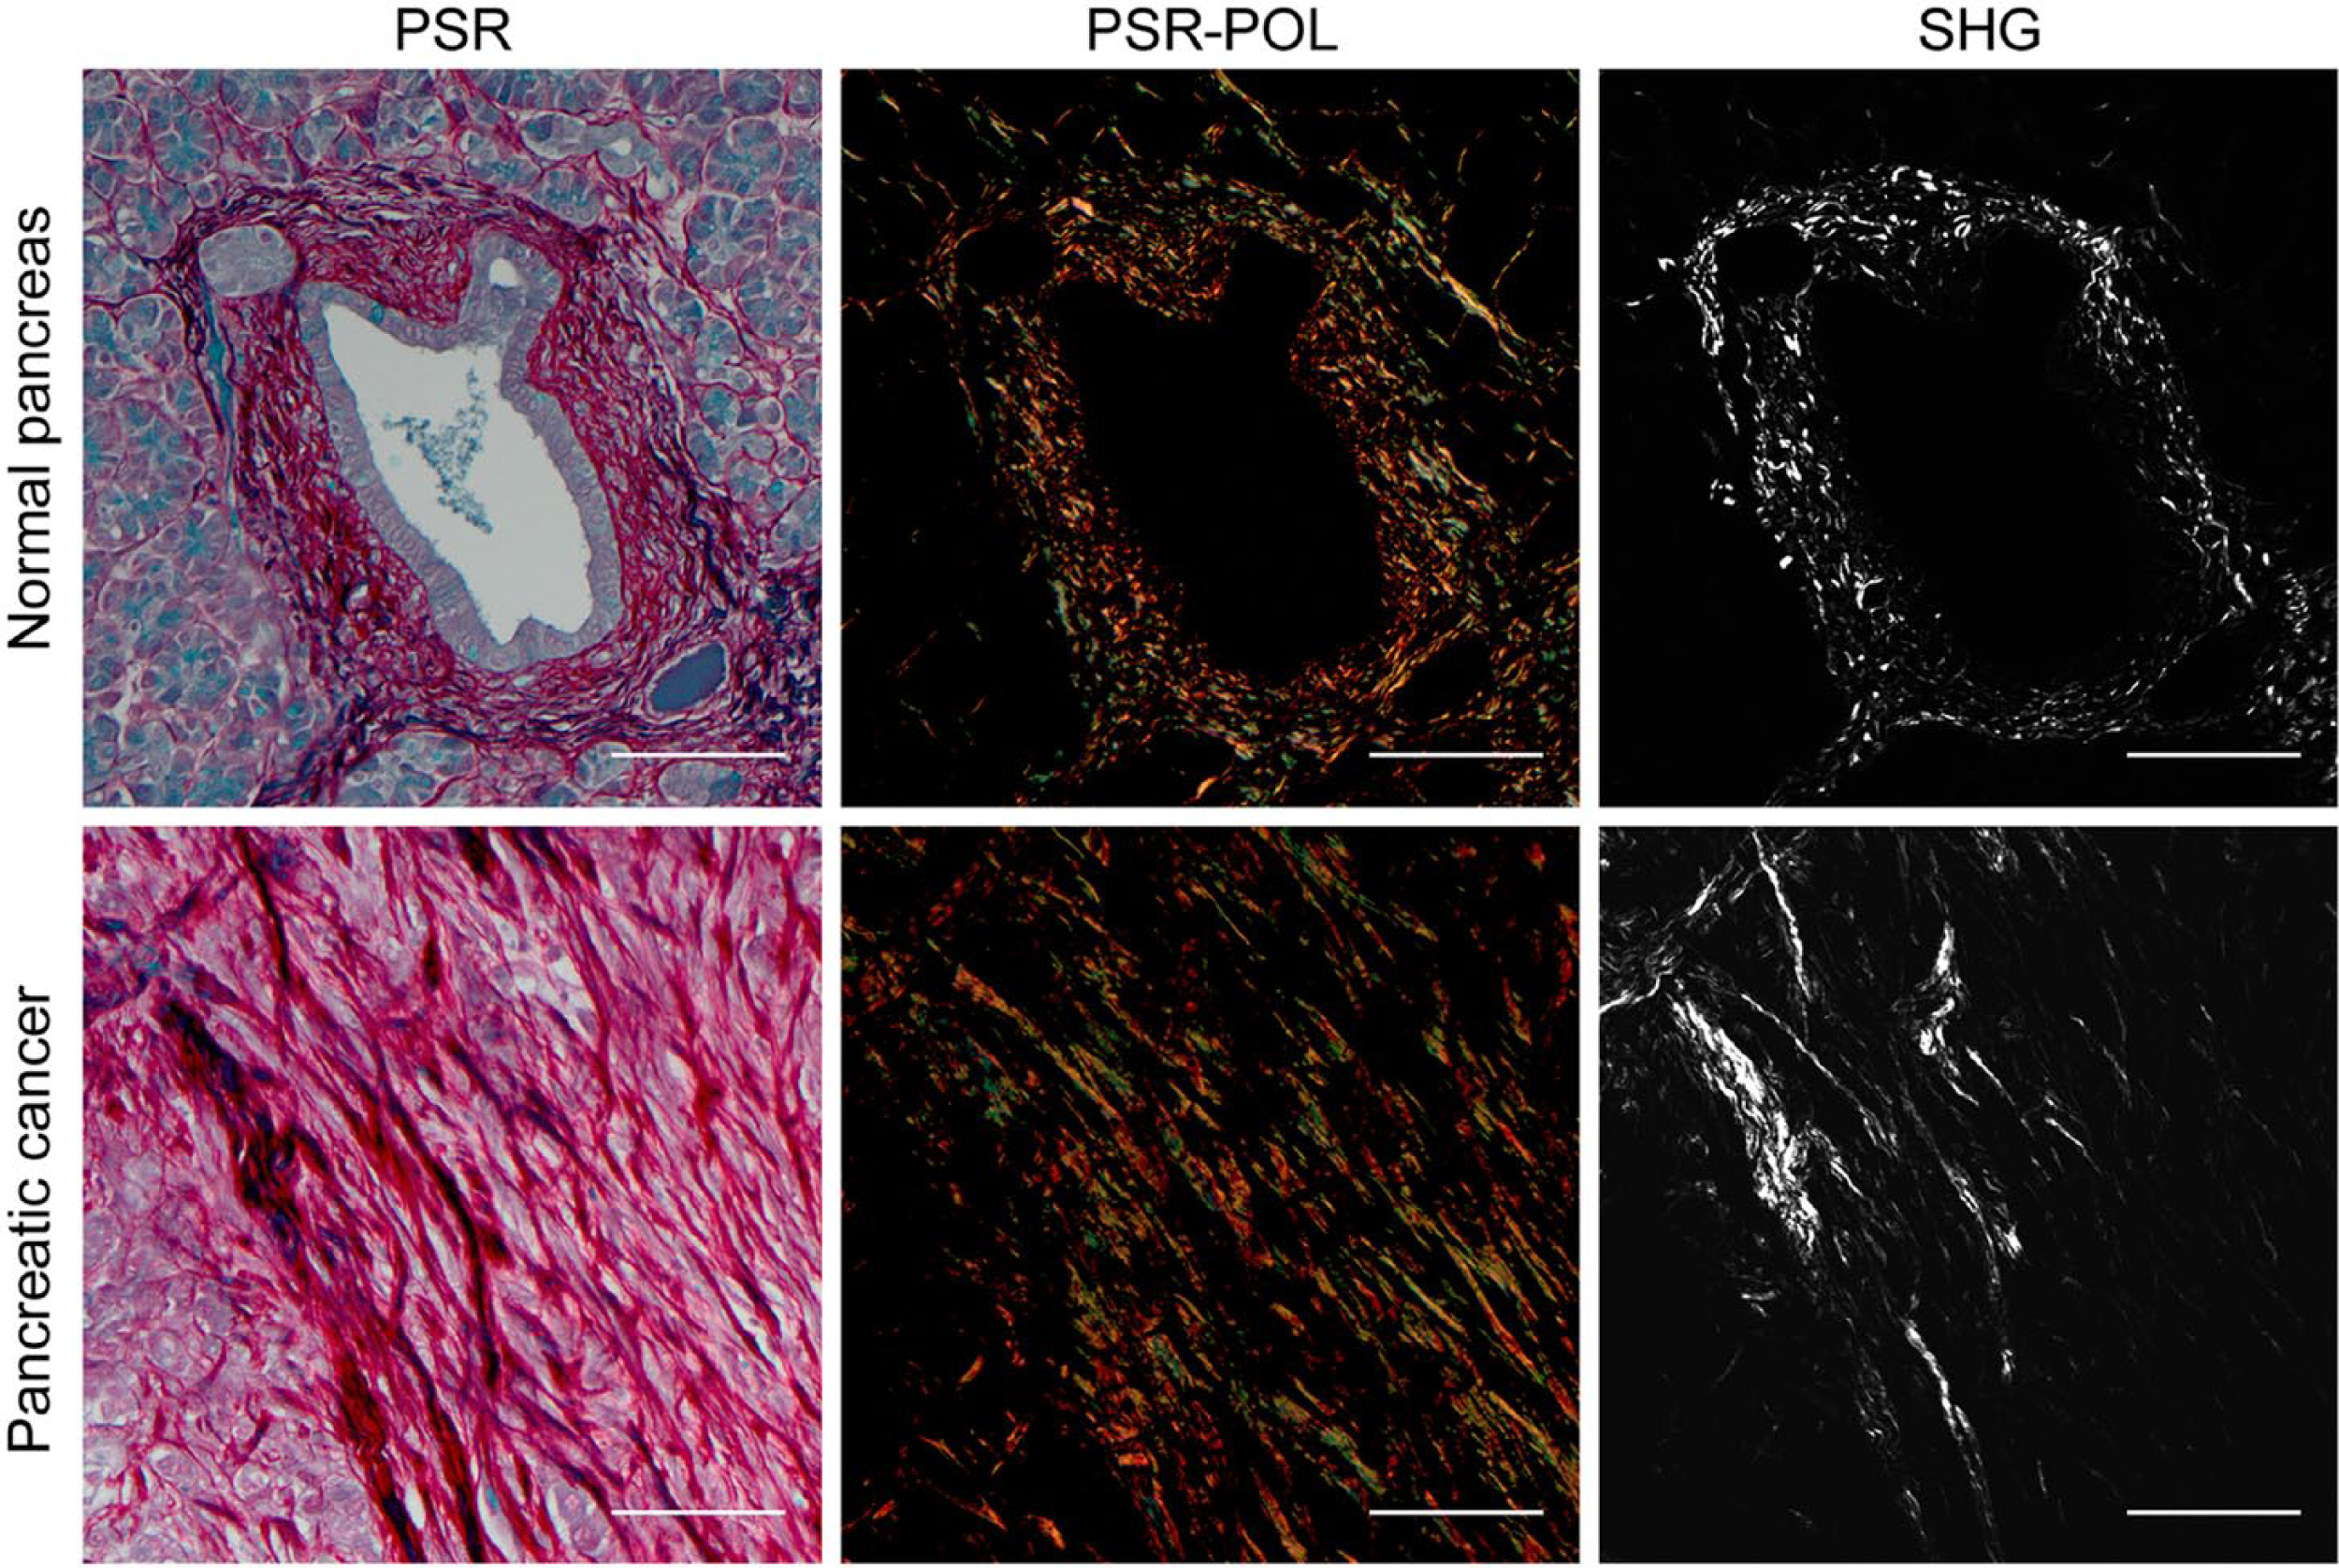
Representative human pancreatic tissue visualized with PSR-POL and SHG. Under brightfield transmission microscopy, PSR stains collagens with a deep red color. When paired with polarization microscopy, PSR enables visualization of highly birefringent thick (orange-red) and thin (green-yellow) collagen fibers. Collagen organization has previously been shown to be characteristically aligned in the pancreatic cancer stroma using SHG. Abbreviations: PSR-POL, picrosirius red stain with standard polarization microscopy; SHG, second harmonic generation; PSR, picrosirius red. Scale bars = 100 µm.
To validate the utility of PSR-POL to detect collagen changes, we acquired images around histologically confirmed normal and malignant pancreatic ducts. Using SHG, we previously established that collagen is characteristically reorganized and shows increased alignment, length, straightness, and width around malignant pancreatic ducts compared with benign ducts. 12 Here, we determined that PSR-POL imaging yields similar data: collagen fibers are more aligned, elongated, and thick in the stroma adjacent to the malignant epithelium (Fig. 3, p<0.0001). Fiber straightness was not significantly different between normal and cancer stroma when examined with PSR-POL (p=0.4391).
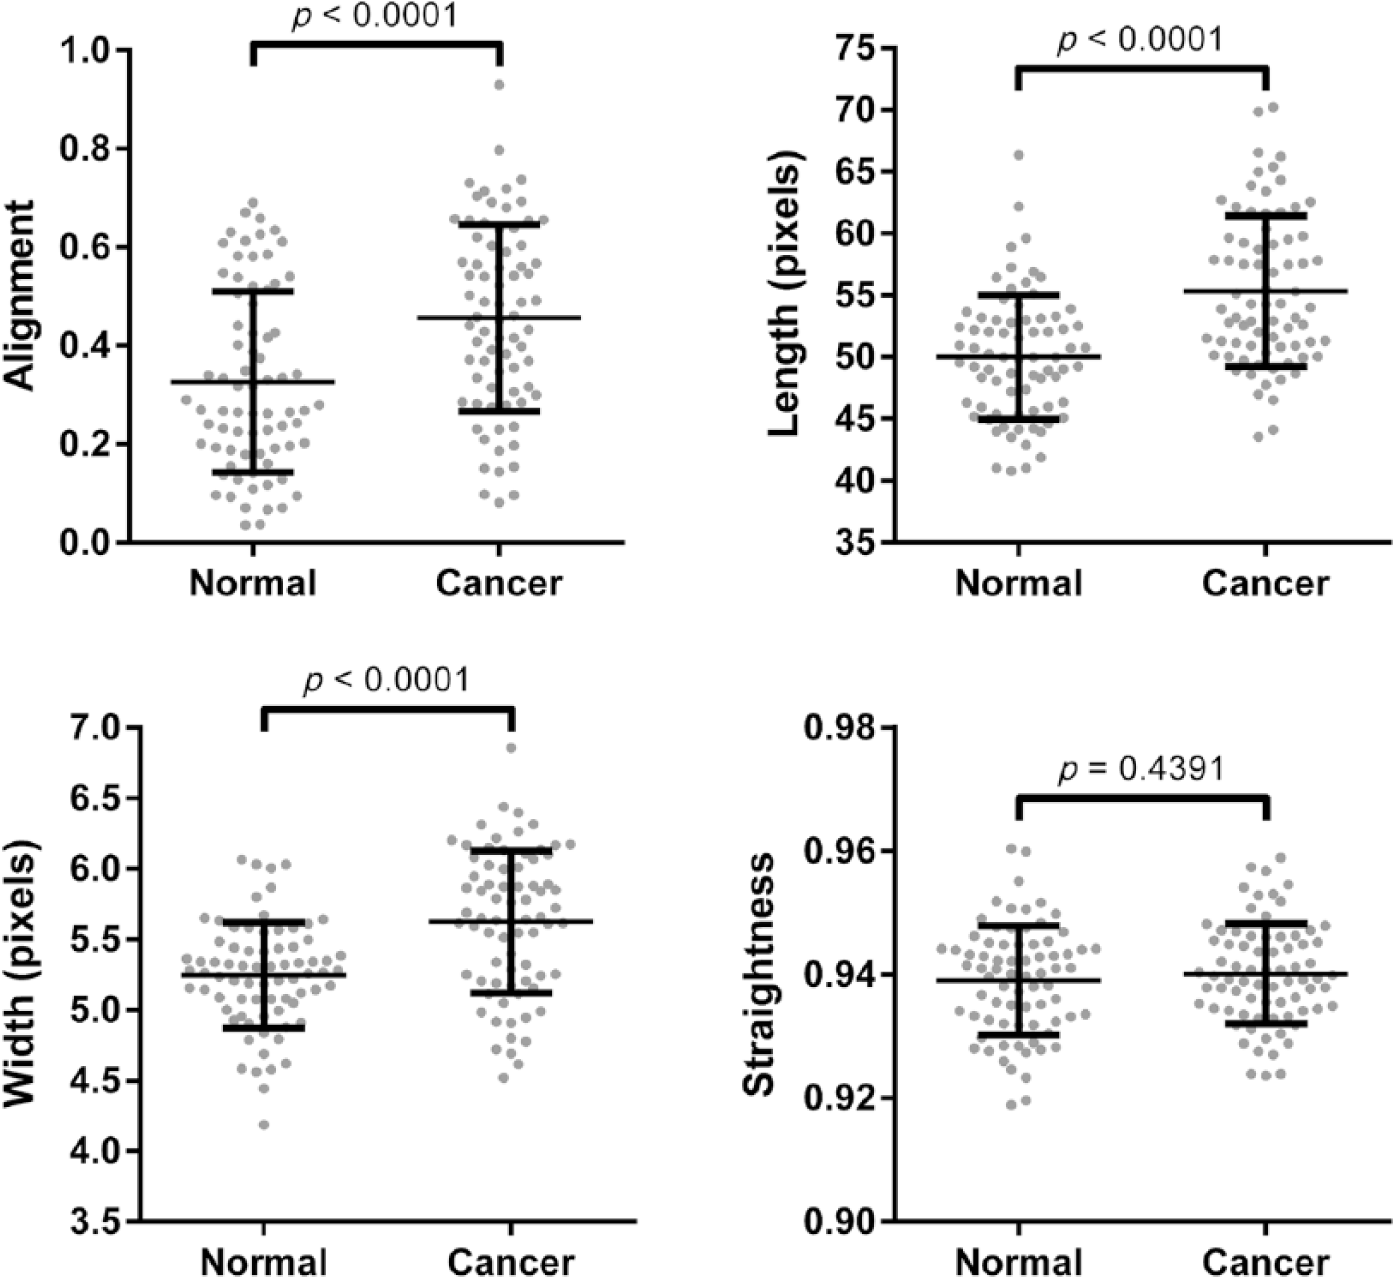
Quantification of different collagen fiber metrics (alignment, length, straightness, and width) in normal and pancreatic cancer-associated stroma using picrosirius red stain with standard polarization microscopy imaging. Images were acquired from matched normal and cancer tissues from 75 patients.
We next quantitatively compared images acquired in the same ROIs of 92 pancreatic cancer patient tumors using PSR-POL and SHG. For each technique, image acquisition parameters were set, so that the best signal-to-noise ratio was obtained and images were therefore representative of optimal visualization capabilities. We decided to employ forward-detection SHG in this comparison study due to our experience in achieving brighter signals in thin samples compared with backward-detection SHG (Supplementary Fig. S4). 40 We also quantitatively confirmed that forward- and backward-detection SHG configurations yield statistically comparable fiber measurements (Supplementary Fig. S5). Although many of the same collagen features are seen by both PSR-POL and SHG, it was apparent that the images did not perfectly mirror each other (Figs. 2, S2, and S3). We quantified the images using an open-source, validated software program, CT-FIRE, developed by our group, which is capable of reducing noise, extracting, and measuring important fiber metrics, including count, alignment, length, straightness, and width. 30 The quantitative scoring ability of CT-FIRE has several advantages over standard qualitative examination including increased objectivity, reproducibility, and sensitivity. We observed that CT-FIRE was compatible with grayscale images generated by both SHG and PSR-POL modalities (Supplementary Fig. S4). As depicted in Fig. 4, we determined that PSR-POL produced higher fiber count, length, width, and straightness values than SHG (p<0.0001). Alignment was also higher in PSR-POL images (p=0.0154). Similar quantitative trends were observed in prostate tissues (Supplementary Fig. S6), suggesting that the results were not cancer-type specific. Using Pearson correlation analysis, we determined that length (r = 0.159, p=0.129) and width (r = 0.174, p=0.097) were not significantly correlated between the two techniques. Straightness (r = 0.430, p<0.0001), alignment (r = 0.565, p<0.0001), and count (r = 0.656, p<0.0001) did show significant positive correlation between PSR-POL and SHG.
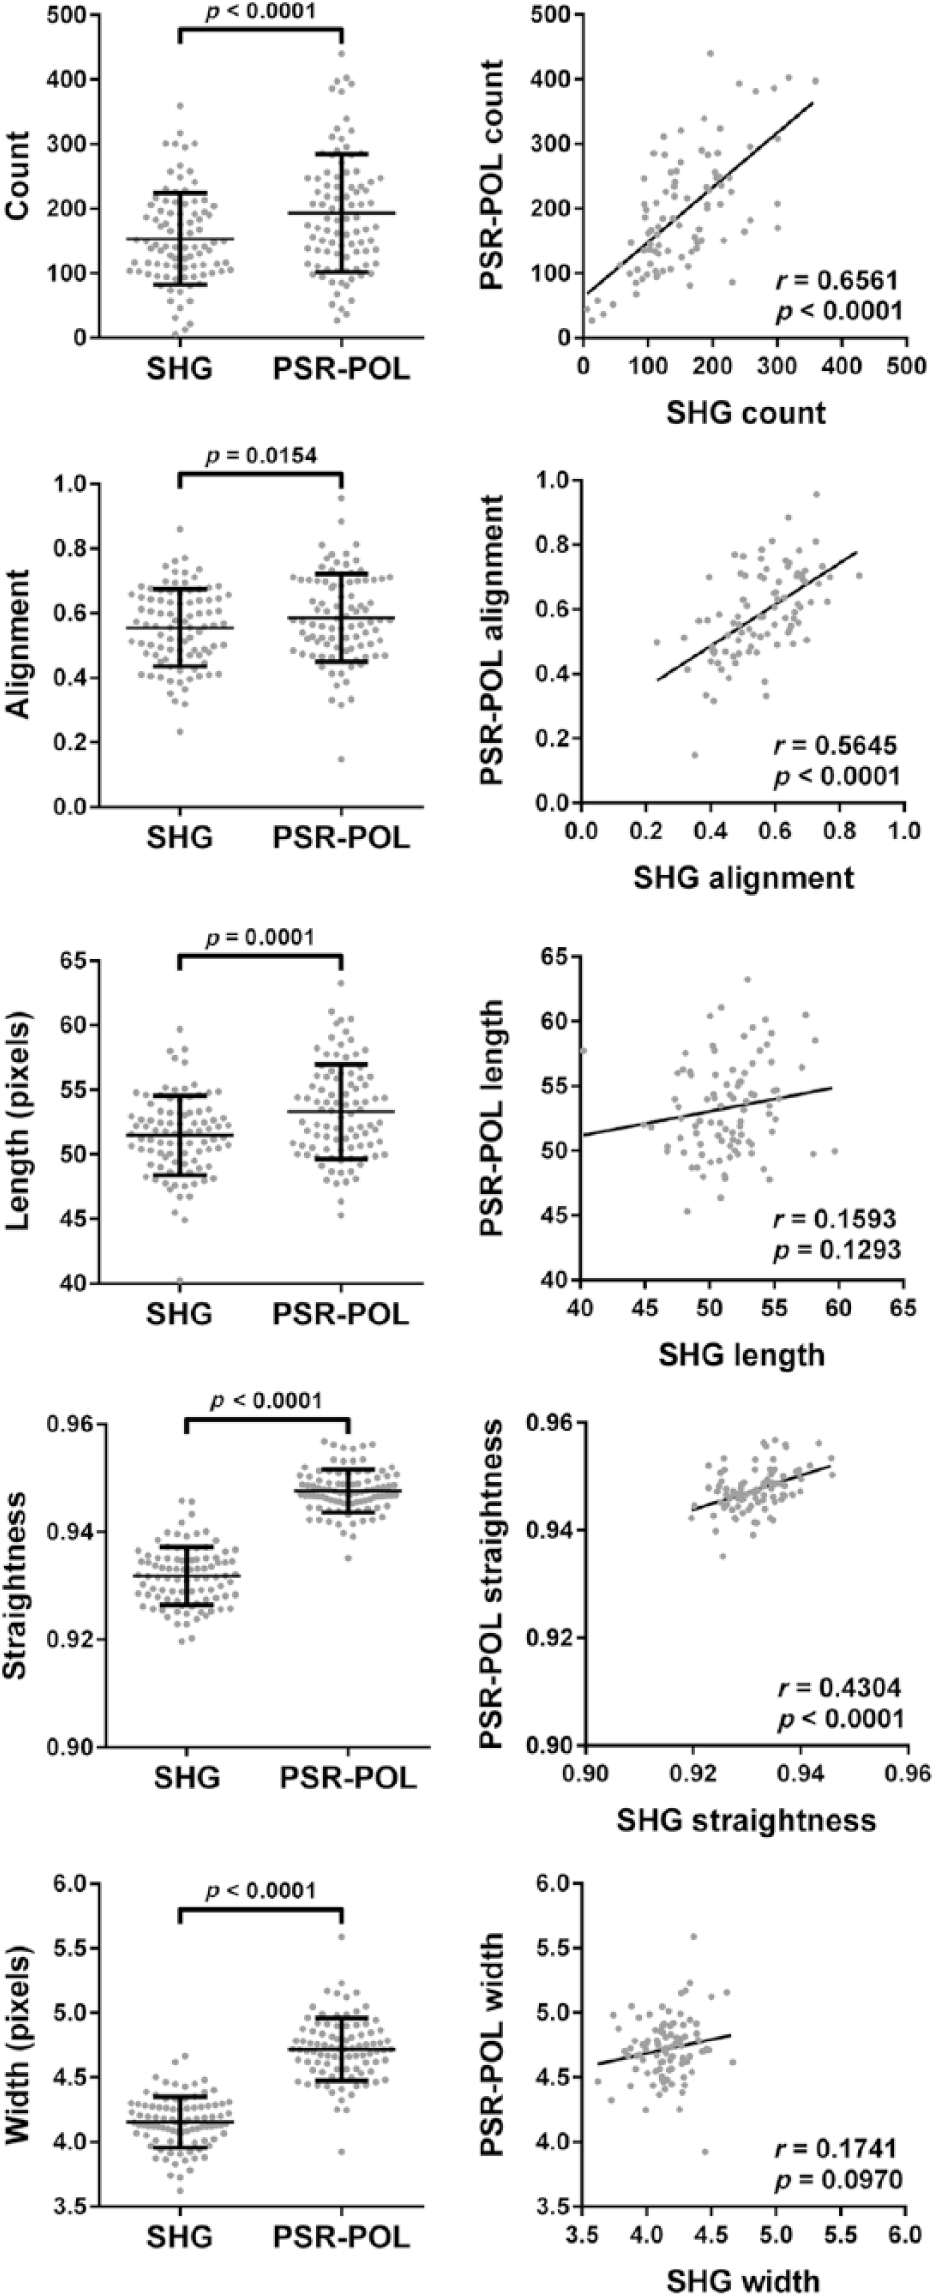
Left column: Quantification of different collagen fiber metrics (count, alignment, length, straightness, and width) in images acquired from pancreatic cancer tissues using SHG and PSR-POL. Right column: Pearson correlation analysis between metrics generated by SHG and PSR-POL imaging. Data represent 92 patient tumors. Abbreviations: SHG, second harmonic generation; PSR-POL, picrosirius red stain with standard polarization microscopy.
Based on our data, we believe that PSR-POL may be a practical option to investigate stromal collagen in thin tissue sections depending on the application and particular metric under examination. For applications that require absolute measurements predetermined by SHG, PSR-POL needs to be considered carefully because the technique appears to generate statistically higher values than SHG. The reasons for these differences are currently unknown. It has been suggested that PSR-POL can be sensitive to fiber thickness, 16 maturity, 18 and collagen type. 37 Further investigations will be of great interest to determine which collagen types and characteristics are being visualized or missed by each imaging technique. 41 However, for applications comparing the relative magnitudes of fiber properties, PSR-POL is positively correlated to SHG for count, alignment, and straightness and therefore might be a viable alternative for assessing these in routine pathological practice. Of particular interest is fiber alignment, which out of all collagen metrics assessed here has been demonstrated to correlate most strongly with disease progression and yields slightly higher measurements in PSR-POL images compared with SHG. As the emerging clinical value of other fiber metrics (ie, length, width) become clearer, imaging methods and technologies will likely need to be reconsidered to determine which would be most appropriate for facile visualization and analysis.
There are advantages and disadvantages to SHG and PSR-POL as outlined in Table 1. SHG is optimal for directly visualizing fibrillar collagens 42 with submicron resolution; however, its use mandates costly equipment and technical expertise. On the other hand, PSR-POL is already utilized in many histology labs and therefore has a low cost and barrier to implementation. Although PSR dye alone does not specifically stain collagen, 43 it can be used to directly visualize anatomic structures within tissue sections, which is important for spatial orientation and analysis of stromal collagen relative to a defined tumor boundary, as demonstrated in breast cancer.3,29 When PSR is paired with polarized light, collagen can then be visualized in the same field of view due to specific enhancement in birefringence by certain types of fibrillar collagen. 41 PSR-POL can also be combined with fluorescence microscopy 44 or more advanced polarimetry setups 45 to gain additional information about the tissue. Although not encountered in this study, PSR-POL may also have limitations including potential reproducibility issues due to variations in staining protocols 46 and will need to be assessed in other tissues. Until further validation studies are performed, SHG remains the gold standard for assessing collagen alignment in the research setting, particularly for studies requiring deep three-dimensional intravital imaging, 4 forward–backward scattering ratios, 40 and circular versus linear polarization dependencies. 47
Advantages and Disadvantages of Each Imaging Modality for Collagen Visualization.
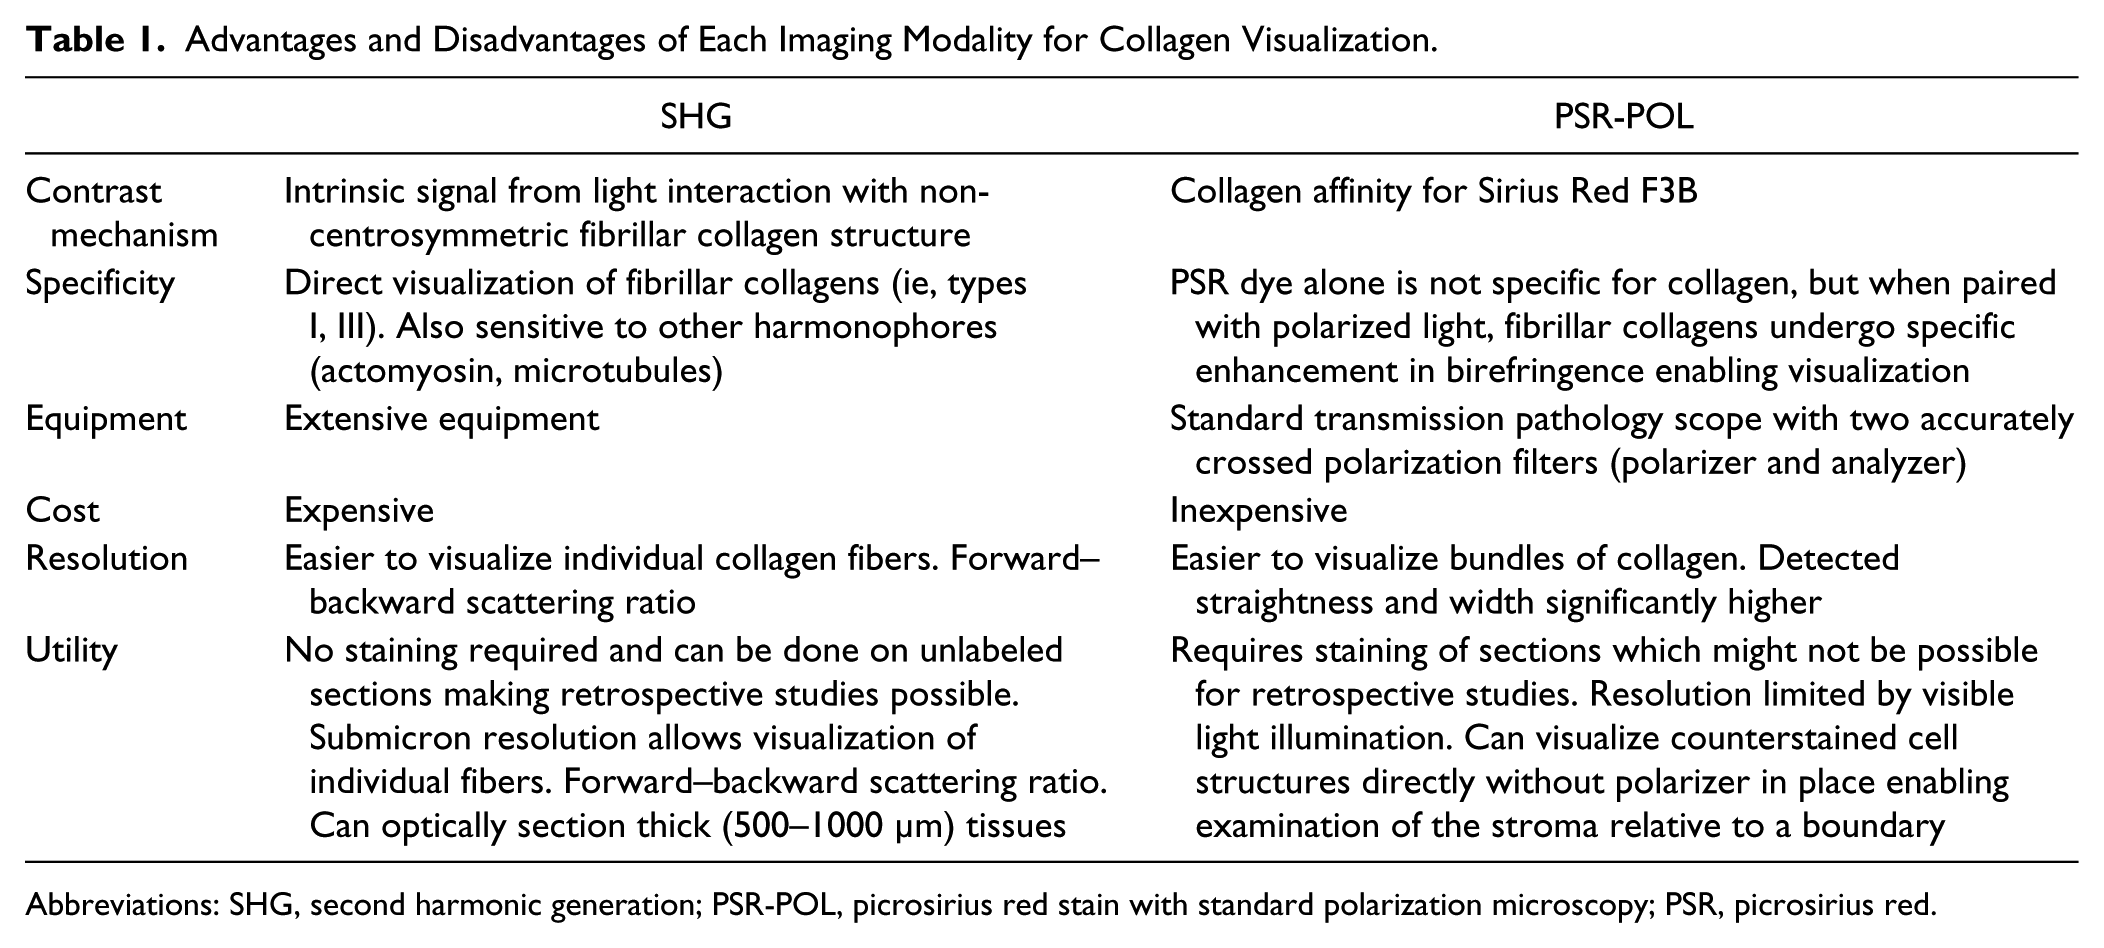
Abbreviations: SHG, second harmonic generation; PSR-POL, picrosirius red stain with standard polarization microscopy; PSR, picrosirius red.
Given accumulating literature that points to a correlation between collagen properties in peritumoral stroma to stage and patient outcome, there is desire by clinical and experimental pathologists to characterize tumor tissue in a manner that includes assessment of collagen organization in the spatial context of malignant cells. PSR-POL is an attractive method for visualizing collagen fibers in histopathological sections, along with routine H&E, due to its convenient availability in most clinical laboratories and ability to specifically isolate collagen contrast with linear polarizers on a brightfield microscope. PSR-POL generates images that are quantifiable by existing software packages and comparable with SHG, which has so far served as the gold standard for quantitative assessment of collagen. PSR-POL could therefore be a practical, easy-to-implement method for improving the evaluation of cancerous tissues in the clinical pathology setting.
Footnotes
Acknowledgements
We thank Mina Alfi for useful discussions, Dr Ruth Sullivan for pathology advice, Dr Lee Wilke and Dr Patricia Keely for access to human breast cancer tissues, and Peter Crump for guidance on statistical analyses.
Author Contributions
CRD, AGL, WAR, SMW, WJK, and KWE conceived the study and drafted the manuscript. AGL provided pathology guidance. CRD, KM, GM, and SL performed all of the imaging. AK and YL assisted in image segmentation and quantification. CRD carried out all data analysis. All authors have read and approved the final manuscript.
Competing Interests
The author(s) declared no potential conflicts of interest with respect to the research, authorship, and/or publication of this article.
Funding
The author(s) disclosed receipt of the following financial support for the research, authorship, and/or publication of this article: The tissue microarray resource used in this study was made possible by a generous donation to the University of Wisconsin Comprehensive Carbone Cancer Center by Teresa’s Foundation for Pancreatic Cancer. We thank National Institutes of Health for their financial support P30 CA014520 (University of Wisconsin Comprehensive Carbone Cancer Center facilities and services) and U54 DK104310 (to WAR and KWE).
References
Supplementary Material
Please find the following supplemental material available below.
For Open Access articles published under a Creative Commons License, all supplemental material carries the same license as the article it is associated with.
For non-Open Access articles published, all supplemental material carries a non-exclusive license, and permission requests for re-use of supplemental material or any part of supplemental material shall be sent directly to the copyright owner as specified in the copyright notice associated with the article.