
Abstract
The low cost and simplicity of picrosirius red (PSR) staining have driven its popularity for collagen detection in tissue sections. We extended the versatility of this method by using fluorescent imaging to detect the PSR signal and applying automated quantification tools. We also developed the first PSR protocol that is fully compatible with multiplex immunostaining, making it possible to test whether collagen structure differs across immunohistochemically labeled regions of the tissue landscape. We compared our imaging method with two gold standards in collagen imaging, linear polarized light microscopy and second harmonic generation imaging, and found that it is at least as sensitive and robust to changes in sample orientation. As proof of principle, we used a genetic approach to overexpress beta catenin in a patchy subset of mouse prostate epithelial cells distinguished only by immunolabeling. We showed that collagen fiber length is significantly greater near beta catenin overexpressing cells than near control cells. Our fluorescent PSR imaging method is sensitive, reproducible, and offers a new way to guide region of interest selection for quantifying collagen in tissue sections.
Keywords
Introduction
The mammalian collagen network consists of 28 distinct collagen types and a host of regulatory factors that guide collagen production and degradation.1,2 Control over collagen regulatory signals can go awry, prompting collagen disorganization. 3 Fibrosis is the not the only outcome. Recent studies reveal complex relationships between regional collagen organization and cell differentiation, adhesion, migration, and signaling.4–7 New methods capable of quantifying collagen characteristics within a tissue and in relation to molecular markers of cell behavior are needed to decipher the role of collagens in controlling such cell behaviors.
Our interest in collagen derives from recent observations that prostate stiffness and collagen content associate with benign urinary dysfunction.8–10 We sought a collagen detection method that would enable us to test the hypothesis that regional changes in prostate collagen content associate with regional changes in cell, gene, and protein expression and thereby serve as a precipitating factor in benign urinary dysfunction. Other important research questions include whether localized changes in collagen organization mediate normal processes such as tissue morphogenesis and development, drive tumor cell behaviors, or exacerbate tissue responses to inflammation.
Collagens have been visualized using a variety of techniques. Scanning and transmission electron microscopy offer high-resolution visualization of individual collagen fibers but are expensive, involve complicated specimen preparation, and offer nanoscale detail that is excessive for many applications. 11 Second harmonic generation (SHG) imaging is sensitive, specific for fibrillar collagen, and compatible with automated quantification methods but is relatively expensive as it requires multiphoton microscopy. 12 Histological dyes such as picrosirius red (PSR) are resistant to fading, inexpensive, and provide reproducible staining.13–15 The PSR staining method relies on the elongated, anionic structure of the Sirius red dye molecule–binding parallel to cationic collagen fibers. 15 PSR staining enhances the natural birefringence of collagen bundles. When viewed under linear polarized light, collagens are revealed as red, orange, yellow, or green fibers. Unfortunately, sample orientation under linear polarized light greatly affects PSR hue and signal strength. 16 Circular polarized light overcomes this limitation, 17 but requires specialized equipment. Alternatively, fluorescent imaging of PSR-stained specimens yields a strong red fluorescence signal that is sensitive, specific for collagen, and unlike linear polarized light microscopy, is unaffected by sample orientation.18–20
To extend the utility of PSR as a collagen stain, we developed a novel, sequential method of fluorescent imaging, destaining, and immunohistochemical staining. Our method enables region of interest (ROI) selection within tissues so that collagen characteristics can be locally quantified within an immunohistochemically defined microenvironment. As proof of principle, we used our approach to quantify collagens within the prostates of genetically modified mice. We used a genetic approach to activate beta catenin signaling within a patchy subset of mouse prostate luminal epithelial cells, which are only distinguished from adjacent normal cells by immunostaining. Our results indicate that although collagen fiber density does not change, stromal regions immediately adjacent to beta catenin overexpressing epithelial cell nodules have longer collagen fibers than stromal regions adjacent to immunologically normal epithelial cells. Identifying these local changes are valuable in understanding the crosstalk between epithelium and stroma within the prostate and would have gone undetected using other methods of collagen quantification.
Materials and Methods
Animals
C57BL/6J mice (Jackson Laboratory; Bar Harbor, ME) were housed in clear, plastic cages containing corn cob bedding and maintained on a 12-hr light and dark cycle at 25C and 20% to 50% relative humidity. Feed (Diet 2019; Harlan Teklad, Madison, WI) and water were available ad libitum. All procedures were approved by the University of Wisconsin Animal Care and Use Committee and conducted in accordance with the National Institutes of Health’s (NIH) Guide for the Care and Use of Laboratory Animals. Freshly dissected adult mouse prostates were fixed overnight in 4C phosphate buffered saline (PBS) containing 4% paraformaldehyde (PFA) overnight. Samples were then dehydrated in ethanol, cleared in xylene, and embedded in paraffin. Microtome-cut prostate sections (5-µm-thick) were adhered to Superfrost Plus Gold glass slides (Thermo Fisher Scientific; Waltham, MA).
Collagen Hydrogel Preparation
Collagen hydrogels were prepared at a concentration of 3.0 mg/mL. The collagen solution (BD™ Purified Rat Tail Collagen I; BD Biosciences, San Jose, CA) was diluted (1:1) in 100 mM HEPES and further diluted in PBS to achieve the final concentration and volume. The solution was then dispensed in non-tissue culture-treated 96-well plates and the hydrogels polymerized for 30 min at 25C. Polymerized hydrogels were fixed for 10 min at 25C in 4% PFA, dehydrated into ethanol, cleared in xylene, embedded in paraffin, cut into 5-µm-thick sections, and adhered to Superfrost Plus Gold glass slides (Thermo Fisher Scientific).
PSR Staining
Tissue and collagen hydrogel sections were deparaffinized and rehydrated through graded ethanol series. Slides used for brightfield PSR imaging were incubated in hematoxylin (H-3404; Vector Laboratories, Inc., Burlingame, CA). Slides were incubated for 1 hr at 25C in the PSR staining solution [0.5 g of Direct Red 80 (2610-10-8; Sigma-Aldrich Corp., St. Louis, MO) in 500 mL of saturated picric acid (P6744-1GA; Sigma-Aldrich Corp.)]. Slides were washed twice with acidified water (0.5% acetic acid), dehydrated in graded ethanol series and cleared in xylene. The Richard-Allan toluene–based mounting medium (4112APG; Thermo Fisher Scientific) was applied before coverslipping.
Immunohistochemistry
Coverslips were removed from PSR-stained slides by incubating up to 48 hr in xylene. They were washed with two changes of fresh xylene and rehydrated through graded ethanol series. Slides were microwaved for 20 min in 10 mM citric acid (pH 6.0). Tissues were then blocked for 1 hr at 25C in Tris buffered saline plus Tween 20 (TBSTw) containing 1% blocking reagent (Roche Diagnostics; Indianapolis, IN), 5% normal goat sera, and 1% bovine serum albumin fraction 5 (RGBTw). Slides were then incubated overnight at 4C in RGBTw containing rabbit anti-cadherin 1 (1:200; Cell Signaling Technologies, Danvers, MA) and mouse anti-beta catenin (1:100; BD Transduction Laboratories, San Jose, CA) or mouse anti-collagen 1a1 (1:50; Novus Biologicals, Littleton, CO) and rabbit anti-collagen 4a1 ( 1:250; Abcam, Cambridge MA). Tissues were incubated with secondary antibodies (1:250 488 Alexa Fluor–conjugated goat anti-mouse IgG, 1:250 594 Alexa Fluor–conjugated goat anti-rabbit IgG; Jackson Immunoresearch, West Grove, PA), incubated with 4’,6-diamidino-2-phenylindole (DAPI) to stain nuclei, and mounted in anti-fade media before imaging.
PSR and IHC Imaging
For tissue rotation and collagen hydrogel sensitivity experiments, linear polarized light or brightfield microscopy was performed using an Eclipse 80i microscope (Nikon; Melville, NY) equipped with a linear polarized lens and a 40× dry objective (Plan Achromatic NA = 0.95; Nikon). Fluorescent microscopy was performed using an Eclipse E600 microscope (Nikon) with a 40× dry objective (Plan Fluor NA = 0.75; Nikon). Fluorescence was detected using a mCherry/Texas Red filter cube (Chroma Technology Corp; Bellows Fall, VT). All images were captured at 2560 × 1920 resolution using a DS-Fi1 camera (Nikon) and NIS-Elements D v3.1 imaging software (Nikon). To assess orientation-dependent changes in appearance, samples were imaged, the stage was rotated 45 degrees clockwise, and samples were imaged again until the stage was rotated 180 degrees from its original position. For the collagen hydrogel sensitivity experiment, four representative ROIs (35.36 mm2) were imaged across four individual hydrogels.
For PSR-IHC multiplexing experiments, imaging was performed using a SP8 Confocal Microscope (Leica; Wetzlar, Germany) using a 20× oil immersion objective (HC PL Apo CS2 NA = 0.75; Leica). For PSR, samples were excited using a 561-nm laser and emission was detected between 635 and 685 nm. IHC samples were excited and detected using the recommended settings for each secondary antibody fluorophore. Images were captured at 1024 × 1024 resolution using LAS X software (Leica). Tile scanning was used to stitch together images and generate an image across the entire section of prostate tissues. Prostate stroma ROIs (2.5 mm2) were selected for analysis and classified based on the number of adjacent beta catenin–positive epithelial cells (<25% beta catenin+ epithelial cells = normal, or >75% cells beta catenin+ epithelial cells = beta catenin overexpression).
Second Harmonic Generation
All SHG imaging was done with a forward detection SHG microscope. 21 A MIRA 900 Ti: Sapphire laser (Coherent; Santa Clara, CA) was used to deliver circularly polarized 780-nm light to the sample using a 40× water immersion objective (CFI Apo Lambda S; NA = 1.25; Nikon). The SHG signal was filtered with a bandpass filter specific for the second harmonic signal at 780 nm (390/18 BP; Semrock) and collected with a H7422P–40 GaAsP photomultiplier tube (Hamamatsu; Hamamatsu, Japan).
Image Processing and Fiber Quantification
PSR and IHC images were superimposed using Adobe Photoshop software (Adobe Systems; San Jose, CA). Images were processed as red green blue images with PSR occupying the red channel and IHC occupying the green and blue channels. PSR and IHC images were aligned using tissue landmarks. Images were converted to 8 bit, 512 × 512 resolution image files. Collagen fiber metrics including length, density, and diameter were measured using CT-FIRE fiber detection software 21 (LOCI; Madison, WI).
Statistics
Mean collagen metrics were calculated for each ROI. A Bartlett’s test was performed to test whether homogeneity of variances was the same between groups. A Student’s t-test, paired t-test, or analysis of variance (ANOVA, followed by the Tukey post hoc test) was used to identify differences between or among means using R statistical software 22 (R Foundation for Statistical Computing; Vienna, Austria). For all statistical analysis, a difference of p<0.05 was considered significant.
Results
Fluorescent PSR Imaging Is Resistant to Orientation-Dependent Changes in Hue or Intensity
We first confirmed that PSR elicits a strong fluorescent signal. We achieved the strongest confocal microscopy signal by exciting PSR-stained tissues with a 561-nm laser and detection with a 635- to 685-nm bandpass filter. We achieved a strong light microscopy signal by exciting tissues with a mercury arc lamp and detecting filters using a rhodamine red filter set (results not shown).
To determine the impact of sample orientation on collagen fiber appearance, adult mouse prostate sections were stained with PSR and imaged using linear polarized or fluorescent light (Fig. 1). The stage was then rotated 45 degrees, the tissue re-centered, and the ROI imaged again. This process was repeated to generate serial images of the same ROI at 45-degree intervals of rotation from 0 to 135 degrees. As expected, sample rotation under linear polarized light microscopy altered the appearance of collagen fibers by changing their hue and intensity. Fiber color shifted periodically as the sample was rotated from 0 to 135 degrees, achieving maximal differences from the origin at 45 and 135 degrees. There was no apparent shift in collagen fiber appearance when visualized with fluorescent light. These results indicate that the fluorescent PSR signal, but not the birefringent PSR signal, is unaffected by sample orientation.
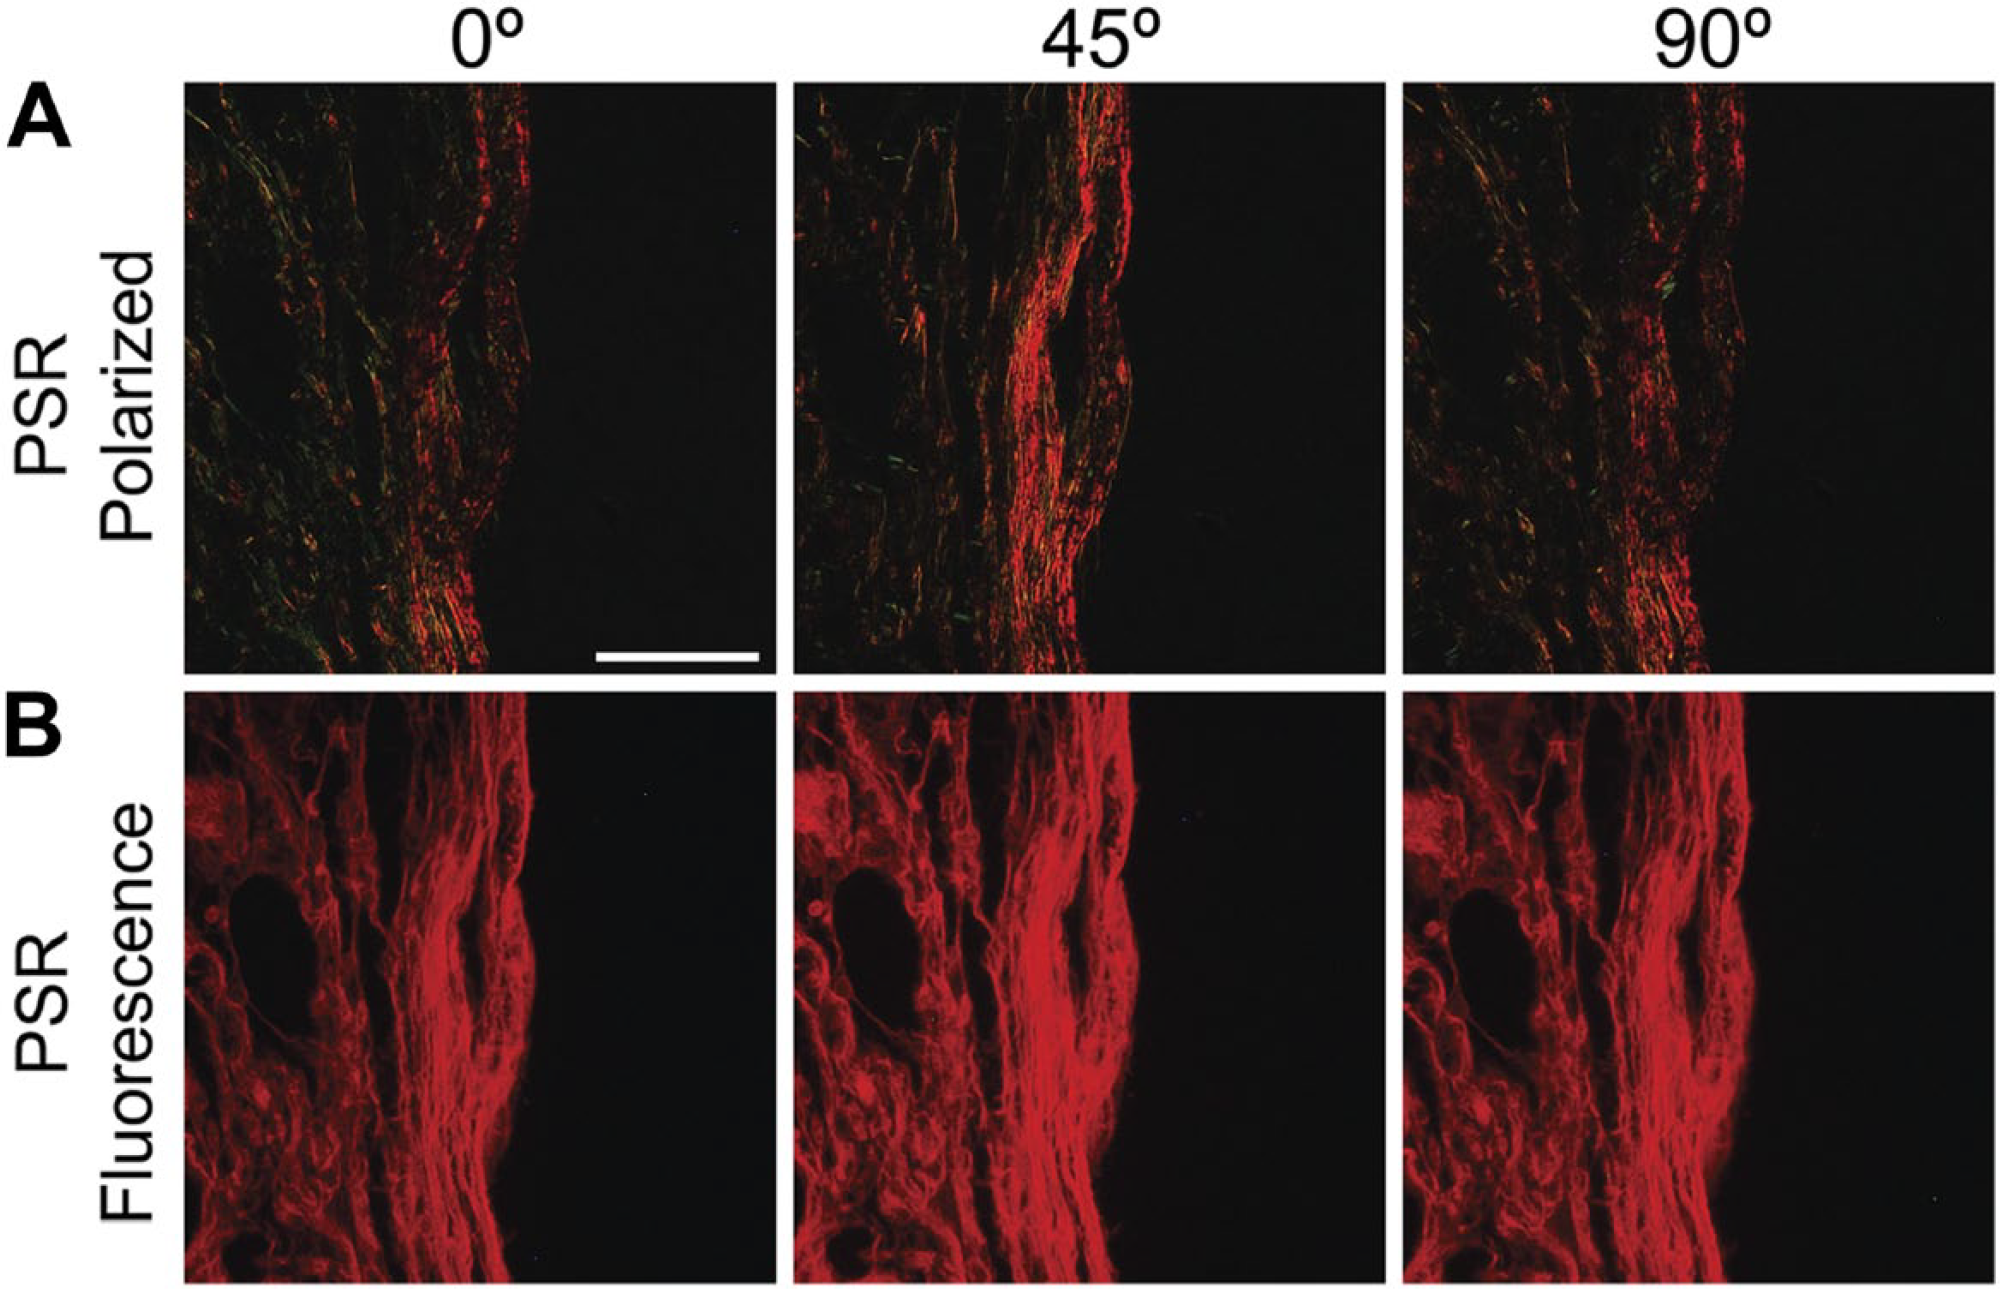
Fluorescent PSR imaging is resistant to orientation-dependent changes in hue or intensity. Mouse prostate tissue sections (5 µm) were stained with PSR and visualized using linear polarized or fluorescent microscopy. (A) Under polarized light, PSR-stained collagen fibers appear red, orange, yellow, and green. Rotation of the sample in the plane perpendicular to the incident light causes periodic shifts in hue. (B) More PSR-stained collagen fibers are observed using fluorescent microscopy than polarized light microscopy. Although collagen fibers visualized with fluorescent light are a single color, rotation of the sample under fluorescent light does not produce the color changes observed under polarized light. Abbreviation: PSR, picrosirius red. Scale bar = 25 µm.
Fluorescent PSR Imaging Is More Sensitive Than Linear Polarized Light Imaging
We compared collagen fiber detection using fluorescent and linear polarized light microscopy. We synthesized rat-tail collagen I hydrogels that are characterized by a uniform matrix and purified collagen sample composition. Collagen hydrogels were embedded in paraffin, sectioned, and sections were stained with PSR. Identical sections were then imaged using linear polarized and fluorescent light microscopy (Fig. 2). Collagen fibers appeared relatively short and broadly spaced under linear polarized light, but under fluorescent light were longer, densely packed, and organized in a complex meshwork. CT-FIRE software was used to quantify collagen fiber density and average fiber length in fluorescent and polarized light images. Fluorescent imaging revealed significantly greater fiber density and length than linear polarized imaging.
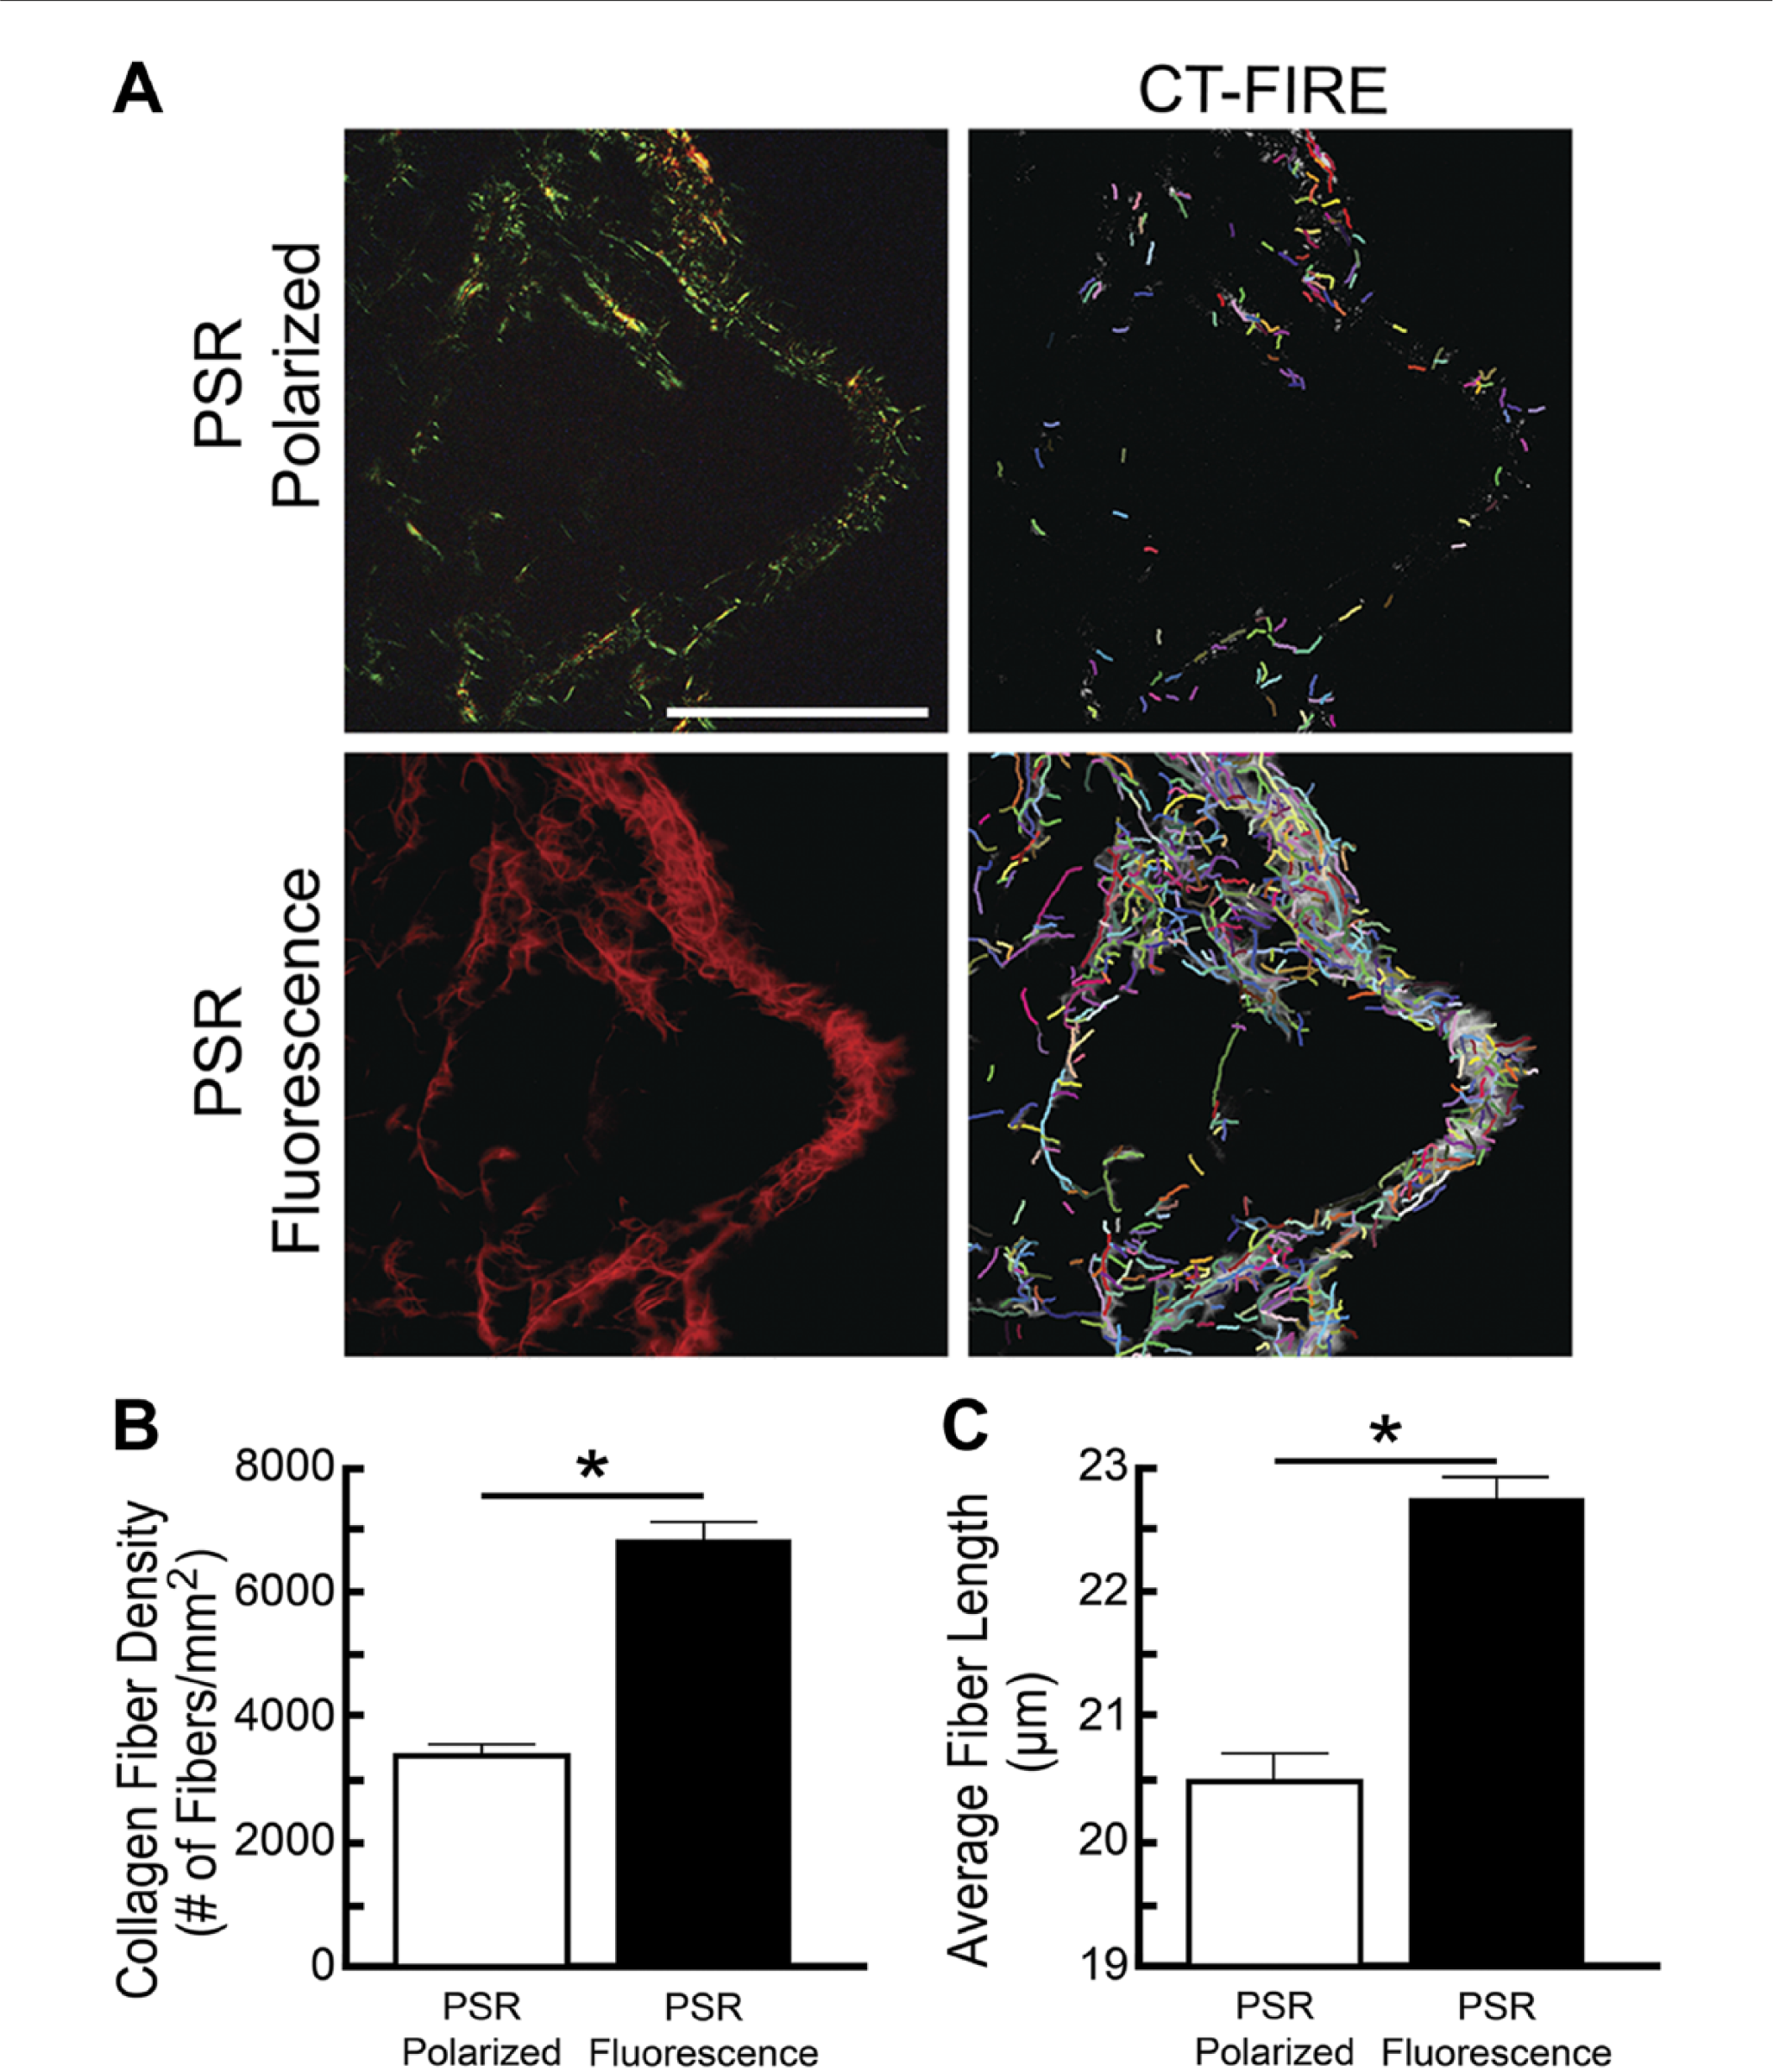
Fluorescent PSR imaging is more sensitive than polarized light imaging. Hydrogel matrices comprising 3.0-mg/mL rat-tail-derived collagen I were stained with PSR and the same sections were imaged using linear polarized and fluorescent microscopy. (A) The collagen fiber density and average fiber length in multiple ROIs were quantified using CT-FIRE fiber quantification software. (B) Fluorescent imaging revealed significantly more fibers in PSR-stained hydrogels than linear polarized light imaging. (C) Fluorescent imaging also revealed significantly longer fibers. Results are mean ± SE of n=16 ROIs. Significant differences among groups (p<0.05) are indicated by an asterisk. Abbreviations: PSR, picrosirius red; ROI, region of interest. Scale bar = 50 µm.
Collagen fibers appear more continuous when visualized with fluorescent PSR imaging compared with SHG microscopy. However, further studies are needed to investigate this.
We compared the appearance of collagens using fluorescent PSR microscopy and SHG microscopy. Mouse prostate tissue sections were deparaffinized and imaged without additional staining using SHG microscopy. Mouse prostate tissue sections were then decoverslipped, stained with PSR, and imaged again using fluorescence microscopy. Using CT-FIRE fiber analysis, we found no significant differences between the number of fibers detected in images generated by fluorescent PSR and SHG (Fig. 3). However, significant differences were observed in both fiber length and diameter. Collagens appear as long fibers when visualized by fluorescent PSR microscopy and short fibers when visualized by SHG, suggesting portions of collagen fibers escape detection when visualized by SHG microscopy. Future studies would need to investigate this discrepancy further. However, it is known that SHG imaging is not sensitive to collagen fibers oriented parallel to the direction of laser propagation 23 and, as a result, can complicate the analysis if the collagen is running axially between focal planes.
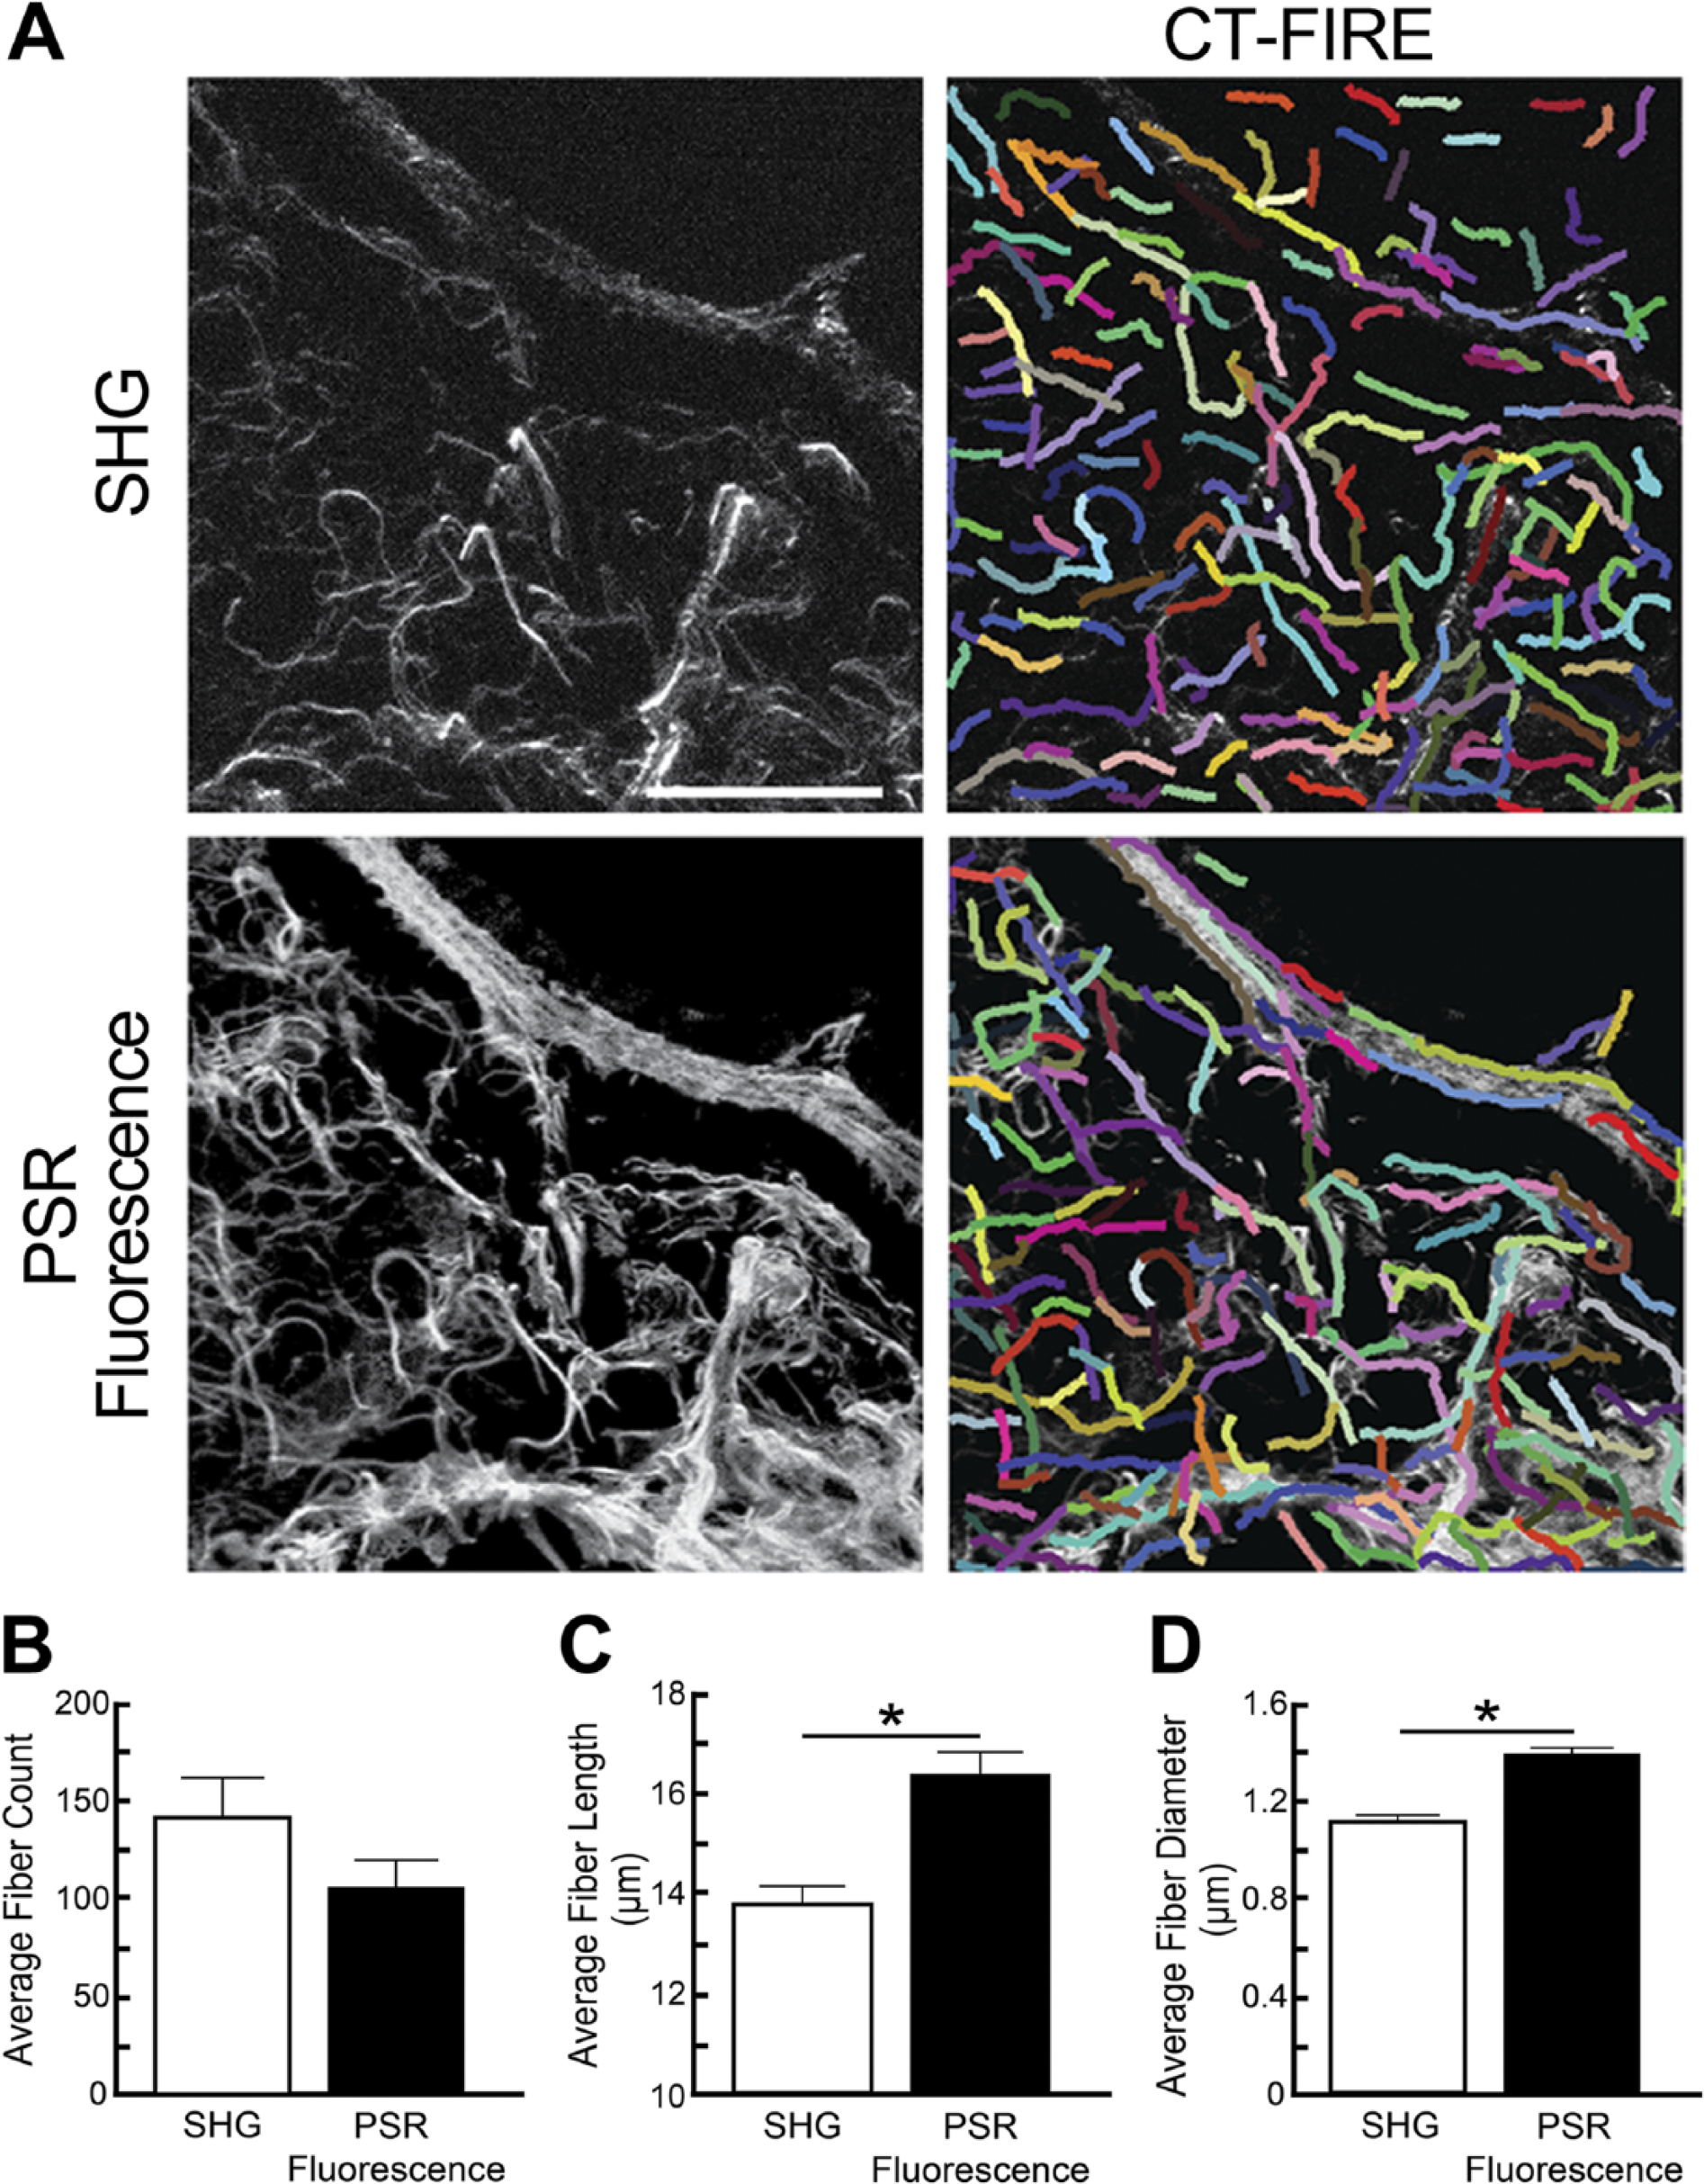
Fluorescent PSR imaging detects more continuous fibers than second harmonic generation. (A) Mouse prostate and urethra sections were imaged with second harmonic generation, then stained with PSR, and imaged using fluorescent microscopy. CT-FIRE was used to quantify collagen fiber abundance, length, and diameter in identical regions. (B) There was no difference in the number of detected fibers between fluorescent PSR and SHG imaging. (C and D) Fluorescent PSR imaging revealed significantly longer and wider fibers than SHG. Results are mean ± SE of n=8 identical ROIs. Significant differences were observed among groups (p<0.05). Abbreviations: PSR, picrosirius red; SHG, second harmonic generation; ROI, region of interest. Scale bar = 10 µm.
Fluorescent PSR Imaging Is Compatible With Subsequent IHC
Multiplexing of PSR and immunostaining has been attempted previously but with little success. 24 We determined serendipitously that microwave-induced epitope retrieval removes PSR from tissue sections while also preparing specimens for IHC. To exploit this process as a way to multiplex PSR staining with IHC, we tested whether our standard epitope retrieval procedure is 100% efficient at removing PSR staining so that we could use all available fluorescence channels for IHC staining without background PSR staining. Mouse prostate tissue sections were deparaffinized but unstained (control) or PSR stained and imaged. As expected, CT-FIRE fiber analysis of images revealed no detectable fibers in unstained samples and abundant fibers in PSR-stained samples (Fig. 4). PSR-stained samples were then decoverslipped and PSR was stripped using 10 mM citric acid (pH 6.0) and heat. CT-FIRE analysis of destained sections revealed no detectable fibers in PSR-stained samples subjected to epitope retrieval (they were similar in appearance to unstained controls). Traditional fluorescence immunostaining was then performed on the destained samples. Fluorescent PSR images were superimposed with fluorescent immunostaining images to generate a single combined image.
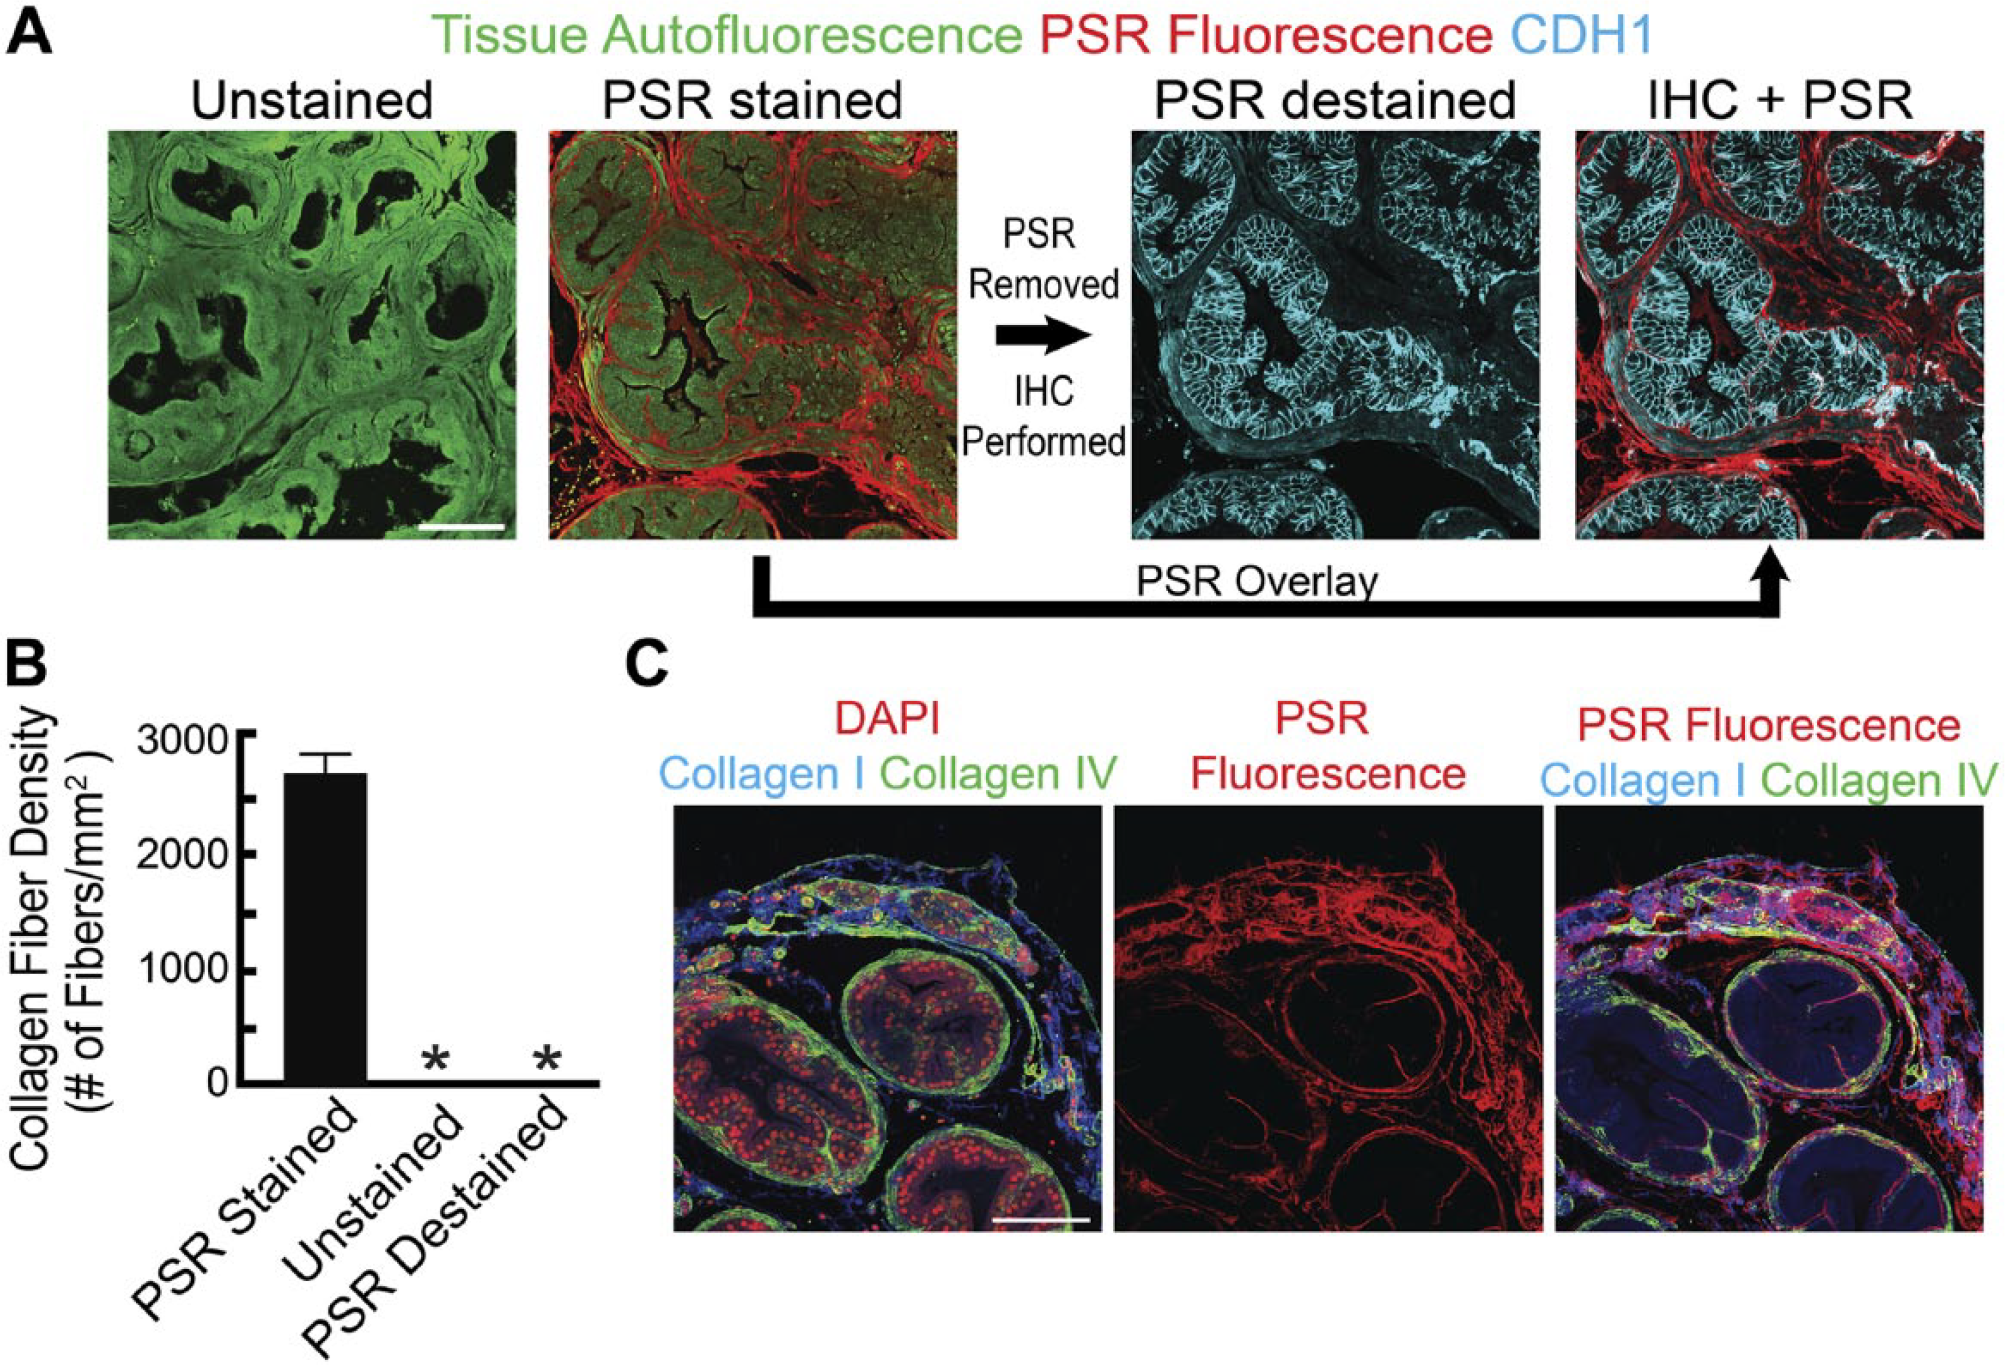
PSR and IHC multiplexing reveals PSR staining to be specific for collagens I and IV. (A) Mouse prostate tissue sections (5 µm) were stained, imaged, destained, subject to immunohistochemical staining, reimaged, and compared with control (no stain). Fiber density quantification was performed using CT-FIRE. (B) Both unstained and PSR destained samples had no detectable fibers compared with PSR-stained tissue. (C) To confirm PSR specificity under fluorescent imaging conditions, PSR was combined with IHC to identify collagens I and IV. Collagens I and IV stain distinct compartments of the prostate stroma. Overlay of PSR reveals strong staining of fibrous structures in both compartments, evidence for its detection of both fibrillar and non-fibrillar collagens. Results are mean ± SE of n=6 ROIs. Significant differences among groups (p<0.05) are indicated by an asterisk. Abbreviations: PSR, picrosirius red; IHC, immunohistochemistry; ROI, region of interest; CDH1, cadherin 1; DAPI, 4’,6-diamidino-2-phenylindole. Scale bar = 100 µm.
Fluorescent imaging of PSR-stained tissue samples is a relatively new approach and unlike polarized light imaging has not been thoroughly validated. To test for specificity, samples were stained with PSR, imaged, destained, and immunolabeled with antibodies against fibrillar type I and non-fibrillar type IV collagens. Collagen I and IV immunostaining was detected in discrete areas of the mouse prostate and PSR fluorescence overlays both immunostains, evidence that PSR, unlike SHG, can detect collagens that lack true fibrillar structure (Fig. 4).
Multiplexed PSR Fluorescence and IHC Reveals Collagen Fiber Changes Localized to Molecular ROIs
We next tested whether we could multiplex PSR and immunostaining to recognize molecular features within a tissue section and quantify collagen characteristics locally around these features. We showed previously that beta catenin is activated in the epithelial compartment of human prostate specimens with histological benign hyperplasia. 25 Because beta catenin has been associated with pro-fibrotic activities,26–31 we hypothesized it may be responsible for signals that reorganize collagen in prostate glands with benign prostatic hyperplasia. To test whether beta catenin activation in prostate epithelium is sufficient to drive collagen reorganization, we expressed an inducible form of beta catenin in a subset of mouse prostate luminal epithelial cells. Prostate tissue sections revealed regions of hyperplasia characterized by excessive beta catenin protein expression intermixed with histologically normal epithelium. Importantly, there are no obvious histological differences between prostate epithelial cells overexpressing beta catenin or expressing normal levels of beta catenin. Beta catenin immunostaining is needed to distinguish these cell types. To meet our goal of quantifying collagens locally around beta catenin overexpressing cells, it was necessary to visualize collagen fibers and beta catenin protein distribution in the same tissue section, a procedure that was not previously possible with traditional PSR staining protocols.
Tissue sections were stained with PSR, imaged, destained, immunolabeled, and imaged again. The fluorescent PSR signal was quantified across mouse prostate tissue sections with ROIs being identified as either normal or beta catenin overexpressing. PSR staining was overlaid and average fiber diameter, average fiber length, and fiber density were quantified using CT-FIRE. Results of the automated quantification showed that overall collagen fiber density was unchanged between regions; however, the average fiber length was significantly increased in regions with beta catenin overexpression (Fig. 5).
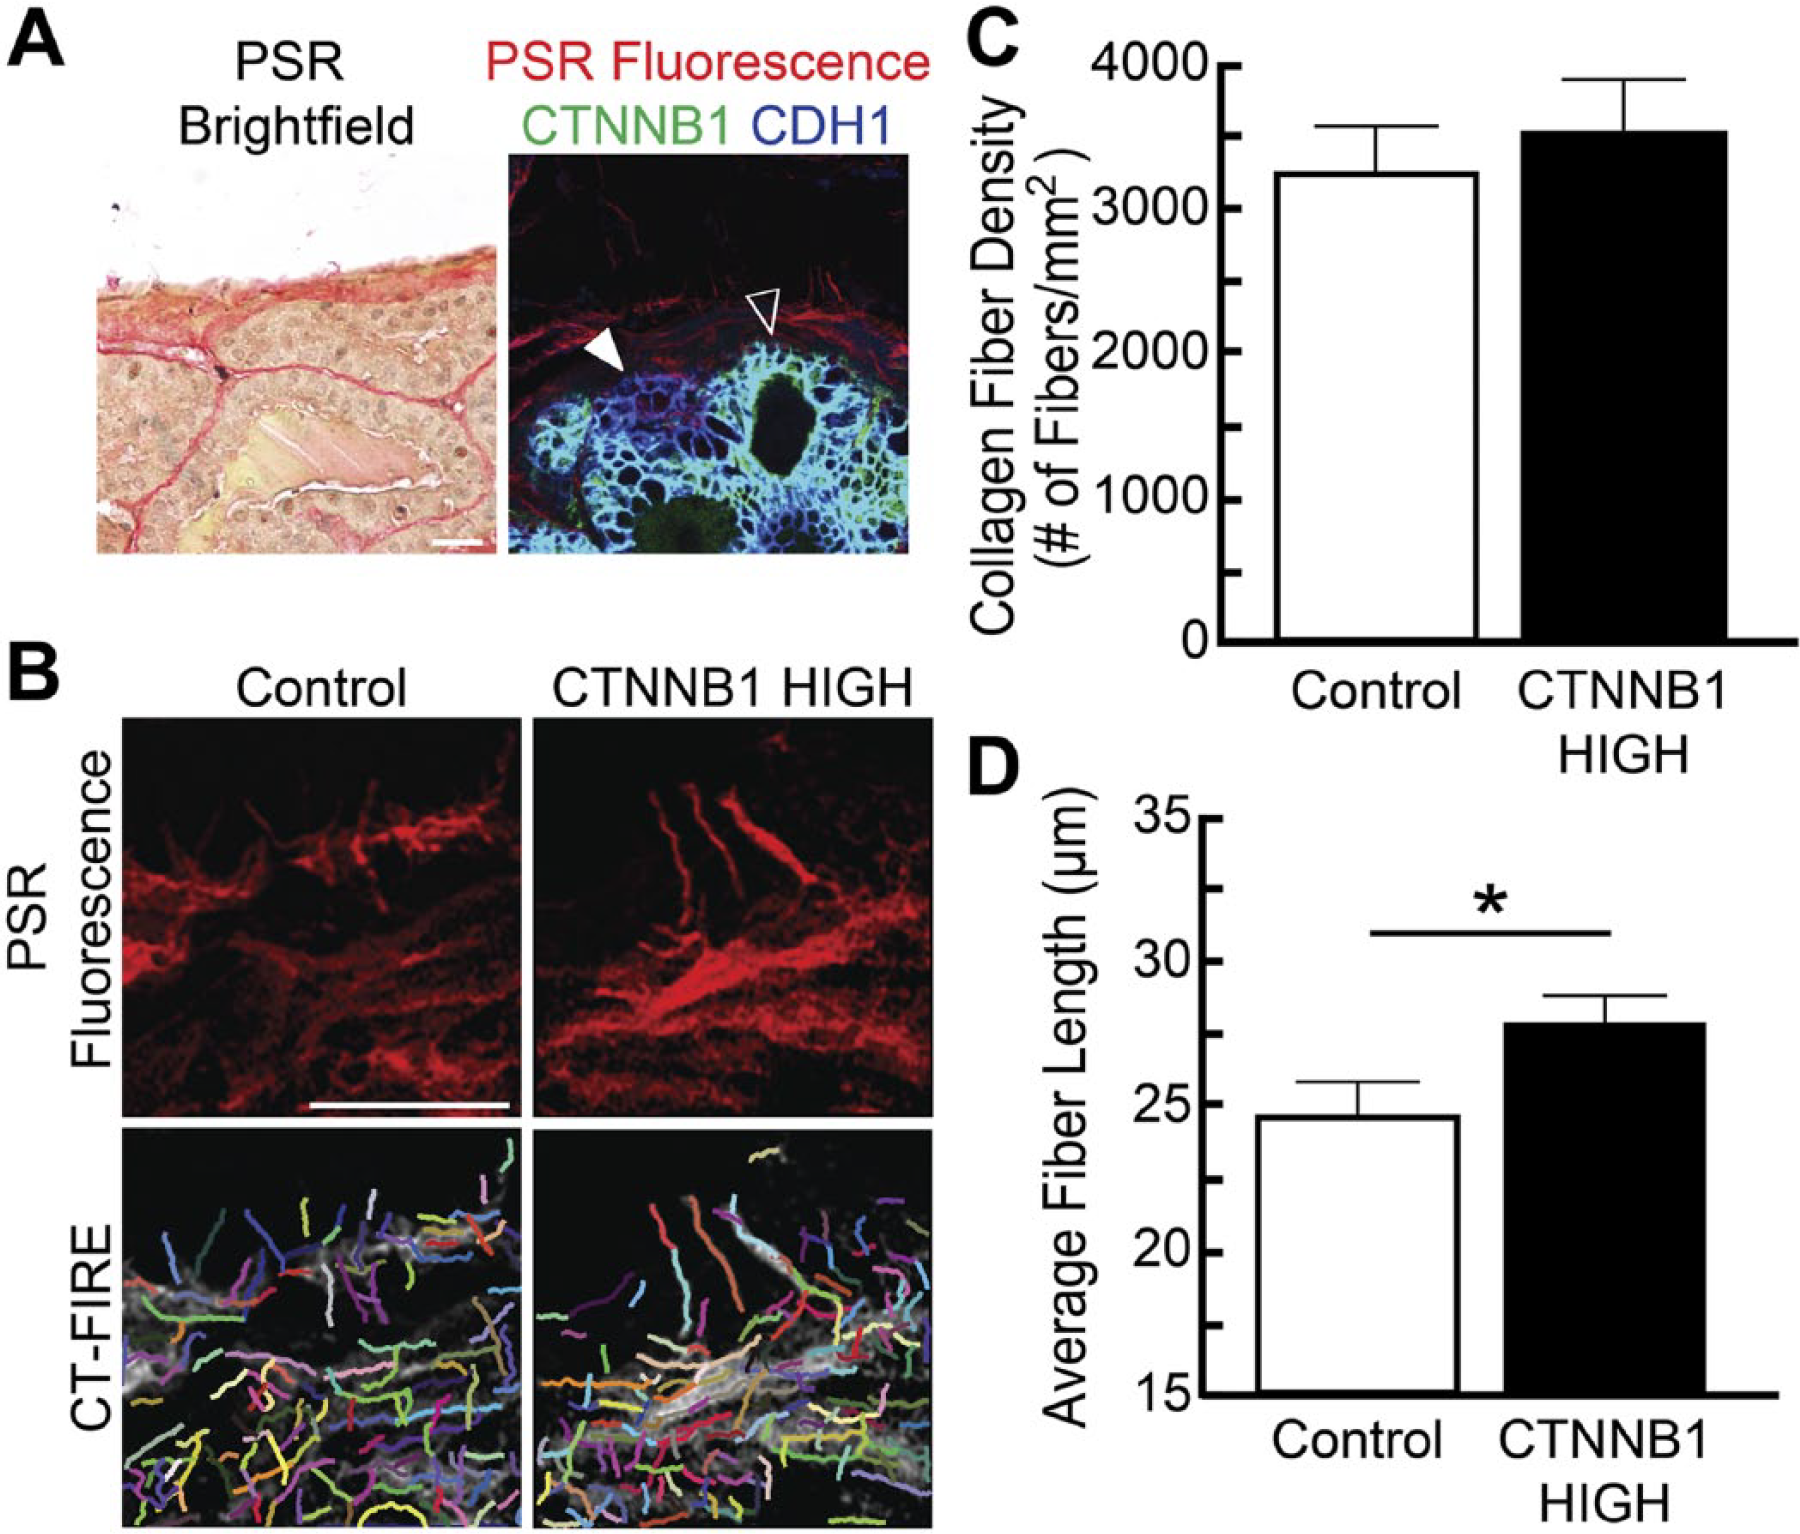
Activated beta catenin signaling in prostate epithelial cells results in localized changes to the collagenous extracellular matrix. (A) Mouse prostate tissue sections (5 µm) were generated from mice with heterogeneous activation of beta catenin signaling in prostate epithelium and stained with the traditional PSR and hematoxylin method or PSR and IHC. Using PSR and hematoxylin it is unclear which cells have activated beta catenin signaling. PSR paired with IHC allows for the precise identification of beta catenin expression in the prostate epithelium. Closed arrows mark regions with basal levels of beta catenin signaling (control) and open arrows represent areas of high levels of beta catenin signaling (CTNNB1 HIGH). (B) Prostate stromal collagen fibers within 50 µm of the epithelial-stromal boundary were quantified using CT-FIRE software. (C and D) Fiber density remained unchanged between regions but the average length of collagen fibers was significantly increased in areas adjacent to epithelium with high levels of beta catenin activity. Results are mean ± SE of n≥17 ROIs. Significant differences were observed among groups (p<0.05). Abbreviations: PSR, picrosirius red; IHC, immunohistochemistry; CTNNB1, beta catenin; ROI, region of interest; CDH1, cadherin 1. Scale bar = 25 µm.
Discussion
We have found that fluorescent imaging of PSR provides the necessary resolution to quantify subtle collagen fiber metrics using computer software and is more sensitive than polarized light microscopy. As the role of collagen in cell behavior and tissue homeostasis becomes more apparent, new methods are required to detect subtle changes in collagen fiber organization beyond gross content. Recent studies are revealing that collagen fiber density, alignment, orientation, length, and diameter are all associated with pathologies throughout the body.32–36 However, many studies using PSR rely on relatively rudimentary, semi-quantitative analyses that only assess gross content or polarized color distribution, not individual fiber metrics.37–41 Linear polarization microscopy of PSR-stained tissue is widely used and has been shown to be compatible with automated quantification of individual fiber metrics, 42 and is also subject to orientation-dependent changes in appearance. 16 Polarization microscopy relies on the enhanced dichroism detected through the measurement of birefringence using cross-polarizers. The amount of light transmitted through the two polarizers is largely determined by the angle between the azimuth of polarization of the incident light and the transmission axis of the analyzer. 43 As collagen orientation changes, the optical axis also changes, resulting in signal intensity changes that can cause the discontinuities observed in Fig. 1 or result in inaccurate fiber segmentation when analyzed using software.
Our results indicate that fluorescent PSR imaging also appears to reveal more continuous fibers than SHG microscopy, the current gold standard in collagen imaging. SHG, which is specific to non-centrosymmetric molecules such as collagens I, II, and III is also highly orientation dependent. Generating strong, detectable SHG signal requires some degree of alignment between light polarization and collagen fiber direction (SHG signal is maximum for zero degrees and minimum for 90 degrees of angle between light polarization and fiber angle).44,45 Due to the relatively small size of individual collagen fibrils (less than 50 nm), there are often multiple fibrils in one focal volume, and recorded signal is emanated from all the fibrils inside the focal volume (the signal from one fibril is too weak to detect). 46 Two fibrils with opposite polarities generate signals that completely cancel each other. As SHG stems from the coherent summation of several fibrillar responses in every pixel, the relative polarity between adjacent fibrils can highly affect the signal intensity. Antiparallel alignment of fibers or portions of fibers can result in interrupted signal detection and discontinuous fiber segmentation. Fluorescent imaging of PSR-stained tissue relies on the fluorescence of the Sirius red dye molecule that binds specifically to collagens. Because fluorescent imaging relies solely on the presences of the Sirius red dye, the signal emanated from the stain should reflect the collagen content more accurately than SHG or polarized light microscopy, which are blind to collagen fibers oriented parallel to the light axis and have difficulties representing a smooth and continuous image of collagen fibers.
We demonstrate a new method that successfully pairs IHC with fluorescent PSR staining to target specific regions of interest for analysis and thereby increase our ability to fully elucidate the interactions between cells and their collagenous environment. Collagen-specific data alone are not sufficient to guide this region of interest selection as it does not provide information about the cellular environment within the collagen matrix. This restricts testable hypothesis to assessment of histological changes without addressing the molecular changes that may precede them. Multiplexing collagen detection techniques with IHC enables researchers to assess collagenous changes localized to regions of interest that could include pre-cancerous cells, immune cell infiltrate, active cellular signaling, tumor boundaries, or cells undergoing induced gene recombination. SHG may be applicable in some cases because it is deployed on a multiphoton laser scanning microscope (MPLSM) 47 and, in a limited form, can be paired with IHC to simultaneously view collagen and selected features within a tissue section. However, the tuning range of traditional MPLSM excitation sources, 48 renders certain antibody fluorophores (particularly red fluorophores) incompatible, whereas there are no such antibody fluorophore limitations when PSR fluorescence imaging is paired with IHC. Furthermore, SHG and MPLSM are expensive solutions that are not deployed in most histology cores and end-user laboratories. Although simultaneous visualization of PSR and IHC is likely impossible due to the incompatibility of PSR with antigen unmasking techniques, 24 we have demonstrated that PSR can be sequentially multiplexed with IHC, adding a completely new dimension to traditional collagen quantification. As proof of concept for this approach, we have shown that beta catenin signaling in prostate epithelium lengthens surrounding collagen fibers locally, which reveals a novel mechanism by which collagen is organized in the prostate. In summary, our method of fluorescence PSR microscopy coupled with fluorescent immunostaining is sensitive, robust, and offers a new opportunity to quantify collagen locally around immunohistochemically labeled regions of interest. This procedure provides new opportunities for revealing new relationships between molecular markers of cell behavior and the role of collagens in controlling such cell behaviors.
Footnotes
Acknowledgements
We acknowledge the assistance of Guneet Mehta and Yuming Liu in the development and support of the CT-FIRE collagen analysis software.
Competing Interests
The author(s) declared no potential conflicts of interest with respect to the research, authorship, and/or publication of this article.
Author Contributions
KAW and CMV conceived and designed the study with technical input from AK and KWE. KAW and AK performed all experiments. KAW, AK, KWE, and CMV contributed to the writing of the manuscript.
Funding
The author(s) disclosed receipt of the following financial support for the research, authorship, and/or publication of this article: The study was supported by National Institutes of Health Grants R01DK099328, U54 DK104310, T32 ES007015, and R01CA179556. The content is solely the responsibility of the authors and does not necessarily represent the official views of the National Institutes of Health.