
Abstract
We have developed a quantitative microscopic method to determine changes in the orientation of collagen fibers in the dermis resulting from mechanical stress. The method is based on the use of picrosirius red-stained cryostat sections of piglet skin in which collagen fibers reflect light strongly when epipolarization microscopy is used. Digital images of sections were converted into binary images that were analyzed quantitatively on the basis of the length of the collagen fibers in the plane of the section as a measure for the orientation of the fibers. The length of the fibers was expressed in pixels and the mean length of the 10 longest fibers in the image was taken as the parameter for the orientation of the fibers. To test the procedure in an experimental setting, we used skin after 0 and 30 min of skin stretching. The orientation of the fibers in sections of control skin differed significantly from the orientation of fibers in sections of skin that was stretched mechanically for 30 min [76 ± 15 (n = 5) vs 132 ± 36 (n = 5)]. The method described here is a relatively simple way to determine (changes in) the orientation of individual collagen fibers in connective tissue and can also be applied for analysis of the orientation of any other structural element in tissues so long as a representative binary image can be created.
Keywords
C
Quantitative analyses of collagen have been described by Ferdman and Yannas (1993), Moragas et al. (1998), and De Vries et al. (2000). These methods provide general information only for, e.g., orientation of collagen fibers, but not for that of individual collagen fibers. The method in the present study was developed to enable quantitative determination of changes in the orientation of individual collagen fibers in the dermis. The skin used to develop this method was obtained in a study of the effects of skin stretching to close large wounds in piglets. In this study we investigated the changes that take place in the various layers of skin when skin is stretched beyond its natural yield over a time span of 30 min by means of mechanical forces (Melis et al. 2001a, 2002). The present quantitative method is based on specific staining of collagen fibers with picrosirius red, which allows the visualization of individual collagen fibers on the basis of double refraction of light against a black background when epipolarization microscopy is used (Junqueira et al. 1979). Because of the large contrast, it is possible to create representative binary images to establish the length of collagen fibers quantitatively in the plane of sections using digital microscopy. In this way, changes in orientation resulting from skin stretching can be determined.
Materials and Methods
Stretching of Piglet Skin
In (plastic) surgery, stretching of skin is frequently necessary to close large wounds. One of the methods is based on the use of the Sure Closure skin stretching device (Figure 1). The technique has been described by Hirshowitz et al. (1993) and has been applied by us on piglet skin as described in detail by Melis et al. (2001, 2002). Briefly, a square piece of skin of 9 × 9 cm was excised on the sides of the piglets under general anesthesia. Two straight needles of the skin-stretching device were placed through the dermis opposite each other and at 0.5 cm distance from the wound margin. The skin-stretching device was then placed in position with its U-shaped arms anchored behind the intradermal needles. In this way, the hooks of the arms abut against the intradermal needles which, in turn, distribute the stretching force along the length of the wound margin. By turning the tension screw of the device, approximation of the skin and subcutaneous tissue was performed with a maximal applied force of 2.5 kg. The wounds were closed using the principle of cycle loading. This method involved 4 min of stretching of the skin, followed by 1 min of relaxation by unlocking the system to restore blood circulation in the stretched skin tissue. This cycle was repeated six times over a total period of 30 min.
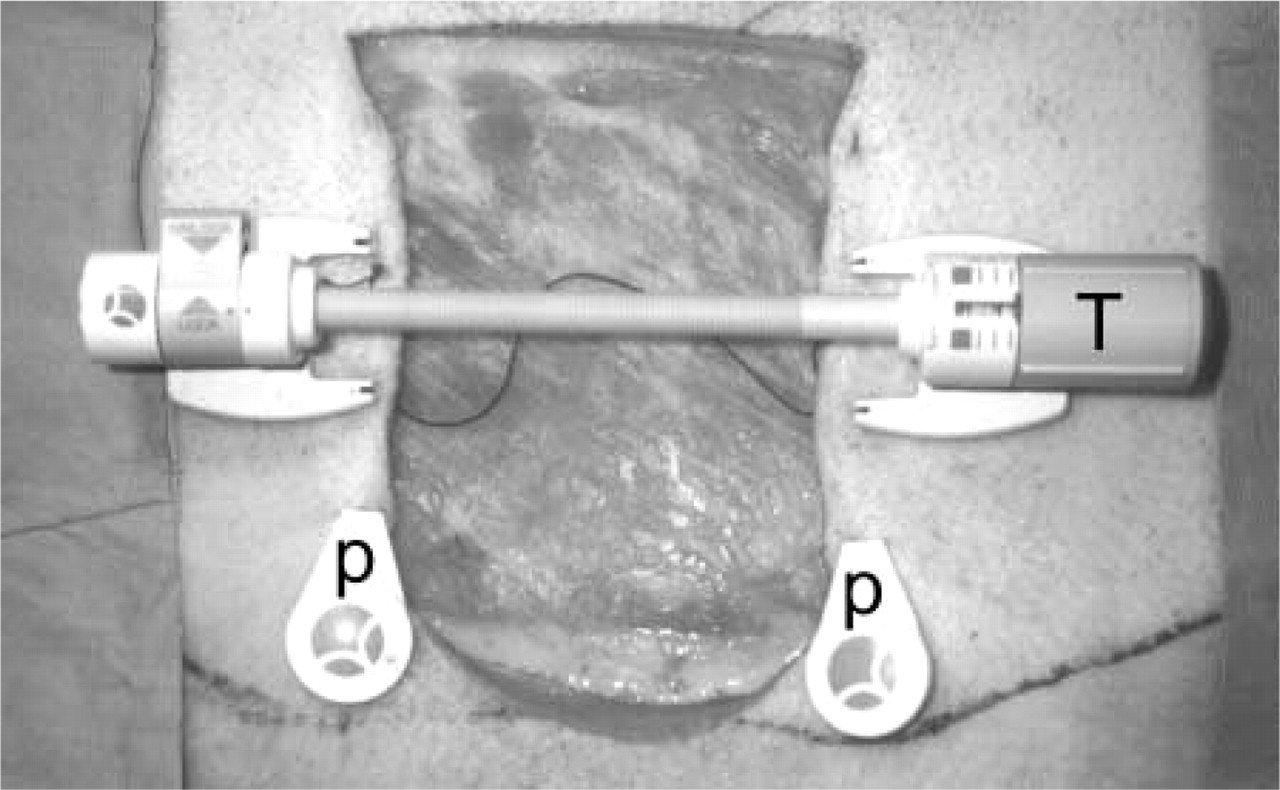
Experimental setup for skin stretching in young piglets. The Sure Closure Skin Stretching device is placed in the wound margins. The ends of the two steel needles (P), which distribute the stretching force along the length of the wound margin, are shown. By turning the tension screw (T), approximation of the skin is performed.
Sampling of Biopsies
At the beginning of the experiment and after 30 min of skin stretching, biopsies were taken at 0.5 cm from the wound margin. Biopsies had a size of 3 × 10 × 10 mm. After sampling of a biopsy specimen, it was placed on cork using water-soluble glue and the specimen was embedded in a solution of 7% gelatin (Merck; Darmstadt, Germany) in distilled water in a mold (Van Noorden and Vogels 1986). In this way, orientation of the biopsy and the cutting edge for sectioning were determined. The gelatin-embedded biopsy in the mold was fixed by freezing as quickly as possible in liquid nitrogen at −196C. Biopsies were stored at −80C.
Sectioning and Staining of Sections
To keep the structure of the dermis intact during sectioning and to visualize collagen fibers separately, optimal section thickness was determined by varying section thickness between 3 and 30 μm. After determination of the optimal section thickness, staining methods were tested to specifically stain collagen fibers while other structures in the dermis were stained as little as possible. It is essential for image analysis to optimize contrast between collagen fibers and background (Chieco et al. 2001).
Sections of the biopsy specimens were cut in a cryostat (Bright; Huntingdon, UK) at a low but constant speed to ensure constant section thickness at −25C. Sections were captured on glass slides and kept at −25C. A series of cryostat sections (3 and 5 μm thick) was also captured on adhesive tape (Scotch Tape 800; 3 M, Leiden, The Netherlands) before the sections were adhered to glass slides as described by Van Noorden and Vogels (1986) to keep the structure of the tissue in the sections intact.
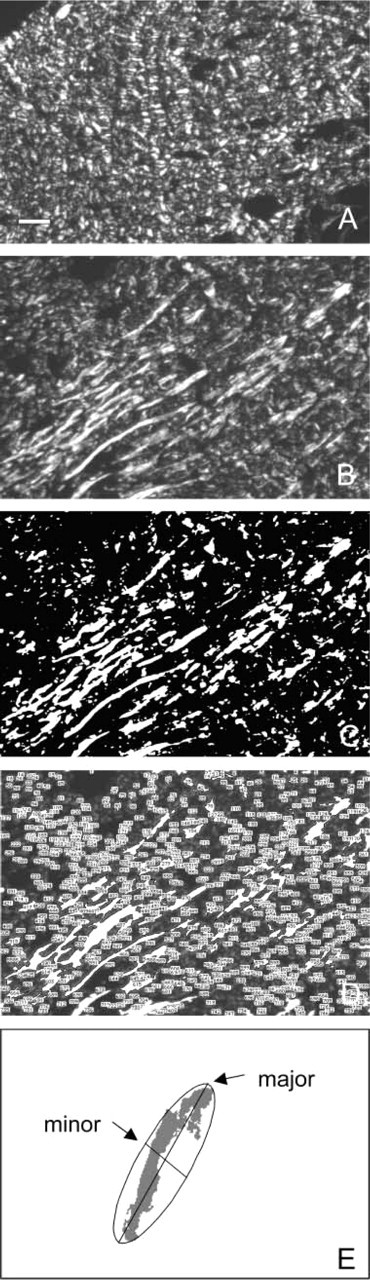
The following staining methods have been tested to select the method that stains collagen fibers with optimal contrast: Giemsa, Shoobridge, hematoxylin-eosin (H&E), Mallory, van Gieson, and picrosirius red. The picrosirius red-stained sections were analyzed with epipolarization microscopy according to Junqueira et al. (1979). Sections were placed between two crossed polarization filters (polarizer slider AH2-KPO and analyzer slider AH2-AN45; Olympus, Tokyo, Japan), and images of serial sections were captured with a video camera (4910; Cohu, Tucson, AZ) at a low magnification (X5) (Figures 2A and 2B). Images of 768 × 512 pixels were made of areas with a size of 1.2 mm X 0.8 mm of the reticular dermis. One pixel covered a surface of 1.6 μm X 1.6 μm in the section.
Quantitative Analysis of the Length of Collagen Fibers in the Plane of Sections
Digitally captured images of sections were analyzed with the use of the image analysis software NIH Image (version 1.57; by Wayne Rassband and available via internet from http://rsb.info.nih.gov). The procedure of image analysis to quantitatively determine the length of collagen fibers in the plane of sections as a parameter for orientation of the fibers consisted of the following steps: (a) a gray level was determined automatically as threshold, to produce a binary image in which background is colored black and collagen fibers are colored white (Figure 2C). An iterative testing technique, based on a histogram that divides the data into two populations (Ridler and Calvard 1979), was used to produce the binary image; (b) an analysis was performed to number all white objects in the image (Figure 2D); (c) the best fitting oval was calculated for each numbered white object (Figure 2E); (d) the shortest and longest diameters of the oval were determined in numbers of pixels and were named minor and major axis, respectively; (e) these axes were calculated for all white objects and results were copied into a spreadsheet; (f) data in the spreadsheet (Excel 3.0; Microsoft, Seattle WA) were sorted on the basis of the length of the major axis, with the longest major axis at the top and the shortest at the bottom; (g) the mean length of the 10 longest major axes was determined. This mean length was considered to be the parameter for orientation of collagen fibers in the plane of the section. The mean value of the parameter, based on three serial sections of a specimen, was called the collagen alignment index; (h) the collagen alignment indices of control and stretched skin were compared and differences were analyzed, using a paired t-test with p = 0.05 as level of significance.
Results
Preparation of cryostat sections of piglet skin biopsies was hampered by the fat layer underneath the dermis, which was sticky at −25C. The only way to maintain the integrity of epidermis and dermis in the sections during preparation was sectioning of the biopsies in the direction shown in Figure 3. In this way, sections included epidermis, dermis, and fat layer. We decided to cut sections at constant low speed with a thickness of 7 μm. These sections showed no artifacts and produced a good contrast between collagen fibers and background. Thinner sections caused destruction of tissue, whereas sections that were too thick did not allow discrimination of individual collagen fibers against the background after the various staining procedures. Sections that were captured on adhesive tape after sectioning were comparable in quality to sections that were captured directly on glass. A disadvantage of the use of tape was that the glue dissolved in acids that are present in a number of staining solutions, such as that of picrosirius red. Therefore, capturing of sections on tape was not performed. Sections cut from stretched skin did not retract or shrink because the biopsy specimens were excised during the period of rest when stretching forces were not exerted on the skin. The width and length of the sections corresponded with those of the face of the frozen tissue blocks.
Epipolarization microscopic image of control skin (
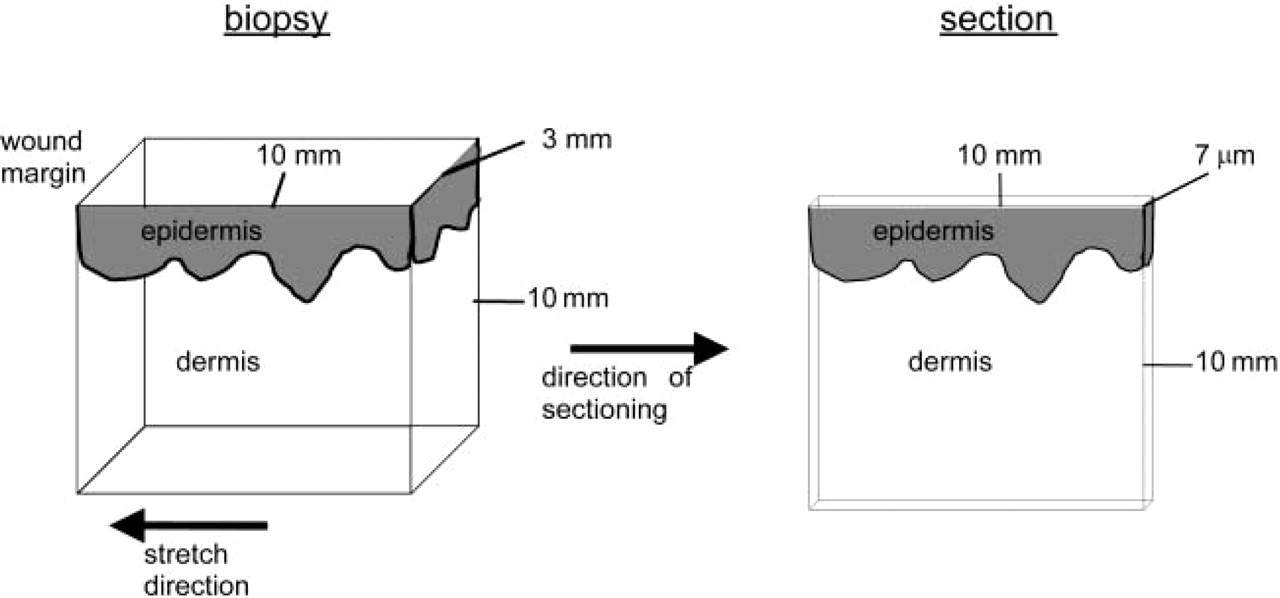
Drawing of a pig et skin tissue block and a section cut from the block. The vectors indicate the direction of the stretching force and the direction of cutting the section.
Testing of the various staining methods to obtain optimal contrast between collagen fibers and background had the following results. The Giemsa and H&E methods were not specific enough for collagen (Figure 4A). Collagen fibers could barely be discriminated. The Shoobridge, Mallory, and van Gieson staining methods were far better in that aspect. It was possible to discriminate collagen fibers in the sections. Unfortunately, these staining methods had the disadvantage that too low a contrast was obtained between collagen fibers and other structures in the sections.
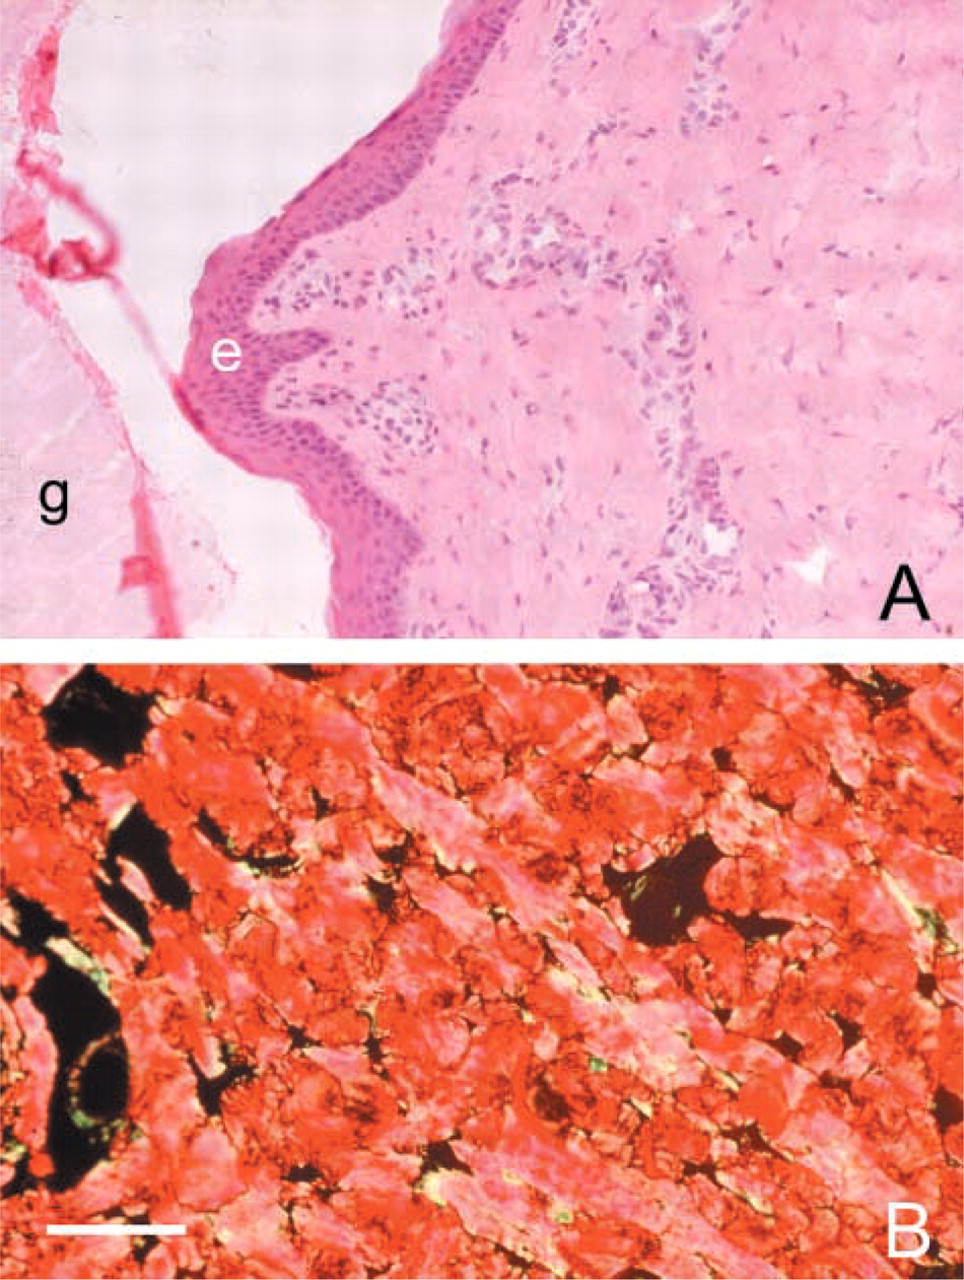
Sections of piglet skin after staining with H&E (
In addition to collagen fibers, glands and muscles were stained, so that no specific segmentation of collagen fibers could be performed. The picrosirius red staining method in combination with epipolarization microscopy appeared to be the most suitable method to visualize collagen fibers with high contrast. The unique aspect of the picrosirius red staining is that dye molecules bind in a specific way to collagen fibers, which enhances double refraction of the fibers. When sections stained with picrosirius red were analyzed by epipolarization microscopy, collagen fibers reflected clearly against a black background (Figure 4B).
The first step in the analysis of the digital images of picrosirius red-stained sections (Figure 2B) was to automatically determine a gray level as threshold to obtain binary images (Figure 2C). This step optimized contrast between collagen fibers and background and reduced misidentification due to incorrect positioning of collagen fibers in the plane of the sections. This misidentification can be recognized in Figure 2B as dark gray objects. After enumeration of the objects in the image (Figure 2D), best-fitting ovals surrounding each object were calculated. The major advantage of using the best-fitting oval, instead of, e.g., the circumference of the fibers, is the possibility of excluding the influence of irregularities in the contours of fibers and small branches from the results.
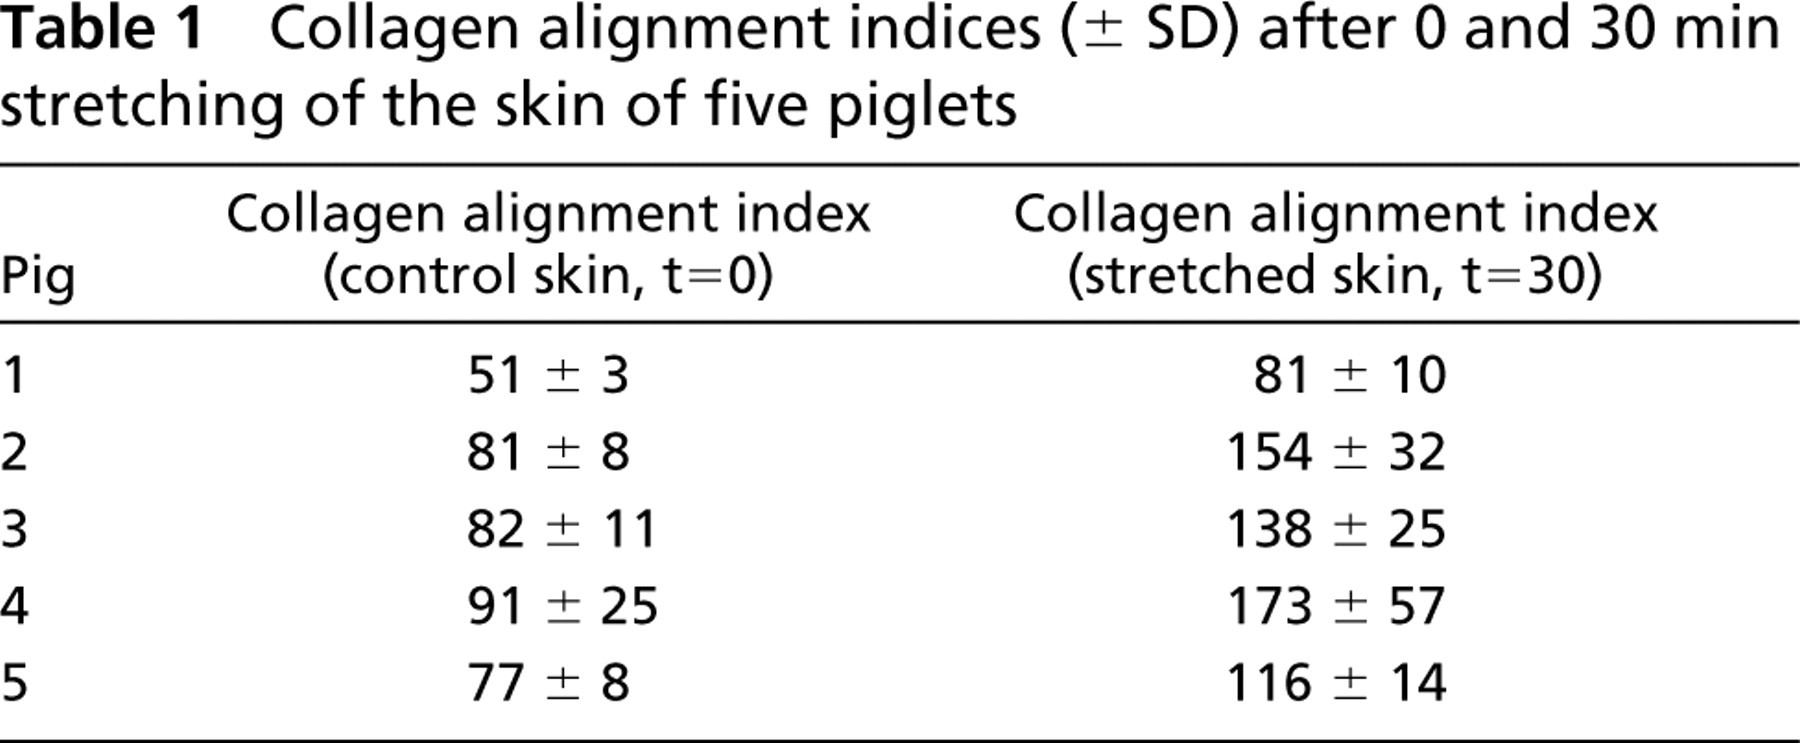
To test the procedure in an experimental setting, we used skin after 0 and 30 min of skin stretching. The collagen alignment indices are shown in Table 1 for five piglets. Control skin had a mean collagen alignment index of 76 ± 15. The mean collagen alignment index of stretched skin (30 min) was 132 ± 36, which was significantly different from the control skin (p<0.005). These quantitative data and their differences were in agreement with qualitative microscopic analysis of the sections (Figures 2A and 2B).
Collagen alignment indices (± SD) after 0 and 30 min stretching of the skin of five piglets
Discussion
The picrosirius red staining method, in combination with epipolarization microscopy as described by Junqueira et al. (1979), appeared to be the most suitable method to visualize individual collagen fibers and to quantitatively determine their length in the plane of tissue sections. Only collagen fibers were visualized and other structures in the skin, such as glands and muscles, were not visible. The large contrast of the stained fibers against a black background not only enabled qualitative analysis of orientation of the fibers but also enabled quantitative digital image analysis. In this study, most of the collagen fibers reflected in red. This is an indication that these collagen fibers are relatively thick because thin collagen fibers appeared as yellow or green (Junqueira et al. 1982). Some collagen fiber endings appeared yellow or green, indicating that these endings are thinner (Figure 4B). A possible explanation could be that, as a result of mechanical stress, collagen fibers rupture.
The collagen alignment index appeared to be a good parameter to express changes in orientation of collagen fibers. The mean value in control skin was significantly lower than that in stretched skin, which was in agreement with data obtained with qualitative microscopic inspection. By using the quantitative method described here, it was possible to collect valid data on the orientation of collagen and changes in the orientation due to mechanical skin stretching (Melis et al. 2002). Whether these changes in orientation of collagen fibers in the plane of sections were a consequence of rapid changes in the spatial distribution of collagen fibers or elongation of collagen fibers by, e.g., aligning of individual fibrils, is not yet completely clear. However, the study of Melis et al. (2002) and the data from the present study suggest that rapid changes in the orientation of collagen fibers take place as a consequence of mechanical stress.
Collagen fibers became rapidly orientated in the direction of the force exerted on the fibers. The molecular processes that are the basis of these rapid changes in orientation of ECM components are unknown but will be the subject of further studies. Understanding of these processes not only has histological importance but also is of major importance for the (plastic) surgeon. Knowledge about mechanical properties of skin helps the (plastic) surgeon to predict and optimize results of different treatments, e.g., to close large wounds.
Other quantitative methods to establish changes in the orientation of collagen have been described (Ferdman and Yannas 1993; Moragas et al. 1998; De Vries et al. 2000). The methods described by Ferdman and Yannas (1993) and De Vries et al. (2000) are based on the analysis of light scatter. These two methods enable analysis of the mean orientation of collagen in a tissue area, but they do not allow the determination of orientation of individual collagen fibers, which is possible with the method described here. Moragas et al. (1998) described a quantitative method based on digital skeletalization of contours of collagen fibers. With this method, changes in orientation and structure of individual collagen fibers can, in principle, be determined. However, skeletalization of individual collagen fibers appeared not to be representative because the procedure yielded a large number of dendrites or small branches owing to irregularities in the contours of collagen fibers in the stained sections and adherence to other fibers or bifurcation of fibers. When the longest major axes are calculated, this phenomenon does not play a role because of the use of an oval by which involvement of roughness of contours is eliminated. The major axes appeared to be calculated simply and validly on the basis of the binary image.
In conclusion, the present method is a relatively simple tool for the quantitative determination of orientation of collagen fibers in combination with structural information of connective tissue. It can be applied to study dynamics in the ECM induced by, e.g., mechanical stress. Moreover, the present quantitative method can be used for determination of the orientation of any other structural element in a tissue so long as a representative binary image can be created.