
Abstract
Thyroid hormones are essential for the maintenance of pregnancy, and a deficiency in maternal thyroid hormones has been associated with early pregnancy losses. The expression of THRα1, THRβ1 and THRα2 increases with gestational age. The aim of this study was the investigation of the protein and mRNA-levels of THR isoforms THRα1, THRα2, THRβ1 and THRβ2 in normal, spontaneous and recurrent miscarriages. The identification of THR-expressing cells in the decidua was done with double immunofluorescence. The nuclear expression of THRα1, THRα2, THRβ1 and THRβ2 is downregulated at protein level in spontaneous and recurrent miscarriages in villous trophoblast tissue. In decidual tissue, we found a significant downregulation only for THRα1 in spontaneous miscarriages. For recurrent miscarriages, THRα1 and THRβ1 were both significantly downregulated in decidual tissue. By applying HLA-G as a trophoblast marker, we found a significant co-expression only for THRβ2. The results of our study show that thyroid hormone receptors THRα1, THRα2, THRβ1 and THRβ2 are downregulated in spontaneous and recurrent miscarriages. The majority of cells expressing the thyroid hormone receptors in the decidua are decidual stromal cells.
Introduction
Thyroid hormones are essential for the maintenance of pregnancy, and a deficiency in maternal thyroid hormone expression has been associated with early pregnancy losses (Allan et al. 2000). The ligands of thyroid hormone receptors (THR) play a major role in trophoblast differentiation and in fetal neurodevelopment (Ohara et al. 2004). During the development of the fetal central nervous system, thyroid hormones are involved in the migration and growth of the neuronal cells, the establishment of synapses, myelination and corticogenesis (Lopez-Espinosa et al. 2009). After the 10th week of gestation, the presence of high-affinity nuclear binding sites for the thyroid hormone triiodothyronine (T3) can be found in the fetal brain (Bernal and Pekonen 1984). During the 10th and 30th weeks of pregnancy, a two- to three-fold increase in the concentration of thyroxine binding globulin (TBG) and a 30% to 100% increase in total T3 and thyroxine (T4) can occur (Kilby et al. 1998; Fantz et al. 1999). T3 is mostly synthesized from the pro-hormone T4, which originates from the thyroid gland and is converted into T3 through the iodothyronine deiodinase enzymes D1 and D2 (Bianco et al. 2002). Thyroid hormones are involved in gluconeogenesis, lipogenesis, cell proliferation, apoptosis and cell immunity.
Thyroid hormones bind to specific nuclear receptors (THR). Two genes, THRA (NR1A1) and THRB (NR1A2), encode the isoforms THRα and THRβ, which code for the four ligand-binding thyroid receptors, THRα1, THRβ1, THRβ2 and THRβ3, and the four non-ligand binding receptors THRα2, THRΔα1, THRΔβ2 and THRΔβ3 (Robinson-Rechavi et al. 2001; Williams 2000). Whereas the isoforms THRα1, THRα2 and THRβ3 are widely expressed, the expression of THRβ2 is rather restricted to the hypothalamic/pituitary gland (Bassett et al. 2003). The hormone T3 is the high-affinity ligand of THR and thereby regulates gene transcription (Velasco et al. 2007). After it has bound to the ligand binding site, THR switches into its active form and recruits specific co-activators such as SRC1-3, PGC-1, TRAP and TRBP (Lin et al. 1997). A systematic review on THR function in reproductive biology was published recently (Pestka et al. 2013).
The expression of THRα1, THRβ1 and the non-ligand binding THRα2 in the nuclei of syncytiotrophoblasts (ST), cytotrophoblasts, and stromal cells increases with gestational age (Kilby et al. 1998). Maruo et al. (1991) demonstrated that T3 enhances the production of the epidermal growth factor (EGF). This potent growth factor increases the invasiveness of cytotrophoblast cells (Bass et al. 1994) and stimulates the synthesis of human chorionic gonadotropin (hCG) and human placental lactogen by trophoblast cells (Barber et al. 2005). T3 and EGF act synergistically in regulating trophoblast differentiation and proliferation (Barber et al. 2005). It has been further shown that T3 is able to reduce apoptosis of extravillous trophoblasts (EVTs) (Laoag-Fernandez et al. 2004). Hence, due to the inhibition of apoptosis in EVTs, T3 may be able to promote EVT invasion to the decidua (Bass et al. 1994).
The hypothalamic–pituitary–thyroid axis (HPT) and the hypothalamic–pituitary–ovarian axis (HPO) seem to be physiologically related. It is suggested that thyroid hormone receptors located in the ovaries regulate reproductive function, and that estrogens influence the HPT axis as well. Thyroid disorders can lead to bleeding irregularities. Hyperthyroidism can lead to oligomenorrhea or even to anovulatory cycles. Hypothyroidism can result in polymenorrhea. Even if thyroid hormone production is compensated, ovarian function is still affected (Doufas and Mastorakos 2000).
A two-fold increase in miscarriage and stillbirth rates can result from untreated hypothyroidism (Barber et al. 2005). Hyperthyroidism and autoimmunity can also have severe effects on pregnancy outcome. Thus, the maintenance of an euthyroid state is crucial during pregnancy and necessary for the prevention of disturbed placentation syndromes such as preeclampsia and intrauterine growth restriction (IUGR) (Barber et al. 2005). IUGR can cause perinatal and neonatal mortality, physical handicaps in low-birth weight babies, and neurodevelopmental delays in toddlers (Gaffney et al. 1994). Kilby et al. (1998) demonstrated that a reduction in the concentration of free T3 and T4 occurs in the serum of fetuses affected by IUGR. They compared IUGR placental samples with normal pregnancy samples and found that the immunostaining of THRα1, THRα2 and THRβ1 was greater in IUGR placental samples. However, RT-PCR results showed no difference in the expression of the messenger RNA of THR between IUGR and normal pregnancy samples. The upregulation of THR proteins in IUGR is possibly a consequence of the reduction in thyroid hormones in order to maintain euthyroidism in the tissue, with the aim of preventing poor long-term fetal outcomes (Kilby et al. 1998).
Based on this data, the aim of the current study was to systematically investigate the protein and mRNA-level THR isoforms THRα1, THRα2, THRβ1 and THRβ2 in normal, spontaneous and recurrent miscarriages. In addition, the identity of THR-expressing cells in the decidua was also analyzed.
Materials & Methods
Tissue Samples
This study was approved by the Ethical Committee of the Medical School, Ludwig-Maximilian-University of Munich. Informed consent was obtained from each patient. All data has been encoded.
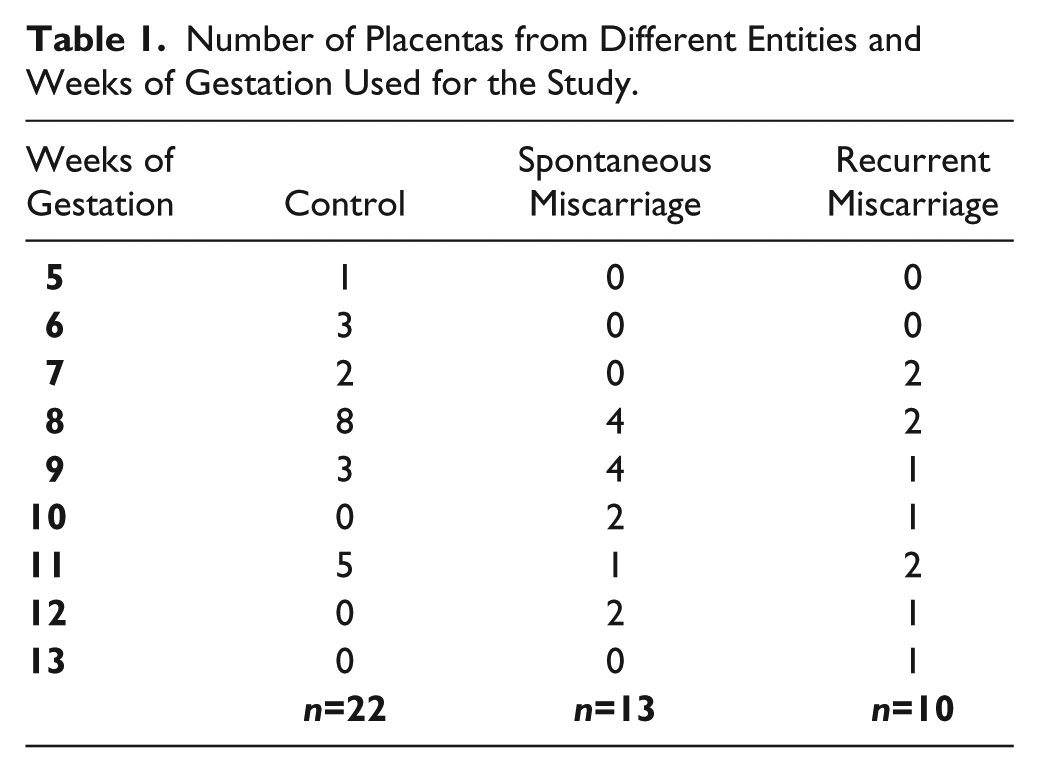
Samples from elective terminations of pregnancies (ETP, 22 cases) were provided from private practice clinics in Munich, Germany. Maternal and gestational age-matched tissues samples from spontaneous miscarriages (SM, 13 cases) and recurrent miscarriage (RM, 10 cases) were additionally collected from the archives of the Department of Obstetrics and Gynaecology-Innenstadt, Munich, Germany. Recurrent miscarriage is defined as ≥3 miscarriages. The mean ages of the women for each group were as follows: SM, 33.8 ± 4.4 years; RM, 34.8 ± 5.8 years; and ETP, 29.7 ± 6.0 years (p>0.05). The mean gestational age for the SM group was 9.6 ± 1.5 weeks; for RM group, 9.6 ± 2.2 weeks, and for the ETP group, 8.3 ± 1.8 weeks (p>0.05). A complete list of placentas obtained from different weeks is presented in Table 1. Samples were obtained by dilatation and evacuation without any prior pharmaceutical induction. In cases of spontaneous and recurrent miscarriages, evacuation was performed within the first 24 hr after diagnosis. All women included in the study had no medical or family history. Hypothyroidism as well as hyperthyroidism were excluded in all women. History taking was systematic, aiming to exclude—apart from common disorders—the possible implication of clotting disorders and autoimmune diseases, already known as aggravating factors for increased risk for miscarriages. In all samples, analysis of chromosomal abnormalities was performed. This study was performed using PowerPlex 16HS multiple PCR system, which detects 16 STR loci, with the limitation of this method in picking up chromosomal abnormalities at base pair level. Analysis was performed for all samples as well as controls. DNA extraction and profiling was performed via the following steps: From placental tissue, DNA was isolated with the help of Bio Robot EZ1 (Qiagen, Valencia, CA) as described by Anslinger et al. (2005). The extracted DNA was eluted in 50 µl double-distilled water and quantified twice with the Quantifiler Human DNA Quantification Kit (Thermo Fisher Scientific; Waltham, MA) according to the manufacturer’s protocol. The arithmetic mean values were calculated. For DNA profiling the PowerPlex® 16HS multiplex PCR system (Promega; Fitchburg, WI) was used, with a total reaction volume of 25 µl, applying a 32-cycle program. For each step, 300 pg DNA was added. The PCR products were analyzed via the ABI PRISM 3130XL capillary electrophoresis system (Thermo Fisher) and the results were generated with the GeneScan® Analysis Software and the ABI Prism® GenoTyper Software version 3.7 (Thermo Fischer Scientific) (Anslinger et al. 2005). Additionally, in all samples, microbiology analysis excluded possible intra-uterine infection. All women had a normal first trimester vaginal swab. Following evacuation, specimens from ETP, RM and SM groups were immediately immersed in formalin and embedded in paraffin or snap-frozen and sectioned with a cryostat.
Number of Placentas from Different Entities and Weeks of Gestation Used for the Study.
Immunohistochemistry
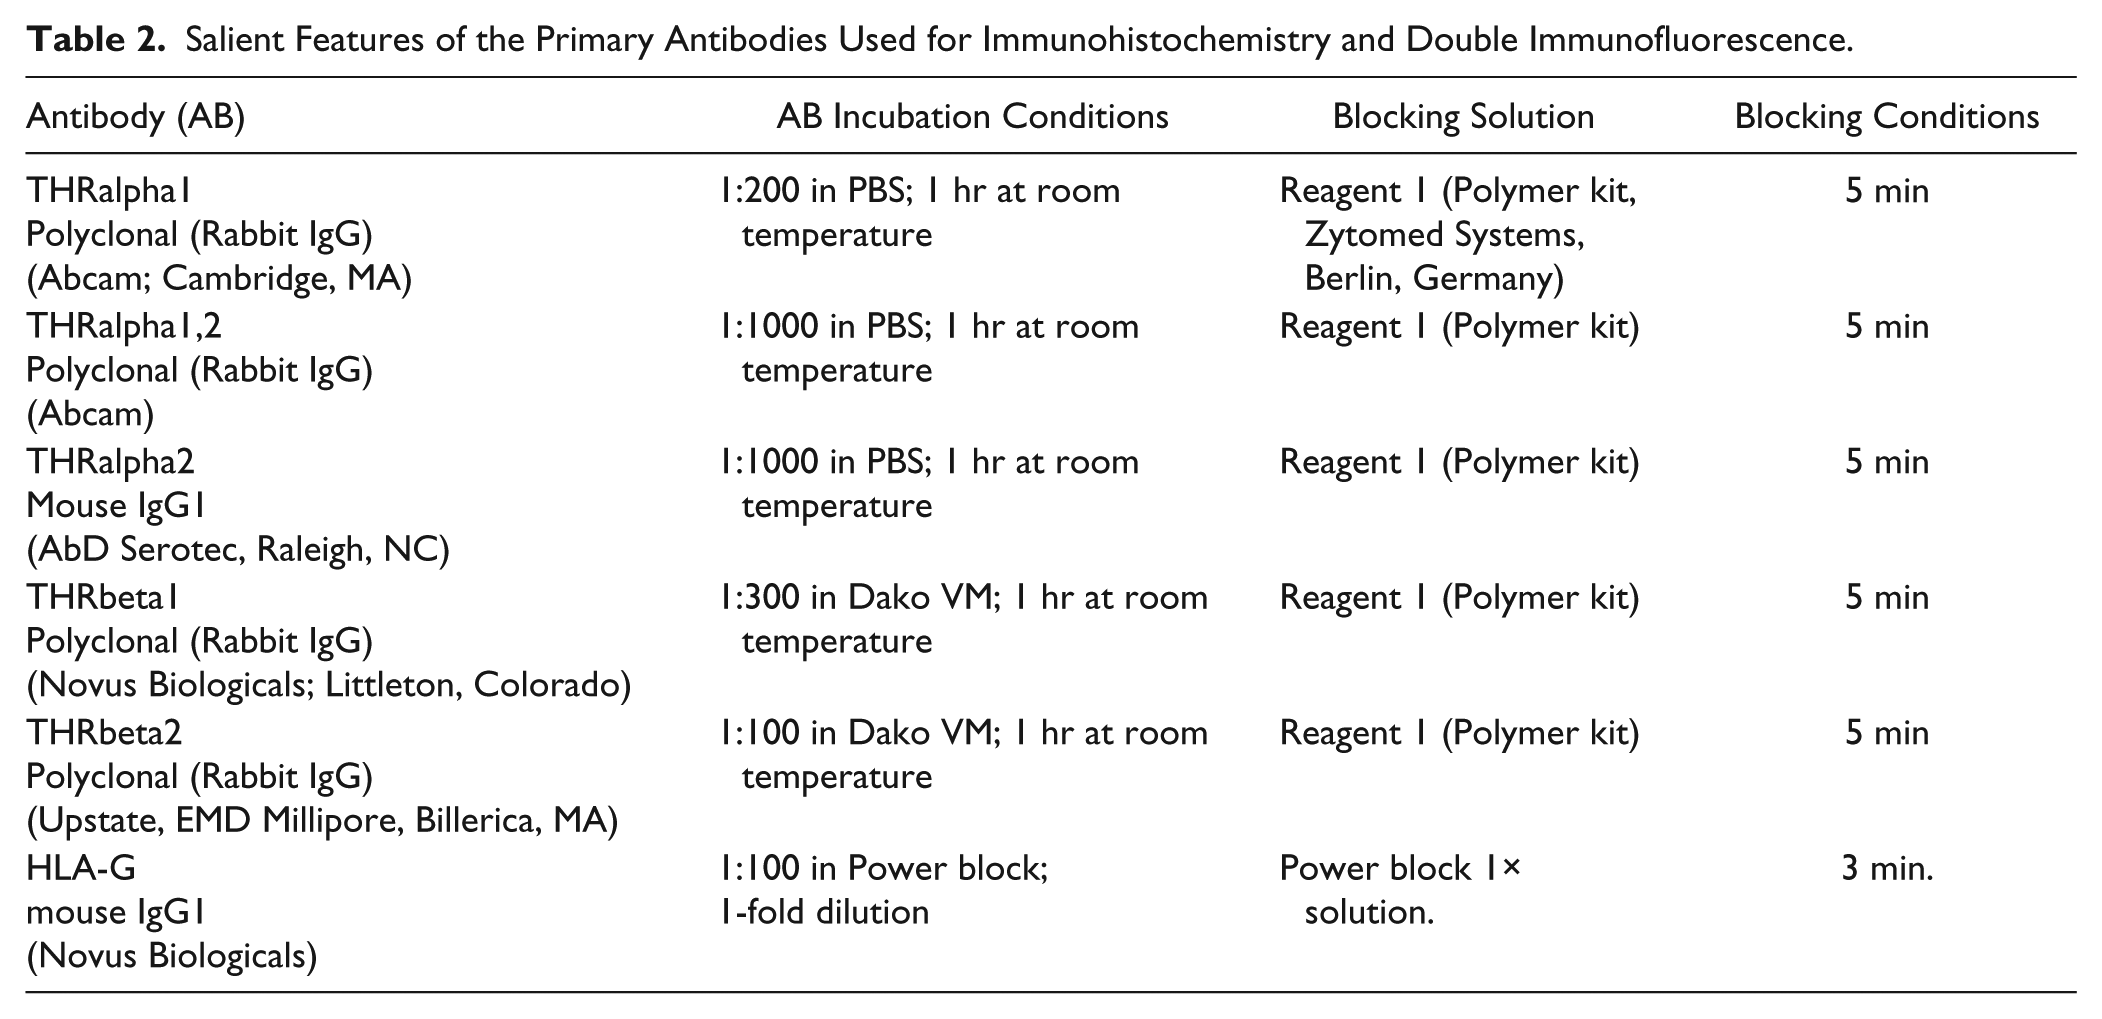
Formalin-fixed paraffin-embedded sections (3 µm) were deparaffinized in xylol, rehydrated in a descending ethanol gradient, and subjected to epitope retrieval in a pressure cooker using sodium citrate buffer (pH 6.0). After returning to room temperature, sections were blocked with 3% H2O2 in methanol (20 min) for endogenous peroxidase activity. Non-specific binding of the primary antibodies was blocked using the appropriate blocking solution. Sections were then incubated with primary antibodies; the salient features of the antibodies used are presented in Table 2. Reactivity was detected by using the Vectastain Elite ABC-Kit (Vector Laboratories, Burlingame, CA) according to the manufacturer’s protocol. Substrate and chromogen (3,3’-diaminobenzidine DAB; Dako, Glostrup, Denmark) were finally added to the slides, which were then counterstained with Mayer’s acidic hematoxylin and covered. Colon (THRα1), term placenta (THRα2) and breast cancer tissue (THRβ1, THRβ2) were used for positive control staining (Fig. 1). Replacement of the primary antibody with mouse or rabbit IgG served as negative controls (Fig. 1).
Salient Features of the Primary Antibodies Used for Immunohistochemistry and Double Immunofluorescence.
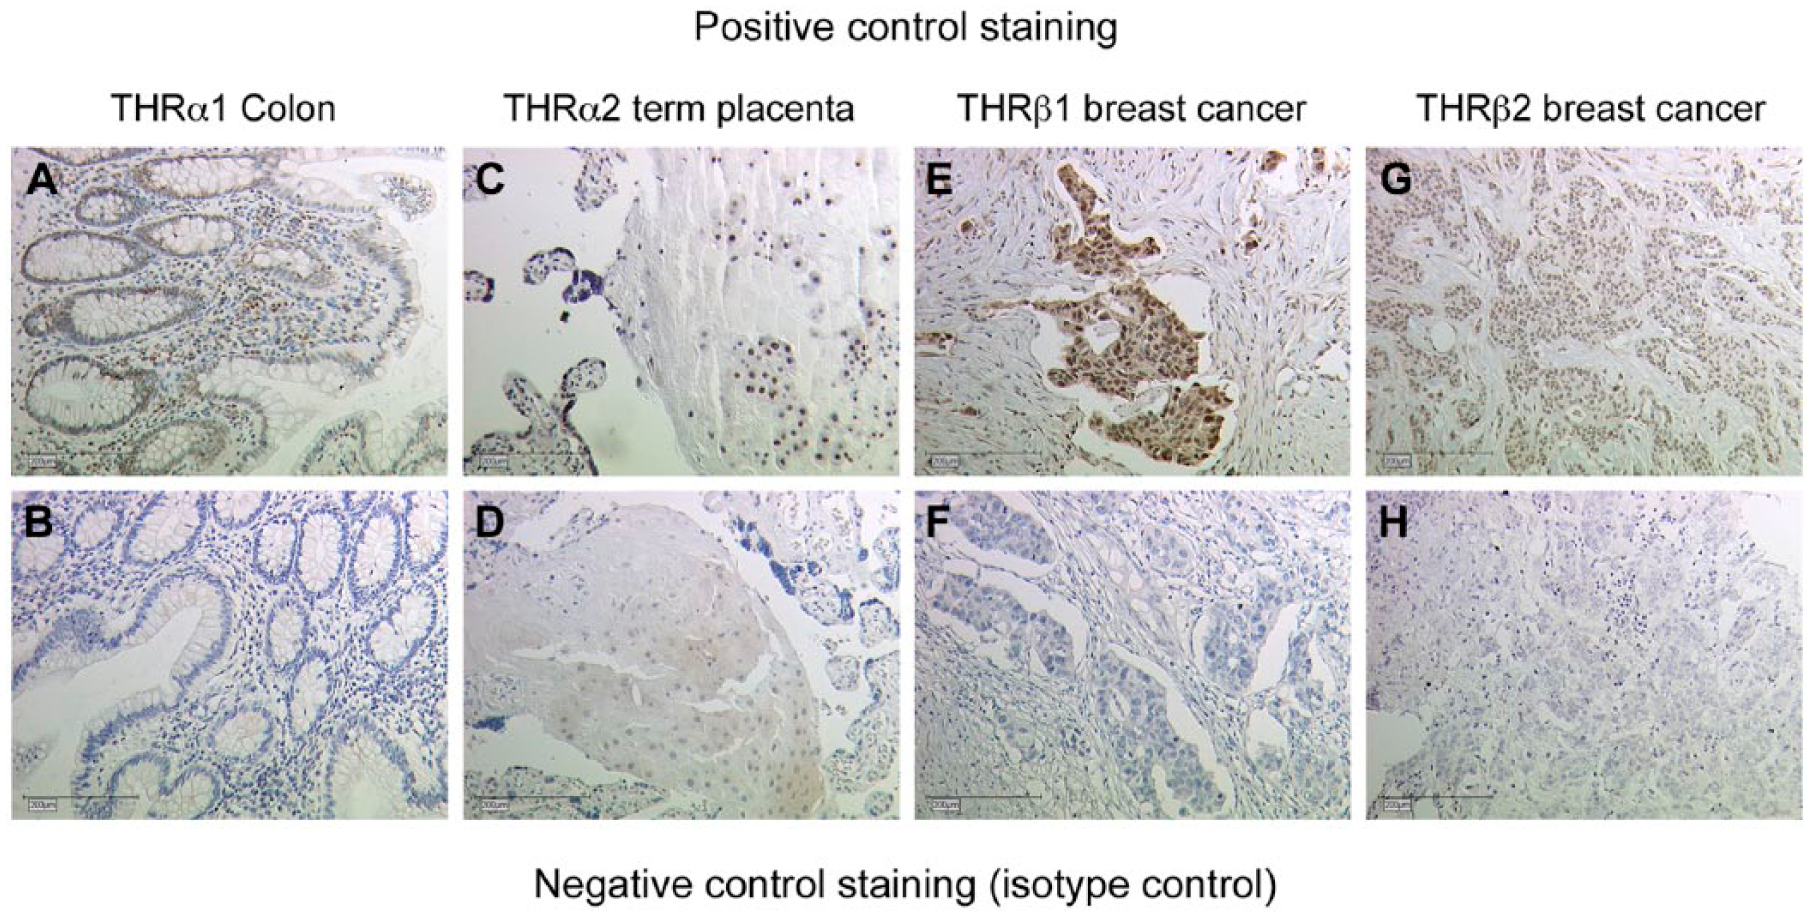
Positive and negative control staining. (A) Colon tissue was used for positive control staining of THRα1 antibodies. THRα1 expression is found specifically in the nucleus of the mucosa (epithelium and pericryptal fibroblast sheath. (B) Negative control staining for (A). (C) Term placental tissue was used for THRα2 positive control staining. THRα2 expression is found in the nuclei of villous as well as extravillous trophoblast cells. (D) Negative control staining for (C). (E) Breast cancer tissue was used for positive control staining of THRβ1 antibodies. THRβ1 expression is found specifically in the nucleus of cancer cells, with high intensity staining, and in the surrounding stroma, with lower intensity staining. (F) Negative control staining for (E). (G) Breast cancer tissue was also used for positive control staining of THRβ2 antibodies. THRβ2 expression is found specifically in the nucleus of the cancer cells and not in surrounding stroma. (H) Negative control staining for (G). Scale, 200 µm.
The sections were examined by two independent observers using a Leitz Diaplan microscope (Leitz, Wetzlar, Germany). Per slide, ten fields were examined using a semiquantitative immunoreactive score (IRS) (Remmele and Stegner 1987). IRS examines the intensity and distribution of antigen expression and is calculated by multiplying the percentage of positively stained cells (0: no staining; 1: <10% of the cells; 2: 11% to 50%; 3: 51% to 80%, 4: >80%) with the intensity of staining of the cells (0: none; 1: weak; 2: moderate; 3: strong).
Identification of THR-expressing Cells in the Decidua with Double Immunofluorescence
Double immunofluorescence staining was performed in order to identify the cells expressing nuclear receptors THRα1, THRα2, THRβ1 and THRβ2 in the decidua. Double immunofluorescence staining was carried out on placentas from healthy pregnancies. The sections were deparaffinized in xylol for 20 min and, after washing in ethanol, were incubated in ethanol/methanol for a further 20 min. Next, the slides were rehydrated in an alcohol gradient and then placed in a pressure cooker with sodium citrate (pH 6.0). The slides were then washed in PBS and blocked with Ultra V blocking solution (Lab Vision, Thermo Scientific) for 15 min. The slides were then incubated with polyclonal anti-THRα/β rabbit IgG (Table 2) for 1 hr. After that, the slides were incubated with monoclonal anti-HLA-G antibody. Sections were then incubated with Cy3-labeled goat-anti-rabbit IgG antibody, diluted 1:500, and Cy2-labeled goat-anti-mouse IgG antibody, diluted 1:100 (Dianova; Hamburg, Germany). Next, the slides were embedded in DAPI containing mounting buffer (Vector Laboratories). The slides were then analyzed with a fluorescence Axioskop photomicroscope (Zeiss; Oberkochen, Germany) and pictures were taken with a digital Axiocam camera system (Zeiss).
Evaluation of THRA and THRB Expression with Real Time RT-PCR (TaqMan)
RNA Extraction from Placental Tissue
Total RNA was extracted from the placental tissues of 13 women with spontaneous miscarriage, 9 women with recurrent miscarriage and 15 normal controls. The RNA was extracted from both trophoblast (fetal cells) and decidua (maternal cells). The RNeasy Lipid Tissue Mini Kit (Qiagen) was used according to the manufacturer’s protocol.
Reverse Transcription
Reverse transcription (RT) was performed with the High Capacity cDNA Reverse Transcription Kit (Applied Biosystems, Weiterstadt, Germany), according to the protocol using a mastercycler gradient (Eppendorf, Hamburg, Germany). RT conditions were 10 min at 25°C, 2 hr at 37°C, and 5 sec at 85°C, followed by a hold step at 4°C.
Real-Time Reverse Transcription-PCR
Optical, 96-well, microtiter reaction plates were covered with optical caps and Real-Time Reverse Transcription PCRs were accomplished in a volume of 20 µl containing 1 µl 20× TaqMan® Gene Expression Assay (Hs00268470_m1 for THRA and Hs00230861_m1 for THRB, both Applied Biosystems), 10 µl 2×TaqMan® Univeral PCR Master Mix (Applied Biosystems), 8 µl H2O (DEPC-treated DI water; Sigma-Aldrich, Taufkirchen, Germany) and 1 µl template. Thermal cycling conditions were 95°C for 20 sec, followed by 40 cycles of amplification with at 95°C for 3 sec and 60°C for 30 sec. The ABI PRISM 7500 Fast (Applied Biosystems) was used for PCR assays. Quantification was carried out by the 2-ΔΔCT method using GAPDH (Hs99999905_m1) as a housekeeping gene.
Statistical Evaluation
The SPSS/PC software package, version 20 (SPSS GmbH; Munich, Germany) was used for data collection and processing as well as analysis of statistical data. Values with p<0.05 were considered statistically significant. Mann–Whitney U test was used for the evaluation of two independent groups. Data were analyzed using a one-way analysis of variance with two independent variables.
Results
Immunohistochemistry
THRalpha1
We identified a strong expression of THRα1, with a median IRS value of 7.5, in nuclei of villous trophoblasts (Fig. 2A). The nuclei of cytotrophoblasts as well as that of syncytiotrophoblasts stained with high intensity, with an abundance of cells showing this intense staining. A similar result was found for the decidua samples. We identified a strong expression of THRα1, with a median IRS value of 6, in the nuclei of decidual cells (Fig. 2B). In placental tissue samples from patients in the SM group, we identified a significant downregulation in THRα1 in villous trophoblasts (Fig. 2C, median = 0; p<0.001) and in decidual cells (Fig. 2D, median = 0.5; p<0.001). In placental tissue samples from RM patients, we also identified a significant downregulation inTHRα1 in villous trophoblasts (Fig. 2E, median = 1; p<0.001) as well as in decidual cells (Fig. 2F, median = 0; p<0.001). A summary of the staining results of villous tissue is presented in Figure 2G and a summary of staining results in decidual tissue is shown in Figure 2H.
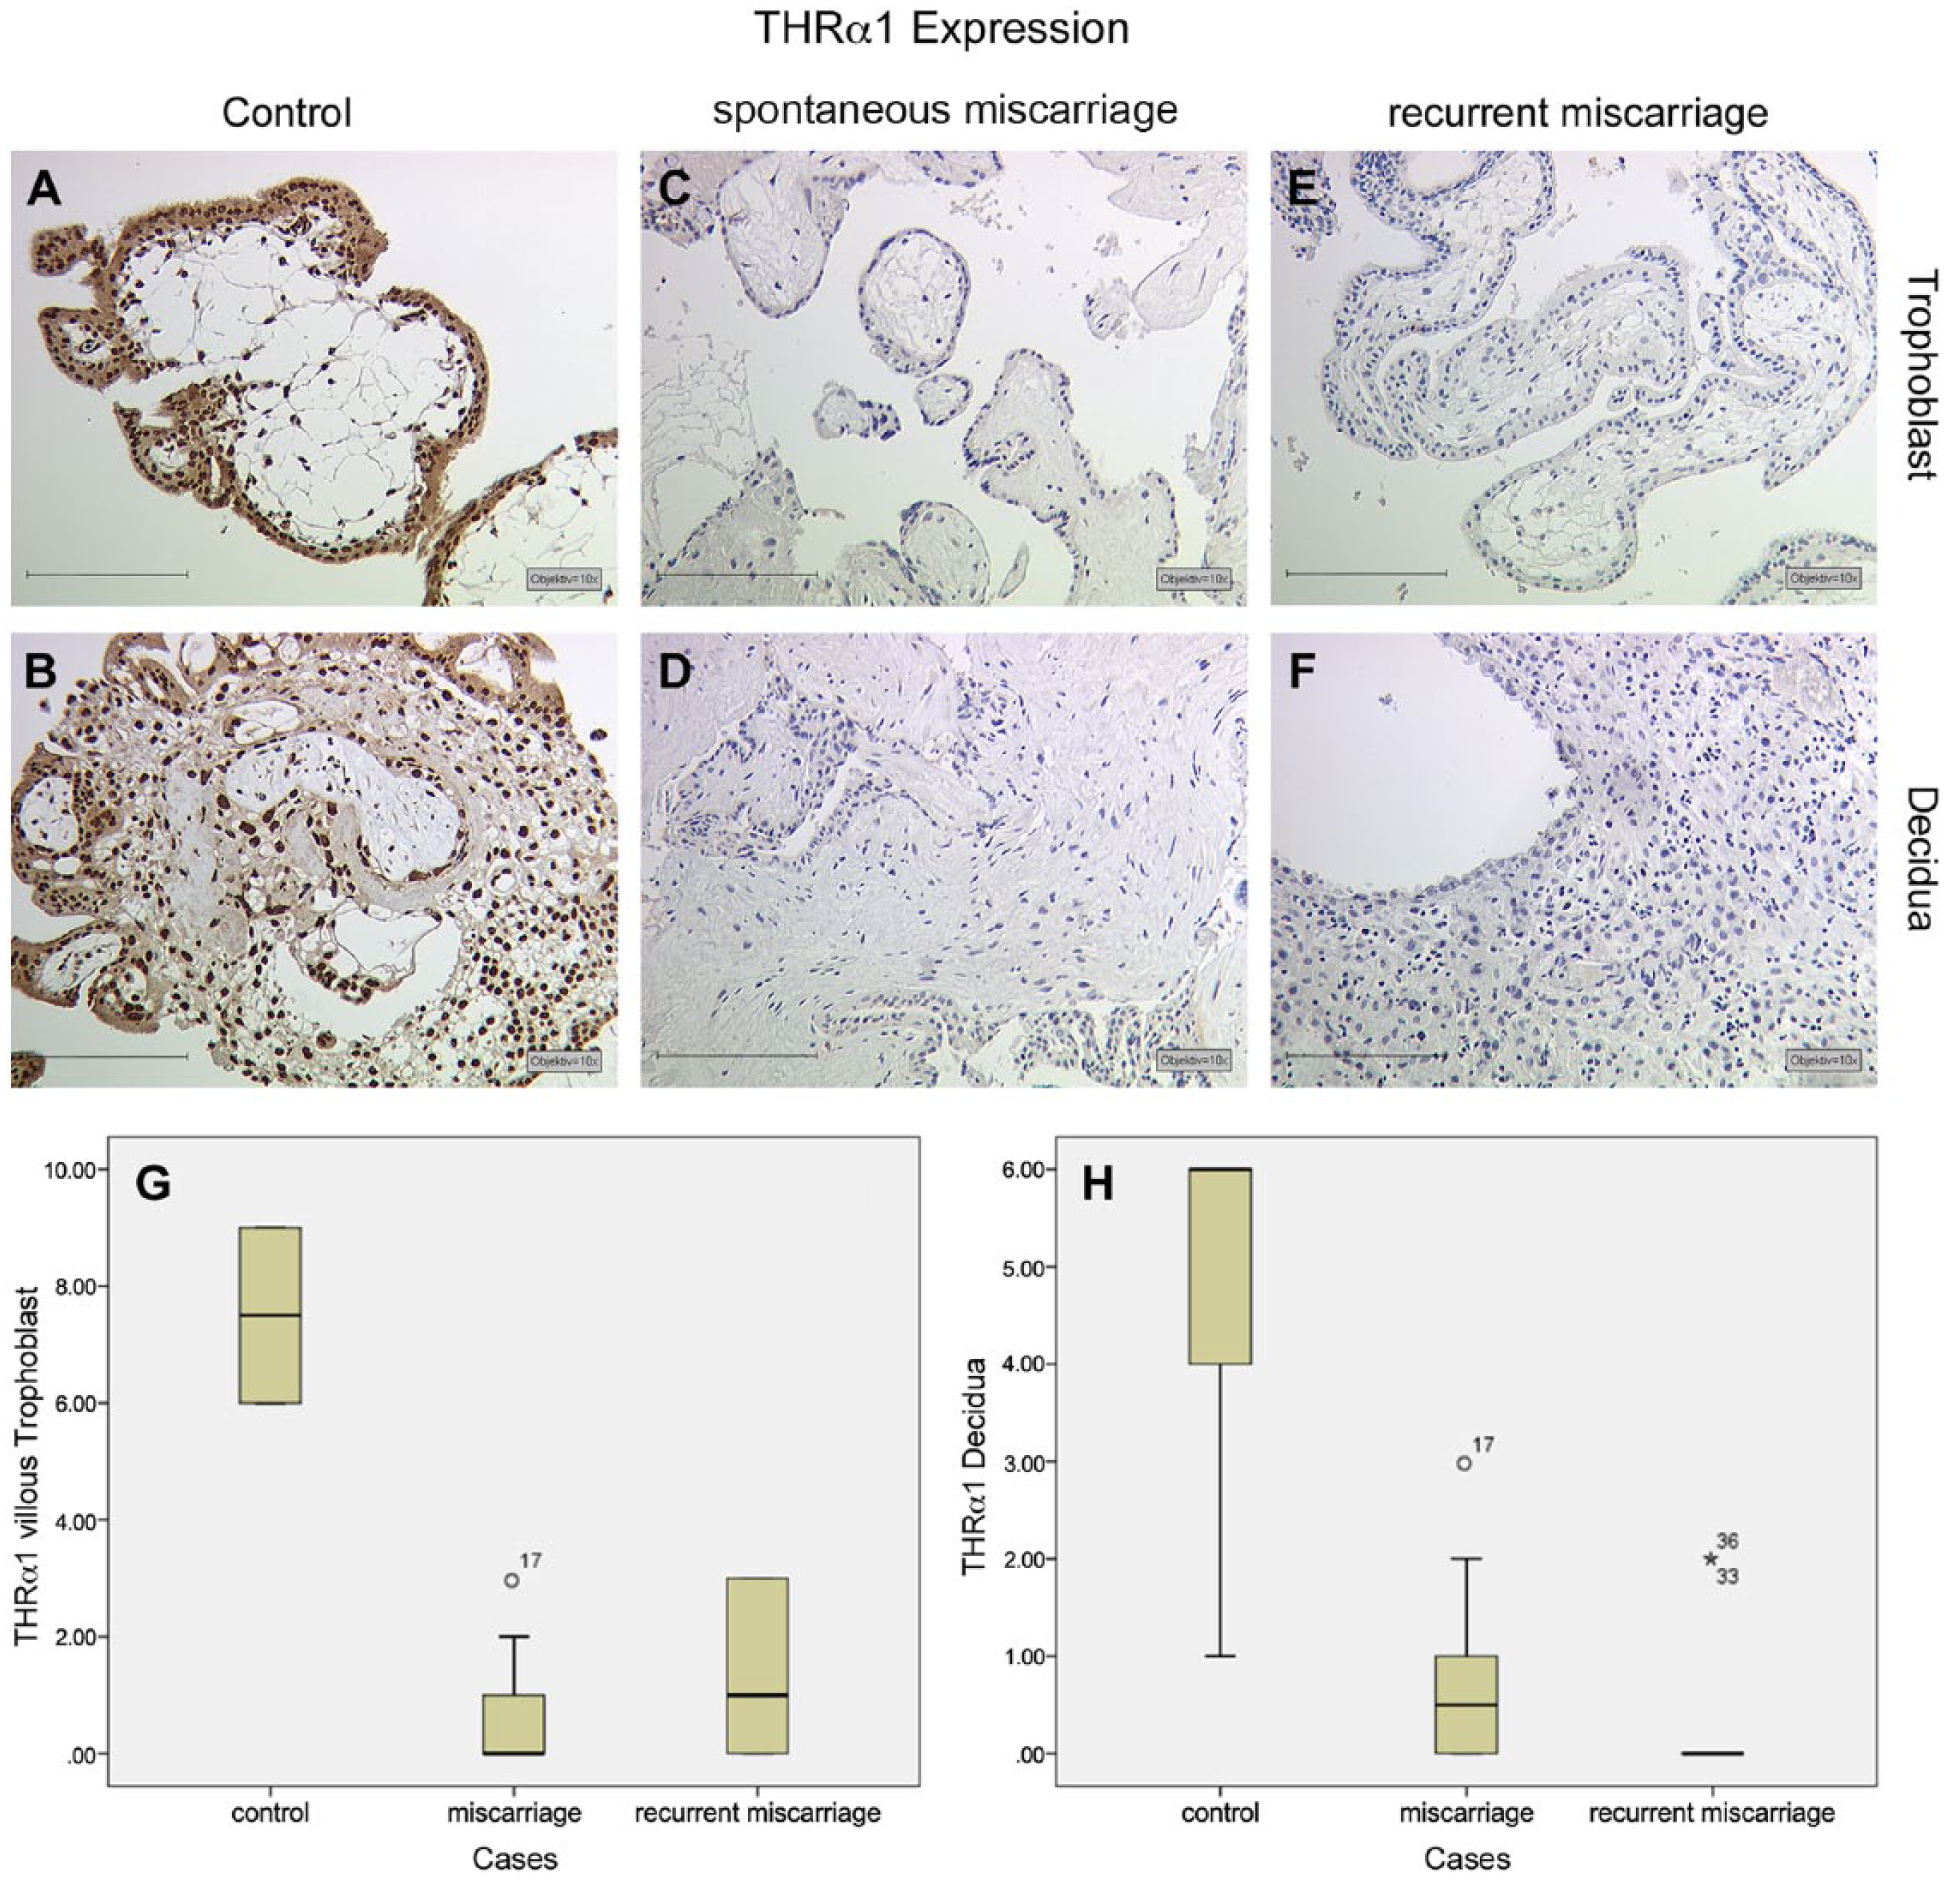
THRα1 expression is found with high intensity and distribution in normal villous trophoblast cells (A) and in the decidua (B) in normal tissues. In samples from patients with spontaneous miscarriage and recurrent miscarriage, we found a significant downregulation in THRα1 in villous trophoblast cells (C, E) and in the decidua (D, F), respectively. A summary of the staining results is given in Box plot analysis for villous trophoblast tissue (G) and the decidua (H). The boxes represent the range between the 25th and 75th percentiles with a horizontal line at the median. The bars delineate the 5th and 95th percentiles. The circle indicates values that are more than 1.5 box-lengths, and the asterisk values more than 3.0 box-lengths from the 75th percentile. Scale, 200 µm.
THRalpha2
We identified an intense expression of THRα2, with a median IRS value of 9, in the nuclei of villous trophoblasts (Fig. 3A). An abundance of high intensity staining was detected for THRα2 in the nuclei of cytotrophoblasts as well as in syncytiotrophoblasts. THRα2 showed a median IRS value of 4 in terms of its expression in the nuclei of decidual cells (Fig. 3B). In placental tissue samples from patients in the SM group, we identified a significant downregulation in THRα2 in villous trophoblasts (Fig. 3C; median = 1; p<0.001) but no significant changes in decidual cells (Fig. 3D, median = 3.5; p=0.182). In placental tissue samples from patients in the RM group, we also identified a significant downregulation in THRα2 in villous trophoblasts (Fig. 3E; median = 0; p<0.001) but no changes in decidual cells (Fig. 3F; median = 3.5, p=0.167). A summary of the staining results of the villous tissues is presented in Figure 3G, and a summary of staining results in decidual tissues is shown in Figure 3H.
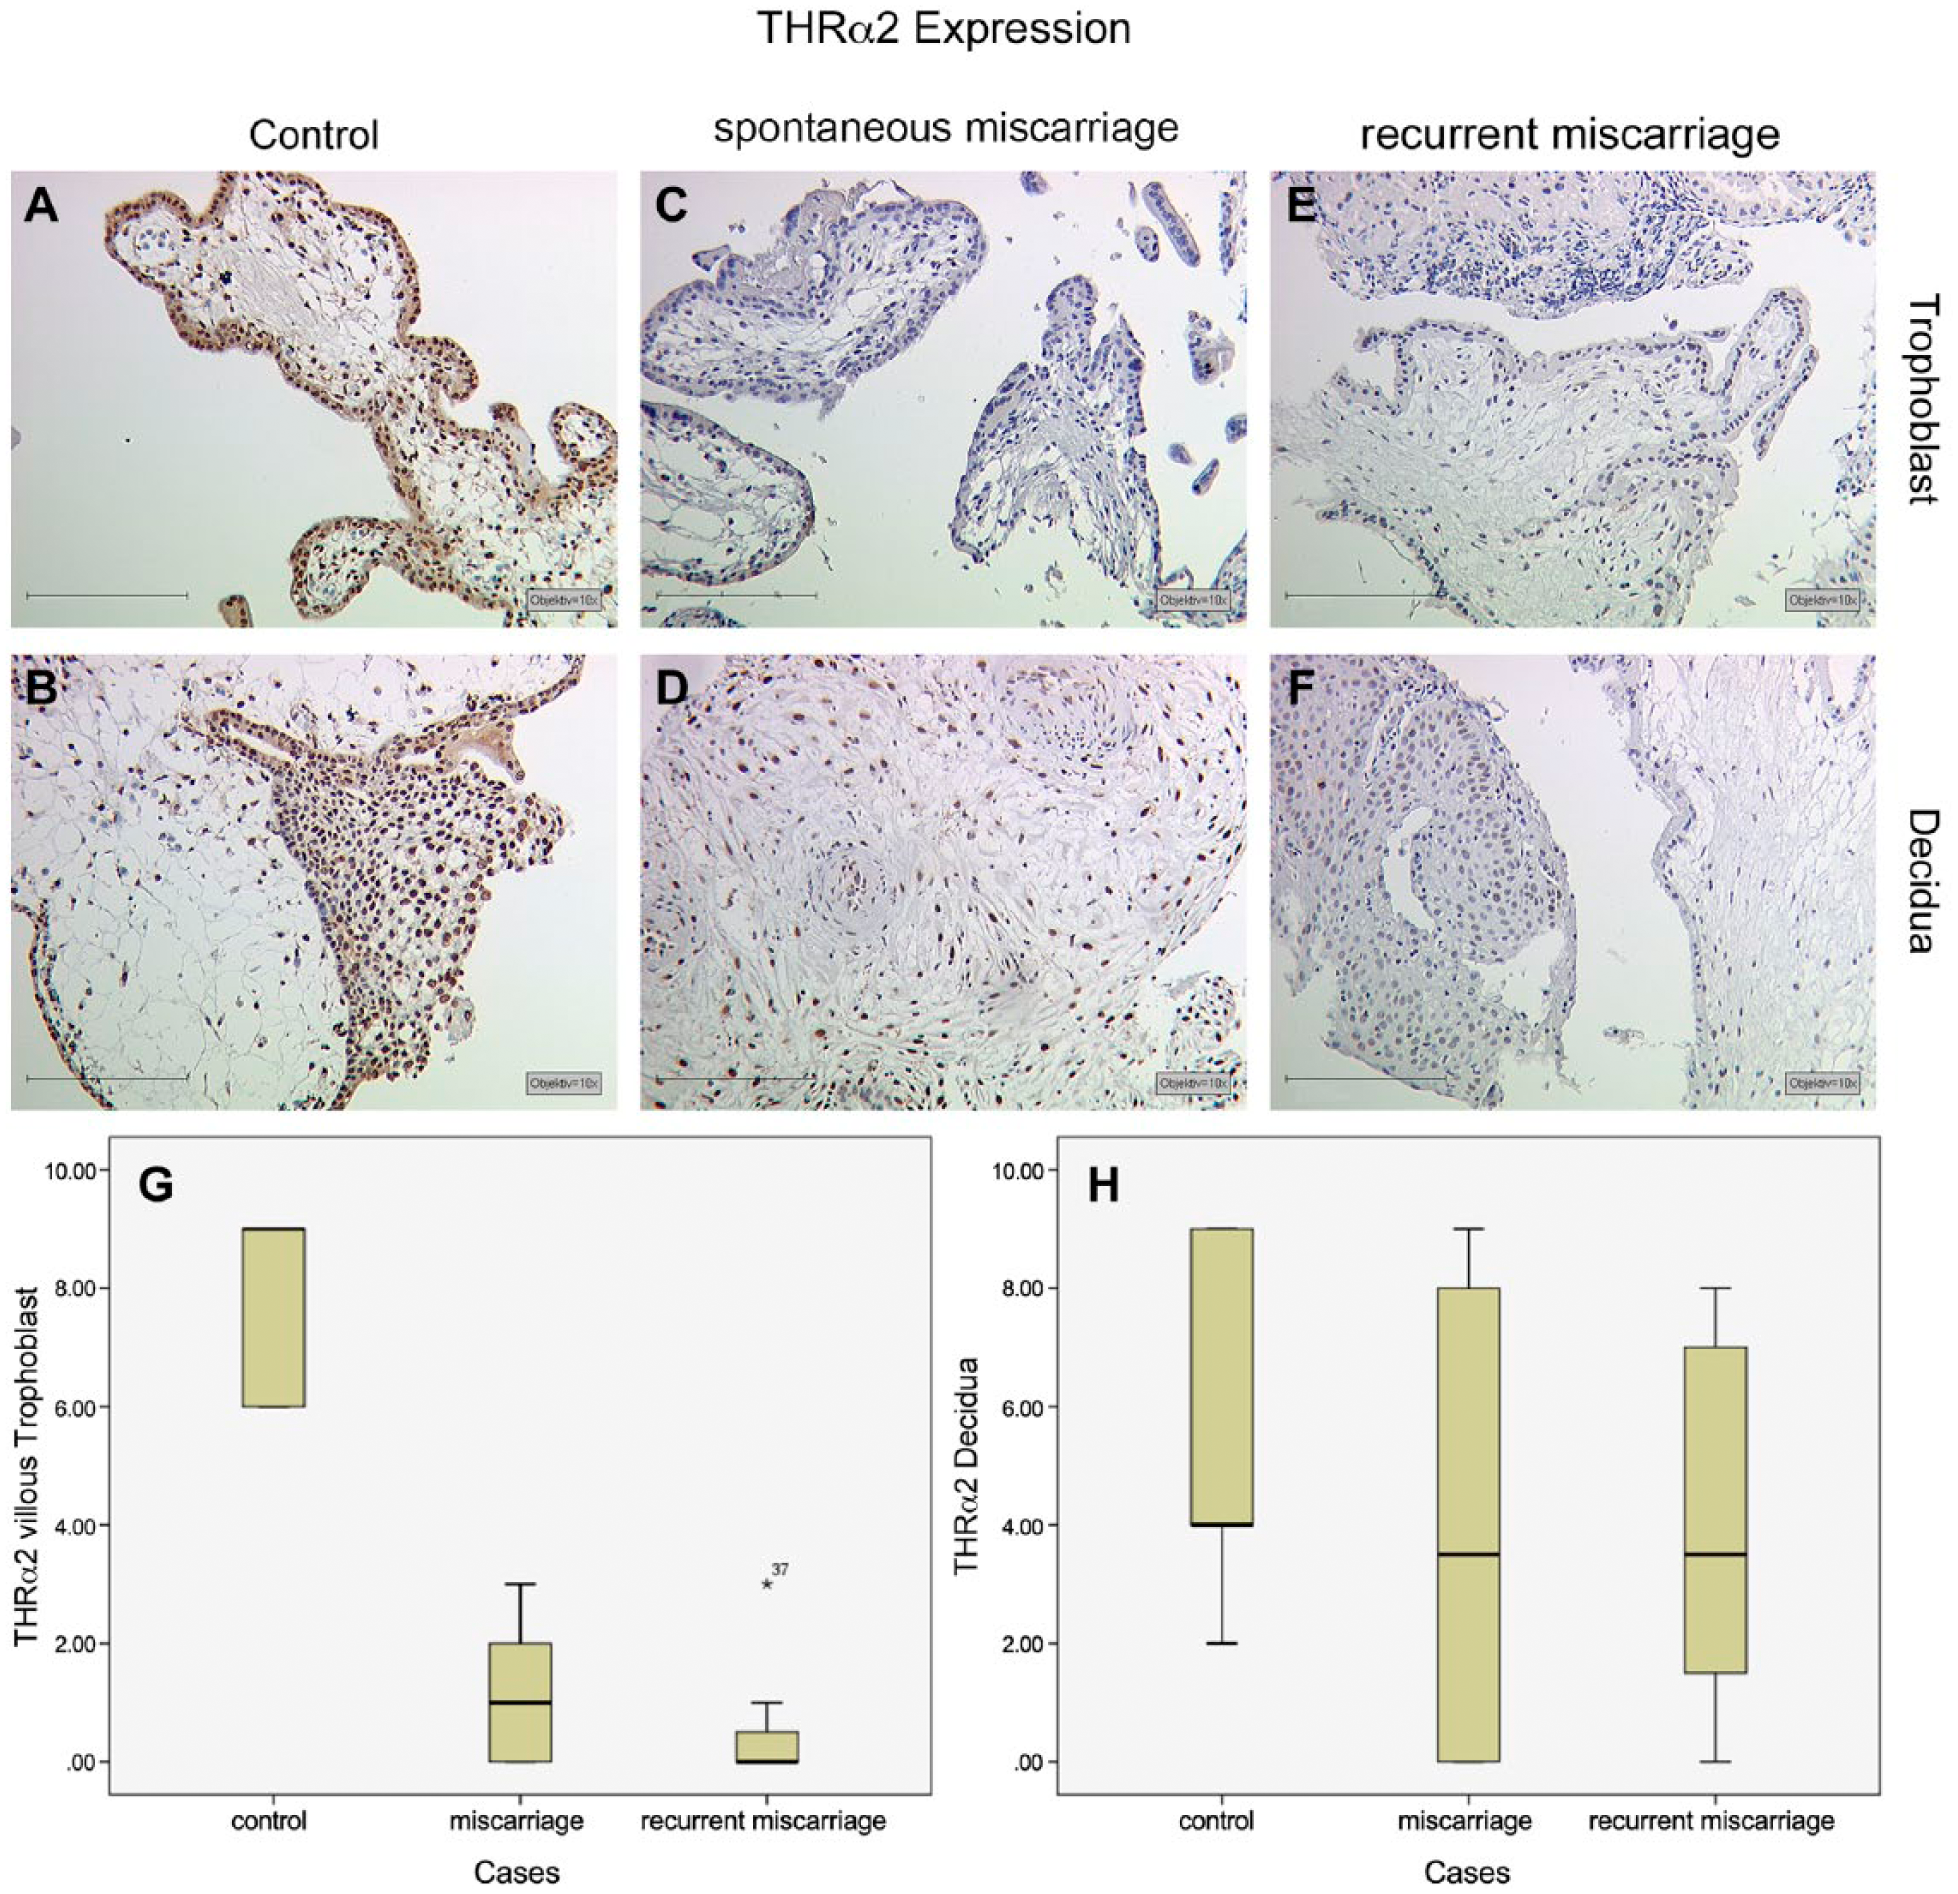
High-intensity staining and elevated distribution of THRα2 expression in normal villous trophoblast cells (A) and in the decidua (B). In spontaneous miscarriage samples as well as in recurrent miscarriage samples, we found a significant downregulation of THRα2 in villous trophoblast cells (C, E) but not in the decidua (D, F), respectively. A summary of the staining results is given in the Box plot analysis for villous trophoblast tissue (G) and decidua (H). The boxes represent the range between the 25th and 75th percentiles with a horizontal line at the median. The bars delineate the 5th and 95th percentiles. The circle indicates values that are more than 1.5 box-lengths from the 75th percentile. Scale, 200 µm.
THRbeta1
THRβ1 showed a median IRS value of 4 in the nuclei of villous trophoblast cells (Fig. 4A), with staining also observed in the nuclei of cytotrophoblasts and syncytiotrophoblasts. A similar result was found in the decidua. We identified a median IRS value of 3 for THRβ1 staining in the nuclei of decidual cells (Fig. 4B). In the placental tissue samples from patients in the SM group, we identified no significant changes in THRβ1 expression in villous trophoblasts (Fig. 4C; median = 3.5; p=0.083) or in decidual cells (Fig. 4D, median = 4; p=0.962). In the placental tissue samples from patients in the RM group—in contrast to those in the SM group—we identified a significant downregulation in THRβ1 in villous trophoblasts (Fig. 4E; median = 0; p<0.001) and in decidual cells (Fig. 4F, median = 1.5; p=0.004). A summary of the staining results for the villous tissue is presented in Figure 4G and a summary of staining results for decidual tissue is shown in Figure 4H.
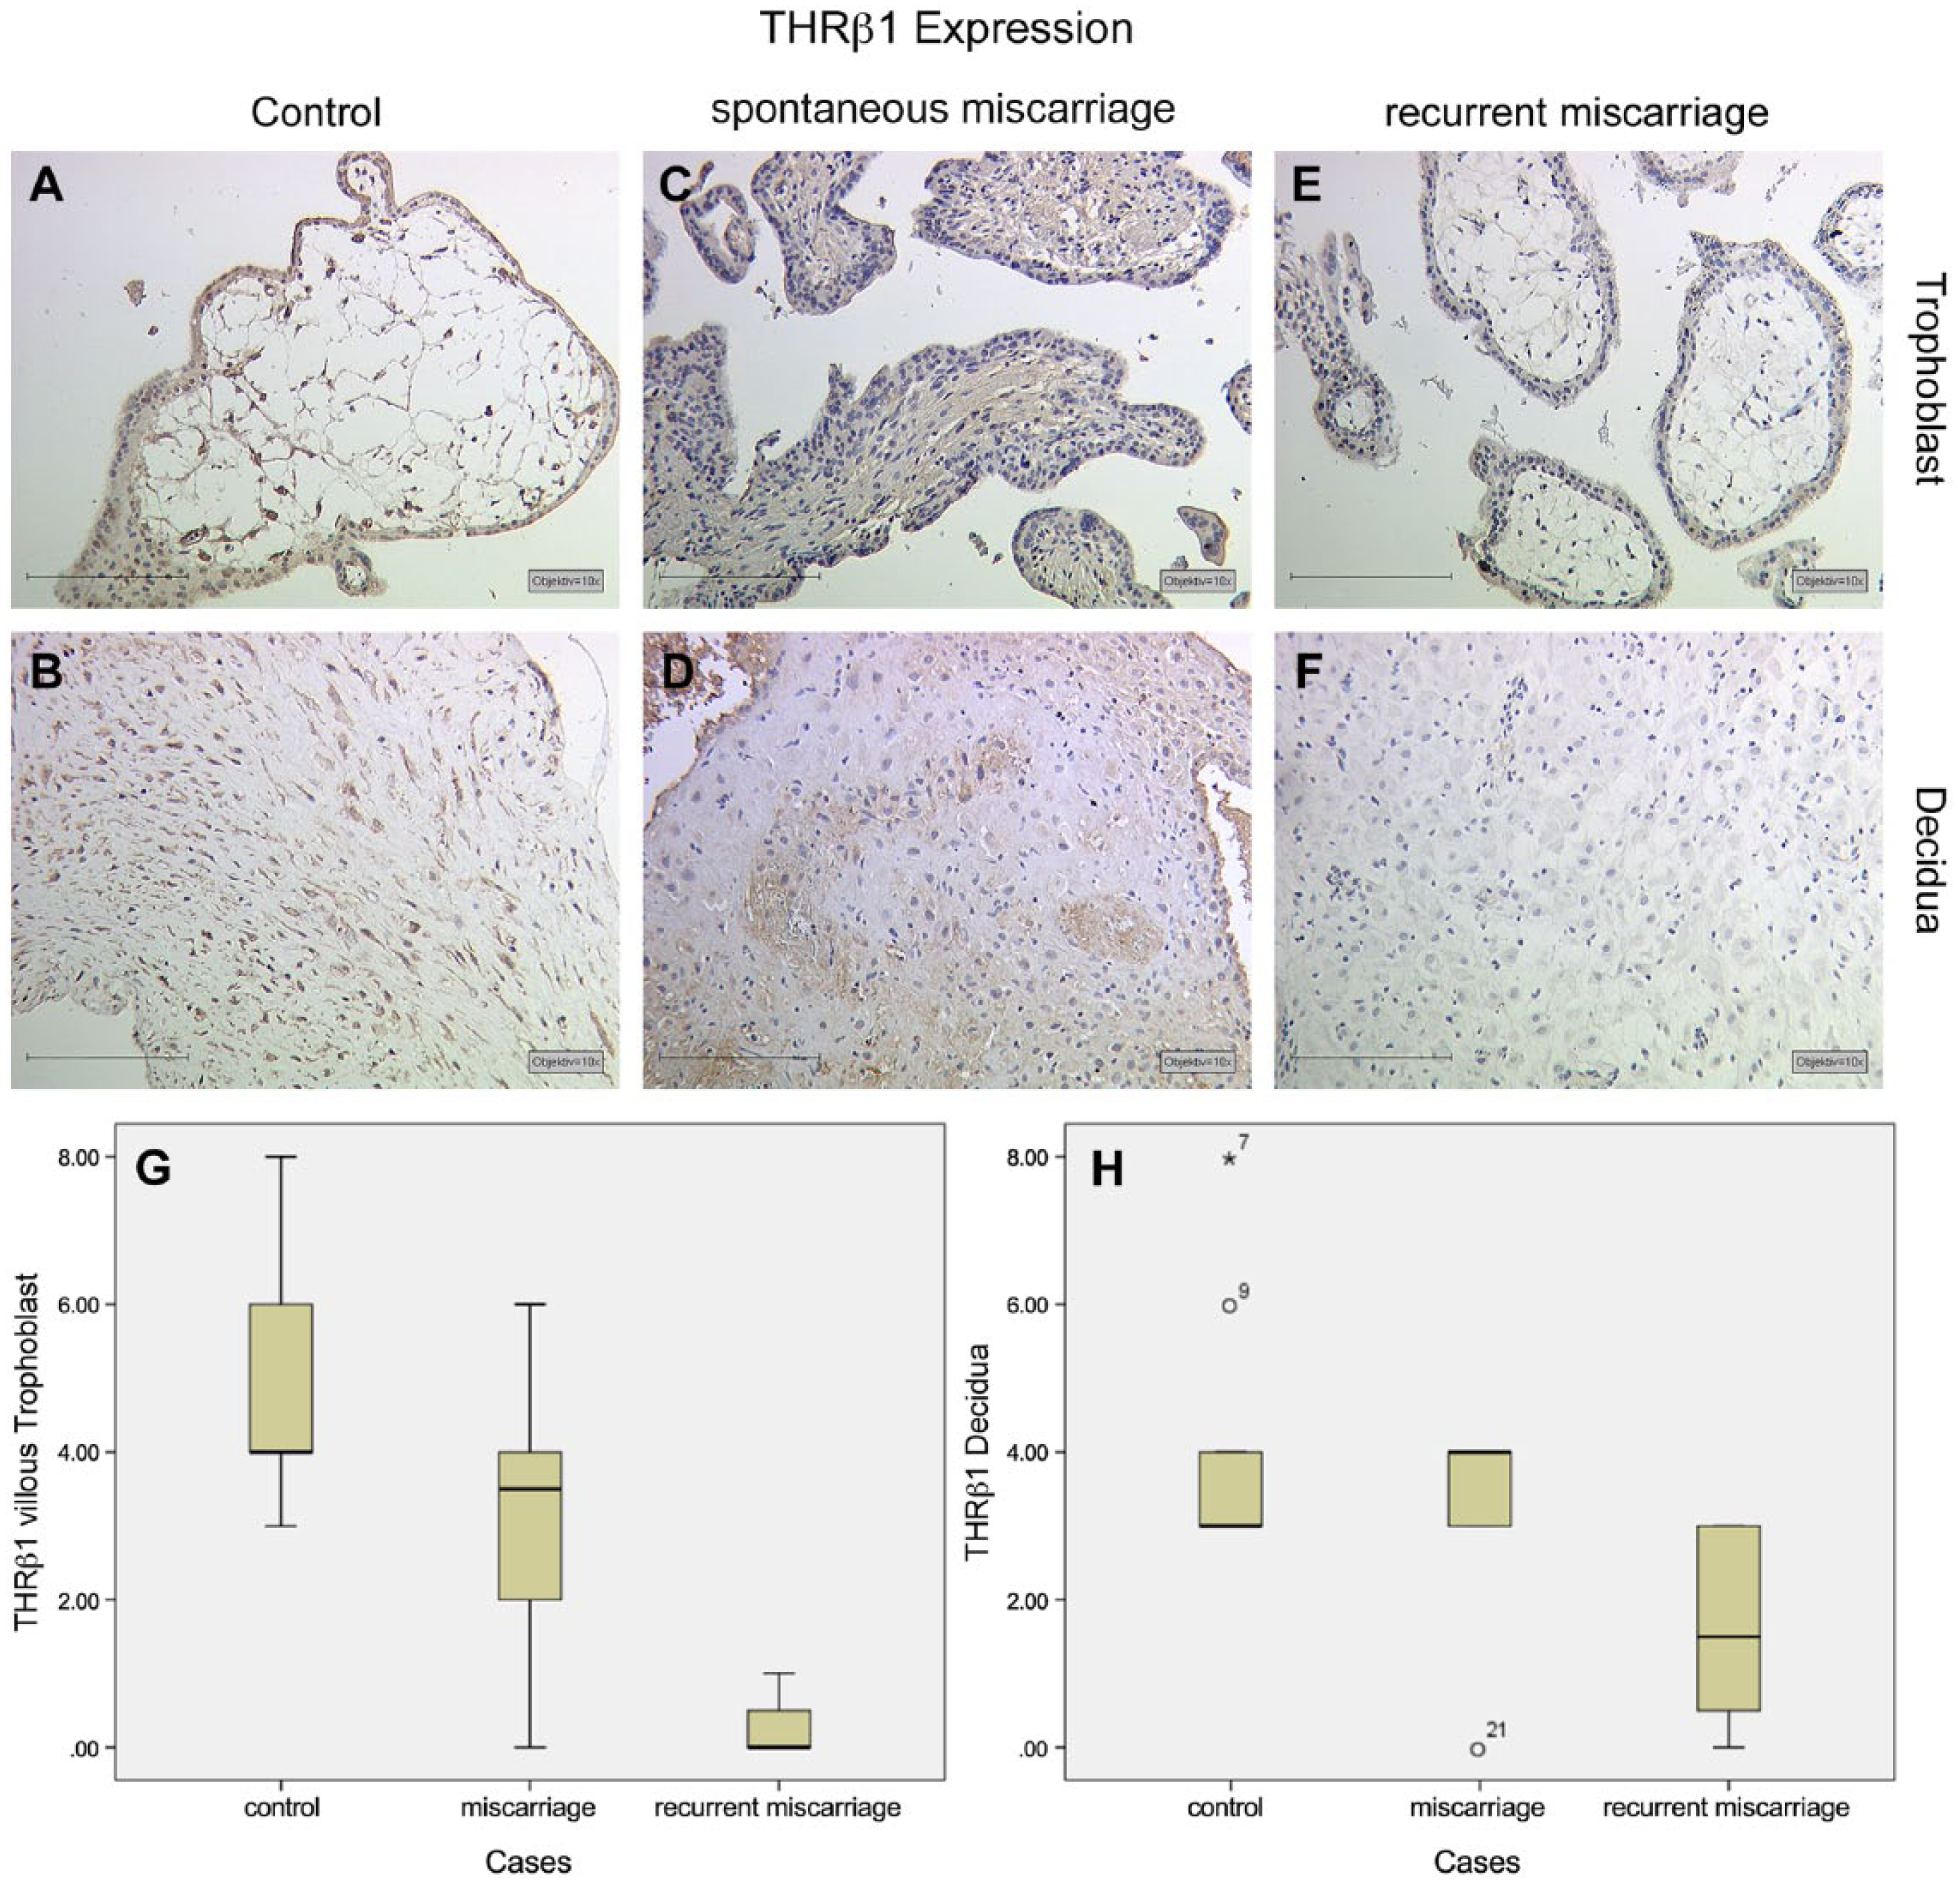
Median intensity and distribution of THRβ1 expression in normal villous trophoblast cells (A) and in the decidua (B). In spontaneous miscarriage samples, we found no significant changes in THRβ1 in villous trophoblast cells (C) or in the decidua (D) as compared with the control. In recurrent miscarriage samples, we identified a significant downregulation in THRβ1 in the villous trophoblasts (E) as well as in the decidua (F). A summary of the staining results is given in Box plot analysis for villous trophoblast tissue (G) and the decidua (H). The boxes represent the range between the 25th and 75th percentiles with a horizontal line at the median. The bars delineate the 5th and 95th percentiles. The circle indicates values that are more than 1.5 box-lengths, and the asterisk values more than 3.0 box-lengths from the 75th percentile. Scale, 200 µm.
THRbeta2
We identified an intense expression of THRβ2, with a median IRS value of 6, in the nuclei of villous trophoblast cells (Fig. 5A). Staining was identified in the nuclei of both cytotrophoblasts and syncytiotrophoblasts. A similar result was found in the decidua. We identified THRβ2, with a median IRS value of 4, in the nuclei of decidual cells (Fig. 5B). In the placental tissue of patients in the SM group, we identified a significant downregulation in THRβ2 in villous trophoblasts (Fig. 5C, median = 3; p=0.008). In decidual cells, no significant changes were observed (Fig. 5D, median = 3; p=0.139). In the placental tissue samples from patients in the RM group, we also identified a significant downregulation in the expression of THRβ2 in villous trophoblast (Fig. 5E, median = 0; p=0.001). In decidual cells, again, no significant changes were found (Fig. 5F, median = 3; p=0.094). A summary of the staining results for villous tissue is presented in Figure 5G and a summary of staining results for decidual tissue is shown in Figure 5H.
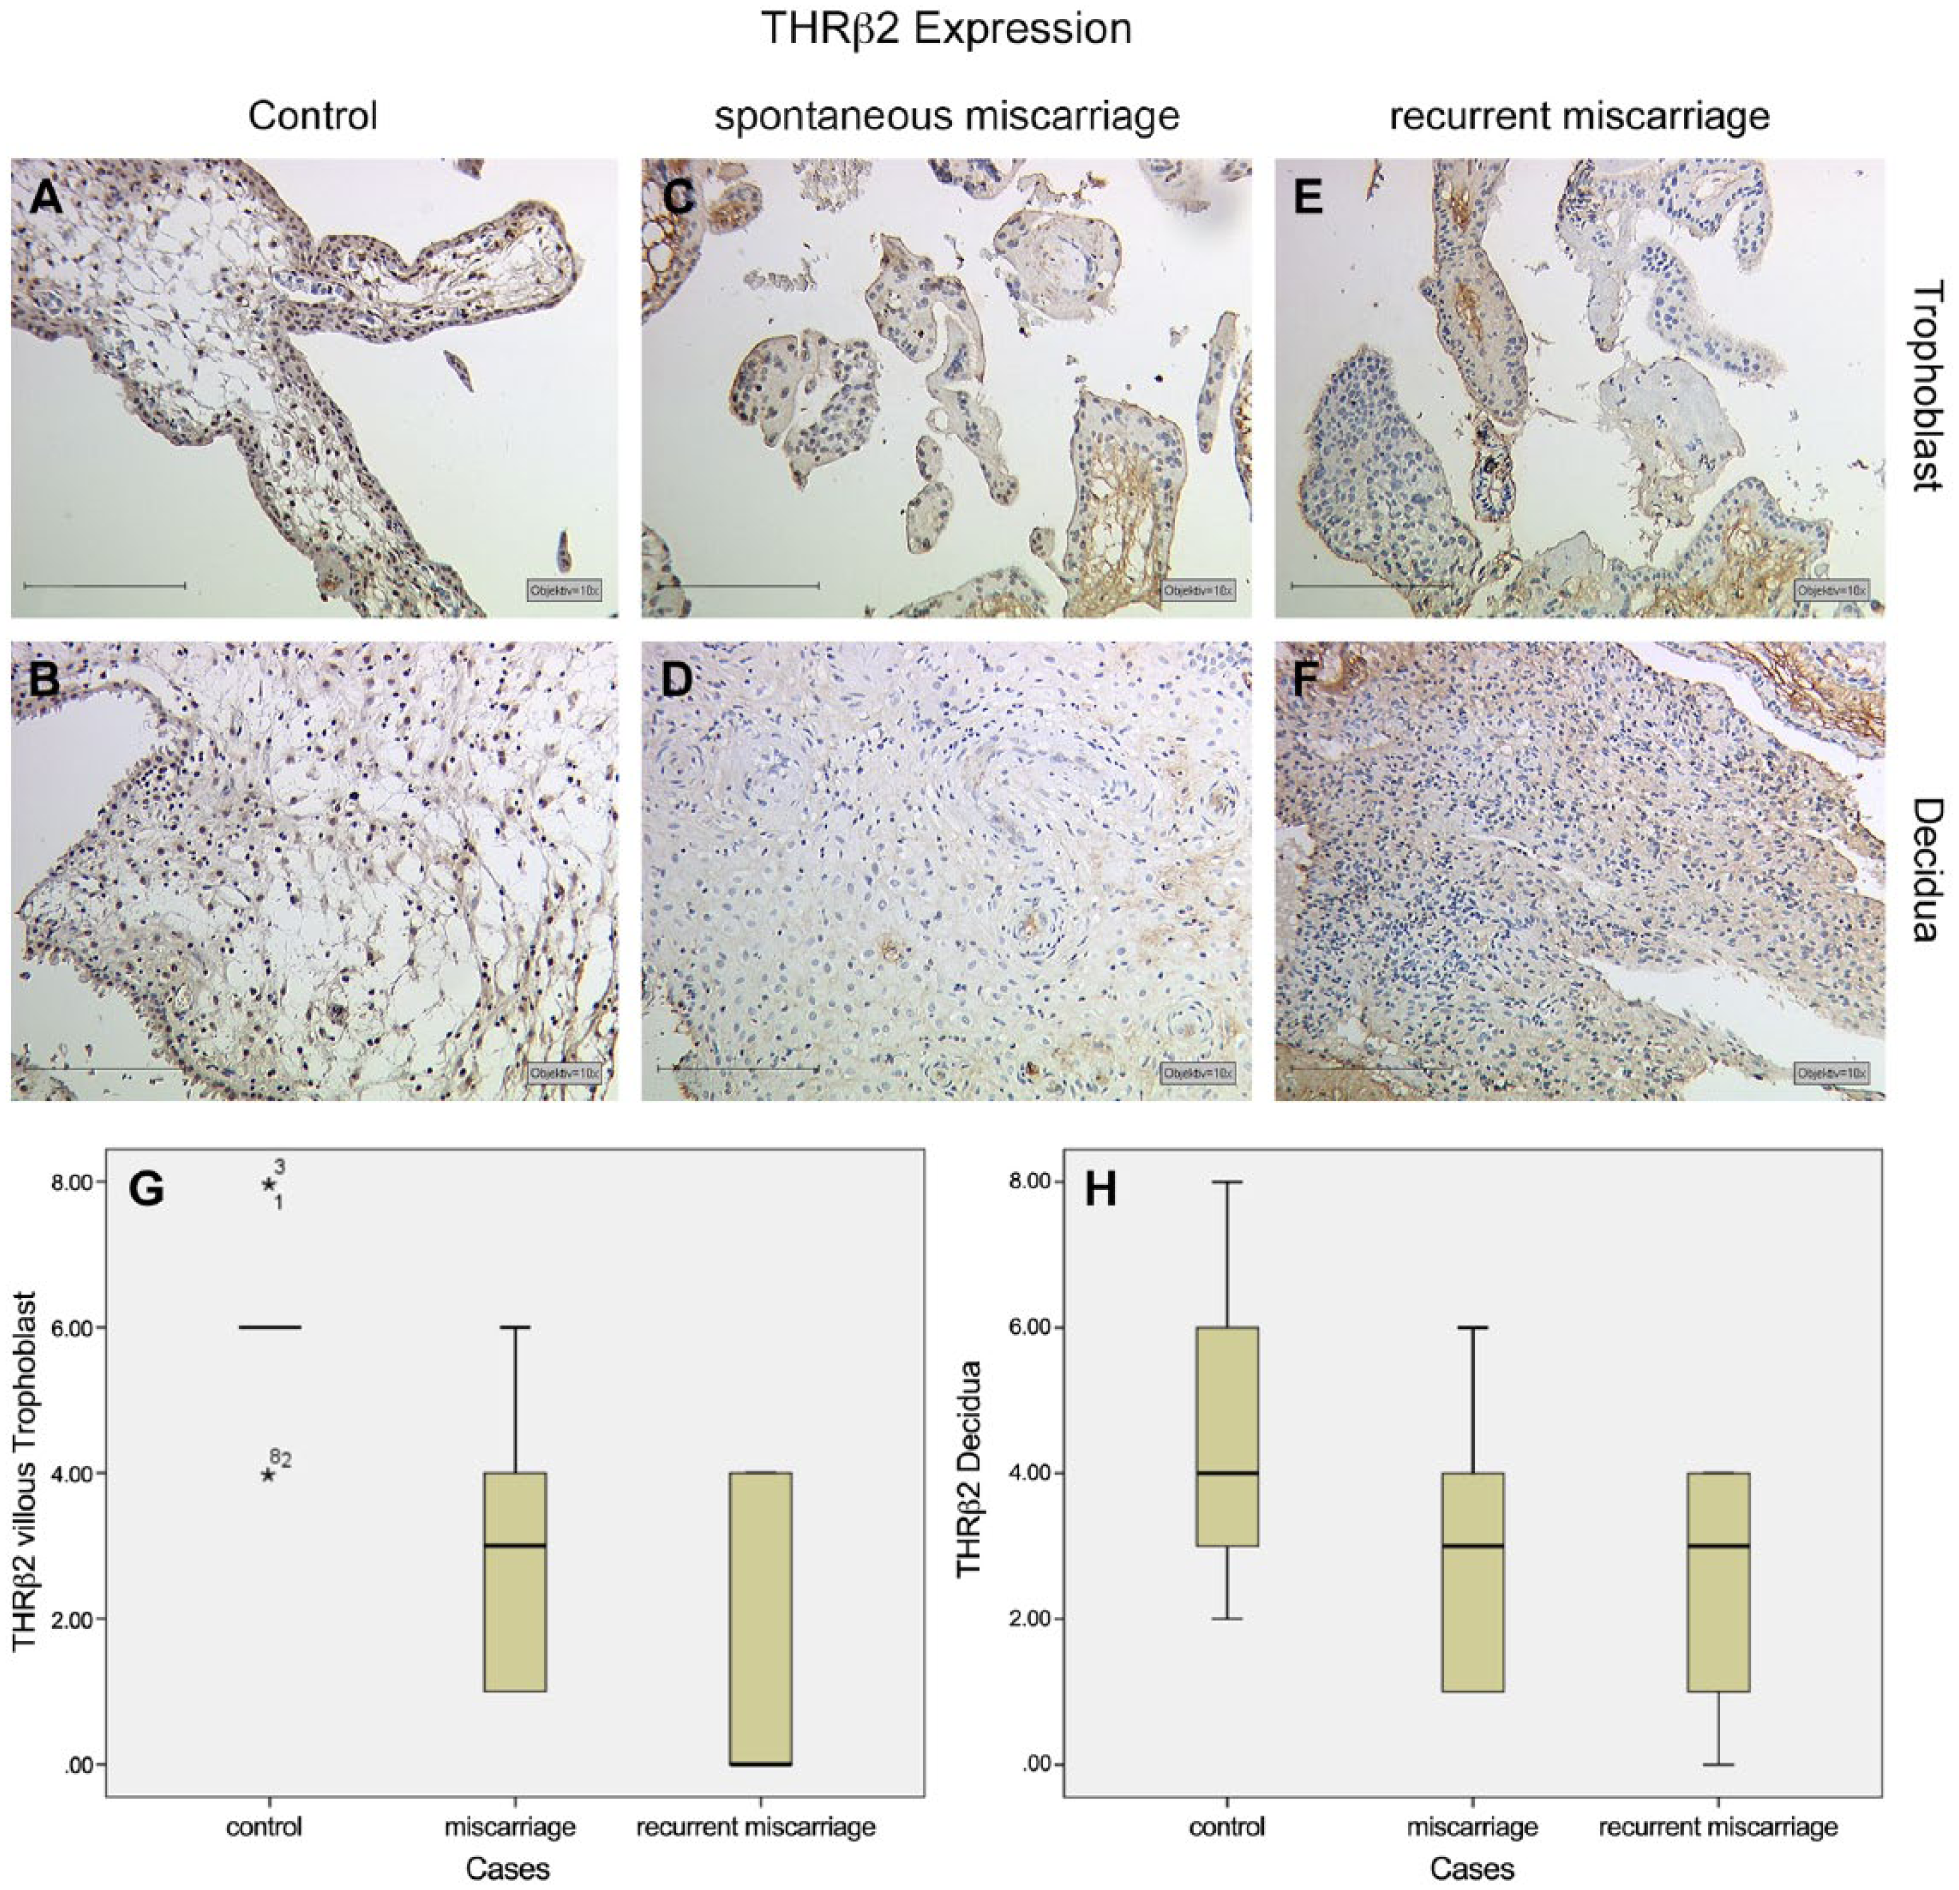
THRβ2 expression is found with high intensity and distribution in normal villous trophoblast cells (A) and with median expression in the decidua (B). In spontaneous miscarriage as well as in recurrent miscarriage samples, we found a significant downregulation in THRβ2 expression in villous trophoblast cells (C, E) but no significant change in the decidua (D, F). A summary of the staining results is given in Box plot analysis for villous trophoblast tissue (G) and the decidua (H). The boxes represent the range between the 25th and 75th percentiles with a horizontal line at the median. The bars delineate the 5th and 95th percentiles. The asterisk indicates values that are more than 3.0 box-lengths from the 75th percentile. Scale, 200 µm.
Identification of THR-expressing Cells in the Decidua with Double Immunofluorescence
THRα/β + HLA-G double fluorescence staining was used for the identification of EVTs expressing THR. THRα1 staining in the nuclei of decidual cells is shown in Figure 6A. Membrane HLA-G staining of EVTs from the same area is shown in Figure 6B. Triple filter excitation showing both THRα1 and HLA-G is depicted in Figure 6C. The white arrows mark those cells expressing both antigens. The majority of decidual cells did not stain for HLA-G but were positive for THRα. Therefore, the identity of these cells is decidual stromal cells.
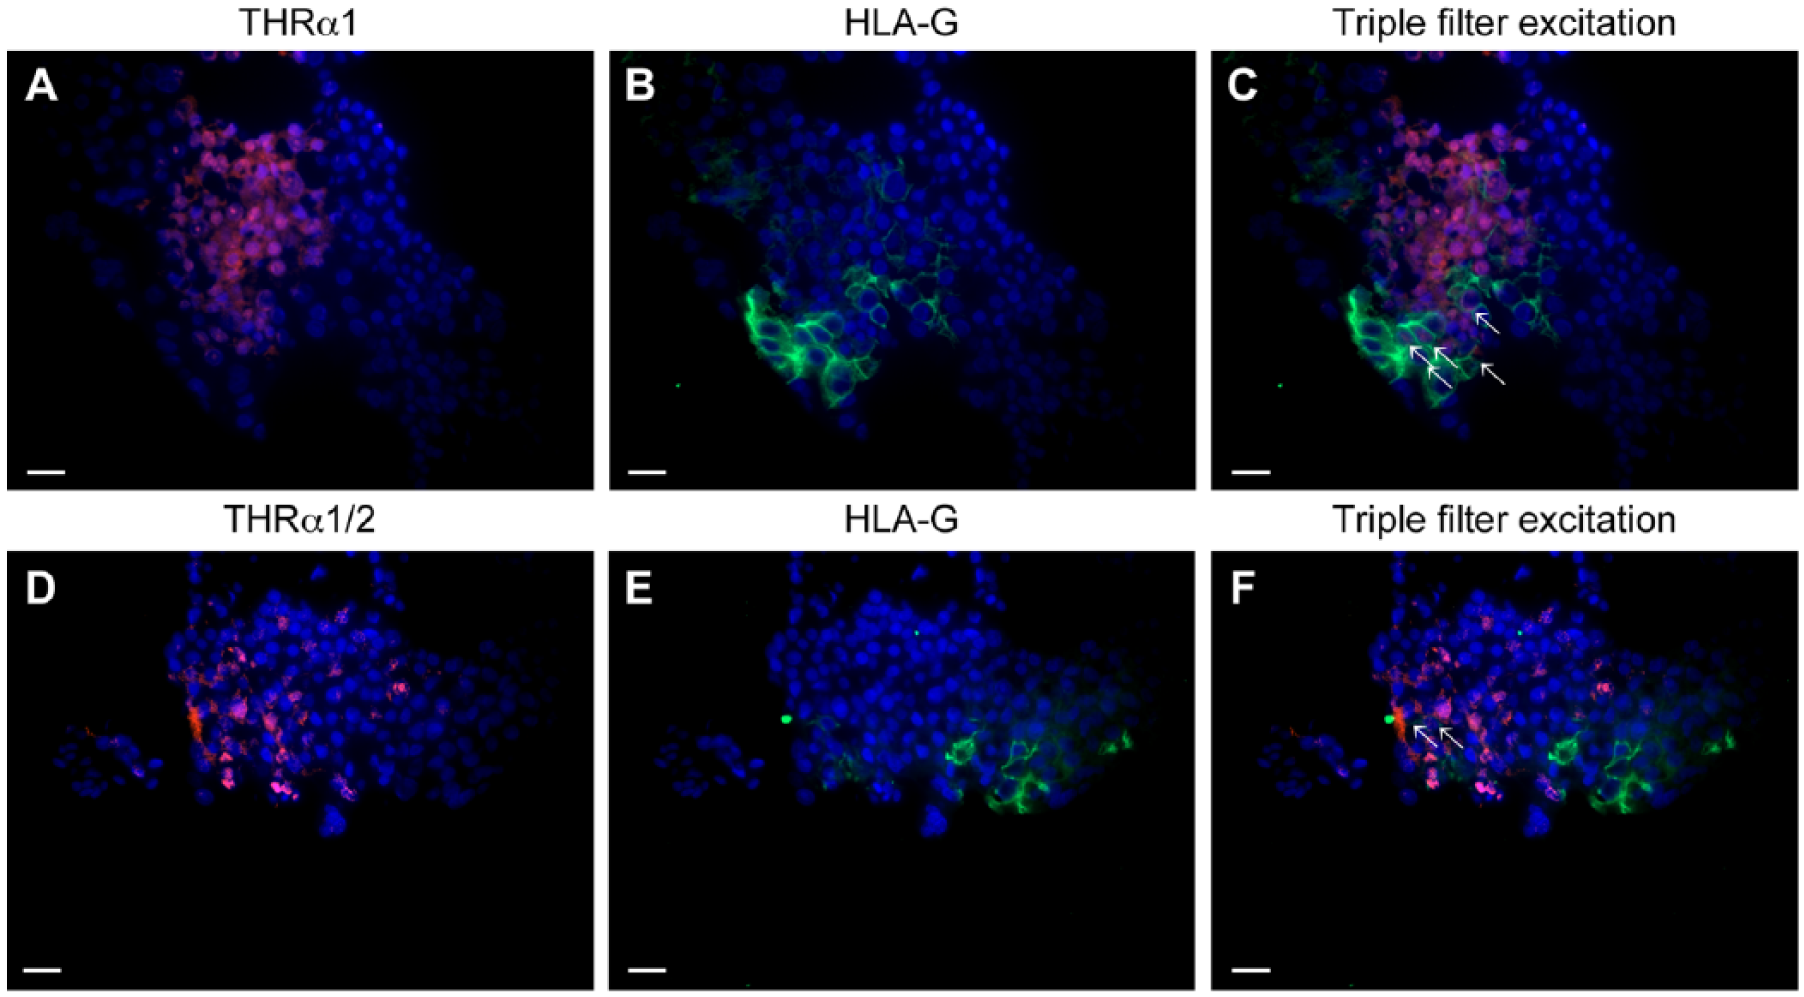
(A) THRα1 expression (Cy3; red) shows a high distribution in normal decidua. (B) Extravillous trophoblast cells (EVTs) (HLA-G positive) appear green. (C) Triple filter excitation shows cells expressing both markers (as indicated by the white arrows). The majority of THRα1-expressing cells are not HLA-G positive. (D) THRα1/2 expression (Cy3; red) is found in the normal decidua. (E) EVTs (HLA-G positive) appear green. Triple filter excitation (F) shows cells expressing both marker (marked with white arrows). Only very few THRα2 expressing cells are HLA-G positive. Scale, 20 µm.
THRα1/2 staining in the nuclei of decidual cells is shown in Figure 6D. Membrane HLA-G staining of EVTs from the same area is shown in Figure 6E. Triple filter excitation showing both THRα1/2 and HLA-G is shown in Figure 6F. The white arrows mark the few cells expressing both antigens. The majority of THRα1/2-expressing cells is not stained for HLA-G. The identity of these cells is decidual stromal cells.
THRβ1 staining in the nuclei of decidual cells is shown in Figure 7A. Membrane HLA-G staining of EVTs from the same area is shown in Figure 7B. Triple filter excitation showing both THRβ1 and HLA-G is shown in Figure 7C. THRβ1-expressing cells are not stained for HLA-G. Therefore, the identity of these cells is decidual stromal cell.
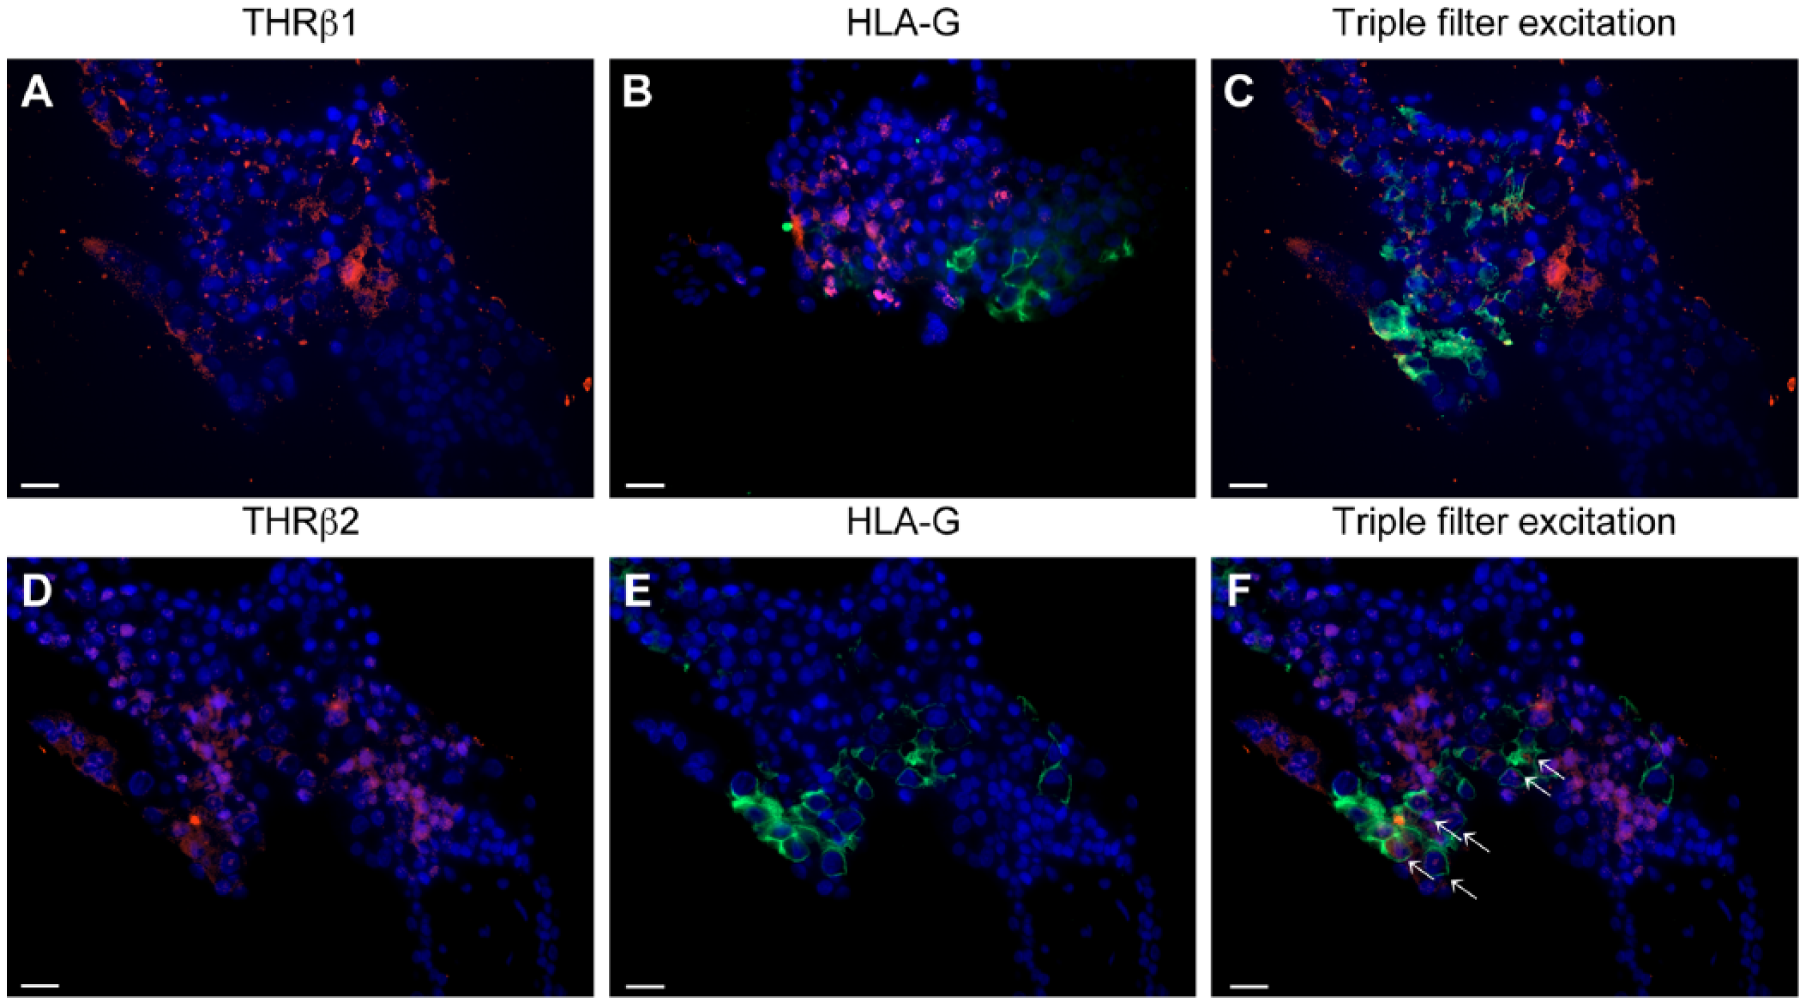
(A) THRβ1 expression (Cy3; red) is found in normal decidua. (B) Extravillous trophoblasts (EVTs) (HLA-G positive) appear green. (C) Triple filter excitation shows that there are no cells expressing both markers. (D) THRβ2 expression (Cy3; red) is found in the normal decidua. (E) EVTs (HLA-G positive) appear green. (F) Triple filter excitation shows cells expressing both markers (marked with white arrows). The majority of HLA--expressing cells are also THRβ2-positive. Scale, 20 µm.
THRβ2 staining in the nuclei of decidual cells is shown in Figure 7D. Membrane HLA-G staining of EVTs from the same area is shown in Figure 7E. Triple filter excitation showing both THRβ2 and HLA-G is shown in Figure 7F. The white arrows mark cells expressing both antigens. The majority of cells stained for HLA-G are also positive for THRβ2. A great number of cells expressing THRβ2 do not express HLA-G and therefore are decidual stromal cell.
Evaluation of THRA and THRB Expression with Real Time RT-PCR (TaqMan)
We identified the expression of THRA and THRB in all cases investigated. The mRNA expression of THRA was downregulated to a 0.14-fold expression in samples from the SM group and to a 0.096-fold expression in samples from the RM group (p=0.001, Fig. 8A). The mRNA expression of THRB was downregulated to a 0.28-fold expression in the SM group and to a 0.04-fold expression in the RM group (p<0.001, Fig. 8B).
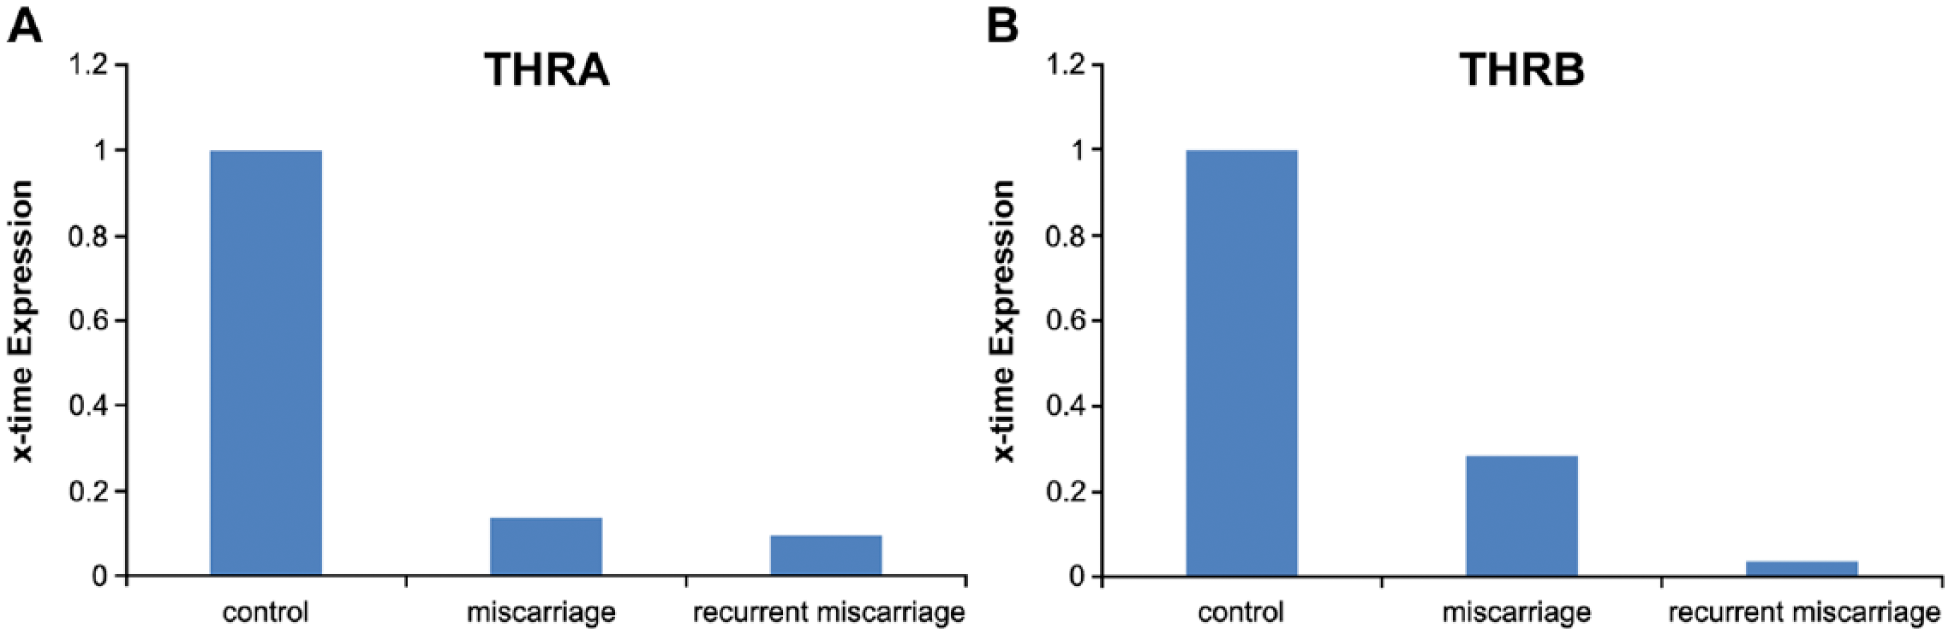
Results of gene expression analysis with TaqMan RT-PCR. (A) THRA expression. We identified a significant downregulation in THRA in samples from patients with spontaneous miscarriage as well those with recurrent miscarriage. (B) We identified a significant downregulation in THRB in samples from patients with spontaneous miscarriage and recurrent miscarriage.
A detailed matched analysis revealed no significant differences in THR expression in the control placentas from the 5th to the 11th weeks of gestation. We also analyzed fetal gender-related THR expression but could not identify significant differences (p>0.05) for fetal gender.
Discussion
Within this study, we investigated the nuclear expression of THRα1, THRα2, THRβ1 and THRβ2. We found that these receptors are downregulated at protein level in villous trophoblast tissue in patients who suffer from spontaneous and recurrent miscarriages. In decidual tissue, we found a significant downregulation only in THRα1 in spontaneous miscarriage samples, and in THRα1 and THRβ1 for recurrent miscarriage samples. Using double immunofluorescence and HLA-G as trophoblast markers (Proll et al. 1999), we found a significant co-expression for THRβ2 only with HLA-G. Therefore, decidual stromal cells seem to express the majority of THRβ2. Further, we were able to confirm the results found at protein level at mRNA level. THRA and THRB are both downregulated in spontaneous and recurrent miscarriage placental tissue.
The scientists Pierre Chambon, Ronald M. Evans and Elwood V. Jensen investigated the nuclear receptor superfamily in the past two decades and discovered that its members interact with each other. The retinoid-X-receptor (RXR) acts as a key player of the receptor family through forming heterodimers with other nuclear receptors. The formation of heterodimers further activates transcription (Kastner et al. 1995; Mangelsdorf and Evans 1995; Zhang and Pfahl 1993). The thyroid hormone receptor family, THRα and -β, are heterodimeric partners of RXR. We previously described that upregulation of apoptotic EVTs is found in spontaneous and recurrent miscarriage placental tissue (Minas et al. 2007). In addition, we have shown that EVTs in the placentas of miscarriages show a significantly higher expression of RXRα in comparison to EVTs in placentas of elective terminations of healthy pregnancies (Pestka et al. 2011; Toth et al. 2008). Therefore, the key heterodimeric partner receptor of THRs is rather upregulated in contrast to the THRs. A similar trend in terms of the downregulation of the nuclear receptor LXR has recently been described by our group. Expression of the liver X receptor (LXR) is decreased in both villous trophoblasts and decidual tissues of spontaneous and recurrent miscarriages (Knabl et al. 2013). Peroxisome proliferator-activated receptor gamma (PPARγ) expression has further been investigated and was shown to be increased in miscarriages (Pestka et al. 2011; Toth et al. 2009; Toth et al. 2007). Interestingly, a recent study showed that activation of PPARγ signaling via rosiglitazone induced a strong downregulation in both THRA and THRB in brown adipose tissue and in rats in vivo (Festuccia et al. 2012). Based on these results, we may speculate that, in miscarriages, downregulation of THRs is mediated by activated PPARγ as well as RXR. Therefore, we consider that THR downregulation is a cause mediated by a number of different factors.
On the other hand, an impairment of the maternal thyroid function, such as in hypothyroidism or thyroid autoimmune diseases, can also have detrimental consequences to embryonic and fetal development and result in an increased risk of miscarriage. In fact, thyroid autoantibodies are associated with a higher rate of both spontaneous and recurrent miscarriages (Budenhofer et al. 2013). Thyroid autoimmunity leads to an increase in miscarriage rate (Abalovich et al. 2007; Anselmo et al. 2004; De Geyter et al. 2009; Poppe et al. 2008; Smallridge et al. 2005; Todorova et al. 2008), especially in the first trimester (De Geyter et al. 2009; Poppe et al. 2008). A significant correlation between the presence of thyroid antibodies and spontaneous pregnancy loss has been confirmed by several studies: A two-fold increase in the miscarriage rate was seen in women who were thyroid antibody-positive in the first trimester as compared with antibody-negative women (Stagnaro-Green et al. 1990). A four-fold increase in the miscarriage rate was present in women affected by autoimmune thyroid disease as compared to the healthy controls (Glinoer et al. 1991). In addition, it has been shown that miscarriage in women affected by thyroid autoimmunity mainly occurs during the first trimester (Lejeune et al. 1993) and patients with recurrent miscarriage (RM) showed rather high incidences of thyroid antibodies (Bussen and Steck 1995) (Reznikoff-Etievant et al. 1999). In accordance with the Endocrine Society Guidelines, hypothyroidism in pregnant women is indicated to be treated with levothyroxine, even if subclinical (Gartner and Reincke 2008; Verga et al. 2009). The benefit of levothyroxine replacement in pregnant women has been demonstrated by several studies. Levothyroxine administration reduced rates of miscarriage and premature delivery in thyroid antibody-positive women to values similar to those of controls with euthyroid function (Negro et al. 2006). The incidence of obstetric complications is decreased when euthyroidism can be achieved and maintained by levothyroxine treatment in pregnant hypothyroid women (Glinoer 1998; Verga et al. 2009). However, an improvement in fertility by levothyroxine administration has not yet been proven (Gartner and Reincke 2008). Maternal thyroid dysfunction, especially hypothyroidism and thyroid autoimmunity, does have a negative influence on fetal development and obstetric outcome, and thyroid autoantibodies are associated with a significant increase in miscarriage rates. However, a consistent screening routine for thyroid (dys-)function in pregnant women does not yet exist (Vaidya et al. 2012).
In summary, thyroid hormones T3 and T4 are essential for the maintenance of pregnancy and a deficiency in maternal thyroid hormones is associated with miscarriages. The results of our study show that the expression of thyroid hormone receptors THRα1, THRα2, THRβ1, and THRβ2 is downregulated in villous trophoblasts from spontaneous and recurrent miscarriages. The majority of cells expressing the THRs in the decidua are decidual stromal cells. Only THRβ2 is also expressed in EVTs.
Footnotes
Acknowledgements
We would like to thank Dr. Sanja Milak for help in the tissue collection and Mrs. Susi Kunze for technical help. We also thank Laurent Soussana for language editing of the manuscript.
Declaration of Conflicting Interests
The authors declared the following potential conflicts of interest with respect to the research, authorship, and/or publication of this article: Mayr, Doris pref LMU Munich, Pathology may have a conflict of interest.
Funding
The authors received no financial support for the research, authorship, and/or publication of this article.