
Abstract
Inosine-5′-monophosphate dehydrogenase catalyzes the critical step in the de novo synthesis of guanosine nucleotides: the oxidation of inosine monophosphate to xanthosine monophosphate. This reaction can be inhibited by specific inhibitors, such as ribavirin or mycophenolic acid, which are widely used in clinical treatment when required to inhibit the proliferation of viruses or cells. However, it was recently found that such an inhibition affects the cells, leading to a redistribution of IMPDH2 and the appearance of IMPDH2 inclusions in the cytoplasm. According to their shape, these inclusions have been termed “Rods and Rings” (R&R). In this work, we focused on the subcellular localization of IMPDH2 protein and the ultrastructure of R&R inclusions. Using microscopy and western blot analysis, we show the presence of nuclear IMPDH2 in human cells. We also show that the nuclear pool has an ability to form Rod structures after inhibition by ribavirin. Concerning the ultrastructure, we observed that R&R inclusions in cellulo correspond to the accumulation of fibrous material that is not surrounded by a biological membrane. The individual fibers are composed of regularly repeating subunits with a length of approximately 11 nm. Together, our findings describe the localization of IMPDH2 inside the nucleus of human cells as well as the ultrastructure of R&R inclusions.
Keywords
Introduction
Inosine-5′-monophosphate dehydrogenase (IMPDH) is a key enzyme in the de novo biosynthesis of guanosine nucleotides. IMPDH catalyzes the NAD-dependent oxidation of inosine 5′-monophosphate (IMP) to xanthosine 5′-monophosphate, the first and rate-limiting step toward the synthesis of guanosine triphosphate (GTP) from IMP (Magasanik et al. 1957; Hedstrom and Gan 2006; Hedstrom 2009).
Inhibition of IMPDH results in a decrease in the levels of intracellular guanosine nucleotides. Guanosine nucleotide deficiency is expected to inhibit not only proliferation of eukaryotic cells, but also the replication of DNA and RNA viruses (Markland et al. 2000). In this respect, it has been shown that IMPDH inhibition has the strongest influence on both T- and B-lymphocytes because they are critically dependent on de novo synthesis, rather than using the salvage pathway for guanosines (Allison et al. 1977; Allison and Eugui 2000; Takebe et al. 2004). Thus, IMPDH seems to be an important clinical target, and IMPDH inhibitors have received growing interest in recent years as drugs for antiviral, antibacterial, anti-proliferative, and immunosuppressive treatments (Nair and Shu 2007; Shu and Nair 2008; Petrelli et al. 2013). A variety of IMPDH inhibitors have been reported (as reviewed in Sintchak and Nimmesgern 2000; Petrelli et al. 2013). The most well-known and clinically used inhibitors of IMPDH are mycophenolic acid, ribavirin and mizoribin (Matyugina et al. 2012). Mycophenolic acid, or its prodrug, Mycophenolate Mofetil, is prescribed as an immunosuppressive drug to prevent rejection during organ transplantation (Kaufman et al. 2004) as well as in the treatment of systemic lupus erythematosus (Merrill 2012). The guanosine analogs, ribavirin and mizoribin, are used against a number of DNA and RNA viruses (Nair and Shu 2007); ribavirin is mostly used in combination with interferon α for treatment of chronic hepatitis C (Hofmann et al. 2008).
Immunocytochemical and biochemical studies have revealed that, after treatment with inhibitors, the IMPDH enzyme, which is normally diffusely distributed throughout the cytoplasm, is reorganized into cytoplasmic inclusion bodies (Gunter et al. 2008; Carcamo et al. 2011; Thomas et al. 2012). IMPDH inclusions, for instance, have been named “Rods and Rings” (R&R) according to their apparent shape (Dellavance et al. 2009; Seelig et al. 2011). Distinct cytoplasmic rings (~2–5 µm in diameter), rods (~3–10 µm in length) and intermediate structures, such as “figure-eights”, twisted rings, elongated rings, or needle-like structures, were initially observed in a routine immunofluorescence screening using human autoantibodies (Carcamo et al. 2011; Keppeke et al. 2012; Carcamo et al. 2014). These cytoplasmic inclusions are enriched in IMPDH type II (IMPDH2), which is highly abundant in neoplastic and differentiating cells (Natsumeda et al. 1990; Konno et al. 1991). However, the presence of IMPDH1 cannot be excluded from R&R structures (see Carcamo et al. 2011). Concerning other metabolically related enzymes, there are contradictory reports on the presence of cytidine triphosphate synthase in IMPDH inclusions (Carcamo et al. 2011; Probst et al. 2013).
R&R formations can be induced in many immortalized cell lines (Hep2, HeLa, CAL 27, HCT116, THP-1 and 3T3) and primary cells (mouse primary cardiomyocytes), but they have also been found in untreated embryonic stem cells and in freshly defrosted cultured cells (Carcamo et al. 2011). At the subcellular level, R&R structures appear to be unrelated to any other known cytoplasmic organelles, such as the Golgi complex, centrosomes, GW bodies or primary cilia. Also, it has been shown that R&R structures are not enriched in actin, tubulin or vimentin (Carcamo et al. 2011). R&R inclusions thus seem to be novel, genuine cellular structures. Despite this, the structures and functions of these poorly recognized inclusions need further research.
In order to expand upon the current information regarding R&R structures, in this study we focused on the subcellular distribution of IMPDH2 protein and the fine structure of R&R inclusions in cellulo.
Materials & Methods
Cell Culture
A Hep2 cell line of human origin (HeLa derivative; for more details see Chen 1988; Lacroix 2008) obtained from European Collection of Cell Cultures (Salisbury, United Kingdom) was cultured in Dulbecco’s modified Eagle’s medium (DMEM, GIBCO, Life Technologies; Prague, Czech Republic) supplemented with 10% fetal bovine serum (GIBCO) and 1% penicillin/streptomycin sulfate (PAA Laboratories; Pasching, Austria) under standard conditions.
Induction of R&R Formation using IMPDH Inhibitors
R&R formation was induced by treatment of cells with ribavirin (R9644) or Mycophenolic acid (M5255, both from Sigma-Aldrich; Prague, Czech Republic). Inhibitors were added to live cells grown in DMEM at a final concentration described below. Cells were incubated in medium with inhibitors for durations ranging from 1 min to 48 hr.
Immunofluorescence
For immunofluorescence detection, Hep2 cells were grown on round coverslips, fixed with 4% formaldehyde in PBS (pH 7.4) for 10 min, washed in PBS, permeabilized with 0.3% Triton X-100 for 10 min and washed several times in PBS. Nonspecific sites were blocked with 5% normal goat serum (NGS; Sigma-Aldrich) in PBS. Cells were incubated with primary antibody diluted in PBS containing 1% (w/v) BSA (Sigma-Aldrich) and 0.2% Tween-20 (Sigma-Aldrich) for 1 hr, washed thoroughly in PBS and incubated with secondary antibody for 45 min. Coverslips were washed several times in PBS and once in water, then mounted onto cells using home-made mowiol containing DAPI (4’,6-diamidino-2-phenylindole, Sigma-Aldrich) to counterstain the DNA. As a primary antibody, rabbit anti-IMPDH2 (12948-1-AP, Proteintech; Manchester, United Kingdom), or human autoimmune sera with reactivity to R&R (a gift from the laboratory of Prof. Luis Eduardo C. Andrade, Universidade Federal de São Paulo, Brazil; Keppeke et al. 2012) were used. Secondary antibodies used were goat anti-rabbit and goat anti-human antibodies conjugated with FITC or Cy3 (Jackson ImmunoResearch Laboratories; West Grove, USA). Both anti-IMPDH2 and human autoimmune serum provided similar results. For all antibodies, the background labeling was determined by incubating samples in the absence of the primary antibody. All cell processing steps for immunocytochemistry were performed at room temperature.
Images, including Z-stacks, were acquired with a Leica TCS SP5 confocal microscope using a 63× plan-apochromat 1.4 NA oil immersion objective (Leica Microsystems, GmbH; Wetzlar, Germany). Individual fluorescence signals were detected with sequential excitation to avoid possible cross-talk.
Pre-embedding Immunolabeling of IMPDH
Hep2 cells were treated with ribavirin for 24 hr. The cells were then fixed with the 2% formaldehyde in 0.2 M PIPES (pH 7.2) for 15 min and permeabilized with 0.2% Triton X-100 in PBS for 10 min. After blocking with 5% NGS in PBS for 30 min, the cells were then incubated in rabbit anti-IMPDH2 antibody (12948-1-AP) diluted 1:30 in BSA/PBS/Tween-20. After several washing steps, the cells were then incubated in goat anti-rabbit secondary antibody conjugated with ultra-small gold (Aurion; Wageningen, The Netherlands) diluted 1:50 in 1% BSA/PBS. The immunolabeled cells were then washed and post-fixed with 2.5% glutaraldehyde in PBS. After several washing steps with PBS followed by distilled water, the cells were incubated with a silver enhancement reagent (R-GENT SE-EM, Aurion) for 30 min, according to the manufacturer’s protocol. The cells were washed again with distilled water, dehydrated in increasing concentrations of ethanol (30%, 50%, 70%, 90% and 100%) and infiltrated with Araldite/Embed 812 (Epon-812, Electron Microscopy Sciences; Hatfield, PA). All of the previous steps were completed at room temperature. Polymerization was carried out at 60C for 72 hr (adapted from Smigova et al. 2011). Such prepared samples were sectioned into ~200-nm thin sections and used for electron tomography (see below).
Western Blot Analysis
Cells grown to subconfluence were released using 1 mM EDTA/PBS solution at 4C, collected and centrifuged at 2000 rpm at 4C for 1 min. The cells were resuspended in a hypotonic solution consisting of 10 mM HEPES, 10 mM KCl, 0.1 mM EDTA, 1 mM DTT (all from Sigma-Aldrich) and Protease Inhibitor Cocktail Set III, EDTA-free (Merck Millipore; Prague, Czech Republic) and incubated on ice for 15 min. Then Igepal CA-630 (Sigma-Aldrich) was added to obtain a 0.6% solution. The mixture was vigorously vortexed and centrifuged at 13000 rpm at 4C for 30 sec. The supernatant was kept as the cytoplasmic fraction. Pelleted nuclei were resuspended in hypotonic solution, this time without Igepal, and centrifuged at 13000 rpm at 4C for 30 sec. The resultant pellet, which represented the nuclear fraction, was visually checked using a phase-contrast microscope. Both cytoplasmic and nuclear fractions were lysed using 2× Laemmli sample buffer. For whole cell lysates, cells were washed with PBS and immediately lysed using 2× Laemmli sample buffer with additional Protease Inhibitor Cocktail Set III, EDTA-free (Merck Millipore). Lysates were heated to 95C for 3 min and cooled on ice. Proteins were then loaded onto 10% polyacrylamide gels, separated by SDS-PAGE at 120–150 V, and transferred onto nitrocellulose membranes (Protran, GE Healthcare Life Sciences; Prague, Czech Republic) at 100 V for 1 hr.
After blocking in 5% non-fat milk (Bio-Rad; Prague, Czech Republic), the membranes were incubated at room temperature for 3 hr with primary antibodies, washed, incubated for 1 hr with secondary antibodies conjugated with horseradish peroxidase, and then washed again. For primary antibodies, anti-IMPDH2 (12948-1-AP, Proteintech), anti-ATP5B (sc-16690, Santa Cruz; Dallas, TX) and anti-fibrillarin (ab5821, AbCam; Cambridge, United Kingdom) were used. Horseradish peroxidase activity was visualized by chemiluminescence (ECL detection kit, Thermo Scientific; Rockford, IL) and captured using X-ray films (Foma Bohemia; Hradec Králové, Czech Republic). Films were scanned using an Epson Perfection V700 flatbed scanner (Epson, Suwa, Nagano Prefecture, Japan). Data were analyzed using ImageJ 1.48d software (NIH, Bethesda, MD).
High-pressure Freezing (HPF) and Freeze Substitution
Hep2 cells were grown on 1.4-mm sapphire discs (Leica Microsystems) in Petri dishes. Ribavirin was added to medium 24 hr before fixation. Sapphire discs with cells were dipped into cryofiller, 20% BSA (Sigma-Aldrich) in CO2-independent medium supplemented with L-glutamine (GIBCO) containing 10% FBS (GIBCO), and transferred into a membrane copper carrier that was placed into the fork of the rapid loader. Samples were then automatically frozen by inserting the rapid loader into the rapid transfer system (Leica EM RTS) of the Leica EM PACT high pressure freezer.
Frozen samples were then processed using a freeze substitution apparatus (Leica EM AFS2) equipped with an automatic processor (Leica EM FSP). Cells were freeze-substituted in 0.1% uranyl acetate in acetone (EM grade, Polysciences; Warrington, PA) starting at −90C for 48 hr. Thereafter, the temperature was raised to −50C. The samples were then kept at −50C in 0.1% uranyl acetate in acetone for 24 hr. After freeze substitution, the cells were washed with acetone and infiltrated with Lowicryl HM20 monostep (Electron Microscopy Sciences). The samples were agitated during all steps of substitution, washing, and infiltration. Lowicryl, used for low temperature embedding, was bubbled with nitrogen gas before use to improve the process of polymerization. Polymerization was performed at −50C for 26 hr and followed by gradually increasing the temperature to 20C over a 14-hr period. Final hardening of resin was performed at 20C for 24 hr. Polymerization of Lowicryl resin was conducted under an ultraviolet LED lamp (Leica EM FSP), as described elsewhere (Smigova et al. 2011).
Polymerized blocks were cut with a Leica Ultracut S ultramicrotome into serial ultrathin sections (70 nm). For tomography experiments, ~200-nm resin sections were prepared. Sections were collected on nickel slot grids or finder grids (Electron Microscopy Sciences) coated with formvar-carbon film. Unstained or heavy metal salt-stained resin sections were observed using an FEI Tecnai G2 Sphera (Eindhoven, The Netherlands) or Zeiss 900 (Oberkochen, Germany) electron microscope in all electron-microscopic experiments.
Post-embedding Immunolabeling for Correlative Light and Electron Microscopy
Sections were exposed to a blocking solution consisting of 5% donkey serum in PBS for 20 min and then incubated with anti-IMPDH2 antibody (12948-1-AP) diluted in 2% BSA in PBS containing 0.2% Tween-20 for 1 hr at room temperature. After washing, sections were incubated with goat anti-rabbit secondary antibody. To correlate fluorescence and electron microscopy signals, immunogold and immunofluorescence labeling on resin sections was performed. Immunolabeled sections were stained with DAPI. In all immunocytochemical control experiments, the primary antibodies were omitted resulting in negligible background signals.
Electron Tomography
Single-axis tomographic datasets of ~200-nm thick resin sections of frozen and freeze-substituted cells or pre-emdedding immunolabeled cells were acquired using an FEI Tecnai G2 Sphera equipped with a LaB6 gun and a 2K Gatan Ultrascan 1000 CCD, operated at 200 kV. Projections were recorded with a range of ±65 degrees with 1 degree steps, with a nominal defocus of −2 µm at a magnification of 19000×, and yielding a pixel size of 0.53 nm. 3D reconstructions were computed by the weighted back-projection method in IMOD (Kremer et al. 1996) and post-reconstruction angularly filtered according to (Kovacik et al. 2014) in order to suppress missing wedge artefacts.
Results
Initial Analyses of IMPDH2 Redistribution after Treatment with Different Inhibitors
To study the changes in IMPDH2 distribution after treatment, we performed immunofluorescence labeling for confocal laser scanning microscopy. To induce the R&R pattern in cellulo, we used two different IMPDH inhibitors: ribavirin and mycophenolic acid. The cells were treated with different final concentrations of inhibitors for various time intervals (ranging from 1 min to 48 hr).
Surprisingly, the process of R&R pattern formation was very fast, and short rods were detected after only 1 min of incubation with inhibitors (Supplemental Fig. S1). However, we observed that typically shaped and sized R&R inclusions were formed 1 hr after inhibitor addition (Supplemental Fig. S1). The minimal inhibitor concentration needed for R&R pattern induction was 1 and 0.5 µM for ribavirin and mycophenolic acid, respectively (Supplemental Fig. S2). Although these minimal concentrations evoked the R&R pattern in most of the cells, the remaining diffuse cytoplasmic signal of IMPDH2 was still strong. The diffuse signal disappeared at concentrations of about 4 µM and 2 µM for ribavirin and mycophenolic acid, respectively. At these concentrations, virtually all of the detectable enzyme was compartmentalized into R&R structures (Supplemental Fig. S2). A further increase in inhibitor concentration had no effect on the appearance of the R&R structures. Induced inclusions appeared the same after ribavirin or mycophenolic acid treatment. Therefore, in all further experiments, we used 4 µM ribavirin for 1 or 24 hr, as this treatment was sufficient to efficiently evoke the R&R pattern.
All presented experiments were performed on Hep2 cells because these cells have been widely used in IMPDH field, and because the R&R pattern was originally found using commercial Hep2 cell slides used for autoantibody screening (Carcamo et al. 2011; Keppeke et al. 2012). Importantly, human U-2 OS, Hep G2 and mouse MH22A and NIH 3T3 cell lines were also tested using fluorescence microscopy, with similar results identified to those obtained with Hep2 cells (Supplemental Fig. S3).
IMPDH2 Redistribution after Inhibition and Evidence of its Nuclear Localization
Hep2 cells were immunolabeled with IMPDH2 antibody (Figs. 1A and 2A) and nuclei were counterstained with DAPI (Figs. 1B and 2B). In control cells, immunofluorescence showed an intense, diffuse pattern of IMPDH2 throughout the cytoplasm (Fig. 1A, 1C). Moreover, top and side views of single optical sections with enhanced contrast revealed the presence of IMPDH2 signals inside the cell nucleus (Fig. 1D). A plot of the fluorescence intensity showed that the detected nuclear IMPDH2 signal was stronger than the background signal from outside the cell (Fig. 1E) and stronger than the signal from a negative control (primary antibody omitted; data not shown). Also, we observed that the nuclear IMPDH2 signal was diffusely localized mostly in DAPI-free regions (Figs. 1D and Supplemental Fig. S4).
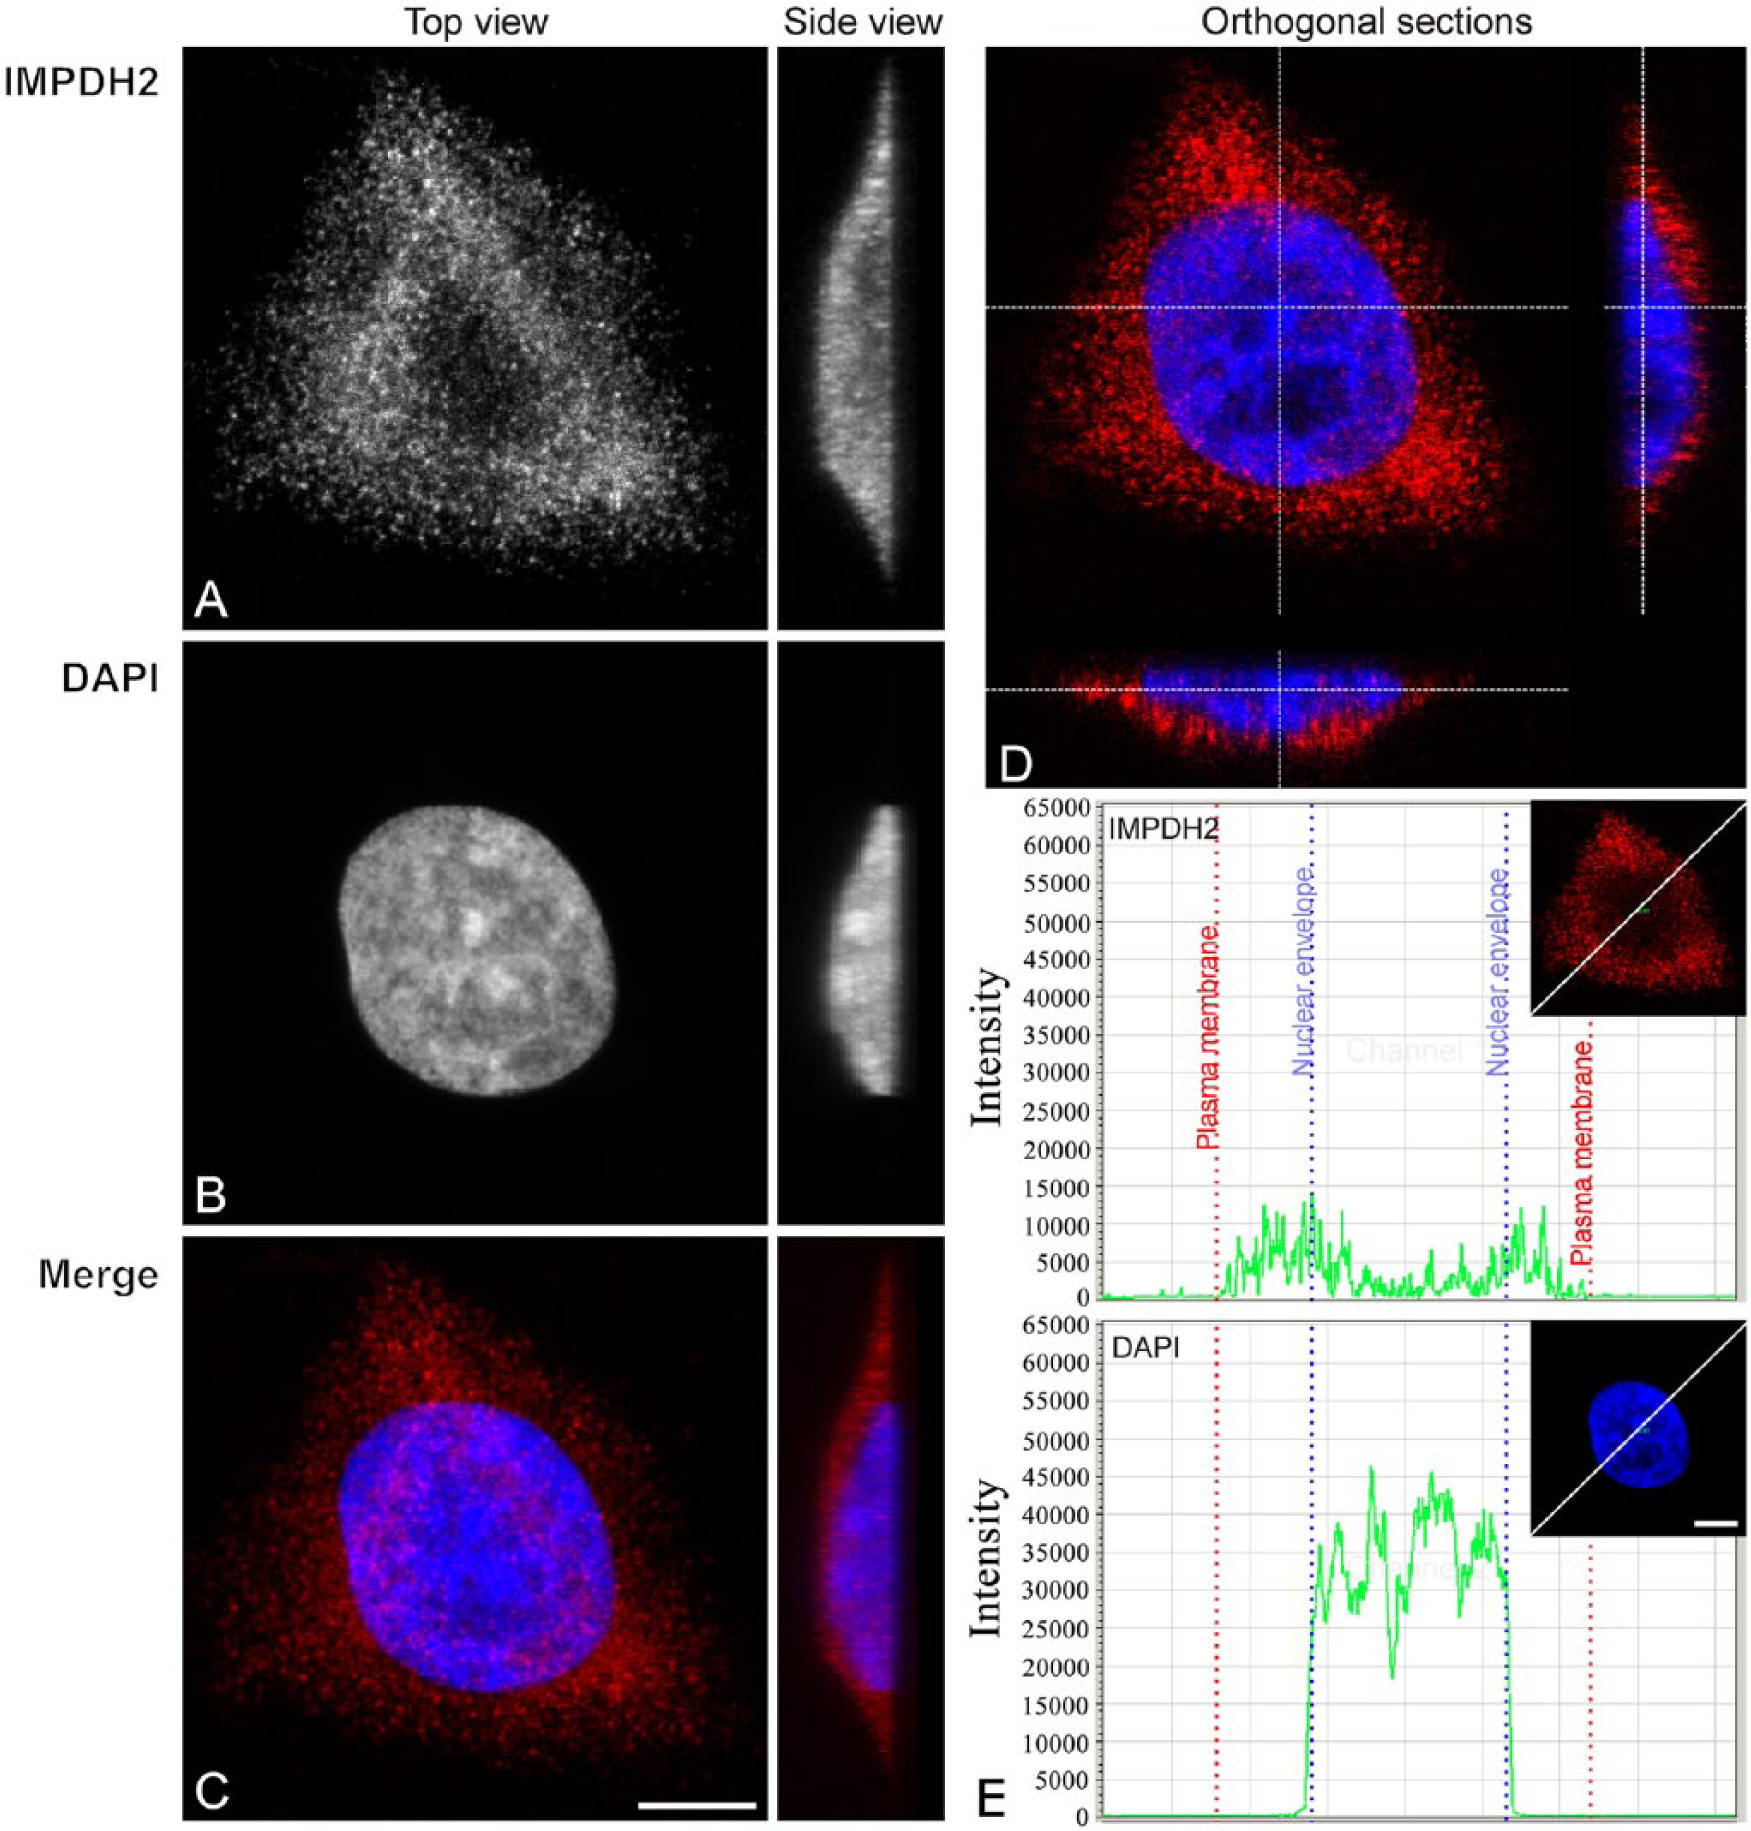
Immunofluorescence localization of the IMPDH2 protein in untreated cells. Hep2 cells, free of any treatment, showed mainly cytoplasmic localization of the immunolabeled IMPDH2 protein. (A–C) Maximum intensity Z-projections (top and side views) of the cell labeled with anti-IMPDH2 antibody (A) and DAPI (B), and merge of both signals (C). (D) IMPDH2 immunofluorescence showed lower levels of the IMPDH2 signal inside the nucleus. One optical section and reconstructed orthogonal x–z- and y–z-sections are shown. (E) IMPDH2 and DAPI intensity profiles show that the detected nuclear IMPDH2 signal is stronger than the background signal from outside of the cell. Scale bars, 7.5 µm.
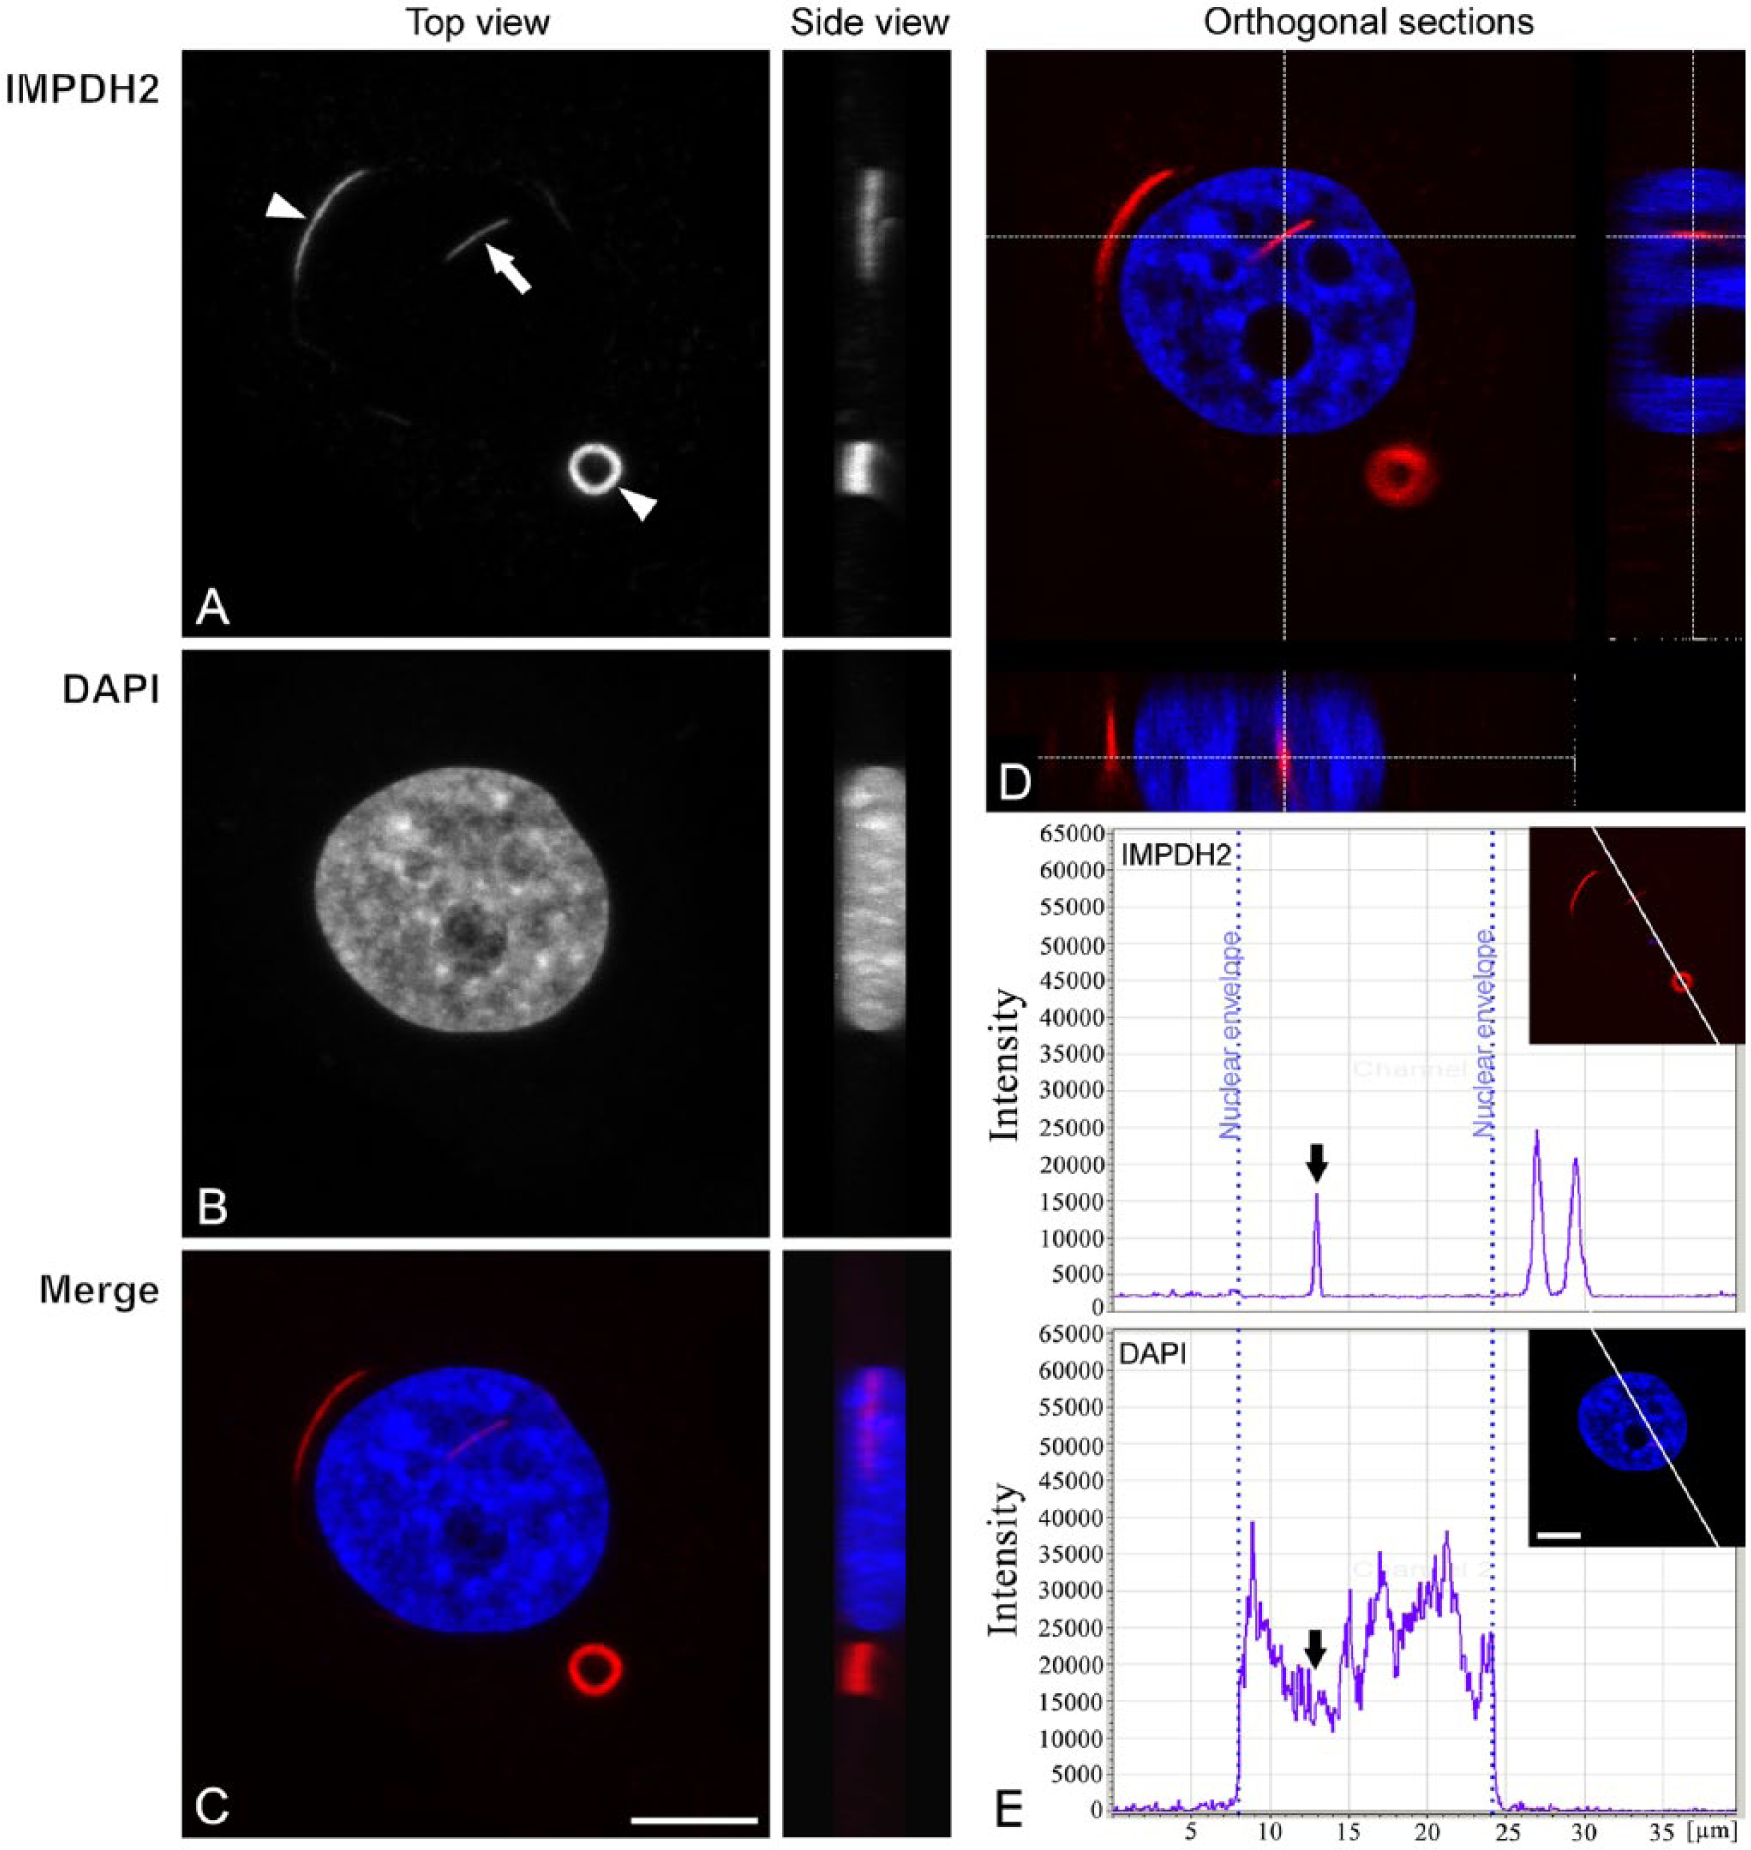
Redistribution of IMPDH2 after ribavirin treatment. Hep2 cells were treated with ribavirin for 1 hr and then immunolabeled with anti-IMPDH2 antibody (A) and counterstained with DAPI (B). The merged image of these signals is shown in (C). In ribavirin-treated cells, the IMPDH2 protein formed cytoplasmic “Rods and Rings” (R&R) structures (white arrowheads). Further, usually one nuclear Rod was detected in each cell with inhibited IMPDH2 protein (white arrow). Unlike cytoplasmic Rods, the nuclear Rod was straighter and thinner. (A–C) Maximum intensity projections of the cell volume from the top and side views. (D) One optical section and reconstructed orthogonal x–z- and y–z-sections show the position of the nuclear Rod in the cell nucleus. (E) Plots of fluorescence intensities along a line are shown for IMPDH2 and DAPI. Note that variations in fluorescence intensity of IMPDH2 after ribavirin treatment were reduced to background levels and 3 peak-values. Most of the IMPDH2 signal was associated almost entirely with R&R structures. The nuclear Rod structure is localized in area with low DAPI signal (black arrows). Scale bars, 7.5 µm.
In ribavirin-treated cells, the intracellular pattern of IMPDH2 was highly organized and compartmentalized into R&R structures (Fig. 2A, 2C, and a single optical section in 2D). The plotted fluorescence intensity showed that the R&R formation was associated with a relocation of IMPDH2 into inclusions, with the appearance of strong fluorescence peaks corresponding to the R&R inclusions; the fluorescence signals outside the R&R structures was reduced to the background signal (Fig. 2E). The accumulation of IMPDH2 signals into inclusions also allowed us to visualize the nuclear form of IMPDH2. The IMPDH2 signal inside the treated nucleus formed a clearly visible, predominantly Rod-shaped structure that was thinner and straighter than the cytoplasmic Rods. The length of the nuclear Rod structure varied greatly, ranging from 1 µm to 4 µm, with a mean range from 2 µm to 2.5 µm. Usually, only one Rod inclusion per nucleus was detected. The nuclear Rod structure was detected in nearly all cells in culture after 24 hr treatment.
To verify the nuclear localization of IMPDH2 protein, we performed electron microscopy on the ribavirin-treated Hep2 cells. At the ultrastructural level, the Rod structure was clearly found to be within the nucleoplasm, as no invaginations of the nuclear envelope were detected in this area (Fig. 3A). The nuclear localization of the IMPDH2-labeled Rod structure was verified by three-dimensional analysis of thick resin sections using electron tomography (Fig. 3B). We observed that the fibrous rod-shaped structure passed through the interchromatin compartment of the cell nucleus.
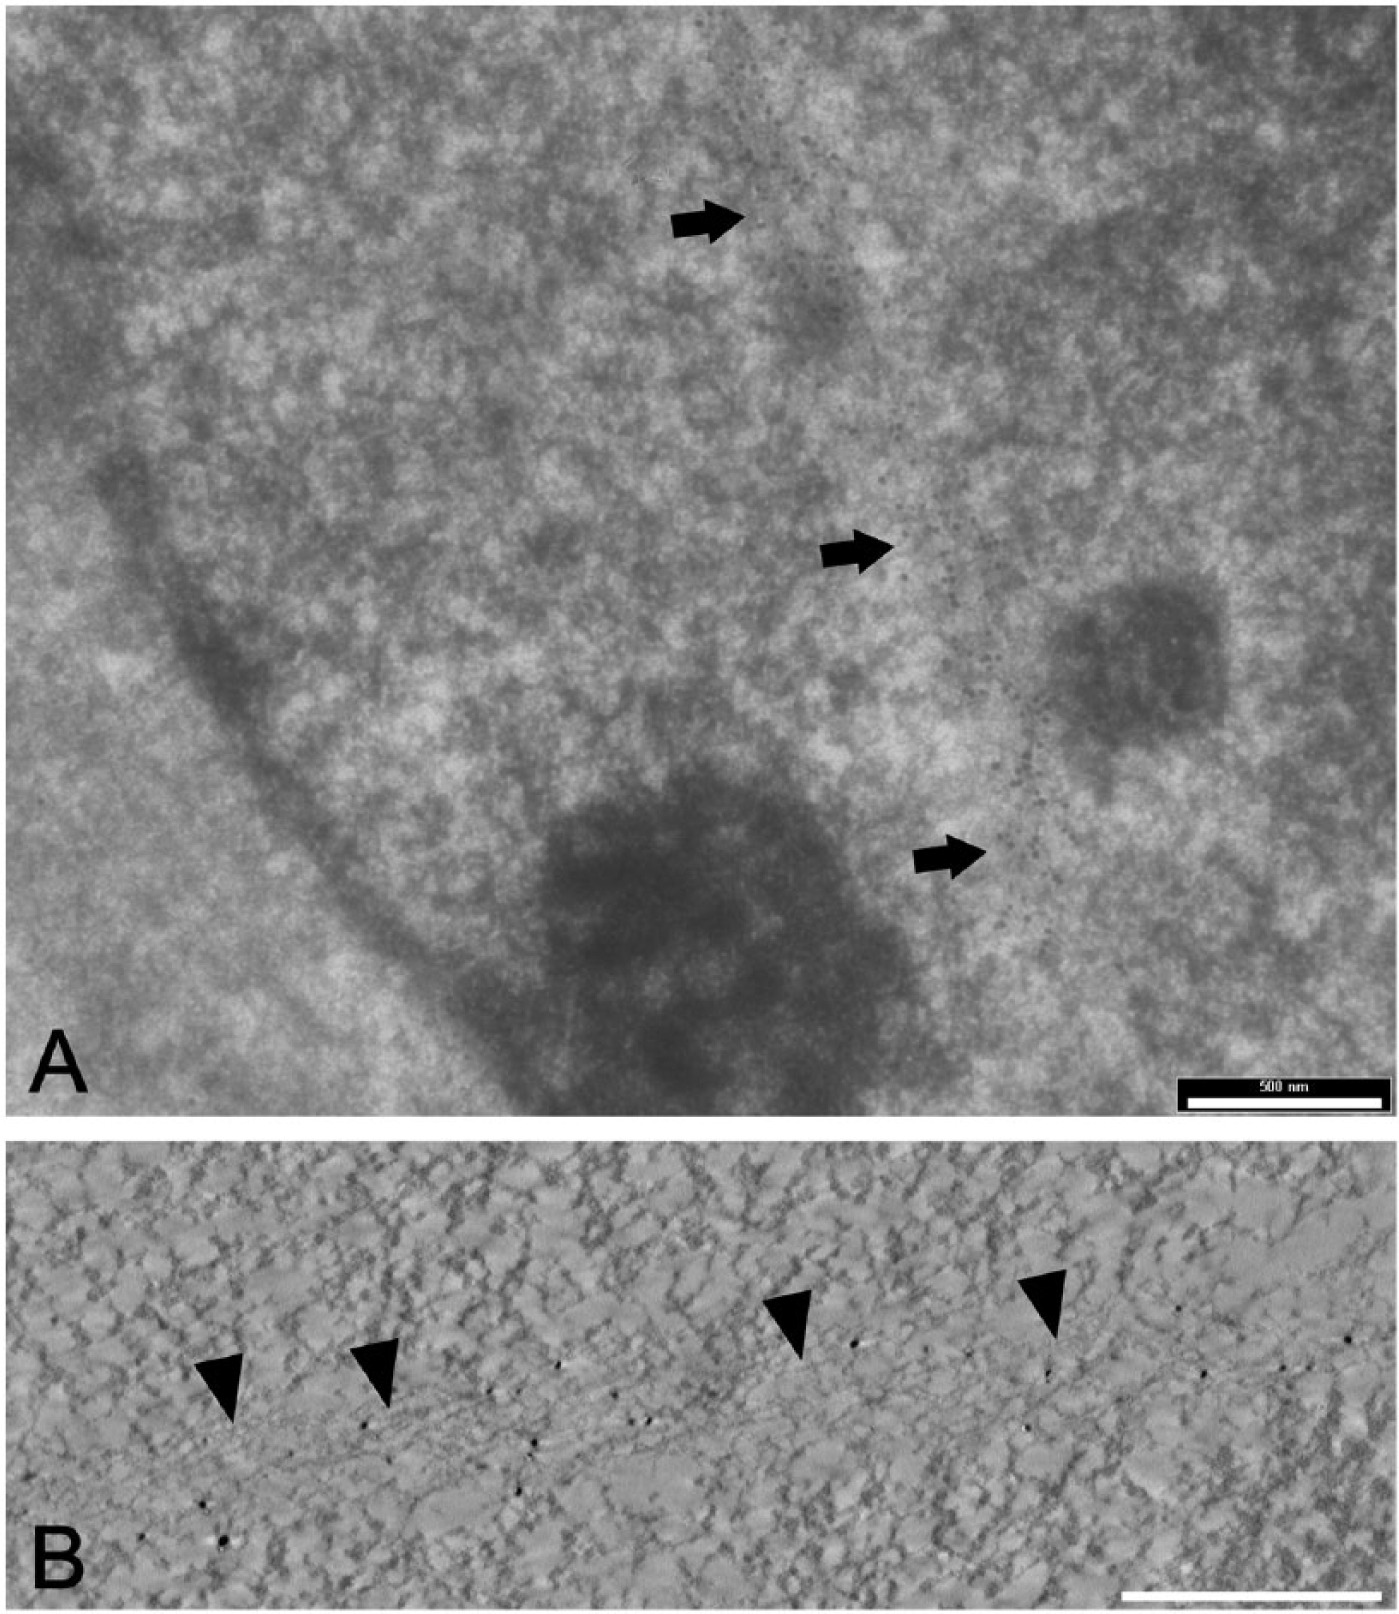
The evidence of the nuclear IMPDH2 protein. Pre-embedding immunogold labeling of nuclear IMPDH2 protein in ribavirin-treated Hep2 cells. (A) Nuclear Rod structure (arrows) decorated by immunogold particles against IMPDH2 provides direct evidence for the presence of IMPDH2 protein inside the nucleus. (B) An x–y cross-section through the electron tomography reconstruction of the same area showing the fibers decorated by silver-enhanced gold particles in detail (arrowheads). Scale bars, 500 nm.
The nuclear localization of IMPDH2 protein was also confirmed by western blot analysis. The electrophoretic mobility of IMPDH2 protein detected by western blot in ribavirin-treated cells was the same as that in untreated cells (Fig. 4). The total amount of IMPDH2 protein in treated cells was slightly higher (up to 15%) according to data normalized to loading control (Amido black staining; Fig. 4A) and compared with untreated controls. Subsequently, we analyzed the subcellular fractions (cytoplasmic and nuclear) of both untreated and treated cells (Fig. 4B). As fraction controls, we used the beta subunit of ATP synthase (ATP5B) and fibrillarin for cytoplasmic and nuclear fractions, respectively. Using IMPDH2 immunolabeling, we detected bands with a size of ~55 kDa in both subcellular fractions. We also showed that the nuclear IMPDH2 protein is present in considerable amounts in untreated as well as treated cells. However, in treated cells, the nuclear fraction was significantly higher than that in untreated cells (Fig. 4B).
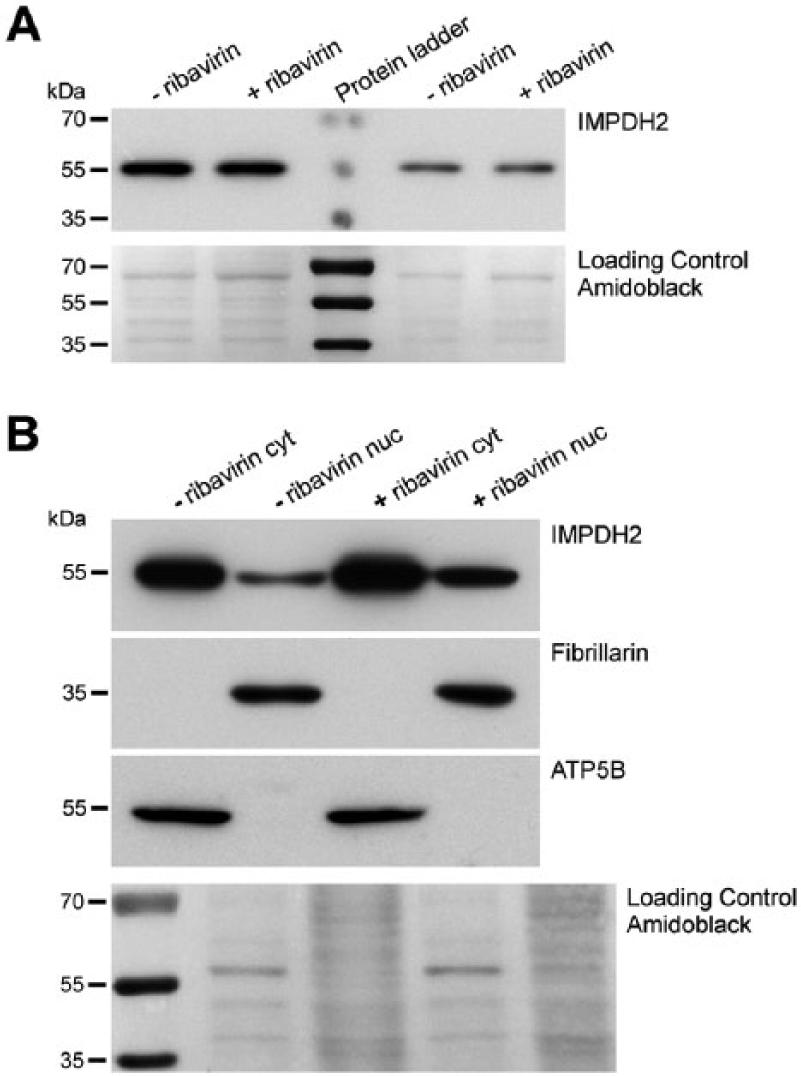
Western blot analysis of IMPDH2 protein and its subcellular fractions. (A) The transblots of whole cell lysates of untreated and ribavirin-treated Hep2 cells were immunolabeled against IMPDH2. The total load of proteins in each of two left and two right lanes was balanced and corresponds to 20 µg and 10 µg, respectively. (B) The transblots of cytoplasmic and nuclear fractions of both untreated and ribavirin-treated cells were immunolabeled against IMPDH2, a subunit of ATPase (ATP5B) and fibrillarin. The total load of proteins in each line is 40 µg. (A, B) Amido black staining was used as a loading control. Positions of molecular mass standards are depicted by bars and corresponding numerical values in kDa. Abbreviations: ribavirin, ribavirin untreated lysates; + ribavirin, ribavirin-treated lysates; cyt, cytoplasmic fraction; nuc, nuclear fraction.
Ultrastructure of R&R inclusions and Fine Structure of IMPDH2 Fibers
To achieve structural preservation of R&R inclusions and high efficiency of post-embedding immunocytochemistry, we performed high-pressure freezing followed by freeze substitution and Lowicryl embedding of ribavirin-treated Hep2 cells. The processed cells were used for correlative fluorescence and electron microscopy (CLEM) allowing us to ensure that the ultrastructure of the IMPDH2 inclusion, as defined by fluorescence microscopy, is observed. CLEM increased our ability to localize and distinguish the inclusions, and immunogold labeling provided sensitive IMPDH2 detection. The correlation was performed on ultrathin resin sections where post-embedding immunofluorescence labeling (Fig. 5A) and DAPI counterstaining (Fig. 5B) were followed by electron microscopy of the localized structures (Fig. 5C–5G). We observed that both types of inclusions, Rings (white arrow in Fig. 5) as well as Rods (yellow arrows in Fig. 5), showed similar ultrastructures (Fig. 5E, 5G), as both were arranged in the form of long fibers. The fibers were interwoven with each other, but were oriented mainly in parallel with the long axis of the Rod structure and around the circumference of the Ring structure. Bundles of fibers were not surrounded by a biological membrane and were localized in the cytosol (Fig. 5E, 5G) or the nucleoplasm (Fig. 3A, 3B).
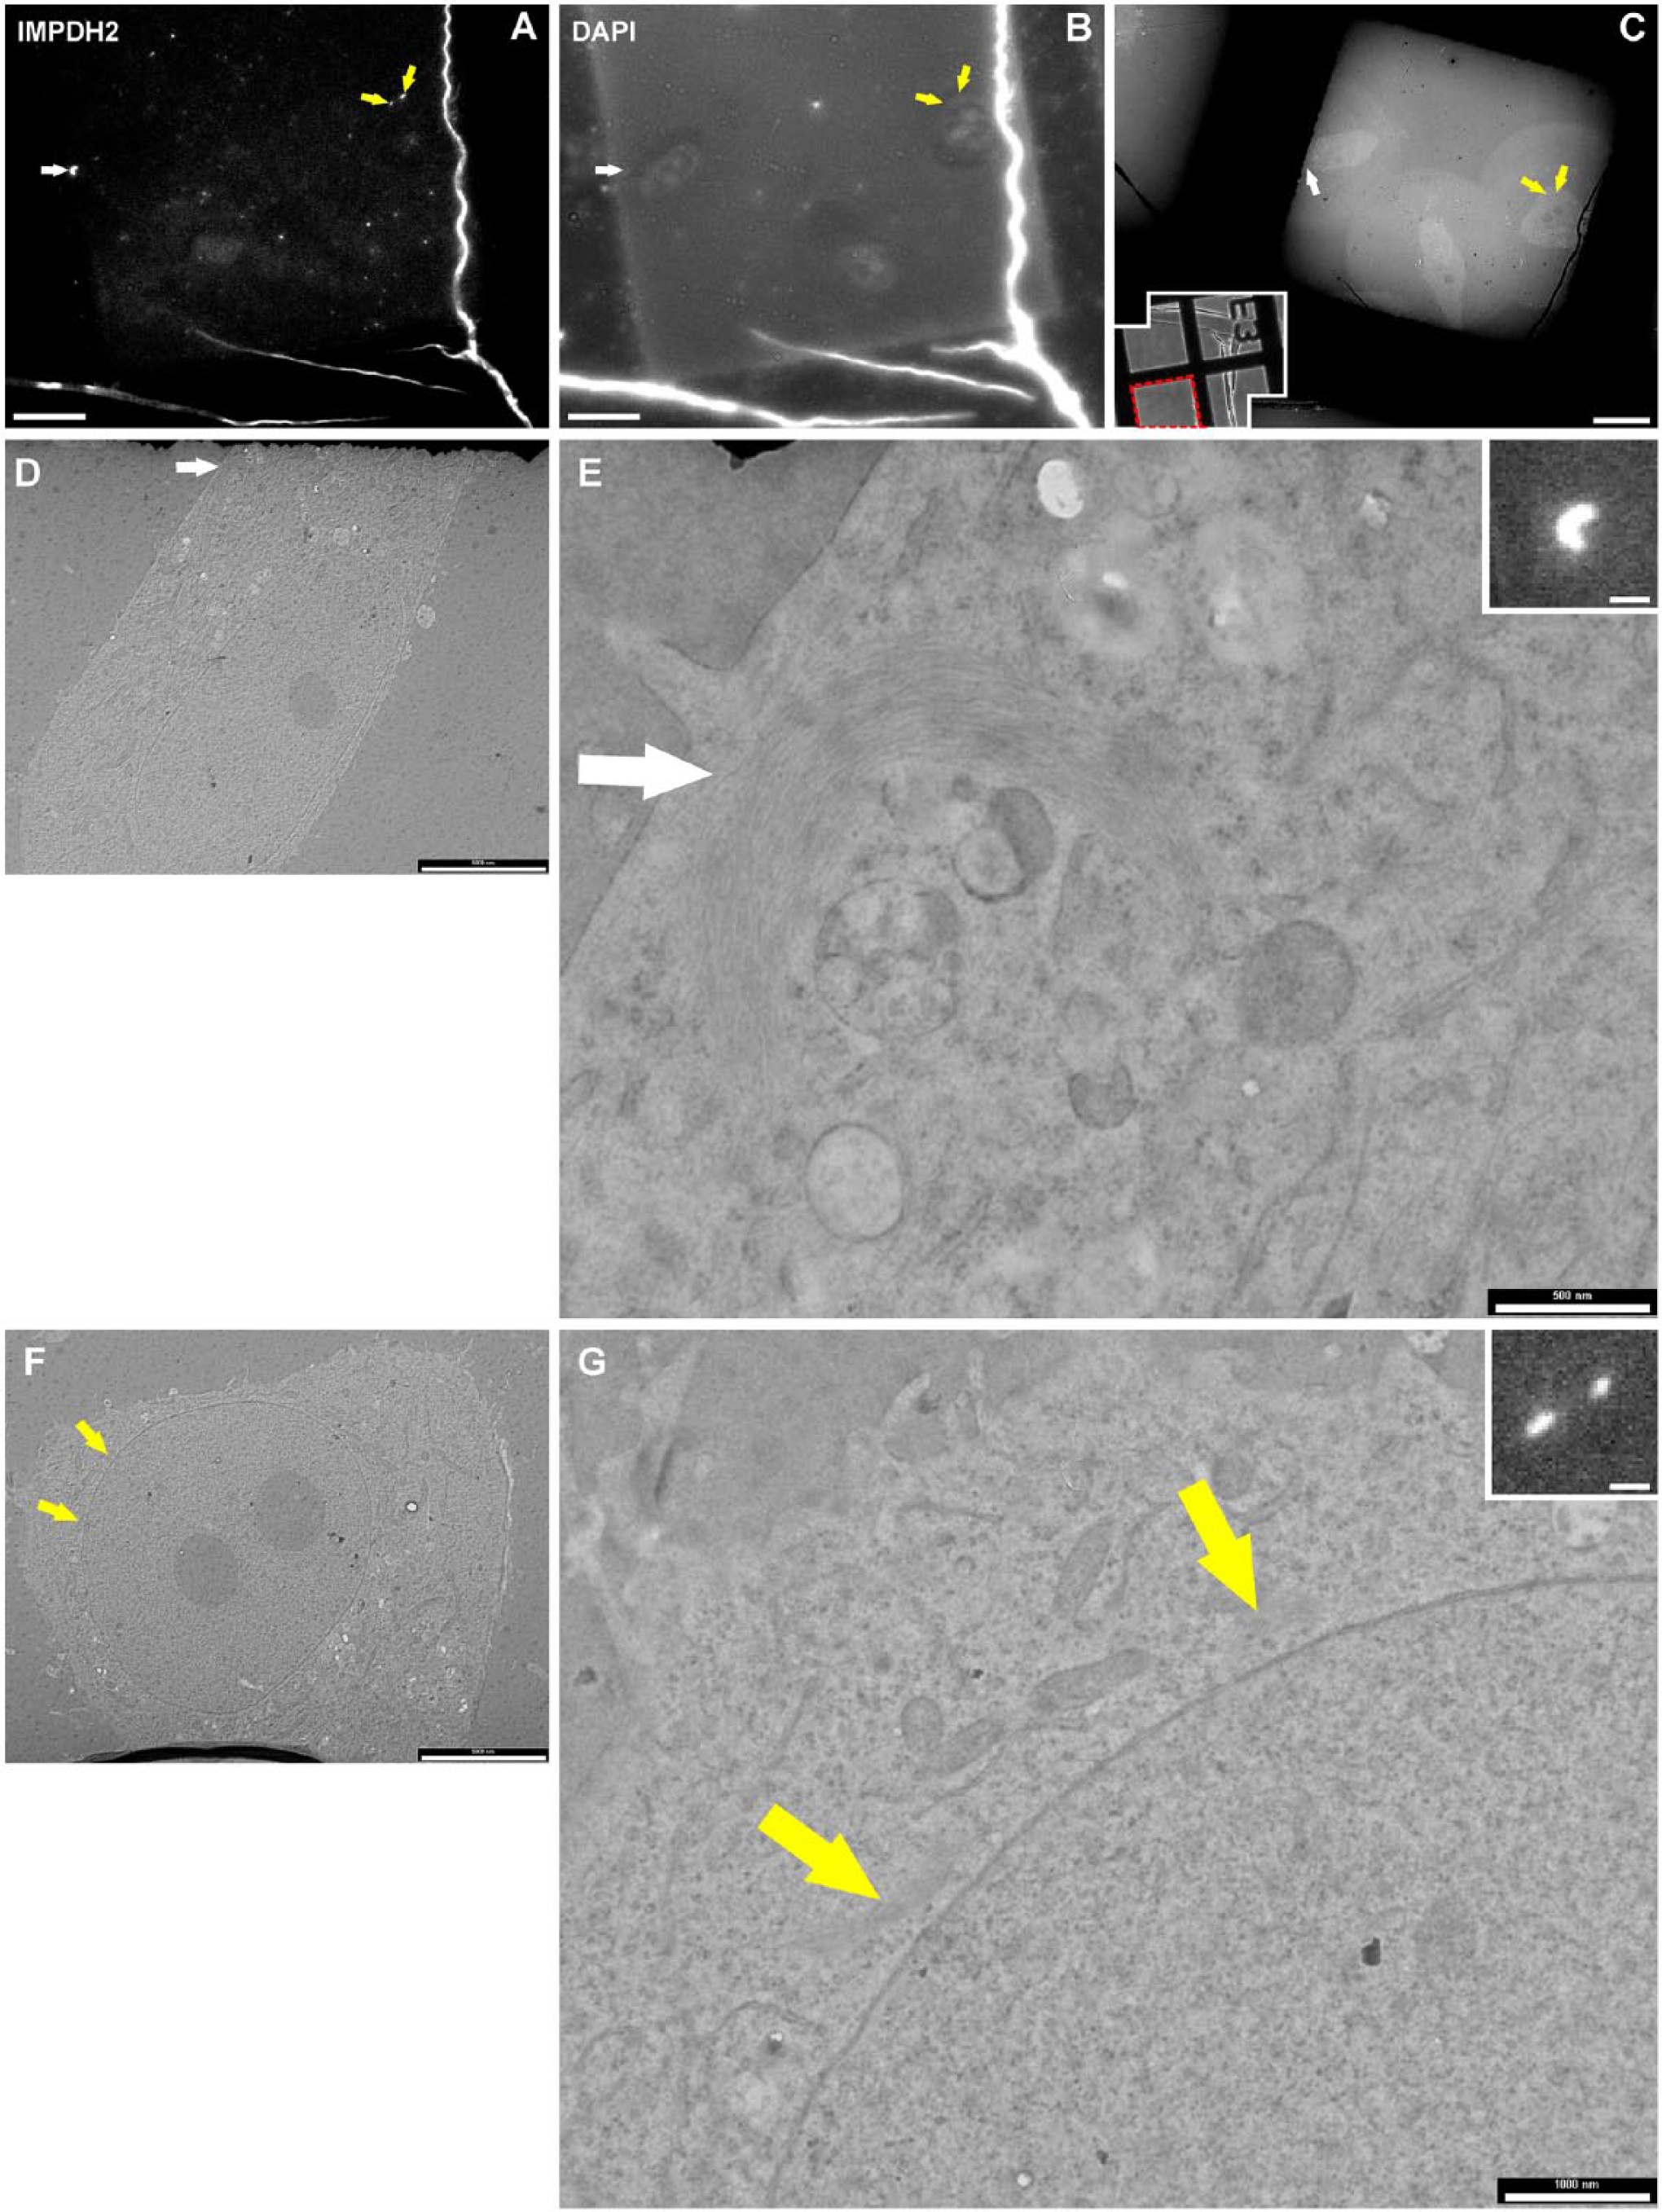
Correlative light and electron microscopy of “Rods and Rings” (R&R) structures. Correlative light and electron microscopic images show the ultrastructure of R&R inclusions, which were initially identified by immunofluorescence microscopy of Hep2 cells. (A, B) Overview images of cells of interest that were labeled with (A) anti-IMPDH2 antibody (arrows point to the searched structures) and (B) DAPI. In all pictures: white arrows point to the Ring structure in one cell, yellow arrows point to the Rod structure in another cell. (C) An overview electron micrograph recorded from the same area as fluorescence images. (Inset in C) Low magnification image of the alphabetical grid at coordinate E3 and the area of interest in the red dashed square (left-hand lower corner). (D–G) Transmission Electron Microscopy images of the R&R structures at higher magnifications showing that both types of inclusions, Rings as well as Rods, correspond to accumulations of fibrous material (white/yellow arrows). (Insets in E and G) Magnified fluorescence images of corresponding structures. Scale bars: A–C = 20 µm, D, F; insets in E, G = 5 µm, E = 500 nm, and G = 1 µm.
To define the fine structure of the individual fibers from which the R&R inclusions are constituted, we performed electron tomography of ~200 nm thick resin sections. The documented “figure-eight”-shaped inclusion, which was identified by immunofluorescence against IMPDH2 (inset in Fig. 6A), corresponded to fibrous material decorated by IMPDH2-specific immunogold labels (Fig. 6A). Fibers creating inclusions were largely arranged in parallel with distances between each other of up to 15 nm. The space in between the fibers was filled with a more electron-lucent matter, which was free from ribosomes and other cytoplasmic structures (Fig. 6B and 6C). Further, we detected regularity in the fine structure of each fiber. To obtain high-resolution, three-dimensional information of the fibers, electron tomography was performed. We found that individual fibers were composed of periodically repeated subunits with a length of 10.94 ± 0.82 nm. The estimated thickness of each individual fiber was about 8.6 nm (inset in Fig. 6C).
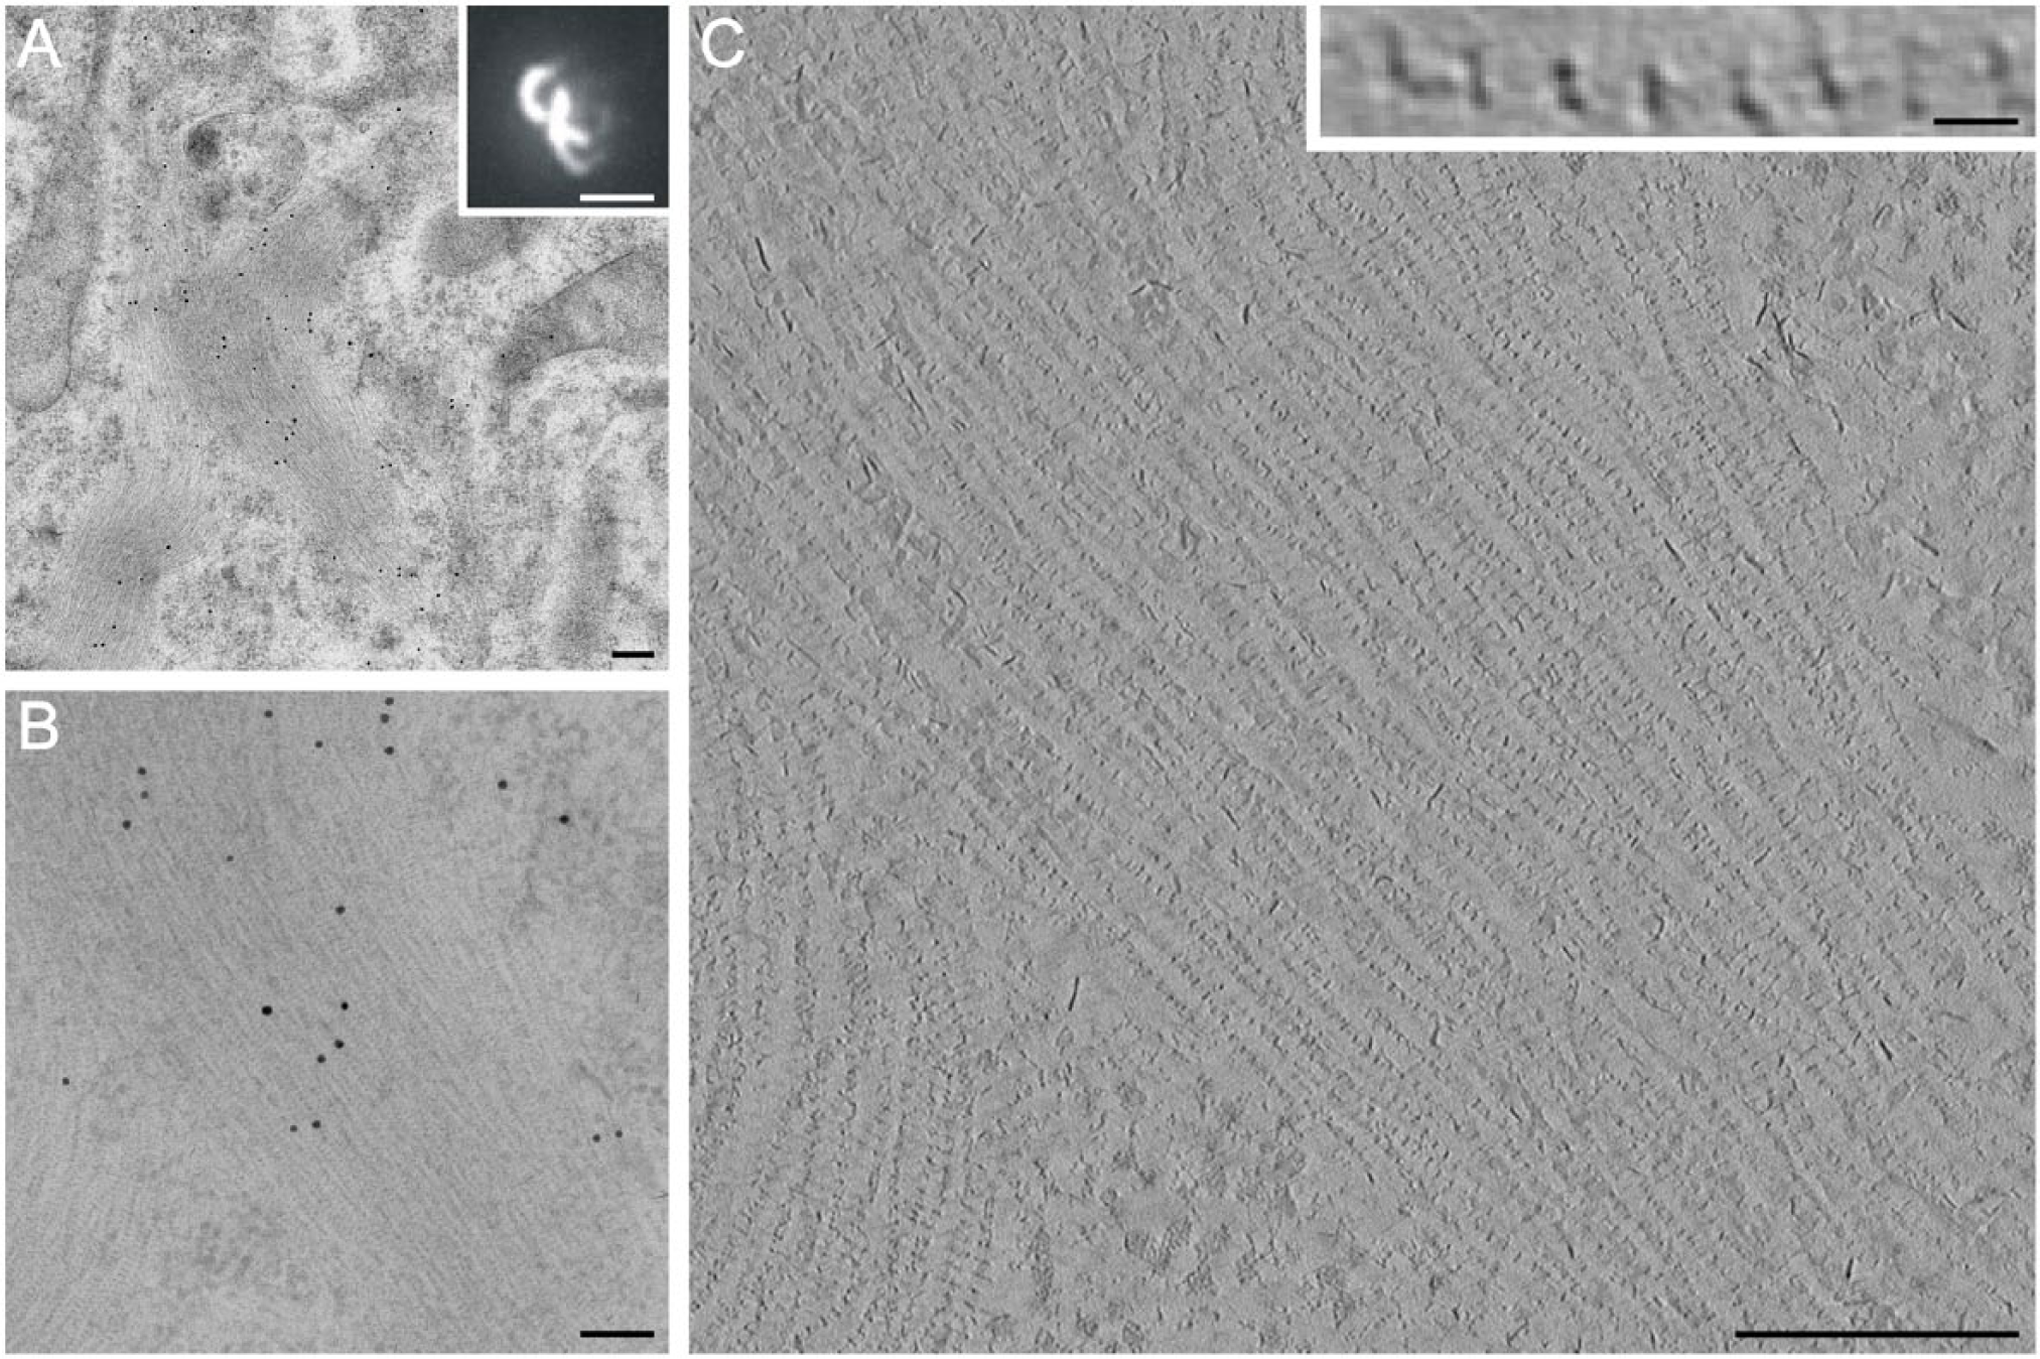
Fine ultrastructure of “Rods &Rings” (R&R) inclusions imaged using electron tomography. Electron tomography of the central part of IMPDH2 structure shaped as a number eight (“figure-eight”). (A) An overview image of the reconstructed area and the on-resin fluorescence image (inset). (B) The electron microscopic image at a higher magnification showing the area selected for tomography. (C) An x–y cross-section through the middle of the reconstructed volume. The R&R inclusion is enriched in IMPDH2 fibers and its internal volume is free from ribosomes or other cytoplasmic structures. (Inset in C) Higher magnification of the IMPDH2 fiber. A movie showing all x–y slices of the full reconstruction is attached as Supplemental Video S1 (binning by 2 in all directions) in the Supplemental Materials. Scale bars: A–C = 200 nm, inset in A = 5 µm, inset in C = 10 nm.
Discussion
IMPDH inhibition is commonly used in human therapy; however, the fundamental biology behind it is poorly known. To contribute to this field, we studied the changes in the distribution of IMPDH2 after its inhibition, specifically focusing on the fine structure of IMPDH2 inclusions.
Having performed extensive fluorescence characterization of R&R inclusions, we used high-pressure cryofixation and freeze-substitution to establish the fine structure of R&R inclusions. This approach represents the method of choice for preservation of the near-native ultrastructure and, combined with other methods such as correlative light and electron microscopy and electron tomography, allowed us to visualize the fibrous nature of IMPDH2 inclusions with its ultrastructural details. We observed that the fibers have a regular diameter of about 8.5 nm and consist of regularly shaped particles with a length of approximately 11 nm. The fibers were oriented in parallel and arranged in bundles that were not surrounded by a biological membrane. Our data match well with that obtained by Thomas et al. (2012). Similar filamentous structures were observed by electron microscopy in 1987 by Willingham et al. in mammalian cells just after they were re-established in culture from a frozen stock. The authors initially identified the inclusions by fluorescence microscopy using an IG3 monoclonal antibody generated from a Balb/c mouse immunized with mouse tumor cells. Unfortunately, the so-called “anti-nematin” antibody used in that study is not available at present, and one can only speculate whether the so-called “nematin” was in fact the IMPDH2 protein.
The ability of some other metabolic enzymes to form cellular inclusions has been reported by many groups (reviewed in O’Connell et al. 2012). The formation of enzyme inclusions seems to be phylogenetically conserved, as these structures have been noted in many organisms, from bacteria to mammals (Ingerson-Mahar et al. 2010; Liu 2010; Noree et al. 2010; Carcamo et al. 2011; Chen et al. 2011; Liu 2011). However, the reason for the formation of these filamentous structures remains unknown. O’Connell et al. (2012) speculated that some of these inclusions could be the result of the self-assembly of enzymes, as they frequently exhibit a high level of protein self-organization. This is in agreement with our results (Supplemental Fig. S5) showing the formation of the fibrous IMPDH2 structures in cells grown in hypertonic medium; this increases the self-assembly of macromolecules because of increased macromolecular crowding (Ellis 2001; Smigova et al. 2013). The formation of IMPDH2 inclusions under macromolecular crowding conditions, together with the minimal increase in the amount of cytoplasmic IMPDH2 protein, could indicate that IMPDH2 clustering is not due to an increase in IMPDH2 cell synthesis or an increase in the amount of IMPDH2 protein.
Importantly, although IMPDH2 participates in the synthesis of guanosine nucleotides in the cytoplasm, we identified a pool of IMPDH2 protein also inside the cell nucleus and its ability to form the nuclear Rod structures in cells treated with specific IMPDH2 inhibitors. The existence of the nuclear Rod structures is mentioned in review by Carcamo et al. (2014). The unexpected localization of IMPDH2 in the nucleus is in agreement with the results from immunoprecipitation experiments showing the ability of IMPDH protein to bind to RNA and DNA (McLean et al. 2004). Because IMPDH binds to single-stranded nucleic acids, it is expected to have a role in replication, transcription or translation (McLean et al. 2004; Kozhevnikova et al. 2012). However, it is unknown how the IMPDH protein is imported into the cell nucleus (where DNA replication and transcription occur) as the nuclear localization signals that can be recognized by either PredictNLS or PSORT II have not been found (McLean et al. 2004). The association of IMPDH with the actively transcribed regions of genes was shown by Park and Ahn (2010) in S. cerevisiae. They also found that IMPDH is recruited to transcription complexes through serine 2 phosphorylation of RNApol II C-terminal domain. Unfortunately, in most of these papers, the type of IMPDH isoenzyme is not specified. However, Kozhevnikova et al. (2012) showed that the ability of IMPDH to act as a DNA-binding transcription repressor is rather associated with IMPDH1 (Kozhevnikova et al. 2012). Thomas et al. (2012) showed functional differences between IMPDH isoforms that result predominantly from differences in the IMPDH Bateman domain (Thomas et al. 2012). In our experiments, R&R structures that form after inhibition of IMPDHs by ribavirin are enriched in the IMPDH2 isoenzyme. Unfortunately, because the sequence similarity amongst the IMPDH isoforms, we are unable to exclude the possibility of some cross-reaction of the polyclonal IMPDH2 antibody with the IMPDH1 protein and vice versa. Concerning the ultrastructure, we observed the same fine structure of cytoplasmic and nuclear IMPDH2 inclusions. Although probably due to spatial limitations, the nuclear IMPDH2 protein formed mainly rod-shaped structures. The function of IMPDH2 in the nucleus is so far unknown; however, the IMPDH2 relocation into Rods in the interchromatin compartment should lead to loss of its potential function on DNA.
In summary, we showed the presence of IMPDH2 protein in the cell nucleus and its compartmentalization in response to ribavirin treatment. Further, we described the ultrastructure of the IMPDH2 inclusions after IMPDH2 inhibition in cellulo. We showed that IMPDH2 inclusions exhibit fibrous character in a regular order along the fibers.
Footnotes
Acknowledgements
The authors would like to thank Prof. Luis Eduardo C. Andrade (Universidade Federal de São Paulo, Brazil) for his initial impulse and for the anti-IMPDH autoimmune sera and Dr. Guy M. Hagen for careful reading of the manuscript.
Declaration of Conflicting Interests
The authors declared no potential conflicts of interest with respect to the research, authorship, and/or publication of this article.
Funding
The authors disclosed receipt of the following financial support for the research, authorship, and/or publication of this article: This work was funded by the
References
Supplementary Material
Please find the following supplemental material available below.
For Open Access articles published under a Creative Commons License, all supplemental material carries the same license as the article it is associated with.
For non-Open Access articles published, all supplemental material carries a non-exclusive license, and permission requests for re-use of supplemental material or any part of supplemental material shall be sent directly to the copyright owner as specified in the copyright notice associated with the article.