
Abstract
We present a method in which a precise region of interest within an intact organism is spatially mapped in three dimensions by non-invasive micro-computed X-ray tomography (micro-CT), then further evaluated by light microscopy (LM) and transmission electron microscopy (TEM). Tissues are prepared as if for TEM including osmium fixation, which imparts soft tissue contrast in the micro-CT due to its strong X-ray attenuation. This method may therefore be applied to embedded, archived TEM samples. Upon selection of a two-dimensional (2-D) projection from a region of interest (ROI) within the three-dimensional volume, the epoxy-embedded sample is oriented for microtomy so that the sectioning plane is aligned with the micro-CT projection. Registration is verified by overlaying LM images with 2-D micro-CT projections. Structures that are poorly resolved in the micro-CT may be evaluated at TEM resolution by observing the next serial ultrathin section, thereby accessing the same ROI by all three imaging techniques. We compare white adipose tissue within the forelimbs of mice harboring a lipid-altering mutation with their littermate controls. We demonstrate that individual osmium-stained lipid droplets as small as 15 µm and separated by as little as 35 µm may be discerned as separate entities in the micro-CT, validating this to be a high-resolution, non-destructive technique for evaluation of fat content.
Micro-computed X-ray tomography (micro-CT) is a versatile tool conventionally used to generate high-resolution three-dimensional (3-D) images for the non-destructive evaluation of mineralized tissues, such as insect exoskeletons, shells, and skeletal tissues (Neues and Epple 2008; Oest et al. 2008). As an evaluation method for embryos, micro-CT allows determination of the developmental state and also quantitative descriptions of bone volume and mineral density. It was not until the utilization of stains such as inorganic iodine, phosphotungstic acid, and osmium (compared by Metscher 2009a) that micro-CT use became widespread for the evaluation of soft tissues. The critical elements in these stains have high atomic numbers (Z), meaning that these elements have X-ray attenuations (Henke et al. 1993) favorable to micro-CT imaging (iodine Z = 53, osmium Z = 76, lead Z = 82, and uranium Z = 92). With the exception of iodine, these elements have also been long favored as contrasting stains in transmission electron microscopy. Their use as contrast agents for micro-CT allows for the capture of high-volume images of intact organisms. Brown fat and red blood cells are particularly well contrasted with iodine (diffused into the tissue by immersion in aqueous potassium triiodide), allowing for the analysis of blood-containing vascular anatomy. Muscle fiber architecture may also be evaluated non-destructively with iodine staining (Jeffery et al. 2010). Vasculature devoid of blood may be filled with a radiopaque suspension of lead, bismuth, or barium, which solidifies before scanning (e.g., “microfil”) to opacify the microvasculature (Proweller et al. 2007; Degenhardt et al. 2010). Chromium (Z = 24) contrast is imparted to nuclei using the histological stain gallocyanin-chromalum, first described by Husain and Watts (1984) and further described for use in micro-CT imaging by Metscher (2009b). Osmium is recognized to differentially stain tissues with high lipid content, including white and brown adipose tissue, and contrasts the lipoproteins of most bilayered cell and organelle membranes (Hayat 1970). This broad-staining characteristic makes it suitable for obtaining non-destructive “virtual histology” of mid-gestation E8 to E13.5 mouse embryos (Johnson et al. 2006), allowing detailed imaging of both external and internal regions of the embryos. Penetration of osmium into tissue is very slow, and mature epidermal layers impose a significant barrier to its diffusion; therefore, the skin needs to be removed in older embryos prior to exposure to osmium if internal imaging is desired (Johnson et al. 2006).
Micro-CT evaluation of soft tissue samples prepared using methodology designed for transmission electron microscopy is becoming more commonplace. As mentioned above, osmium imparts X-ray attenuation to soft tissues, and although epoxy embedding may cause some contrast loss in the micro-CT (Metscher 2009b), there are several advantages. Validation of structure may be afforded by observing similar regions using light microscopy (LM) and/or transmission electron microscopy (TEM). Hann et al. (2011) used this approach in the assessment of the aqueous humor outflow pathway in human eyes. Samples were prepared by a TEM protocol using 4% paraformaldehyde/2% glutaraldehyde followed by 1% OsO4; the samples were then dehydrated and embedded in epoxy. Osmium afforded adequate contrast to the soft tissues of the eye for well-contrasted micro-CT images, and structural validation was confirmed by LM observation of an adjacent region of the eye. We are, however, not aware of any reports that have demonstrated precise correlative micro-CT, LM, and TEM within the same region of a sample.
In this study, we demonstrate a simple approach to examine a precise region of an aldehyde-fixed, osmicated, epoxy-embedded sample and collect correlative images using micro-CT, LM, and TEM. The method is particularly useful when dissection of a region of interest (ROI) may distort the tissue or misalign its relationship to other tissues. Initial imaging by micro-CT allows spatial mapping of the region within the intact organ, and with these coordinates, the region may be precisely approached using an ultramicrotome. By applying this method, we were able to distinguish and quantitatively evaluate individual fat droplets as small as 15 µm in diameter within a Z-resolution of approximately 3 to 9 µm within the intermuscular tissue of mouse forelimbs at postnatal day 4 (P4). LM and TEM of the same regions were used to demonstrate that the fat content within these tissues is white adipose tissue and to determine the position of the fat at resolutions appropriate for each imaging method. This approach associates micro-CT, LM, and TEM for the identification and accurate quantitation of adipose tissue, and to visualize it at high spatial resolution.
Micro-CT Instrumentation
Micro-CT is a non-destructive method by which interior regions within a sample may be examined in situ. From multiple X-ray images acquired digitally as the sample is rotated stepwise, a 3-D mapping of the sample volume’s X-ray attenuation is automatically reconstructed, and virtual cross sections through the object can be selected and displayed by an operator (Hsieh 2003; Ritman 2004; Stock 2008; Metscher 2009b). By selecting an ROI inside the volume followed by gray-level thresholding, structures can be selected for further morphometric quantification. These analyses can be performed in three dimensions in contrast to only two dimensions achieved with LM or TEM methods. The quality of morphometric quantifications, such as local thickness measurements, is improved with micro-CT over analysis of two-dimensional (2-D) images, in which oblique cuts of structures introduce difficulties (Hildebrand and Rüegsegger 1997).
Materials and Methods
Ethics Statement
This study was approved by the Oregon Health Sciences University Animal Care and Use Committee. Mice were maintained, bred, genotyped, sacrificed, and used in accordance with the Oregon Health Sciences University Institutional Animal Care and Use Committee–approved protocol IS00001405.
Tissue Preparation
Freshly obtained forelimbs were collected from a P4 wild -type (WT) mouse and from a littermate harboring a fibrillin-2 (Fbn2) null mutation (Arteaga-Solis et al. 2001). Skin was removed from the forelimbs, which were then immersed in 1.5% glutaraldehyde/1.5% paraformaldehyde in Dulbecco’s serum-free cell culture media containing 0.05% tannic acid for 14 days. The forelimbs were then rinsed in media, then fixed for 24 hr in media buffered 1% OsO4. The tissues were then dehydrated in ethanol (30%-100% over 2 hr), rinsed in propylene oxide (PO), then infiltrated in 1:1 and 1:2 PO:Spurrr’s epoxy for 1 hr each then in 1:3 PO:Spurr’s epoxy overnight, then in three changes of 100% Spurr’s epoxy for 2 hours each. Samples were then oriented in 14 × 5 × 3-mm flat embedding molds for cross-sectioning. and polymerized at 70C for 18 hr. The durations in glutaraldehyde, OsO4, and infiltrations in epoxy were long in comparison to the short protocols generally used to embed small tissue samples; this was to compensate for the comparatively large size of the P4 mouse limbs. Following polymerization, the intact, flat-embedded samples were shaped with a jeweler’s saw to fit tightly within the cavity of a ¼-inch inner diameter carbon fiber micro-CT sample holder (allowing image collection at 3.5 micron voxel size) and held securely in place using parafilm.
Image Collection
Micro-CT
Micro-CT images were collected using a SCANCO Medical (Brüttisellen, Switzerland) µCT 35 micro-CT (45–70 kVp) equipped with a tungsten target X-ray tube and a 0.5-mm Al filter. The system was operated at 55 kVp with an intensity of 145 µA. Scan parameters were set with a voxel size of 3.5 µm and a 7.2-mm field of view resulting in, at best, a 5.2-µm spatial resolution at 10% Modulation Transfer Function (MTF) (manufacturer specifications). In total, 939 projections were collected over a total height of 3.29 mm with a 400-msec integration time and averaging four frames per projection angle. The total scan time was 8.2 hr. Importantly, voltage, current, and scan parameters were adjusted to balance adequate contrast and resolution of the fat deposits with a reasonable scan time.
Light Microscopy
Light microscopy images were collected using Kohler illumination within a Leica inverted microscope fitted with a 20× objective, NA = 0.7 (Leica, Wetzlar, Germany). Six (Fbn-2 null) and 11 (WT) 9.2-Mb overlapping images were collected using a 2048 × 1536-pixel QImaging Micropublisher (Surrey, BC, Canada) digital camera and stitched together, then cropped to published size, using Adobe Photoshop (Adobe; San Jose, CA) to produce a 59.5-Mb TIFF image.
Transmission Electron Microscopy
An AMT 2K × 2K side entry camera (AMT, Woburn, MA) mounted on a FEI G2 transmission electron microscope (FEI, Hillsboro, OR) operated at 120 KV was used to collect an array of 25 overlapping 600× images. These images were stitched together using ImageJ (National Institutes of Health, Bethesda, MD) to form a (~100-Mb) tiff image. These high-resolution, low-magnification montage images can be substantially enlarged and demonstrate excellent high-resolution image detail.
Specimen Orientation for Correlative Microscopy
Limbs were positioned in the sample holder of the micro-CT so that their longitudinal axis was aligned with the rotation axis, perpendicular to the X-ray source. Limbs were scanned over a distance of 3.29 mm from the distal phalanges to the proximal elbow joints. Within the scanned volume, the beginning (position “0”) of identical regions within the limbs of both WT and mutant animals were recognized by the plane at which the trabecular bone completely filled the interior within the cortical bone wall. An arbitrary end position was chosen that was separated from position “0” by 150 sections each at 3.5 μm; therefore, the volume reconstructions represent a slice of the limb 0.525 mm in length (see Suppl. Figs. S1 and S2). Regions with adipose tissue content were identified in the micro-CT and spatially mapped within the tissue volume in x, y, and z axes, and the coordinates measured relative to the end of the tissue block. After imaging in the micro-CT, the embedded samples were mounted in the specimen holder of a Reichert Ultracut E ultramicrotome (Reichert, bought by Leica, Wetzlar, Germany) so that cross sections of the limb would align with virtual cross sections collected in the micro-CT; the limb was therefore oriented perpendicular to the knife edge. Fine mechanical adjustments in sample orientation within the specimen holder of the ultramicrotome were made outside the ROI by comparing LM images with the original reconstructed stack of 2-D sections. The importance of this step must be emphasized as a prerequisite in obtaining precise image registration. The embedded limb was then carefully trimmed and sectioned. The ROI identified using micro-CT was approached by counting 1-micron sections, beginning at the end of the epoxy tissue block and proceeding to within a few microns of the position identified in the micro-CT. The 0.5-µm sections, stained using basic fuchsin and toluidine blue (14950; Electron Microscopy Sciences, Hatfield, PA), were examined using LM and the live images compared with computer images generated with micro-CT. Landmark features of the sample visualized by micro-CT may be correlated with the same features in the LM images for precise alignment. When a section was found to correlate with the micro-CT image by visual inspection, the next serial 60- to 80-nm section was mounted onto a 1 × 2-mm formvar-coated grid and contrasted with uranyl acetate and lead citrate in preparation for TEM.
Image Overlay
Individual virtual sections collected in the micro-CT were overlaid atop LM images and TEM images using Adobe Photoshop CS5 as described earlier by Keene et al. (2008) to verify alignment and to gain high-resolution structural detail.
Three-Dimensional Reconstruction of Fat Deposits Using Micro-CT
Using the contouring software provided with the SCANCO Medical µCT, the outlines of the limbs were manually traced (in all 150 slices) (Fig. 1A, red arrows). A modest 3D Gauss filtering (σ = 0.8, support = 1) was applied to reduce image noise. Bone and soft tissue were segmented by applying a threshold of 200 permil of the maximal gray-scale value (Fig. 1B, “Total”) from which the provided software calculated the total limb volume (TV) within the region of interest. The threshold was then set to 500 permil, at which both bone and stained fat were segmented (Fig. 1B, “Bone and Fat”; see also Suppl. Fig. S3). Finally, bones were removed from the images by manually tracing their outlines for deselection, leaving only fat deposits in the image (Fig. 2, third column). The volume occupied by the remaining fat (OV) in the region of interest was determined using the provided software. Quantitation of the volume occupied by fat relative to the entire limb volume was calculated (OV/TV). Corresponding images visualizing quantitated fat volume in 3-D (Fig. 1B, “Fat”) were generated.
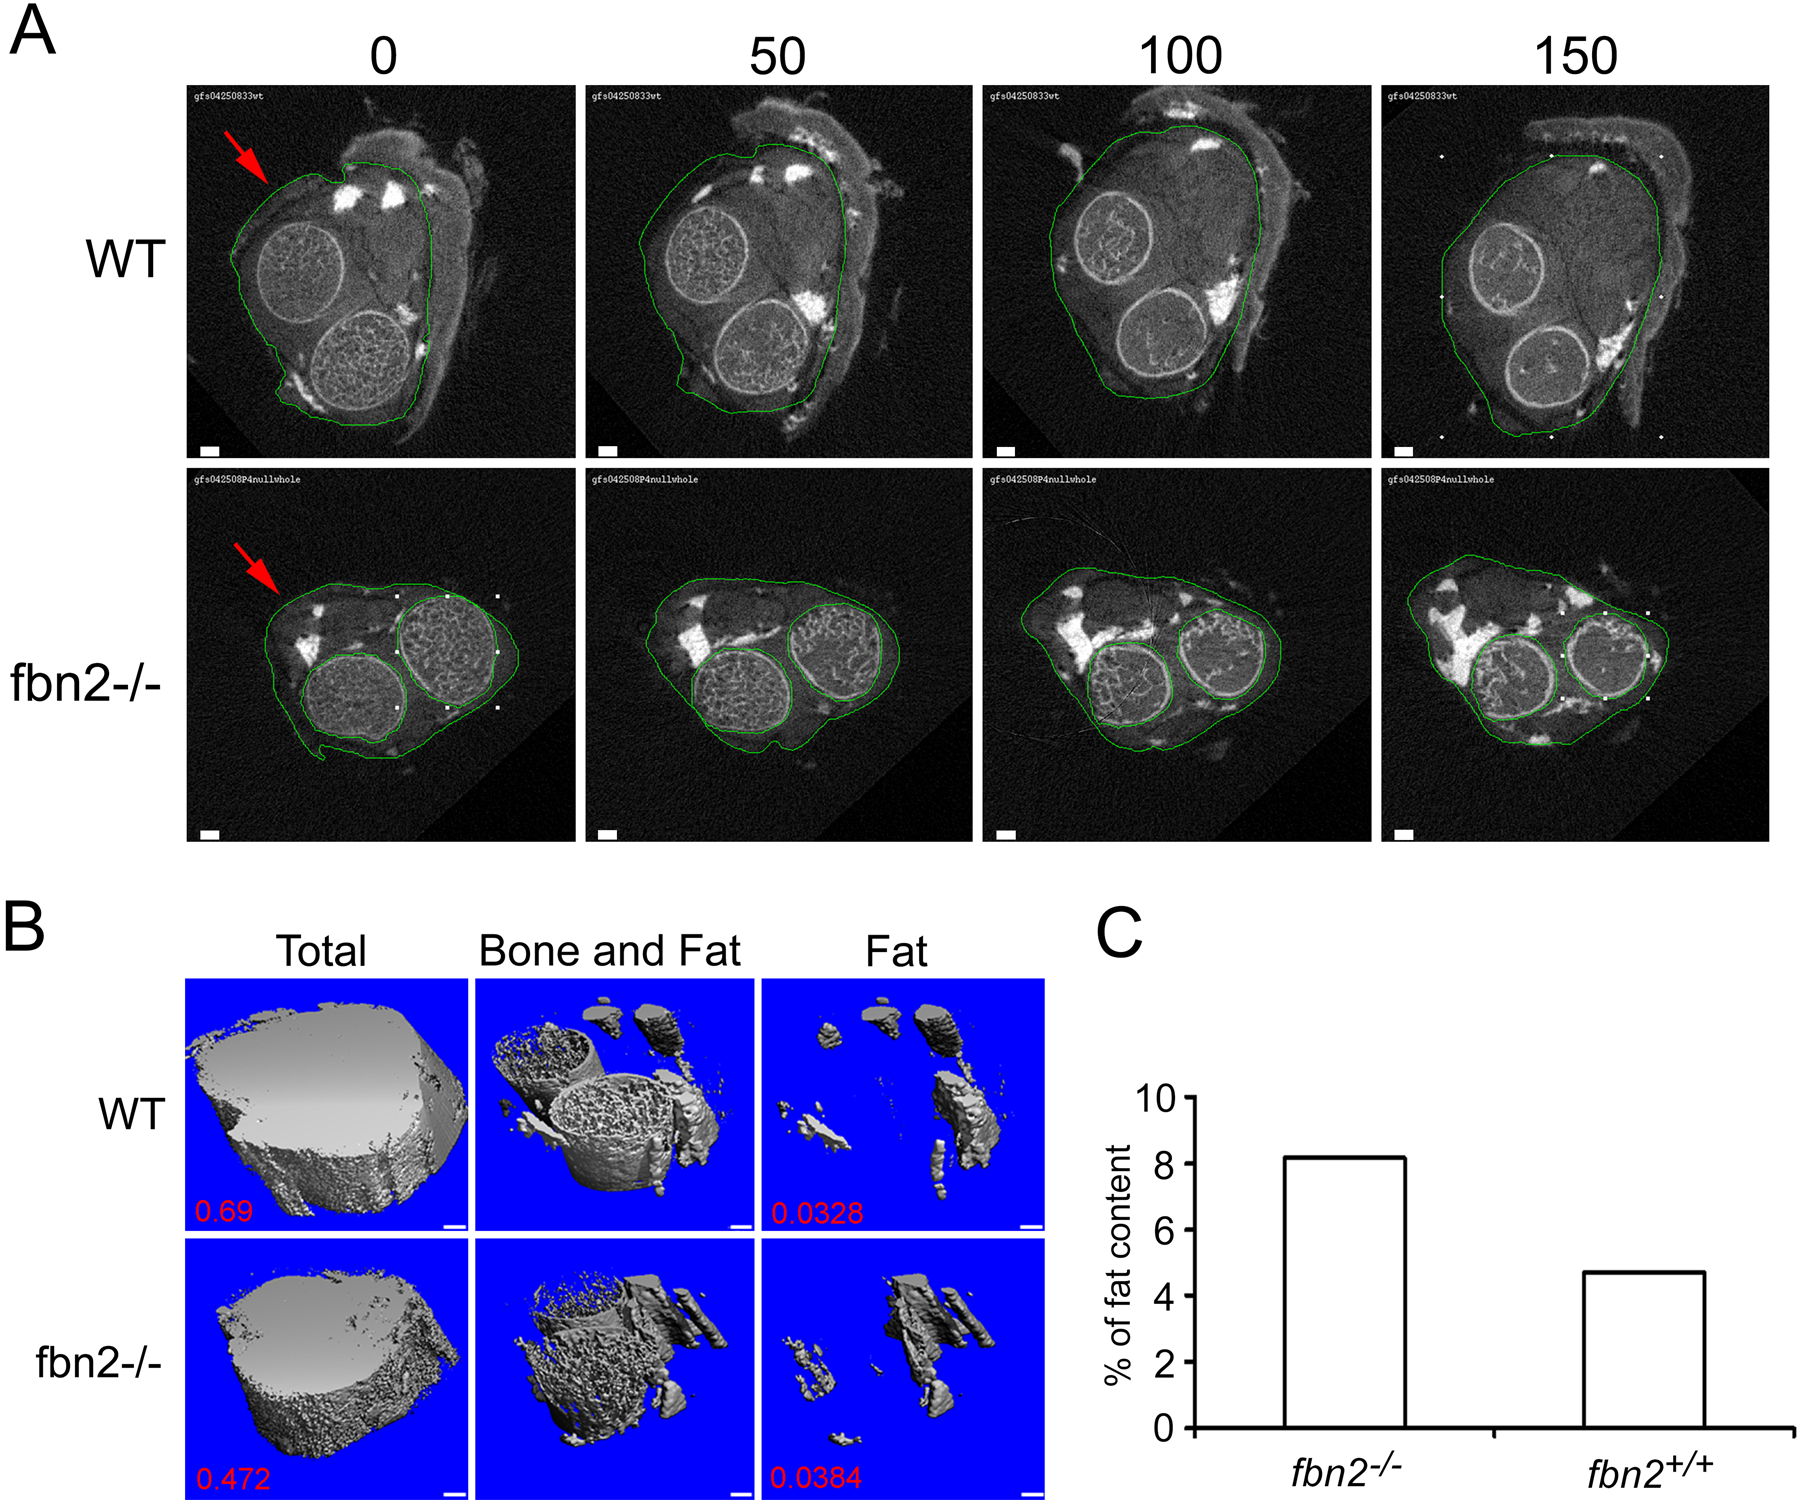
Osmium staining identifies quantifiable fat deposits in micro-computed X-ray tomography (micro-CT). An identical region of the left forelimb from postnatal day 4 (P4) wild-type (WT) and mutant (Fbn2–/–) mice was imaged using a SCANCO µCT35 at the settings described in the Materials and Methods section. Each of the 150 slices was separated by 3.5 µm; the slices shown therefore span 0.525 mm. Fat deposits were highly contrasted by osmium staining and, along with bone, are represented by the brightest portions of the images. For quantitation of fat content, the necessary steps included contouring the outer regions of the limb to eliminate areas of fragmented skin (red arrows, A), then adjusting the threshold value to 200 so that the total volume was filled in (B, “Total”). Adjusting the threshold to 500 eliminates contrast contributed by tissues other than bone and fat deposits (B, “Bone and Fat”). Contouring bone (A, Fbn2–/– panels) so that it may be eliminated from the image leaves only fat deposits in the slice stack (B, “Fat”). Calculations reveal the total volume of the region of interest in the WT to be 0.69, and in the mutant animal, 0.472. The calculated volume of fat in the WT is 0.0328; in the mutant, 0.0384. Graphically demonstrated, the volume of fat relative to total volume of the limb differs considerably between the two animals (C). Scale bars: A and B bars = 100 µm.
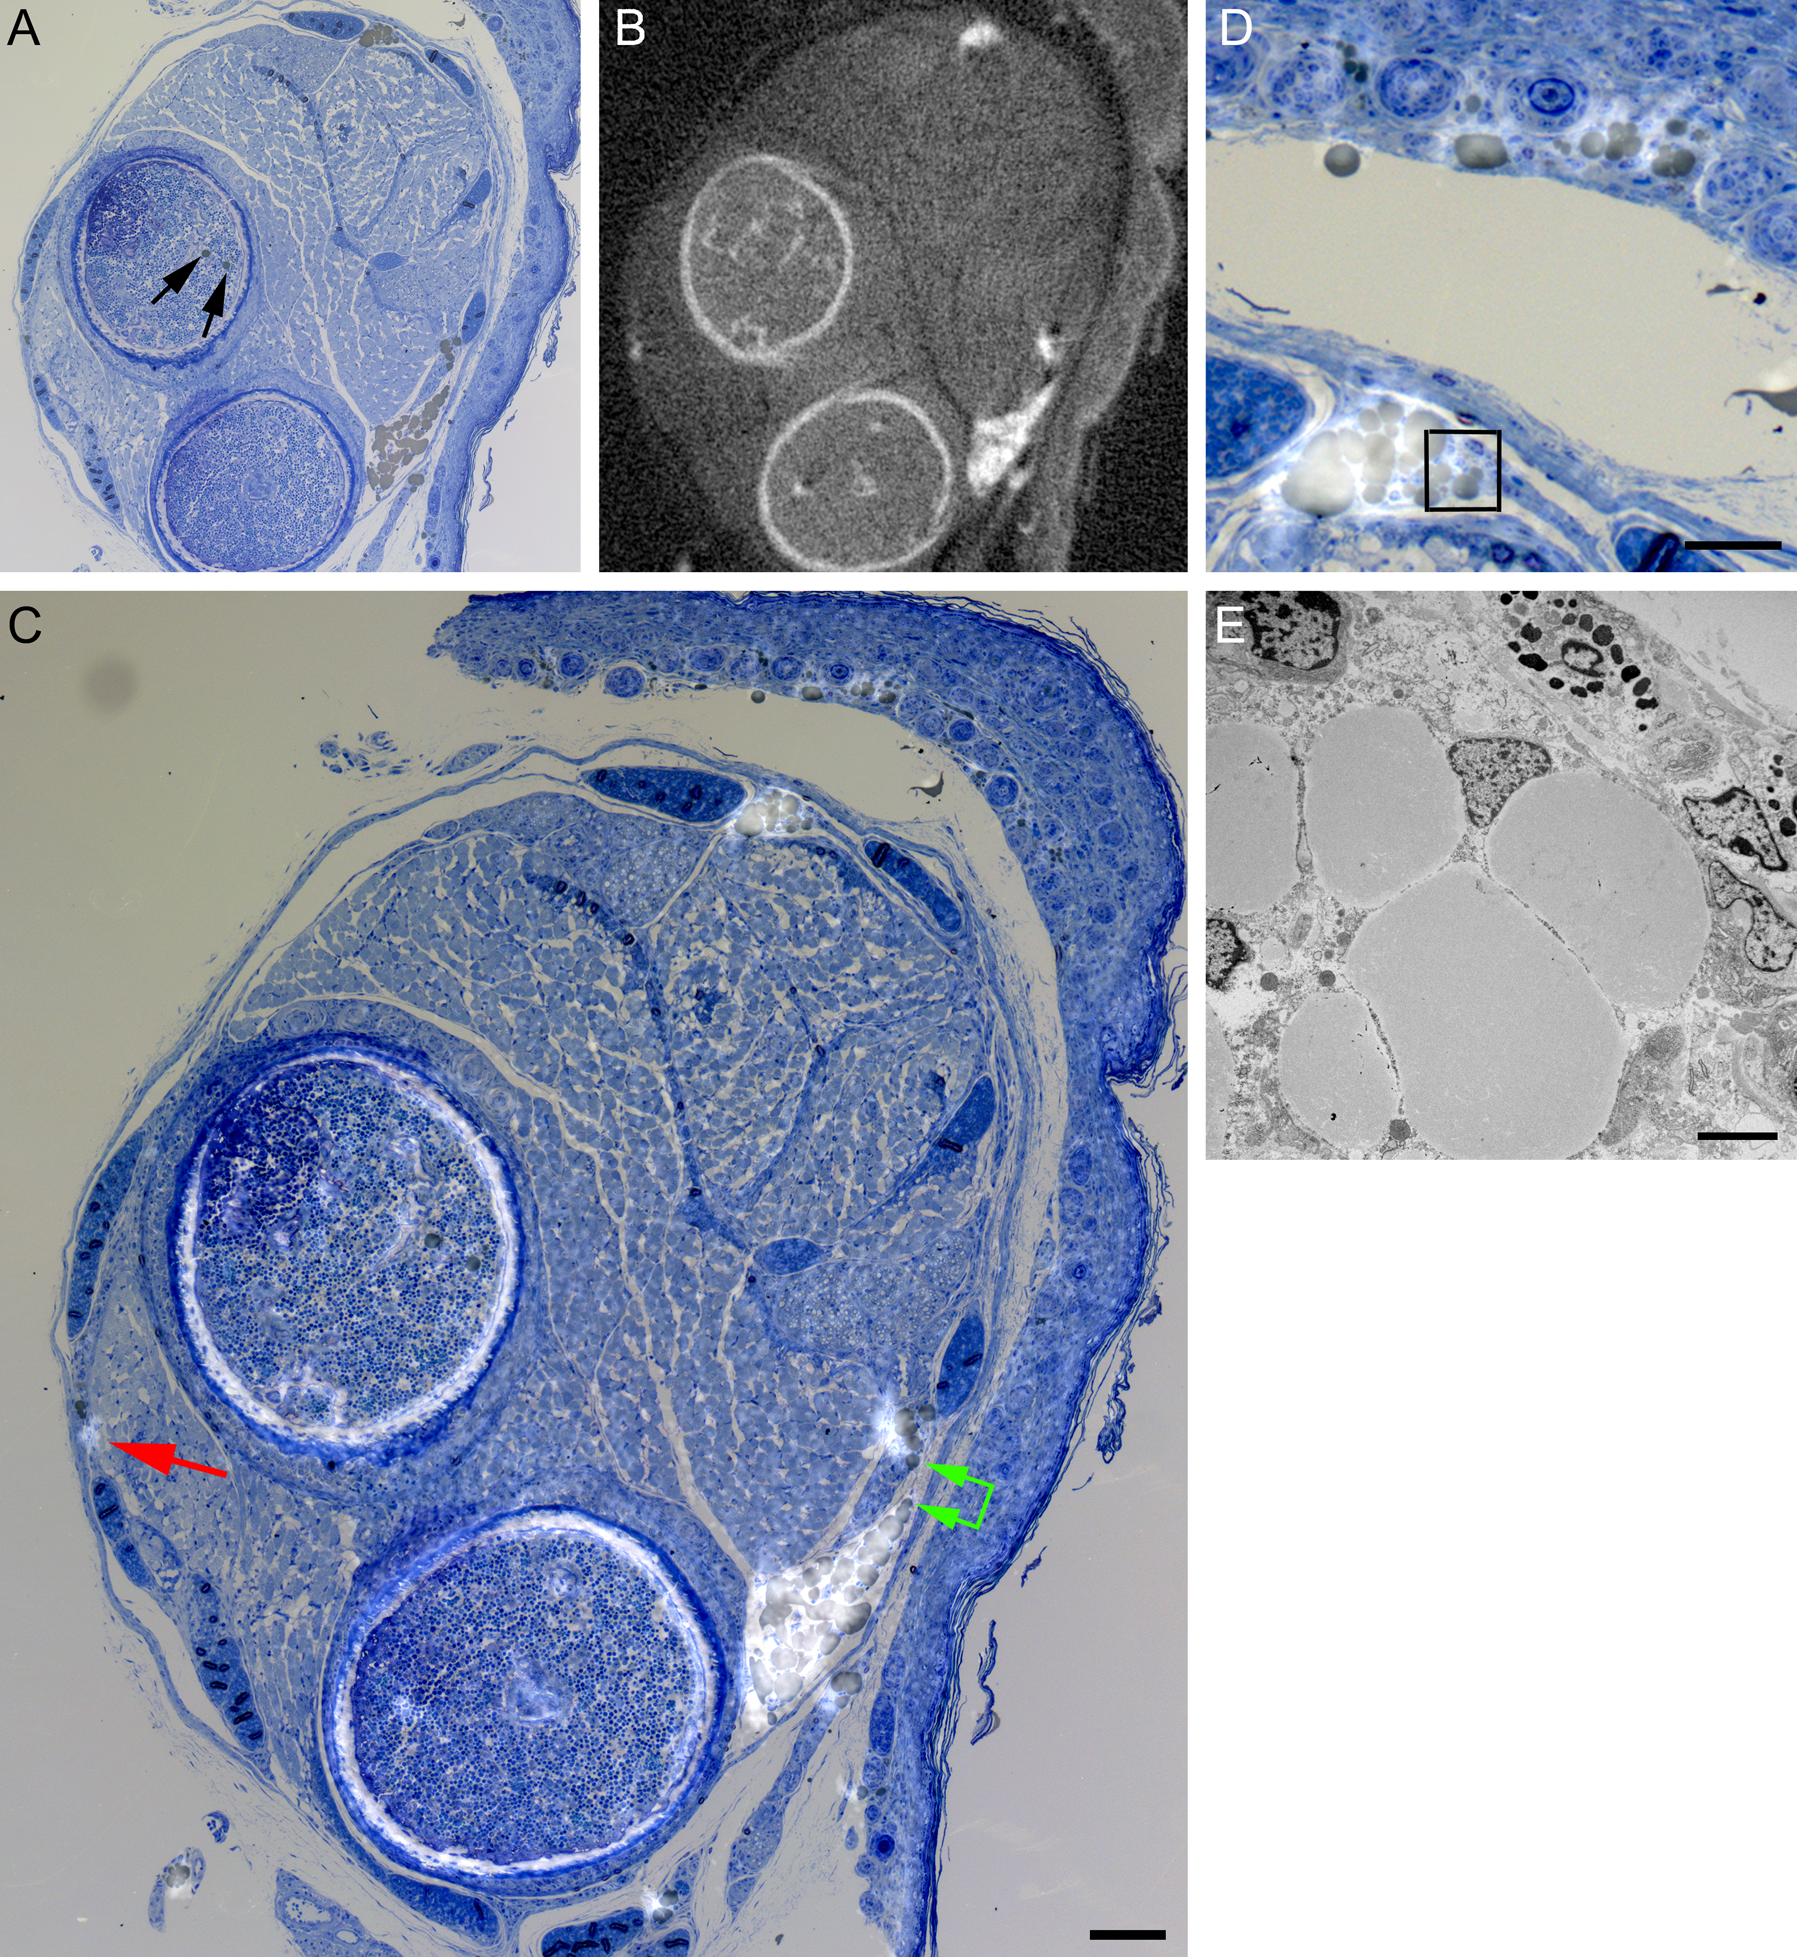
Accurate correlation of micro-computed X-ray tomography (micro-CT) with light microscopy. (A) A 0.5-µm-thick section of a postnatal day 4 (P4) wild-type (WT) mouse limb was stained with methylene blue and basic fuchsin, resulting in fat droplets staining brown. An image selected from micro-CT slices collected at the same orientation and position within the limb is shown in B. The images were overlaid and aligned in Photoshop CS so that the slightly transparent fat deposits highlight the brown-stained fat deposits in the light microscopy (LM) image (C). Measurements demonstrate detection of fat droplets as small as 15 µm in diameter (red arrow) and also discriminate two regions of fat droplets separated by 35 µm (green arrows). Fat droplets within trabecular bone (black arrows, A) cannot be distinguished from calcified regions by micro-CT at the chosen settings. Enlargement of the overlay allows good definition of individual fat deposits defined by both brown staining in the LM and micro-CT image highlighting (C, D). Transmission electron microscopy of the region enclosed by the box in D from the next serial ultrathin section reveals cytoplasm and nuclei peripheral to the fat droplets, confirming their identity as components of white adipose tissue (E). Scale bars: D = 50 microns; C = 100 microns; and E = 4 microns.
Results
Fat May Be Visualized and Quantitated in Perinatal Mouse Forelimb Using Micro-CT
Because of its high X-ray absorption and its propensity to differentially stain tissues with high lipid content, osmium serves as a selective stain for the visualization of fat by micro-CT. Seeking the best possible structural preservation, we prepared the tissue as if for evaluation by electron microscopy, including glutaraldehyde and osmium fixation and embedding in epon. We adjusted imaging parameters in the micro-CT so that the outer edge of the limb and also bone and fat were well resolved and contrasted. Similar to Johnson et al. (2006), we found that prior removal of the skin is critical for the penetration of osmium into adjoining tissues (see Suppl. Fig. S4). We allowed the diffusion of osmium to proceed for 24 hr at 4C for adequate staining of the otherwise intact limbs. We did not find this extended fixation time to adversely affect either LM or TEM imaging. Osmium staining resulted in fat having approximately the same X-ray absorption as bone within these P4 limbs. The resulting attenuation was greater than any other soft tissue, allowing straightforward thresholding and contouring. Given the similarities in X-ray absorption between these two tissues, it was necessary to eliminate bony regions when calculating relative fat content, which was accomplished by contouring the bone (Fig. 1A) and removing the contoured regions from the image (Fig. 1B). We have noted in ongoing TEM studies that fibrillin-2–null animals have a higher ratio of fat content relative to limb volume than WT animals (unpublished results), which could then be recognized and quantitated by micro-CT as a near two-fold increase (Fig. 1C). These results constitute this method as a viable and important quantitation method for fat deposits.
Micro-CT May Be Accurately Correlated with LM and TEM
Most critical in the correlation of micro-CT with LM and TEM images is equating the alignment of the tissue block within the micro-CT with the alignment of the tissue block in the ultramicrotome. This alignment was performed on a gross level by visually matching the orientation of the sample in the holder of the micro-CT with the orientation in the microtome, then making fine adjustments in specimen tilt by comparing images in the 2-D micro-CT stack with LM images collected from sections. The accuracy of the alignment increases with larger tissue blocks. Although largely empirical, when comparing images, we felt confident that we could align the sample in the two holders within a few microns. Imaging identical regions may be calculated relative to a starting point, which can be any feature recognizable by both techniques. Osmium staining imparts sufficient contrast to soft tissues to allow such recognition. Toluidine blue and basic fuchsin, used to stain sections for LM, stains fat droplets uniquely brown (Smith 1906) and are convenient for the identification of fat droplets in 0.5-µm-thick sections (Fig. 2A, D). Confirmed in composite images whereby micro-CT images are overlaid with LM or TEM images, fat droplets as small as 15 µm (Fig. 2C, red arrow) were detectable by micro-CT, and deposits separated by 35 µm (Fig. 2C, green arrows) were detected as distinct. Fat droplets within trabecular bone (Fig. 2A, arrows) could be distinguished with certainty from calcified regions only after verification by LM or TEM. LM and TEM imaging could resolve the nuclei and cytoplasm surrounding single droplets of lipid (Fig. 2E), which were defined as white adipose tissue (Smith 1906). To a lesser extent, regions of muscle, nerve, and tendon were also contrasted in the limbs using osmium. This allowed many identifiable landmarks of tissue structure that were useful in the alignment of corresponding LM sections. Despite visual determination of which micro-CT slices aligned well with individual LM images, we felt confident that we could correlate the two imaging methods with a Z resolution of approximately 3 to 9 µm. Starting from either the top of the block or from a region of certain alignment, it was a simple matter of counting successive 1-µm-thick sections to arrive at the level of interest identified in any virtual micro-CT section within the scan. The collection of the next serial 60- to 80-nm ultrathin section examined in the TEM afforded the resolution necessary to define regions of nerve, muscle, capillaries, and so on relative to the fat droplets in the overlays (Fig. 3). The advantage of using a montage method for the collection of low-magnification TEM and LM images is that low magnification allows a large field of view as compared with that for micro-CT images; these large image files will also withstand considerable enlargement, making the identification of various structural entities present in P4 limbs straightforward.
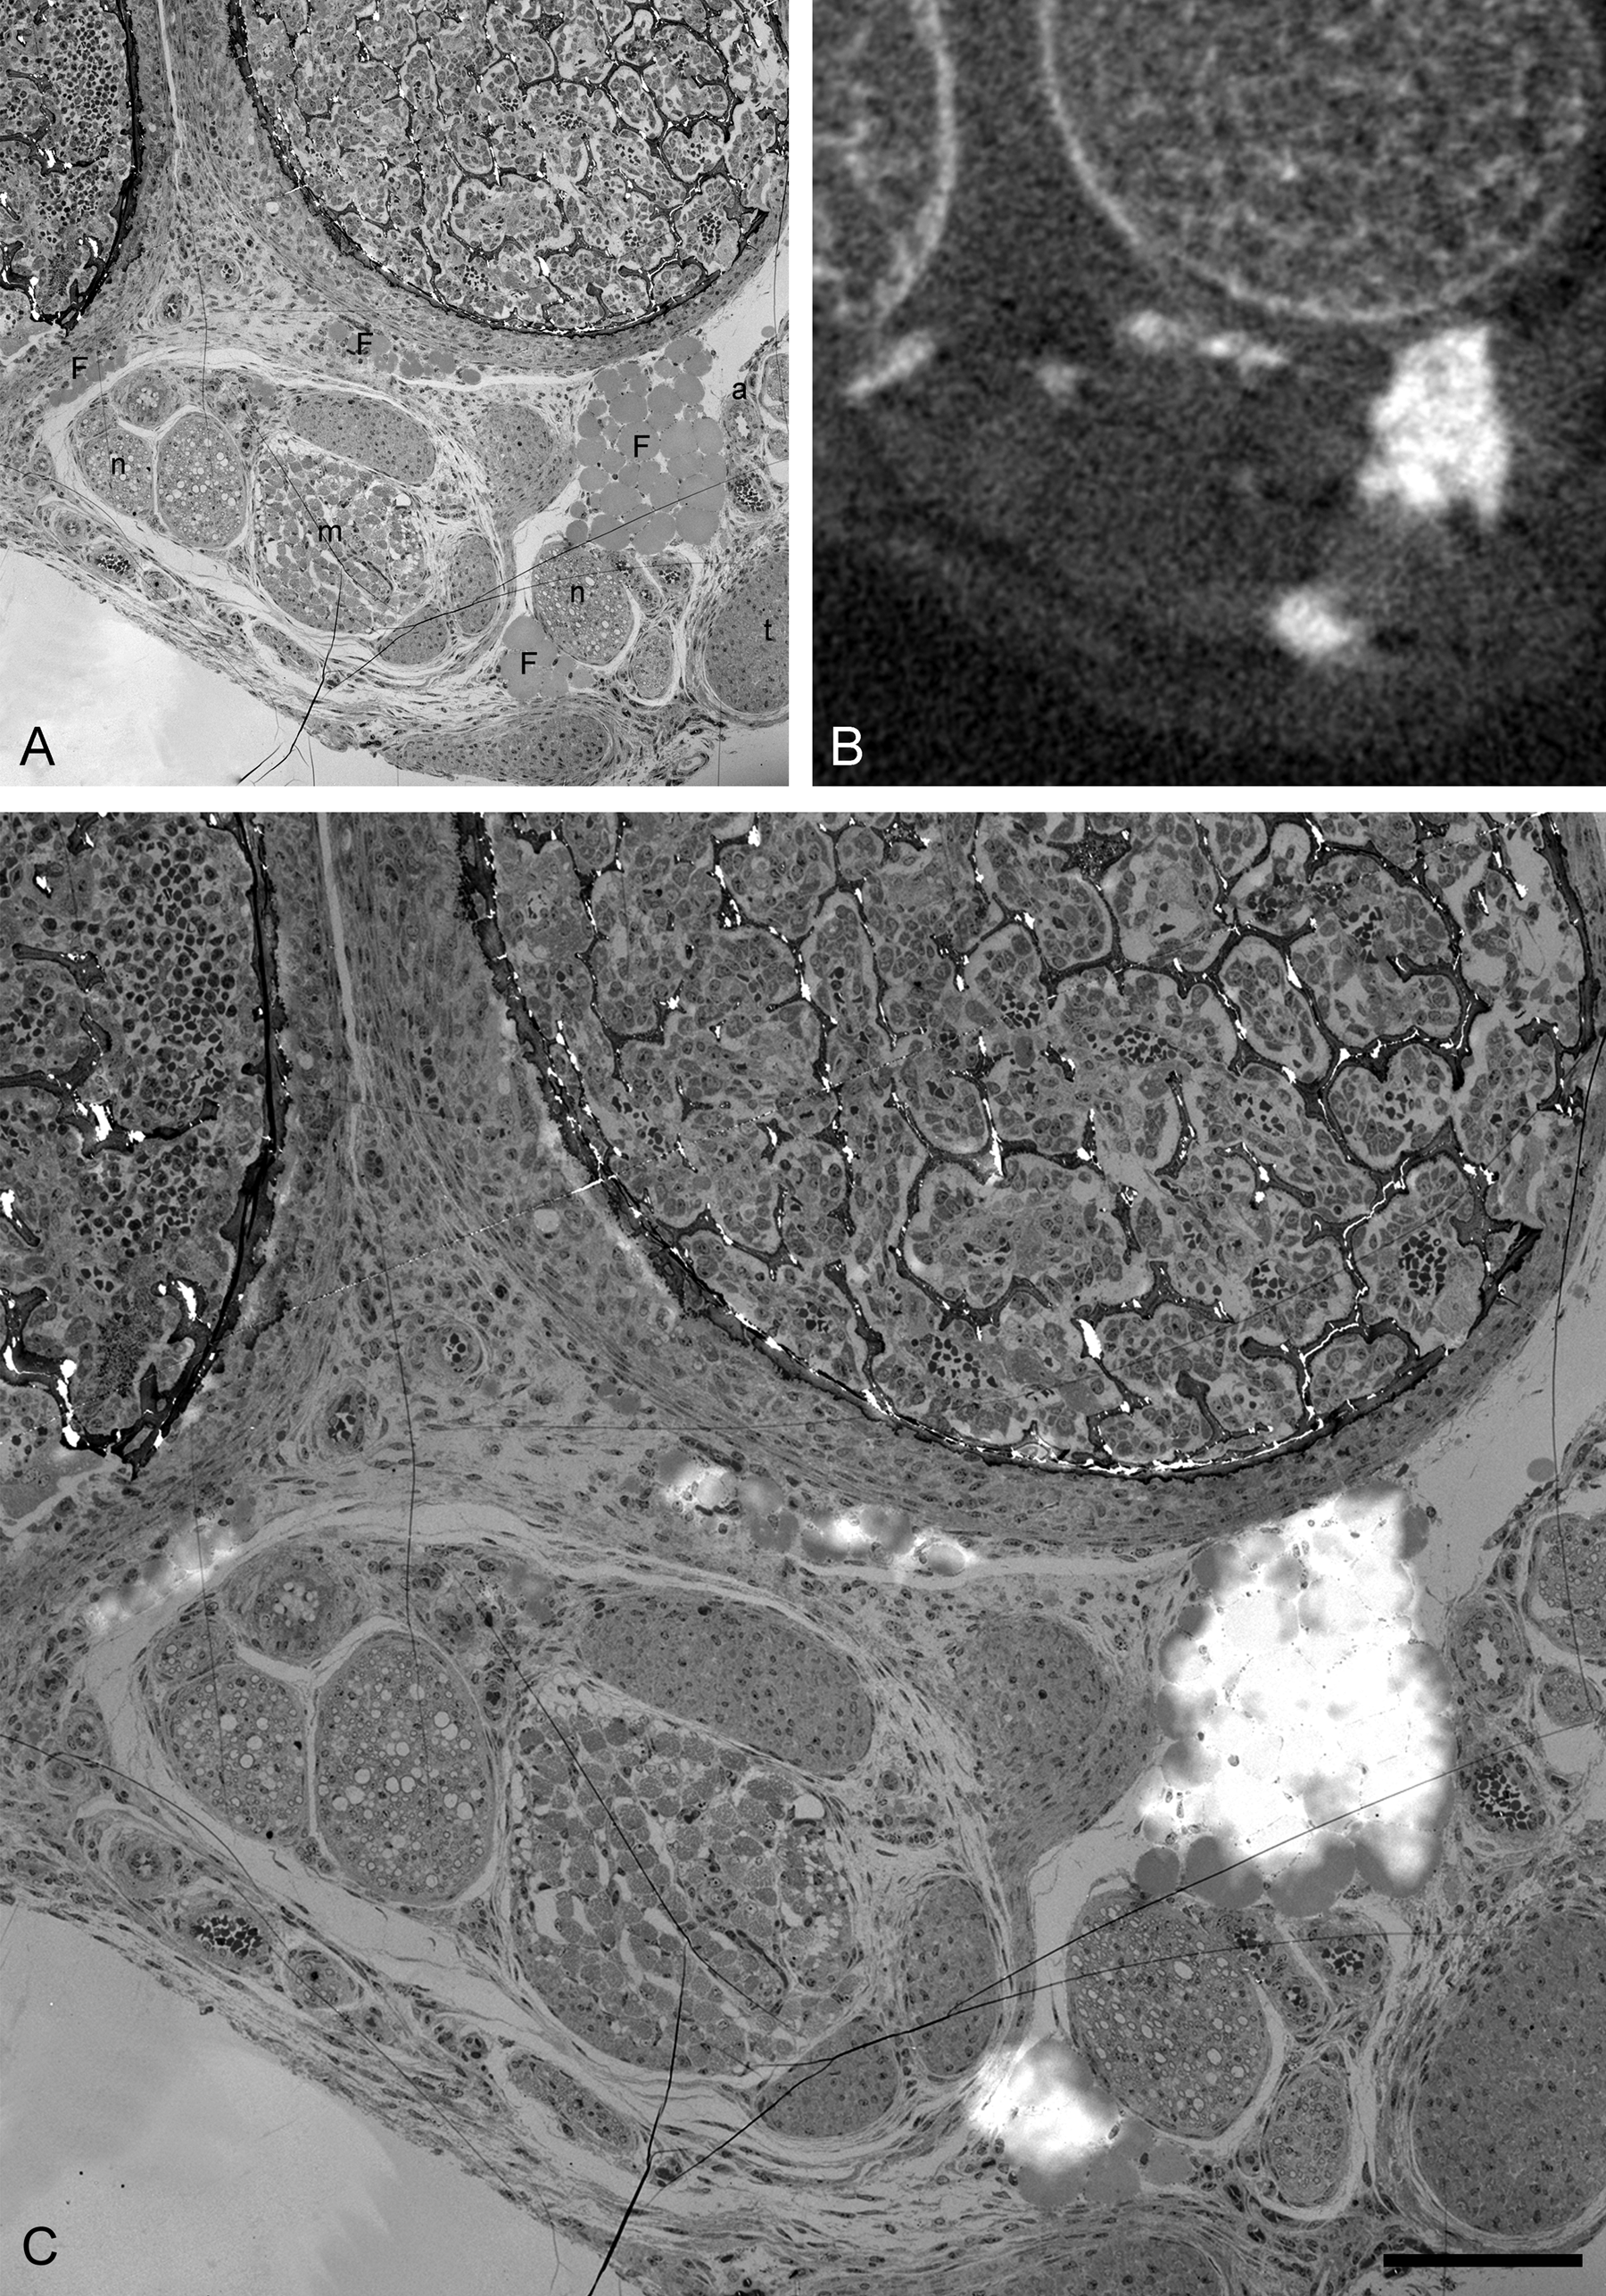
Precise correlation of micro-computed X-ray tomography (micro-CT) with transmission electron microscopy (TEM). (A) A 70-nm-thick section of postnatal day 4 (P4) Fbn2–/– mutant mouse limb examined using TEM identified the fat droplets as white adipose tissue; this was determined with respect to the position of peripheral nuclei and cytoplasm. The resolution afforded in the TEM allows identification of nerves (n), muscle (m), and arterioles (a) relative to the white adipose tissue (F). The TEM image was collected from the serial section adjacent to a 0.5-µm-thick section successfully aligned at the same orientation and position as the micro-CT slice shown in B. The TEM and micro-CT images were overlaid and aligned in Photoshop CS (C). The fat droplets in the TEM image are highlighted by the brightest regions of the micro-CT image. Scale bar = 100 µm.
Discussion
Non-invasive assessment of body fat has become an important component of obesity research in both humans and in animal models. Recent developments in automated algorithms have been made that define automated algorithms to separate total abdominal adiposity into visceral and subcutaneous compartments following imaging by micro-CT have been made (Lublinsky et al. 2009). These algorithms are based on edge detection and mathematical operations that identify the body surface, perform a preliminary separation between visceral adipose tissue and subcutaneous adipose tissue, and then, after automatic correction, achieve an accurate separation between adipose deposits, eliminating the need for manually drawing contour lines (Hildebrandt et al. 2002; Judex et al. 2010; Marchadiera et al. 2011). These methods are reliable in the determination of whole body fat content and distribution (Kvist et al. 1988; Seidell et al. 1990); however, adipose tissue is recognized only as the darkest region among brighter areas of muscle and bone, which affords little structural detail (Judex et al. 2010).
We describe a simple method for the precise correlation of tissue structure by micro-CT, LM, and TEM. Our method relies on mechanically matching the alignment of the sample within the micro-CT with the alignment of the sample in the ultramicrotome. In addition to mechanical alignment, modern algorithms allow the 3-D volume image to be oriented in space and then resliced at an angle that can be adjusted to match any orientation of the sample holder in the microtome. Taking advantage of this ability in combination with course mechanical alignment would provide a more accurate registration of image planes and the selection of infinite ROI orientation, substantially increasing the utility of the method.
Our method relies on fixation and embedding methods typically employed for TEM specimen preparation to provide excellent specimen preservation, contrast, and rigidity required for this correlative method. A significant advantage is that the method lends itself well to the evaluation of archived TEM samples. The value of our approach is that a ROI within an intact organism may be identified and spatially mapped by non-invasive imaging using the micro-CT, then precisely sampled for evaluation by the higher resolution imaging methods of LM and TEM. Importantly, this method might also be utilized for fast, non-invasive identification of a precise ROI within an embedded sample prior to multi-slice Focused Ion Beam (FIB) sectioning for 3D subsurface investigations. We imaged P4 mouse limbs, which are small enough to allow for the penetration of osmium and embedding media, which are critical to the success of the method. ROIs within larger volumes could be removed as a large tissue block and further “virtually dissected” in the same way presented here. We found that due to the propensity for lipid uptake of osmium, lipids are exceptionally well contrasted in the micro-CT, and this high attenuation allows for a relatively straightforward direct quantitation. Osmium permits the direct visualization and quantitation of adipose tissue, thus providing confident detection and quantitation of individual lipid droplets as small as 15 µm in diameter. This approach represents an excellent tool for the high-resolution imaging and quantitation of otherwise difficult to assess non-visceral adipose, intermuscular, or paraosseal adipose tissue.
Footnotes
Acknowledgements
We thank Dr. Francesco Ramirez for providing the Fbn2 mutant mice used for colony establishment.
Declaration of Conflicting Interests
The author(s) declared no potential conflicts of interest with respect to the research, authorship, and/or publication of this article.
Funding
The author(s) disclosed receipt of the following financial support for the research, authorship, and/or publication of this article: This work was supported by grants from the Shriners Hospitals for Children (to DRK and to LYS) and by the National Institutes of Health (P01 AR049698 to LYS). GS thanks the SFB829 for support. Funding for this work was provided to GS through the Deutsche Forschungsgemeinschaft (SE 1115/1-2).
References
Supplementary Material
Please find the following supplemental material available below.
For Open Access articles published under a Creative Commons License, all supplemental material carries the same license as the article it is associated with.
For non-Open Access articles published, all supplemental material carries a non-exclusive license, and permission requests for re-use of supplemental material or any part of supplemental material shall be sent directly to the copyright owner as specified in the copyright notice associated with the article.