
Abstract
Abnormalities in atrial myocardium increase the likelihood of arrhythmias, including atrial fibrillation (AF). The deposition of misfolded protein, or amyloidosis, plays an important role in the pathophysiology of many diseases, including human cardiomyopathies. We have shown that genes implicated in amyloidosis are activated in a cellular model of AF, with the development of preamyloid oligomers (PAOs). PAOs are intermediates in the formation of amyloid fibrils, and they are now recognized to be the cytotoxic species during amyloidosis. To investigate the presence of PAOs in human atrium, we developed a microscopic imaging-based protocol to enable robust and reproducible quantitative analysis of PAO burden in atrial samples harvested at the time of elective cardiac surgery. Using PAO- and myocardial-specific antibodies, we found that PAO distribution was typically heterogeneous within a myocardial sample. Rigorous imaging and analysis protocols were developed to quantify the relative area of myocardium containing PAOs, termed the Green/Red ratio (G/R), for a given sample. Using these methods, reproducible G/R values were obtained when different sections of a sample were independently processed, imaged, and analyzed by different investigators. This robust technique will enable studies to investigate the role of this novel structural abnormality in the pathophysiology of and arrhythmia generation in human atrial tissue.
Introduction
Structural abnormalities in the atrium or ventricle increase the risk of cardiac arrhythmias. In the Western world, atrial fibrillation (AF) remains the most common sustained cardiac arrhythmia, resulting in substantial morbidity and mortality (Lloyd-Jones et al. 2004). Despite advances in our understanding of the pathogenesis of AF, the factors that promote and trigger AF remain poorly understood, and the currently available treatment is often ineffective. Thus, there is an urgent need for improved understanding of the basic mechanisms underlying the pathogenesis of AF.
One component of the AF substrate is the arrhythmia itself. Rapid atrial activation during AF causes electrical and structural remodeling in the atria that increases arrhythmia susceptibility, accounting for the progressive nature of the arrhythmia (Wijffels et al. 1995). Recently, we showed that atrial cells rapidly stimulated in culture undergo remodeling very similar to that observed in human AF (Mace et al. 2009), with striking concordance of transcriptional changes. Unexpectedly, we found conserved transcriptional upregulation for proteins implicated in amyloidosis, a process associated with protein misfolding and deposition. Amyloidosis is linked to an increasing number of degenerative disorders, including Alzheimer’s disease, Huntington’s disease, and Parkinson’s disease, as well as type II diabetes (Glabe and Kayed 2006; Klein et al. 2001). Experimental and clinical evidence indicates that the toxic species in these disorders are soluble preamyloid oligomer (PAO) intermediates, rather than the mature amyloid fibril aggregates (Willis and Patterson 2013). Unlike amyloid fibrils, PAOs are not detectable with Congo Red staining, and the role of these complexes in cardiac pathophysiology is largely unknown.
Several lines of evidence support the concept that PAOs might develop in human atrium: 1) senile amyloidosis with aging typically presents as isolated atrial amyloidosis and is commonly present in the elderly at autopsy (Rocken et al. 2002; Seldin and Skinner 2005; Steiner and Hajkova 2006); 2) we have recently shown that atrial cells rapidly stimulated in culture develop PAOs (Sidorova et al. 2013); and 3) misfolded proteins and PAOs have been shown to play a role in the pathophysiology of common forms of ventricular heart disease, including cardiac hypertrophy and cardiomyopathies (Willis and Patterson 2013).
Based on this evidence, we hypothesize that PAOs can develop in human atrial tissue, where they could potentially disturb atrial architecture and increase arrhythmia susceptibility. In order to test this hypothesis, we developed novel and robust microscopic imaging methods that enable the quantitative analysis of PAO burden in human atrial samples obtained at the time of elective cardiac surgery. Despite a non-homogeneous or patchy distribution of PAOs within a given sample, the relative area of atrial myocardium containing PAOs can be determined in these relatively small samples in a reproducible manner using this technique.
Materials & Methods
Tissue Acquisition
Human cardiac tissue from the right or left atrial free wall was acquired at the time of elective cardiac surgery. Samples were harvested from patients enrolled in two clinical trials of postoperative AF: an NIH-sponsored clinical trial (Renin-Angiotensin-Aldosterone System [RAAS], Inflammation, and Postoperative Atrial Fibrillation, ClinicalTrials.gov #NCT00141778), in which patients were randomly assigned to ramipril, spironolactone, or placebo starting one week prior to elective cardiac surgery (Pretorius et al. 2012); and the Omega-3 Fatty Acids for the Prevention of Post-Operative Atrial fibrillation (OPERA) trial, in which patients were randomized to perioperative treatment with fish oil or placebo (Mozaffarian et al. 2012). In both trials, the incidence of postoperative AF was the same for patients on placebo as for those in the treatment arms. For our analyses, samples were included from patients with: 1) well-preserved left ventricular (LV) function (LV ejection fraction ≥ 40%); 2) no symptoms of congestive heart failure (given that preamyloid oligomers are present in ventricular tissue with severe heart failure); and 3) no evidence of documented systemic or cardiac amyloidosis. Written informed consent was obtained from each patient to harvest atrial tissue at the time of cardiac surgery, using a protocol approved by the Vanderbilt Institutional Review Board. Tissue was immediately fixed in 10% buffered formalin for 24 hr, dehydrated, and embedded in paraffin. Specimens were cut into 5-µm-thick sections and mounted on glass slides.
Immunohistochemistry
Hematoxylin and Eosin (H&E) staining was performed for all samples to verify preserved tissue morphology. Immunostaining was performed using an antibody specific for striated muscle (MF20, directed against the heavy chain of myosin II) to label myocardium, and an antibody (A-11) recognizing a conformational epitope common to all preamyloid oligomers (Kayed et al. 2003) (Fig. 1). For immunofluorescence labeling, sections were deparaffinized in xylene, rehydrated in a reverse alcohol gradient, and rinsed in phosphate-buffered saline (PBS). Antigen retrieval was performed by incubating sections at 94C in 10 mM sodium citrate buffer (pH 6.0) for 10 min. The sections were then cooled at room temperature for 30 min, washed with PBS and exposed to Image-iT FX Signal Enhancer (Invitrogen; Carlsbad, CA) for 30 min. Non-specific antigen binding sites were blocked by incubation for 1 hr in PBS that contained 1% bovine serum albumin (BSA), 0.1% Tween-20, 0.1% cold water fish skin gelatin, and 0.05% NaN3. Sections were incubated overnight at 4C with a mixture of mouse MF20 monoclonal antibody (1:15, Developmental Studies Hybridoma Bank; University of Iowa, Iowa City, IA) and rabbit A-11 polyclonal antibody (1:200, courtesy of Dr. Charles Glabe) in blocking solution. After washing in PBS (four times, 10 min each), slides were exposed to a mixture of secondary antibodies (donkey anti-rabbit Alexa 488-conjugated and goat anti-mouse Alexa 568 conjugated, Molecular Probes; Carlsbad, CA) in blocking solution for 1 hr at room temperature. After four washing steps (5 min each) in PBS, VectaShield Hard Set (Vector Laboratories; Burlingame, CA) mounting medium was applied. A coverglass was immediately placed, and the preparation was allowed to harden for 30–60 min and sealed with Cytoseal 60 (Thermo Scientific; Wilmington, DE). Negative control staining was also performed on separate sections with primary and secondary antibodies omitted, or IgG substituted for primary antibody. Both controls yielded similar background results (Supplemental Fig. 1). In some experiments, immunohistochemistry was performed using a different rabbit A-11 polyclonal antibody (EMD Millipore), with similar results as those obtained using the Glabe A-11 antibody (Supplemental Fig. 2).
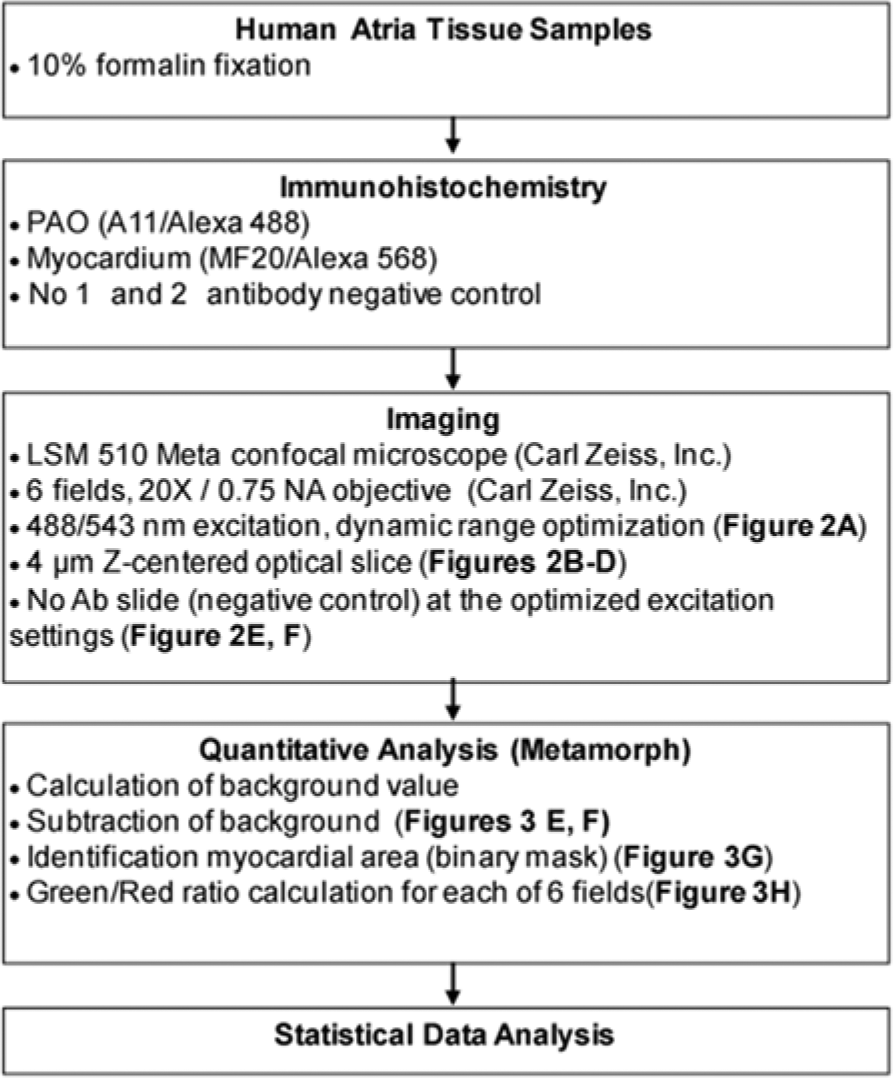
Flow chart for the identification and quantitative imaging of soluble preamyloid oligomers (PAOs) in human atrial tissue samples.
Image Acquisition
Slides were imaged using a confocal microscope (LSM510) with a 20×/0.75 Plan-Apochromat objective (Carl Zeiss, Inc.; Thornwood, NY) (Figs. 1 and 2). The confocal aperture was adjusted to restrict detection to optical sections of 4 μm thicknesses (in the z-dimension) and a single image was acquired for each of six random regions per slide that were enriched for myocardium. Alexa 488 and Alexa 568 were excited at 488 nm and 543 nm, respectively, and detected with a 505–530 nm band pass and 585 nm long pass filter, respectively. Prior to data acquisition, the dynamic range for both the green (Alexa 488) and red (Alexa 568) channels was maximized to achieve the highest precision and contrast in the image (see Results & Discussion; Fig. 2A).
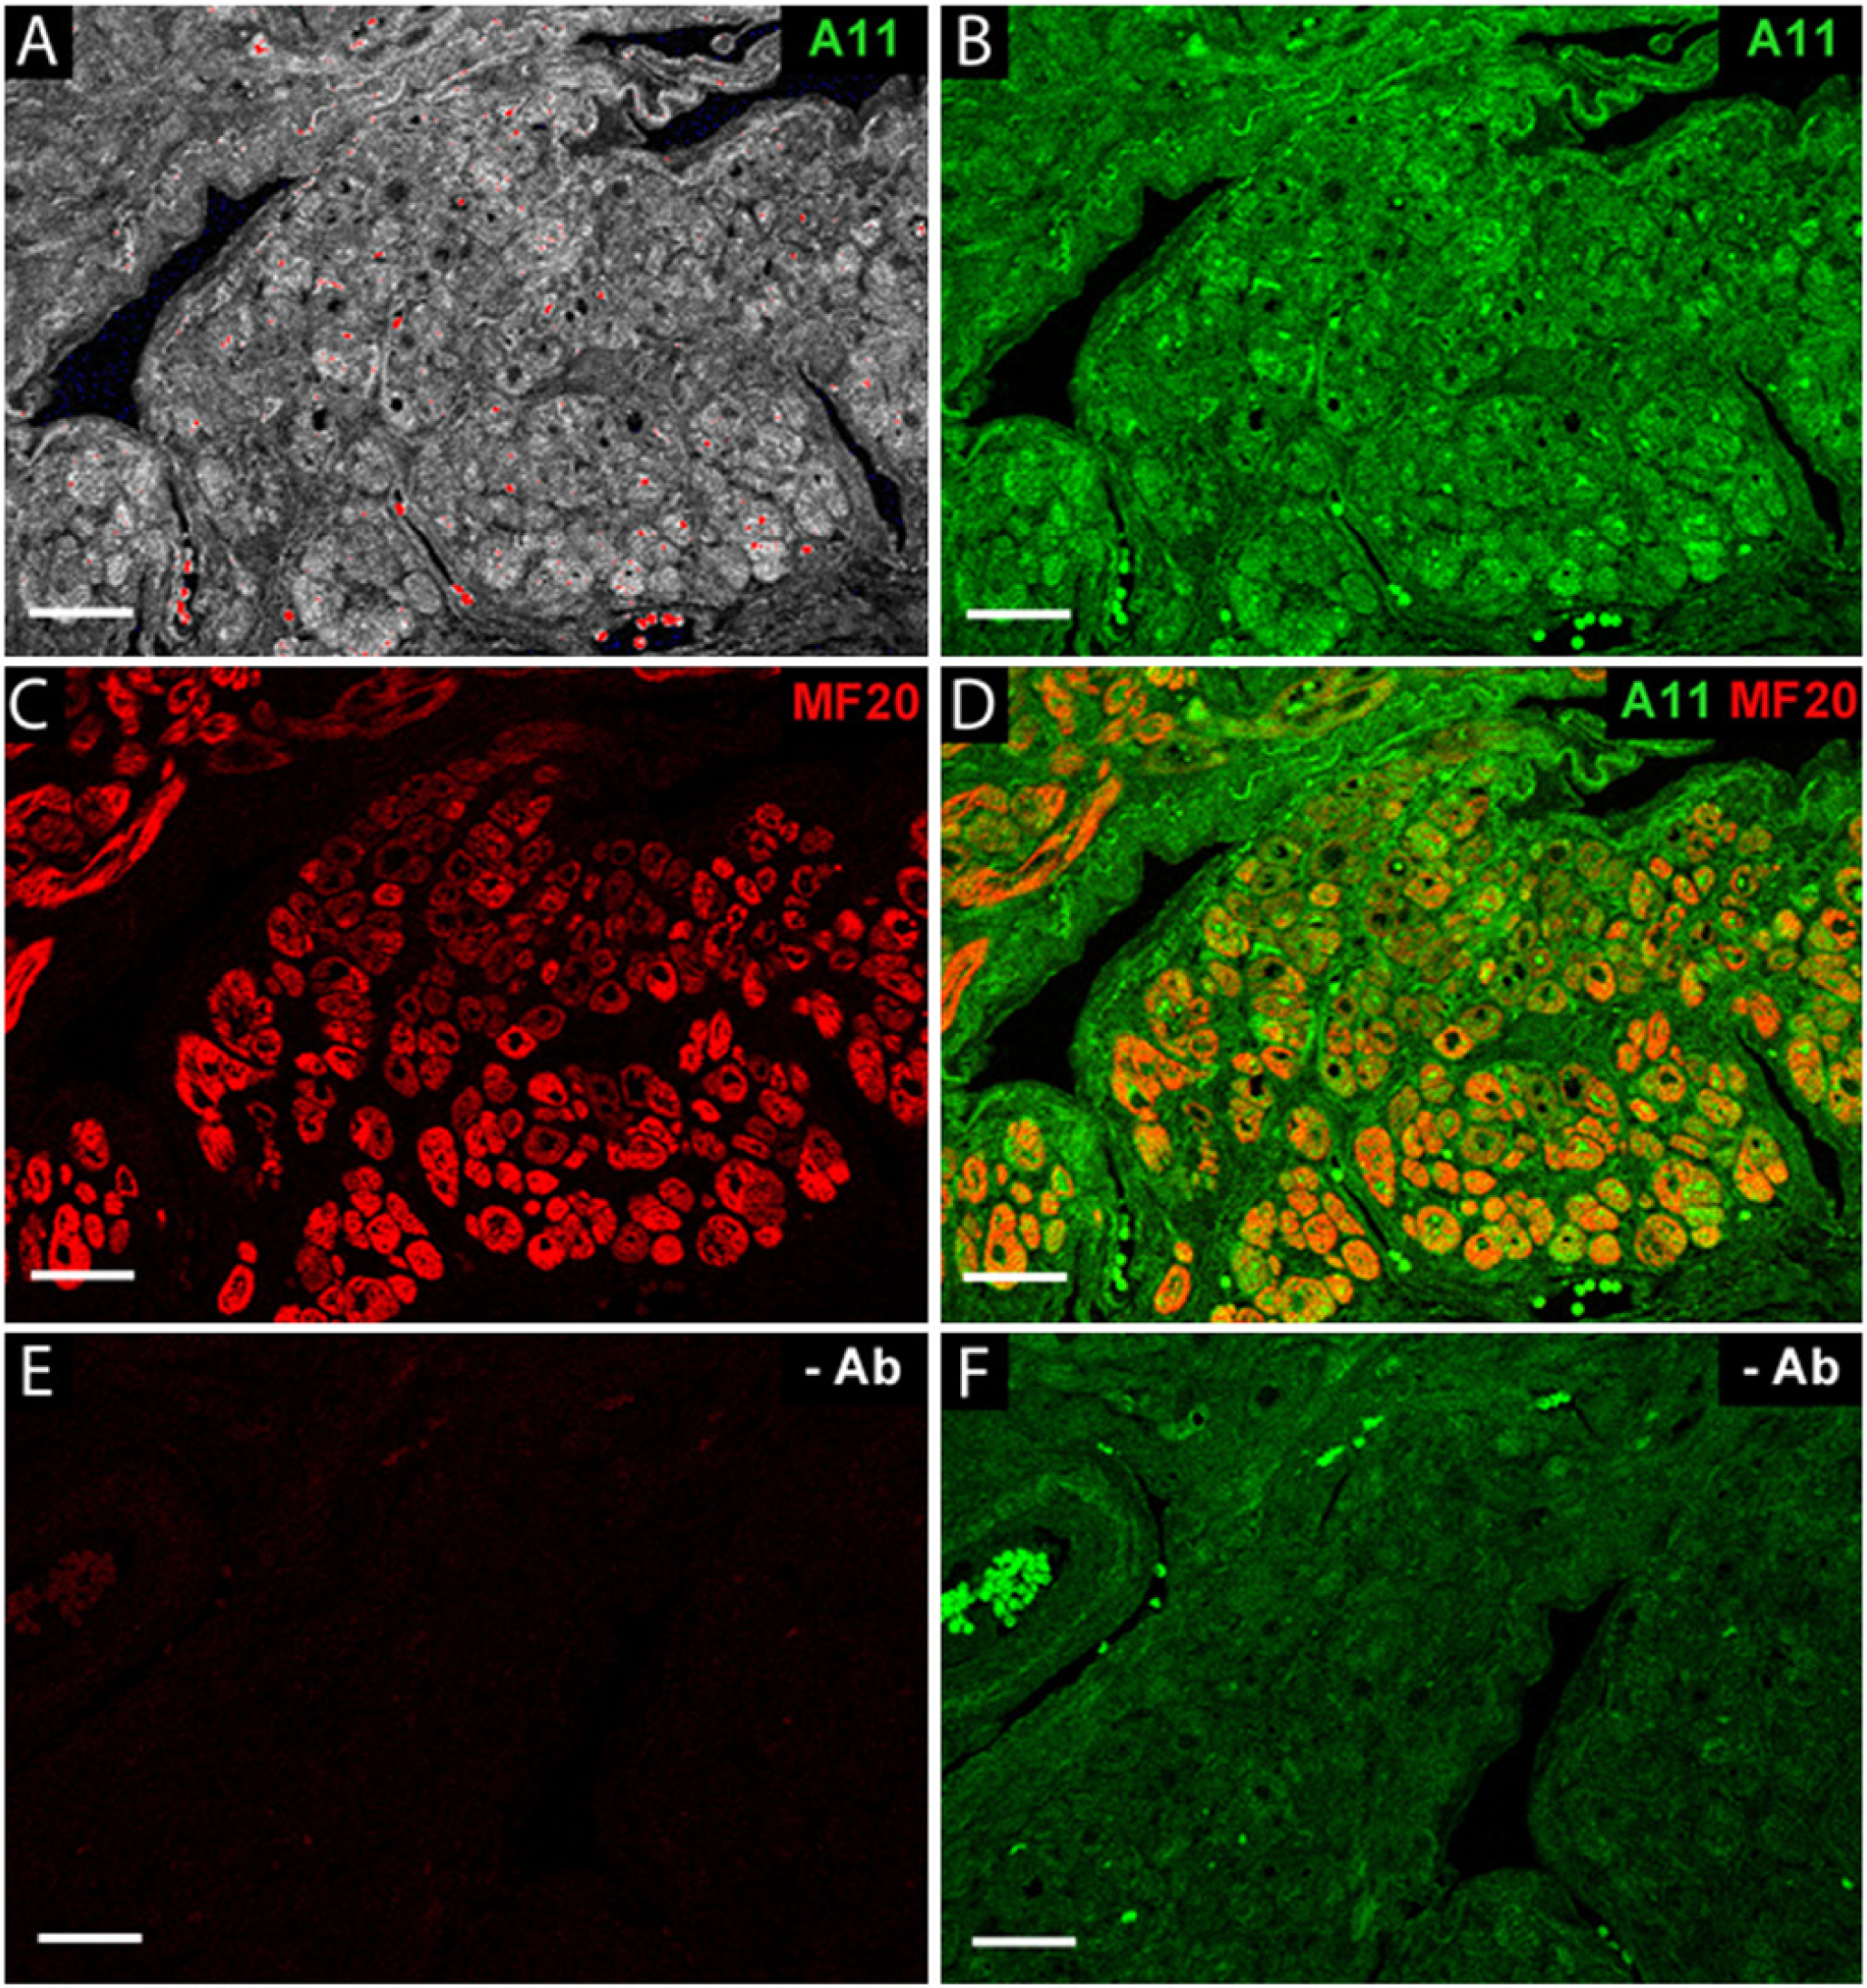
Human atrial tissue immunolabeling. Atrial tissue, 5-µm-thick sections, was double immunofluorescence stained for soluble pre-amyloid oligomers (A-11, green) and myosin heavy chain II (MF20, red) as a myocardium-specific marker. (A) Signal dynamic range was optimized using the LSM510 range indicator tool to maximize signal from A-11-labeled tissue. The red blood cells exhibited an autofluorescence signal significantly higher than the brightest A-11-labeled tissue, thus rendering these cells off-scale (red = off-scale). All off-scale image elements were eliminated from the quantitative analysis. (B) Immunofluorescence staining for A-11 (green). (C) Immunofluorescence staining for MF20 (red). (D) Spatial coincidence of soluble preamyloid oligomers (PAOs) and myocardium (merged images). (E, F) Tissue was processed through the staining protocol in the absence of antibodies to reveal background autofluorescence. Slides were imaged with 488 nm and 543 nm excitations, respectively. Scale bars = 50 µm.
Statistical Analysis
For each atrial sample, two sections (ranging 10–85 µm apart in the tissue block) were processed and analyzed by two independent observers. These processing/data acquisition and analysis sessions were separated in time by at least 1 month for all samples. Data from different patients were assumed to be statistically independent whereas those within a patient were correlated. We used the linear mixed effect model to compare the distribution of these two separate determinations of G/R values. This method can take into account the correlation among repeated measurements from the same sample, as well as random effects estimated for each measurement within a patient. Coefficient of variation (CV) was used to measure the variability of the data. Box and whisker plots were generated to demonstrate the distribution of the data. Each test was compared with the control at the p<0.05 level of significance. All statistical analysis was performed with R version 2.14.1 for Windows (R-Project, http://www.r-project.org/).
Results & Discussion
Development of the Protocol: Optimization of Signal Detection
To determine whether PAOs are present in human atrium, we employed antibodies specific for PAOs (A-11) and myocardium (i.e., MF-20, reflecting striated muscle). Raised against a molecular mimic of amyloid β, A-11 is a conformation-specific antibody that recognizes soluble oligomers generated by a wide variety of proteins, irrespective of their amino acid sequence. Importantly, this antibody has been used to identify PAOs in failing mouse and human ventricles (Willis and Patterson 2013).
During initial experiments using negative control samples, substantial myocardial autofluorescence was evident in the green channel (Figs. 2F and 3D). Therefore, to enable background subtraction during data analysis, antibody-negative images were acquired concurrently with antibody-positive images. To maximize accuracy and reproducibility, care was taken to ensure that the background slide and its A-11/MF20 counterpart were collected from serial sections for each sample and that they were both processed and imaged in parallel using the exact same imaging configurations.
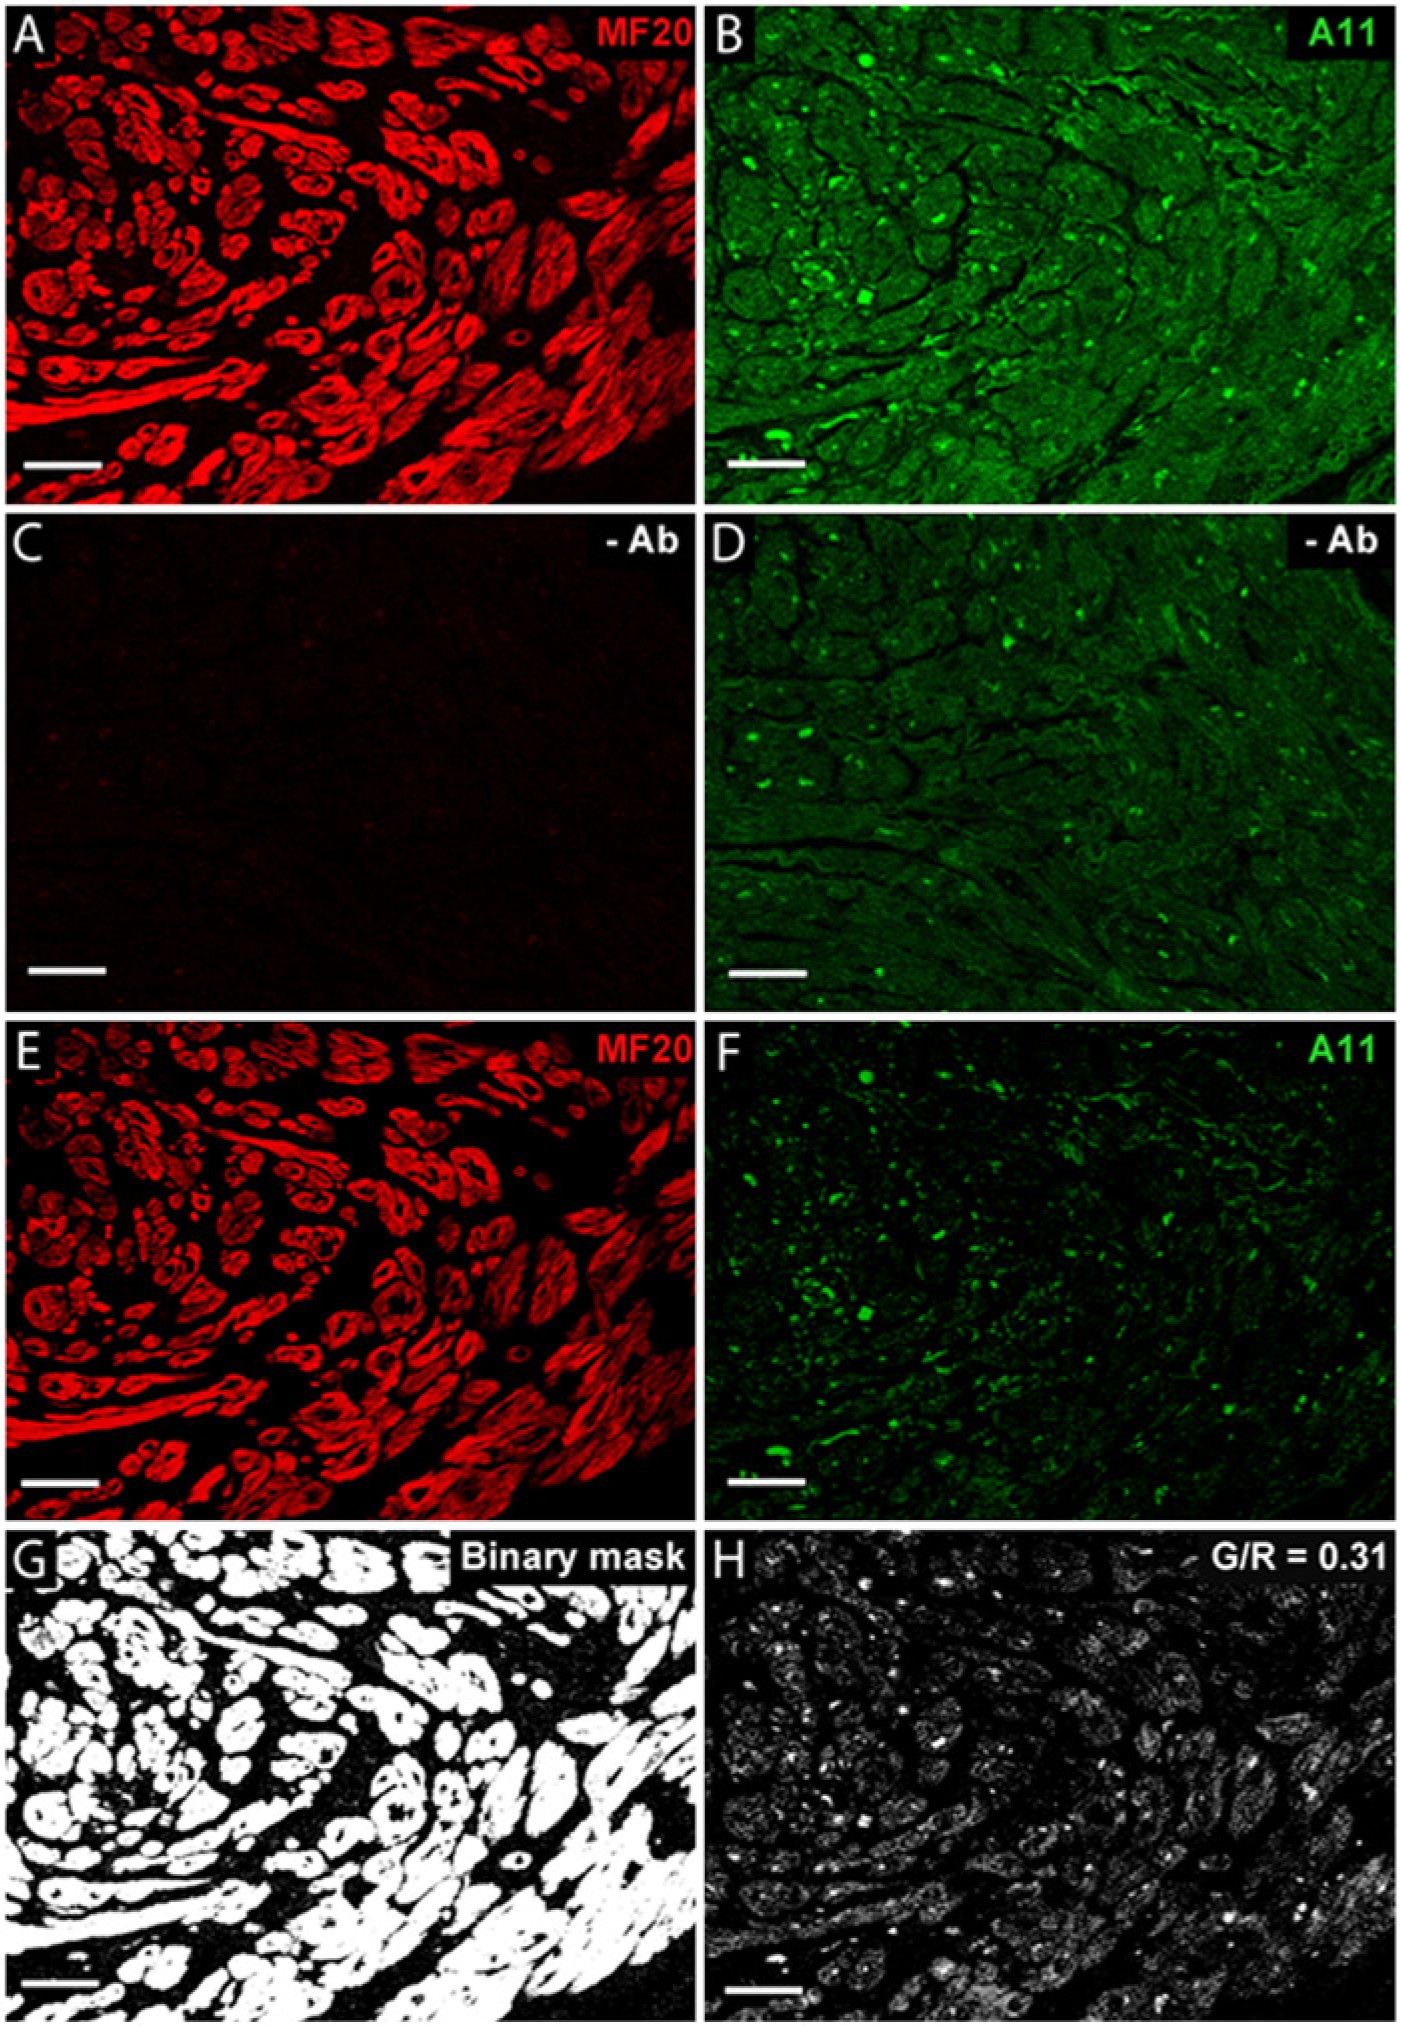
Quantitative detection of PAOs in the myocardium of a human atrial tissue sample. (A) Immunolabeling with myosin heavy chain-specific monoclonal antibody, MF20. (B) Immunoreactivity with A-11. (C, D) Background fluorescent signals of tissues excited at 543 nm and 488 nm, respectively, in the absence of antibodies. The background value used for subtraction was an average of multiple “negative” images (see text). (E, F) Images after subtraction of background signal for the red and green channels, respectively. (G) Binary mask, representing the area of myocardium. (H) Resultant image of PAO signal within the myocardium, quantified as the Green/Red ratio (G/R). Scale bars = 50 µm.
Additionally, red blood cells were intensely autofluorescent, with signal in the green channel that exceeded the brightest A-11-labeled tissue (Fig. 2A, 2B, and 2F). Thus, it was critical to optimize the dynamic range within myocardial tissue, while ignoring the red blood cell signal. Using this approach, the red blood cells were off-scale and easily rejected (i.e., by thresholding) and therefore appropriately excluded during image analysis.
Our experimental results indicated that rigorous adherence to the imaging protocol was required to obtain consistent and reproducible data for a given section. As discussed below, the spatial distribution of PAOs was typically not uniform within a myocardial sample. To account for this non-uniformity, images were acquired with a goal of visualizing a large and representative sample of myocardium: 1) all data were obtained using 20× magnification; 2) images were focused on myocardial-enriched areas from at least six separate, random fields; 3) the optical section (4 microns) included a majority of the physical section (5 microns); and 4) it was evident that these surgically obtained samples frequently demonstrated “crush”-related edge artifacts; for this reason, all images were acquired at the center of tissue boundaries to exclude these regions.
Development of the Protocol: Optimization of Signal Analysis
A method was developed to quantify the relative myocardial surface area (red) that contained PAOs (green), or the Green/Red ratio [G/R], as a spatial representation of PAO burden in the atrial sample (Figs. 1–3). Using the negative control (no antibody) images, the background autofluorescent signals for both the green and red channels was determined and subsequently subtracted from the antibody-positive images. In brief, using Metamorph image analysis tools (Universal Imaging, Inc.; Bedford Hills, NY), the background signal was identified for both the green and red channels as the average value for all pixels in an image with values greater than the noise baseline, but less than values in the 5% of pixels in the upper signal range. Thus, 95% of the imaged atrial tissue signal on background slides was classified as background signal (Figs. 2E, 2F, 3C and 3D). This value was determined for six 20× fields and averaged to provide a final background value. The background values were used to set the minimum signal threshold in each of the six images obtained in the corresponding slide that was exposed to A11 and MF20 for each sample. For these images, the minimum threshold signal for each channel was set to the corresponding background average value plus one standard deviation, whereas the maximal threshold was set to the maximum-1 (or 254 AU [8-bit arbitrary units]), so that the signal measured was both above background and on scale. Significantly off-scale signals (e.g., from red blood cells) were rejected in this process. All pixels with signal values between the range of the minimum and maximum thresholds were defined as positive signals, independent of the absolute signal value.
For the positive MF20 images, a binary mask of the myocardial image was created using pixels with values in the threshold range (Fig. 3G), and the total number of qualifying pixels was defined as the myocardial area (R). The positive MF20 mask was overlaid with the background-subtracted positive A-11 image, and the area of myocardium (pixels) that also contained PAOs (positive green signal) was measured (G). This provided the relative amount of myocardium that contained positive A-11 signals, termed the Green/Red ratio (G/R) (Figs. 3H and 4D). Thus, this generated a spatial measurement of PAO distribution within the myocardium. Using this semi-automated analytical method, G/R values for any given section were highly reproducible.

Representative human atrial samples with low (Sample 1, top row), medium (Sample 2, middle row), and high (Sample 3, bottom row) G/R values. (A, B) Immunolabeling results with (A) myosin heavy chain-specific monoclonal antibody (MF20) and (B) preamyloid oligomer (A-11)-specific antibody. (C) Background fluorescent signal after excitation using 488 nm in the absence of antibodies. (D) Resultant image of PAO signal within the myocardium (G/R value). Scale bars = 50 µm.
Application of the Method: Preamyloid Oligomers in Human Atrial Samples
Human atrial samples imaged in this study were acquired at the time of elective cardiac surgery. To minimize confounding factors, samples were analyzed from patients with no history of amyloidosis, congestive heart failure (including LV ejection fraction <40%), or atrial arrhythmias. As shown in Figures 3, 4 and 5, PAOs were identified in most patients, with a median G/R value of at least 0.1 (range 0.09 to 0.44) in 14 of 16 patients (or 88%). For individual fields, the G/R values varied from 0.02 to 0.53. As expected for soluble oligomers, the predominant signal was located within myocardial cells. Although most samples were obtained from the right atrium (n=14), PAOs were also detected in the left atrium (samples 2 and 9 in Fig. 5).
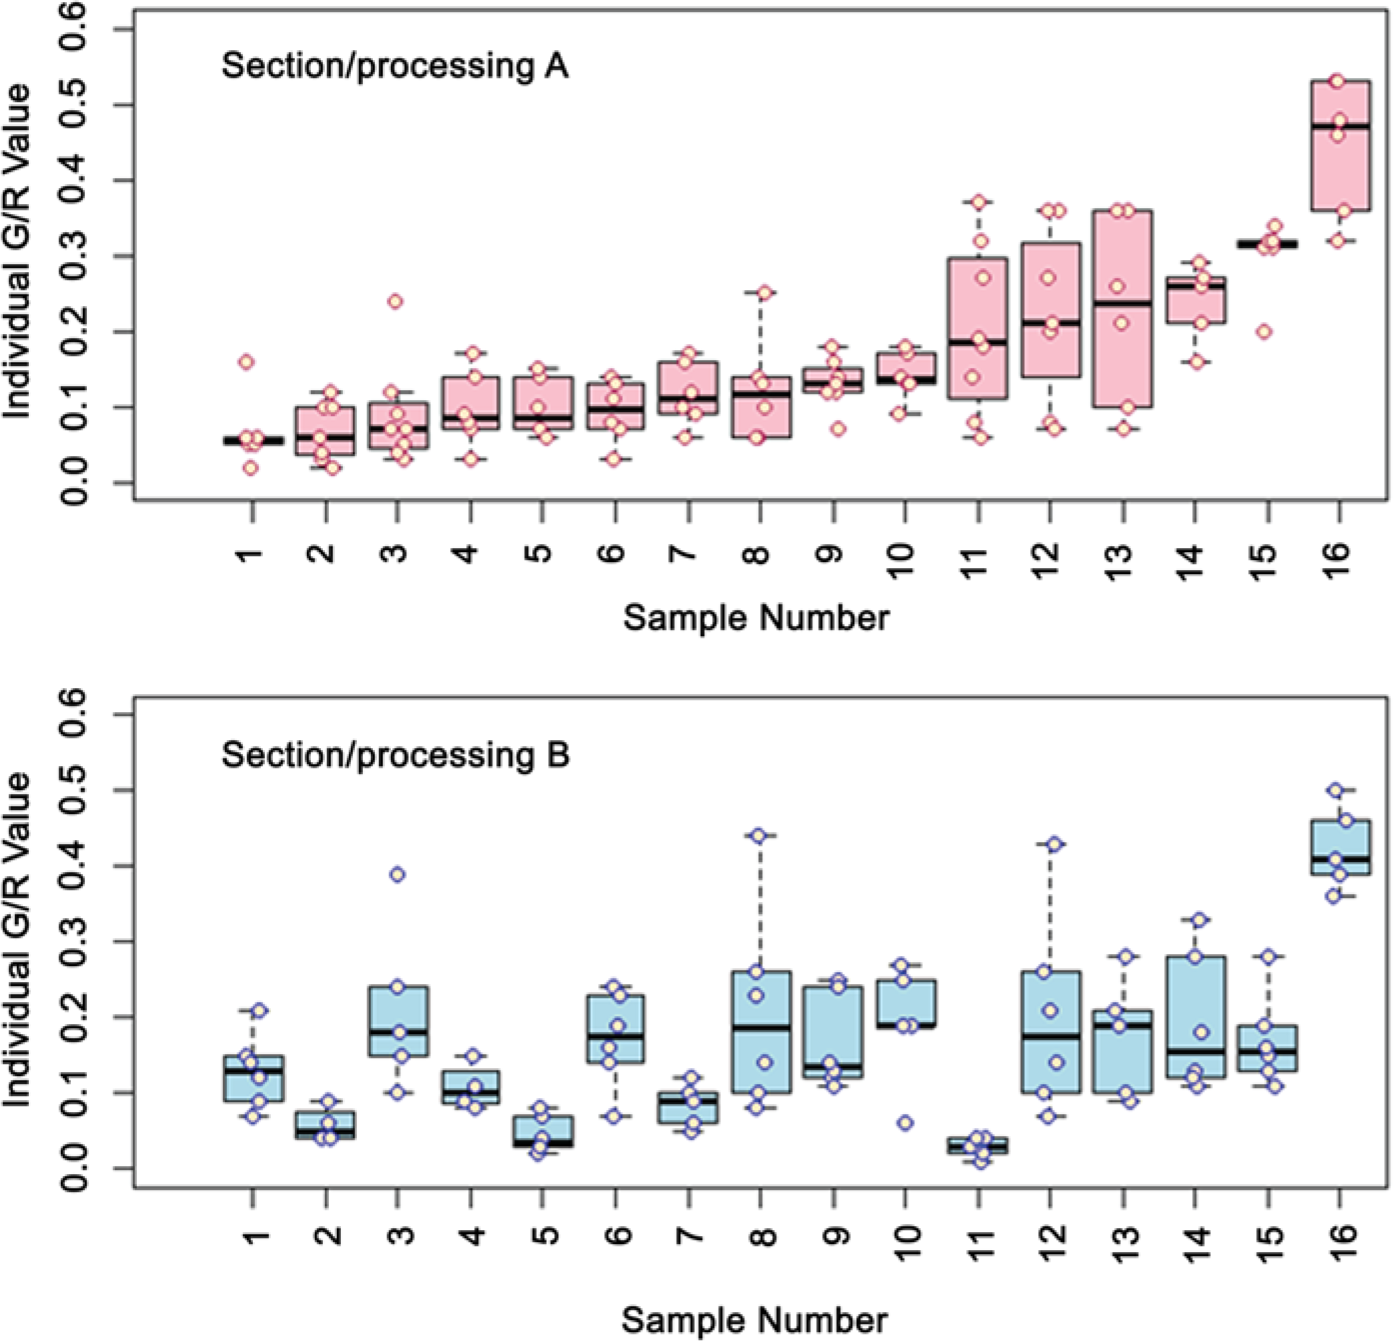
Box plots demonstrating comparisons of separate determinations of G/R values in human atrial samples. A section of an atrial sample from 16 individual patients was subjected to immunohistochemistry and analysis to determine the G/R values from 6 individual fields (pink circles). This process was repeated for another section from each tissue block, with processing, imaging, and analysis performed independently by a second observer (blue circles). Data displayed demonstrate the median (black bar), upper and lower quartiles (pink/blue boxes), maximum and minimum values (whiskers, excluding outliers), and outliers (circles above whiskers, representing values more than 3/2-times greater than the upper/lower quartiles). Whiskers are absent for data sets for which the maximum value and upper/lower quartile are virtually identical.
As evident in Figures 3H and 4D, the PAO distribution within the myocardium was not uniform, but typically nonhomogeneous or “patchy” within a given section. This generated a range of G/R values for the six fields imaged, as illustrated in Figure 5, with occasional statistical outliers. This patchy distribution is reminiscent of the pattern observed with atrial fibrosis, as now imaged noninvasively for the entire left and right atria (Daccarett et al. 2011; Dickfeld et al. 2006).
Figure 5 demonstrates results obtained when different sections of an atrial sample were processed, imaged, and analyzed independently by two different observers. Importantly, the two data sets are not statistically different with respect to the median values and coefficients of variation. It is likely that the differences in G/R values observed between non-serial sections within a sample reflect the inherent variability of PAO distribution observed in the multiple fields (x-y dimensions) of a given section.
Importantly, the findings shown in Figure 5 demonstrate the robust nature of these methods: Using rigorous imaging and semi-automated analysis protocols, with careful attention to detail as outlined above, quantitative analysis of a spatially heterogeneous structural abnormality in relatively small atrial samples can be performed in a reproducible manner.
Limitations
Significant autofluorescence of atrial myocardium in the green channel poses a major challenge for the accurate detection of PAO signals. In addition, nonuniformPAO distribution can potentially hinder reproducibility. However, using a thorough and well-defined approach that includes background subtraction and careful attention to ensure consistent imaging parameters, the method outlined here provides robust, reproducible measurements of PAO burden in small atrial samples. The background signals fundamentally limit the detection of the PAO signals, and it is likely that the data reported here underestimate the true prevalence of this abnormality in human atria. It is possible that alternative tissue preparations (e.g., unfixed) may demonstrate reduced autofluorescence, which in turn would increase accuracy. However, the samples available for this study included only formalin-fixed tissue. In addition, the number of available atrial samples was limited; this precluded any analysis to investigate potential clinical correlates for the presence of PAOs.
In conclusion, we have developed a robust imaging protocol to investigate the presence and burden of PAOs in human atrial tissue, and our results confirm the hypothesis, generated by multiple lines of evidence, that these abnormalities are indeed present in the atria of patients undergoing cardiac surgery. The methods developed in this study will enable future studies using a larger number of atrial samples to dissect the pathophysiological correlates of this novel atrial abnormality.
Footnotes
Authors’ Note
The content is solely the responsibility of the authors and does not necessarily represent the official views of the National Institutes of Health.
Declaration of Conflicting Interests
The authors declared no potential conflicts of interest with respect to the research, authorship, and/or publication of this article.
Funding
The authors disclosed receipt of the following financial support for the research, authorship, and/or publication of this article: This work was supported by a grant from the
References
Supplementary Material
Please find the following supplemental material available below.
For Open Access articles published under a Creative Commons License, all supplemental material carries the same license as the article it is associated with.
For non-Open Access articles published, all supplemental material carries a non-exclusive license, and permission requests for re-use of supplemental material or any part of supplemental material shall be sent directly to the copyright owner as specified in the copyright notice associated with the article.