
Abstract
The expression of bone morphogenetic proteins (BMPs) and their cognate receptors (BMPRs) in osteochondromas has not been investigated. We determined the immunohistochemical localization and distribution of BMP-2/4, -6 and -7; BMP receptors BMPR-1A, BMPR-1B and BMPR-2; signal transducing proteins phosphorylated Smad1/5/8; and BMP antagonist noggin in the cartilaginous cap of solitary (SO) and multiple (MO) human osteochondromas and compared these with bovine growth plate and articular cartilage. The distribution and localization patterns for BMP-6, BMP-7, BMPR-1A and BMPR-2 were similar between the cartilaginous cap and the growth plate. BMP-2/4 and BMPR-1B were present throughout the growth plate. However, BMP-2/4 and phosphorylated Smad1/5/8 were mainly detected in proliferating chondrocytes of the cartilaginous cap. Also, BMPR-1B was found in hypertrophic chondrocytes of SO and proliferating chondrocytes of MO. Noggin was observed in resting chondrocytes and, to a lesser extent, in clustered proliferating chondrocytes in SO. On the other hand, noggin in MO was observed in proliferating chondrocytes. Since BMPs can stimulate proliferation and hypertrophic differentiation of chondrocytes, these findings suggest that there is an imbalance of BMP-2/4 and noggin interactions that may lead to abnormal regulation of chondrocyte proliferation and differentiation in the cartilaginous cap of human osteochondromas.
Keywords
Introduction
Bone morphogenetic proteins (BMPs) are multifunctional proteins involved in the morphogenesis of a variety of tissues, including bone and cartilage (Reddi 2001). BMPs exert their effects by binding to both serine/threonine kinase receptors BMP type 1 (BMPR-1) and type 2 (BMPR-2) to form a signal-transducing complex (Reddi 2001; Reddi 1997). BMPR-1 phosphorylates signal transduction proteins Smad1, -5 or -8 (receptor regulated Smads, or R-Smads), which interact with Smad4 to form a complex. The complex enters the nucleus and activates the transcriptional machinery for BMP-response genes (Kawabata et al. 1998; Reddi 1998). BMP-2, -4, -6, and -7 induce bone and cartilage formation in vivo whereas BMP-2, -4 and -7 are shown to regulate chondrocyte growth and maturation in vitro (Fujii et al. 1999; Wozney and Rosen 1998; Kawabata et al. 1998). BMPs are the critical regulators of the different steps in progenitor/stem cell proliferation and differentiation into cartilage and bone during mammalian endochondral ossification. During endochondral ossification, chondrocytes exit a resting stage and enter a proliferative stage where they undergo several rounds of cell division. As they exit the cell cycle, chondrocytes then undergo hypertrophy and, as they enlarge and mature, increase the secretion of their matrix. Hypertrophic chondrocytes further differentiate to mineralize their surrounding matrix and eventually undergo apoptosis (Kronenberg 2003; Burdan et al. 2009).
Osteochondromas, also called exostoses, are dysplastic cartilaginous bony outgrowths arising from the surface of endochondral bones. An osteochondroma resembles a displaced growth plate; its cartilaginous cap recapitulates all of the zones of the mammalian epiphyseal growth plate during endochondral bone development (Dorfman 1998). The spatial distribution of chondrocytes is irregular, with chondrocytes found in clusters and in lacunae, and nuclear atypia may be present (Vigorita 2008; Du et al. 2011). In nearly all cases, orderly cartilaginous columnar progression, similar to that of a growth plate, is apparent towards the base of the osteochondroma where endochondral ossification takes place (Vigorita 2008; Unni 1996). The appearance of the cartilage cap is hypocellular; chondrocytes appear enlarged and hyperchromatic (Unni 1996). Proliferating chondrocytes seem to be larger in osteochondromas but less numerous as compared with a normal mammalian growth plate, and hypertrophic chondrocytes can be found within the calcified cartilaginous matrix (Benoist-Lasselin et al. 2006). An osteochondroma continues to grow until skeletal maturation is reached.
The spectrum of osteochondromas ranges from single lesions (solitary osteochondroma, SO) to multiple lesions (multiple osteochondroma, MO). Multiple hereditary exostoses (MHE) is an autosomal dominant trait characterized by a high incidence of osteochondromas and skeletal deformities (Jennes et al. 2009). Clinical manifestations of MHE lead to pain, functional problems and morbidity due to the entrapment of blood vessels, nerves and tendons (Bovée 2008). The possibility of its transformation into a low-grade chondrosarcoma increases to 5% in patients with MHE (Bovée et al. 2000). Fibrodysplasia ossificans progressiva (FOP)—caused by abnormal activation of a BMPR-1—is a rare condition characterized by congenital skeletal malformations and progressive heterotopic ossification of skeletal muscle and soft connective tissue (Kaplan et al. 2008). Like patients with MHE, patients with FOP experience a high incidence of osteochondroma formation (Deirmengian et al. 2008). This similarity in the pathogenesis of MHE and FOP has led to the suggestion that BMP signaling may play a role in the formation of osteochondromas.
Heparan sulfate (HS) proteoglycans (PGs) are known to bind to BMPs and are involved in BMP-mediated morphogenesis by regulating their gradient formation and activity (Jiao et al. 2007; Reddi 1997). Extracellular and membrane-bound HSPGs sequester BMPs at the cell surface and move BMPs across the cell membrane through restricted diffusion (Jiao et al. 2007; Yan and Lin 2009). In the absence of HSPGs, it has been shown that the spatial range of BMP signaling is dysregulated during limb development (Matsumoto et al. 2010b), which demonstrates a regulatory role for HSPGs with regards to BMP signaling activity. HS-deficient cells have been shown to be capable of transducing BMP signals in the limb bud but the tight spatial regulation of BMP signaling—as seen in wild-type cells—is disrupted in these cells (Matsumoto et al. 2010b). Mutations in the exostosin1 (EXT1) and exostosin2 (EXT2) genes, which encode glycosyltransferases involved in the chain elongation step of HS biosynthesis, are strongly associated with MHE (Nadanaka and Kitagawa 2008; Benoist-Lasselin et al. 2006; Hameetman et al. 2007; Reijnders et al. 2010). Inactivating mutations in either EXT1 or EXT2 disrupt the function of the EXT1/2 complex, leading to abnormal elongation of HS chains (Okada et al. 2010). Consequently, studies have reported intracellular accumulation of HSPGs in the Golgi apparatus, and a diminished and abnormal distribution of HSPGs in osteochondromas (Hameetman et al. 2007; Hecht et al. 2002). This abnormal distribution of HSPGs, however, seems to maintain the proliferative capacity of chondrocytes in osteochondromas (Benoist-Lasselin et al. 2006; Hameetman et al. 2007). Thus, abnormal chondrocyte proliferation and differentiation have been proposed in the pathogenesis of MHE. Because HS-binding BMPs are multifunctional proteins involved in the regulation of chondrocyte proliferation and differentiation during mammalian endochondral bone development, their role in osteochondroma formation is intriguing.
Insight into the expression of BMPs and BMPRs in osteochondromas is limited. BMP-2 and BMPR-1B mRNA have been localized in chondrocyte-like cells in the cartilaginous matrix of osteochondromas (Nakase et al. 2001). Phosphorylated R-Smads have also been detected in osteochondromas, indicating BMP signaling is functional (Reijnders et al. 2010). Nonetheless, the role of BMP signaling in osteochondroma pathogenesis has yet to be elucidated. In the present study, we assessed immunohistochemically the localization and distribution of BMP-2/4, -6, and -7, BMP antagonist noggin and receptors BMPR-1A, BMPR-1B and BMPR-2 in the cartilaginous cap of SO and MO. To gain insight into the potential alterations to BMP signaling in the cartilaginous cap of human osteochondromas, the signal transducing proteins phosphorylated Smad1/5/8 (p-Smad1/5/8) were also investigated. Since osteochondromas histologically resemble the mammalian growth plate, we compared their distribution to that observed in bovine tibial growth plates and articular cartilage.
Materials & Methods
Human and Animal Samples
All cartilaginous caps from human osteochondroma samples were obtained from MO patients (n=10) and SO patients (n=9) undergoing surgical resections following medical advice. Informed consent was obtained from all patients in accordance to our Institutional Review Board. Articular cartilage and tibial growth plates of stifle (knee) joints from 3-month-old calves were obtained from a local abattoir and harvested. All samples were fixed in 4% paraformaldehyde, decalcified in Morse solution (10% sodium citrate, 20% formic acid), embedded in paraffin and sectioned (5-µm thick). To characterize the gross morphology, paraffin sections (5-µm thick) were stained with Harris’ hematoxylin solution and counterstained in eosin Y solution or analyzed by immunohistochemistry.
Antibodies
Goat polyclonal antibodies against human BMP-2/4, BMP-6 and BMPR-1A, a goat monoclonal antibody against human BMPR-2, and a mouse monoclonal antibody against human BMPR-IB were purchased from R&D Systems (Minneapolis, MN). Rabbit polyclonal antibodies against human BMP-7 and noggin were purchased from Abcam (Cambridge, MA). Rabbit polyclonal antibodies against Ki-67 and Collagen X were purchased from Bioss (Woburn, MA). A rabbit polyclonal antibody against p-Smad1/5/8 and a mouse monoclonal antibody against human type II collagen were purchased from EMD Millipore (Billerica, MA). Purchased antibodies were used according to manufacturer’s recommendations.
Immunohistochemistry
Immunohistochemistry was performed using an R.T.U. Vectastain Universal Quick Kit (Vector Laboratories; Burlingame, CA). After deparaffinization and hydration, endogenous peroxidase was blocked with 3% H2O2 for 10 min. Nonspecific reactions were blocked using 5% normal horse serum for 20 min at room temperature. Samples were incubated in 10 mM sodium citrate buffer (pH 6.0) and heated in a water bath at 60C for 20 min for antigen retrieval. Samples were incubated with the appropriate diluted primary antibodies at room temperature for 2 hr in a humidified chamber. Primary antibodies were diluted in PBS as follows: anti-BMP-7, -collagen X, -Ki-67 and -noggin, 1:200; anti-BMP-6, -BMPR-1A, -BMPR-1B and -BMPR-2, 1:100; anti-p-Smad1/5/8, 1:75; anti-BMP-2/4, -type II collagen, 1:50. Samples were then incubated with a biotinylated pan-specific universal secondary antibody for 20 min at room temperature, followed by incubation in a streptavidin/peroxidase complex reaction for 10 min at room temperature. Color was developed using ImmPACT DAB Peroxidase Substrate (Vector Laboratories; Burlingame, CA). Some sections were counterstained with 1% Alcian Blue solution in 0.1 N HCl. As a negative control, normal rabbit IgG (Santa Cruz Biotechnology; Dallas, TX) was used instead of the primary antibodies. Section images were captured using a Nikon Eclipse TE2000-E microscope and Nikon NIS Elements Imaging Software (Melville, NY).
Data Analysis
For immunohistochemical analysis, negatively and positively stained chondrocytes of the cartilaginous caps of osteochondromas were counted. To determine the positive index, the number of positively stained chondrocytes were divided by the total number of counted chondrocytes and multiplied by 100 to calculate the percentage. We used unpaired Student’s t-tests to evaluate the statistical significance of the experiments. All values are expressed as the mean ± standard deviation. Differences were considered significant at p<0.05.
Results
Osteochondroma
The cartilaginous caps of osteochondromas displayed visible chondrocyte disorganization compared to a typical mammalian growth plate, with the presence of proliferating chondrocytes in clusters rather than in columns. Ossification among these chondrocyte clusters was also observed. Nearly all cartilaginous caps of the SO samples collected showed a growth plate-like morphology with large hypertrophic chondrocytes observed near the ossification zone (Fig. 1A). More apparent fibrous tissue was observed surrounding the cartilaginous tissue in MO samples as compared with SO samples. The morphology of the cartilaginous caps of MO varied among the samples collected. However, almost all of the samples demonstrated an abundance of cartilaginous matrix consisting of randomly dispersed chondrocytes (Fig. 1B). For this reason, classifying chondrocytes as resting, proliferating or hypertrophic within the cartilaginous cap based on morphology alone was challenging at times.
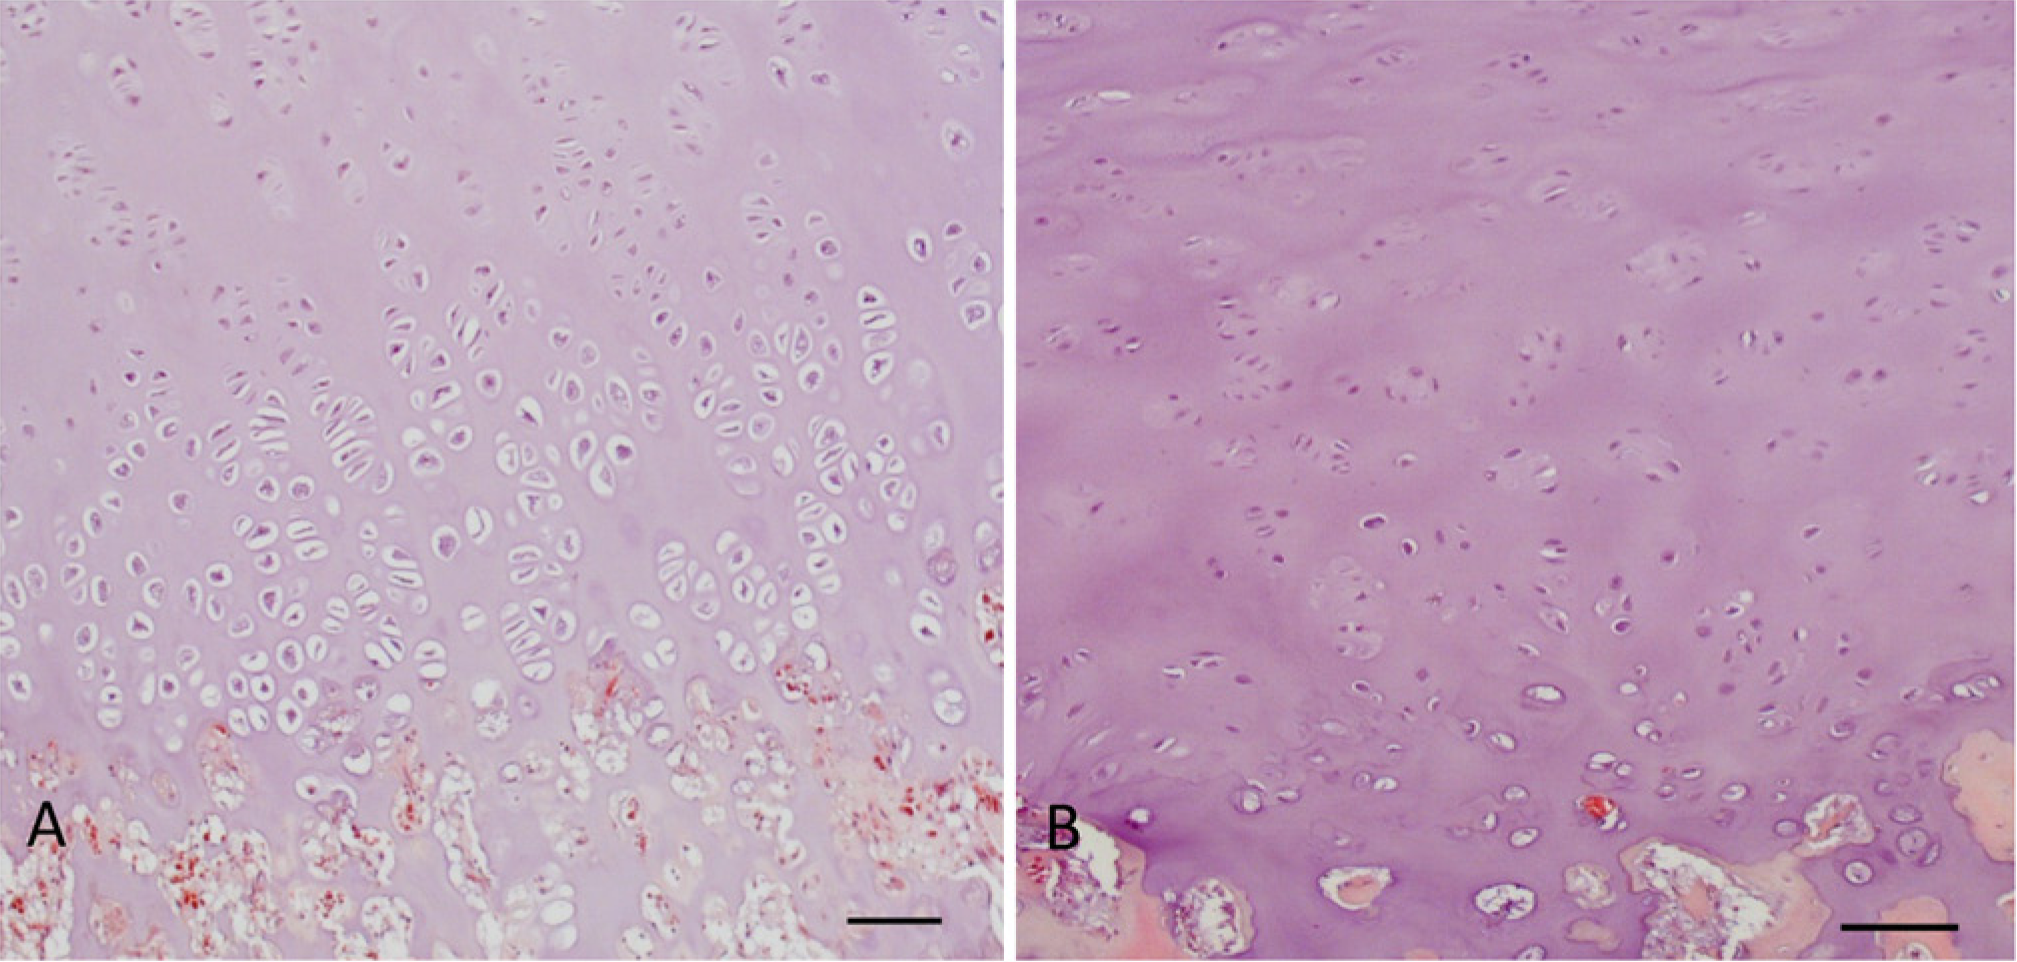
Hematoxylin and eosin-stained histological features of cartilaginous caps of human osteochondromas. (A) Solitary osteochondroma (SO) tissue samples show growth plate-like morphology, with clusters of chondrocytes rather than columns. (B) Multiple osteochondroma (MO) tissue samples show abundant cartilaginous matrix, with randomly distributed chondrocytes. Note the prominent lacunae in some lower proliferating and hypertrophic chondrocytes. Bar = 100 µm.
To better classify the chondrocyte subtypes present in the cartilaginous cap of osteochondromas, type II collagen, Ki-67 and type X collagen were analyzed (Fig. 2). Type II collagen is expressed by chondrocytes, Ki-67 is used as a marker of cell proliferation and is absent in resting (G0) cells, and type X collagen is expressed by hypertrophic chondrocytes during endochondral ossification. Along with characteristic morphological features, proliferating chondrocytes in the cartilaginous caps of osteochondromas were classified as positive for type II collagen and Ki-67 and negative for type X collagen, whereas hypertrophic chondrocytes were classified as negative for type II collagen and Ki-67 and positive for type X collagen. Chondrocytes positive for type II collagen and negative for Ki-67 and type X collagen were classified as resting chondrocytes. Previous studies indicate that chondrocytes are seldom well preserved and fixation of cartilage usually causes a degree of shrinkage between the chondrocyte cytoplasm and the lacunar wall (Hunziker et al. 1982). Lacunae appear to be more prominent and the shrinkage makes it difficult to make out the details of these cells with the light microscope. The chondrocytes, shrunken with tissue preparation, give the appearance of a having a densely stained, atypical nucleus within lacunae. Thus, chondrocyte staining occasionally appeared to be nuclear-like.
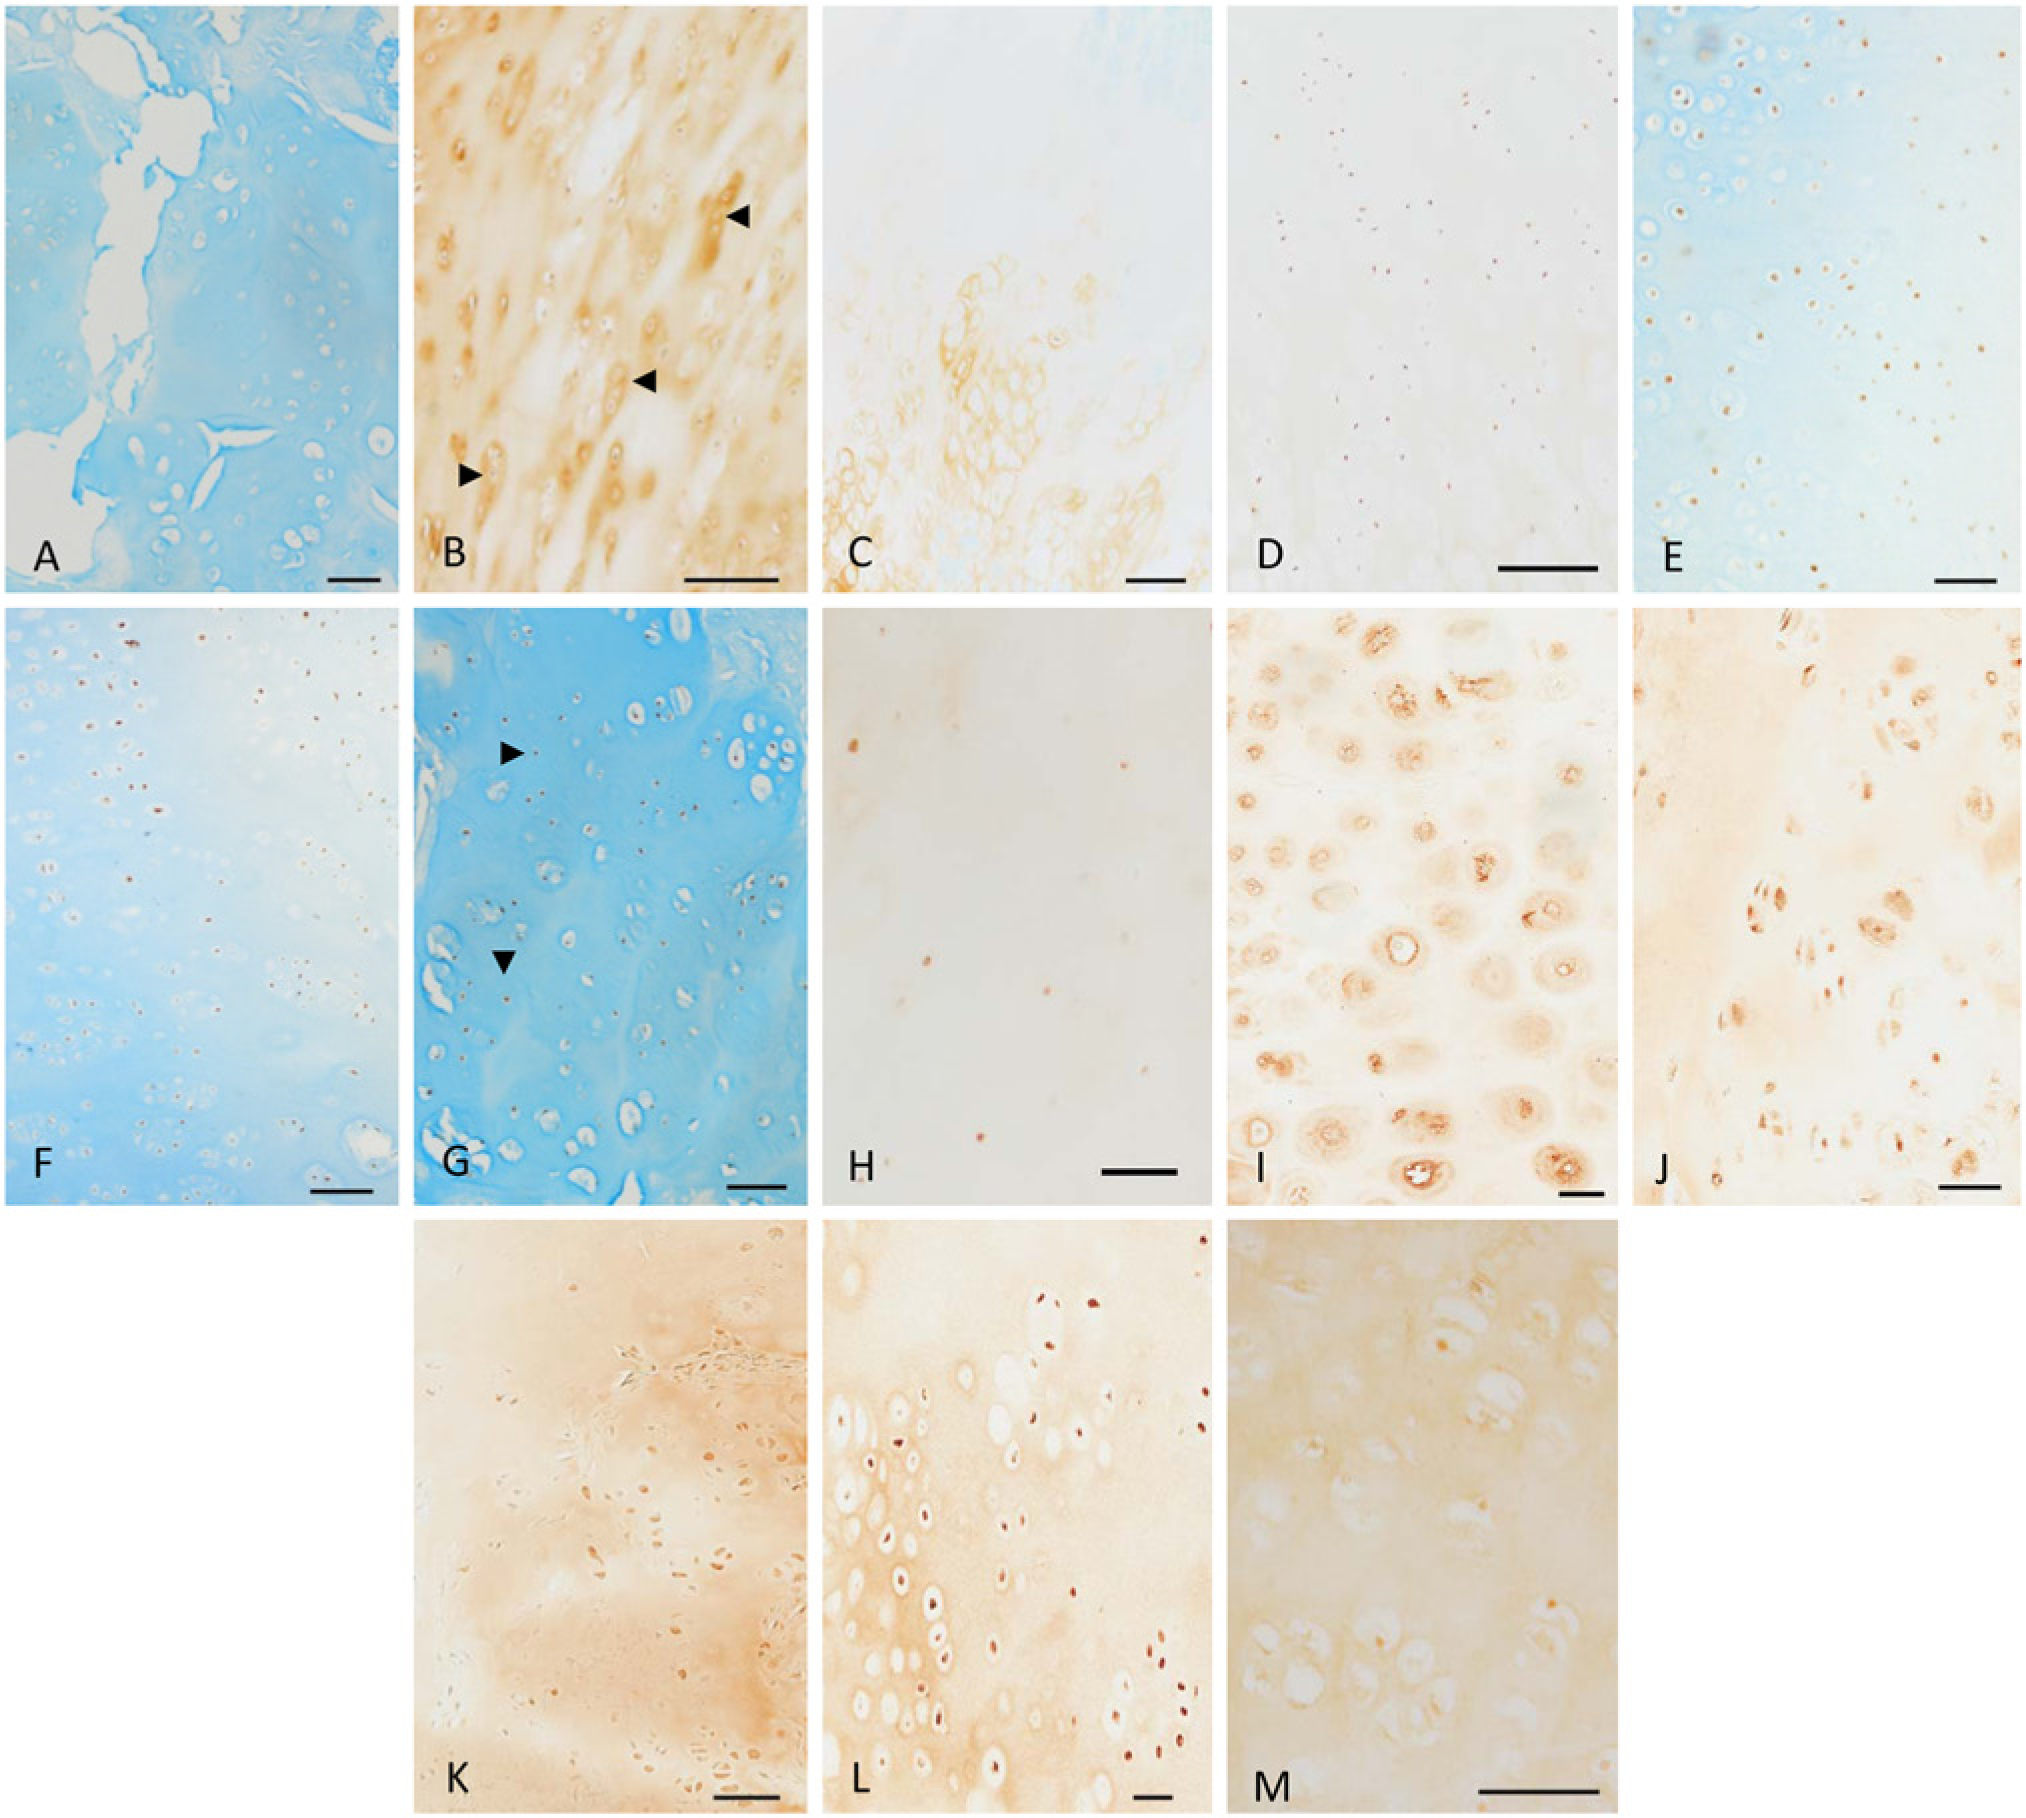
Immunostaining of the cartilaginous caps of human osteochondromas. (A) Non-immune serum control shows no BMP staining. (B) Staining for type II collagen present in resting chondrocytes and proliferating (arrowheads) chondrocytes. (C) Type X collagen in hypertrophic chondrocytes. (D) Staining for Ki-67 in proliferating chondrocytes. (E) Staining for BMP-2/4 in clusters of proliferating chondrocytes in solitary osteochondroma (SO). (F) BMP-6 staining in proliferating chondrocytes. (G) Staining for BMP-7 present in resting chondrocytes (arrowheads) and in proliferating chondrocytes. (H) BMPR-1A staining in small resting chondrocytes. (I) Membranous staining for BMPR-1B in hypertrophic chondrocytes of SO samples. (J) Cytoplasmic and nuclear-like staining for BMPR-1B in enlarged and proliferating chondrocytes of multiple osteochondroma (MO) samples. (K) Weak cytoplasmic staining for BMPR-2 in proliferating chondrocytes. (L) Cytoplasmic staining for noggin in proliferating chondrocytes of MO samples. (M) Positive staining for phosphorylated Smad1/5/8 in proliferating chondrocytes. (A, C-H) Stained with Alcian Blue. (A-G, I-L) Bar = 100 µm, (H, M) Bar = 50 µm.
BMP-2/4 was detected in resting and proliferating chondrocytes (Fig. 2E). Cytoplasmic staining for BMP-6 was observed in resting chondrocytes; proliferating chondrocytes demonstrated nuclear-like staining (Fig. 2F). However, staining for BMP-6 was weak in MO samples as compared with SO samples. BMP-7 was observed in resting and proliferating chondrocytes (Fig. 2G). Cytoplasmic staining for BMP-7 was more visible in some proliferating chondrocytes. Rare, weak staining for BMPR-1A was observed in small resting and proliferating chondrocytes (Fig. 2H). Membranous staining for BMPR-1B was detected in hypertrophic chondrocytes of SO samples (Fig. 2I), whereas enlarged and proliferating chondrocytes in MO samples displayed cytoplasmic and nuclear-like staining (Fig. 2J). Cytoplasmic staining for BMPR-2 was weakly observed in proliferating chondrocytes (Fig. 2K). Also, BMPR-2 staining was detected in calcifying hypertrophic chondrocytes in SO samples. In SO samples, noggin was observed mostly in resting chondrocytes but was also detected at times in clustered, proliferating chondrocytes. On the other hand, noggin was observed mainly in proliferating chondrocytes in MO samples where staining appeared to be more nuclear-like than cytoplasmic due to prominent lacunae and cytoplasm shrinkage (Fig. 2L). Finally, p-Smad1/5/8 staining was observed in proliferating chondrocytes (Fig. 2M) and detected weakly in hypertrophic chondrocytes. A summary of the localization and distribution of BMPs, BMPRs, p-Smad1/5/8 and noggin among the different tissues studied is presented in Table 1. The immunohistochemistry for BMPs and BMPRs allowed us to determine the positive index for MO and SO samples, and these findings are presented in Table 2. The positive index values of the cartilaginous caps of osteochondromas from MO patients revealed no significant differences as compared with values obtained from SO patients.
Immunohistochemical Localization and Distribution of Bone Morphogenetic Proteins, their Cognate Receptors (BMPRs) and Noggin.
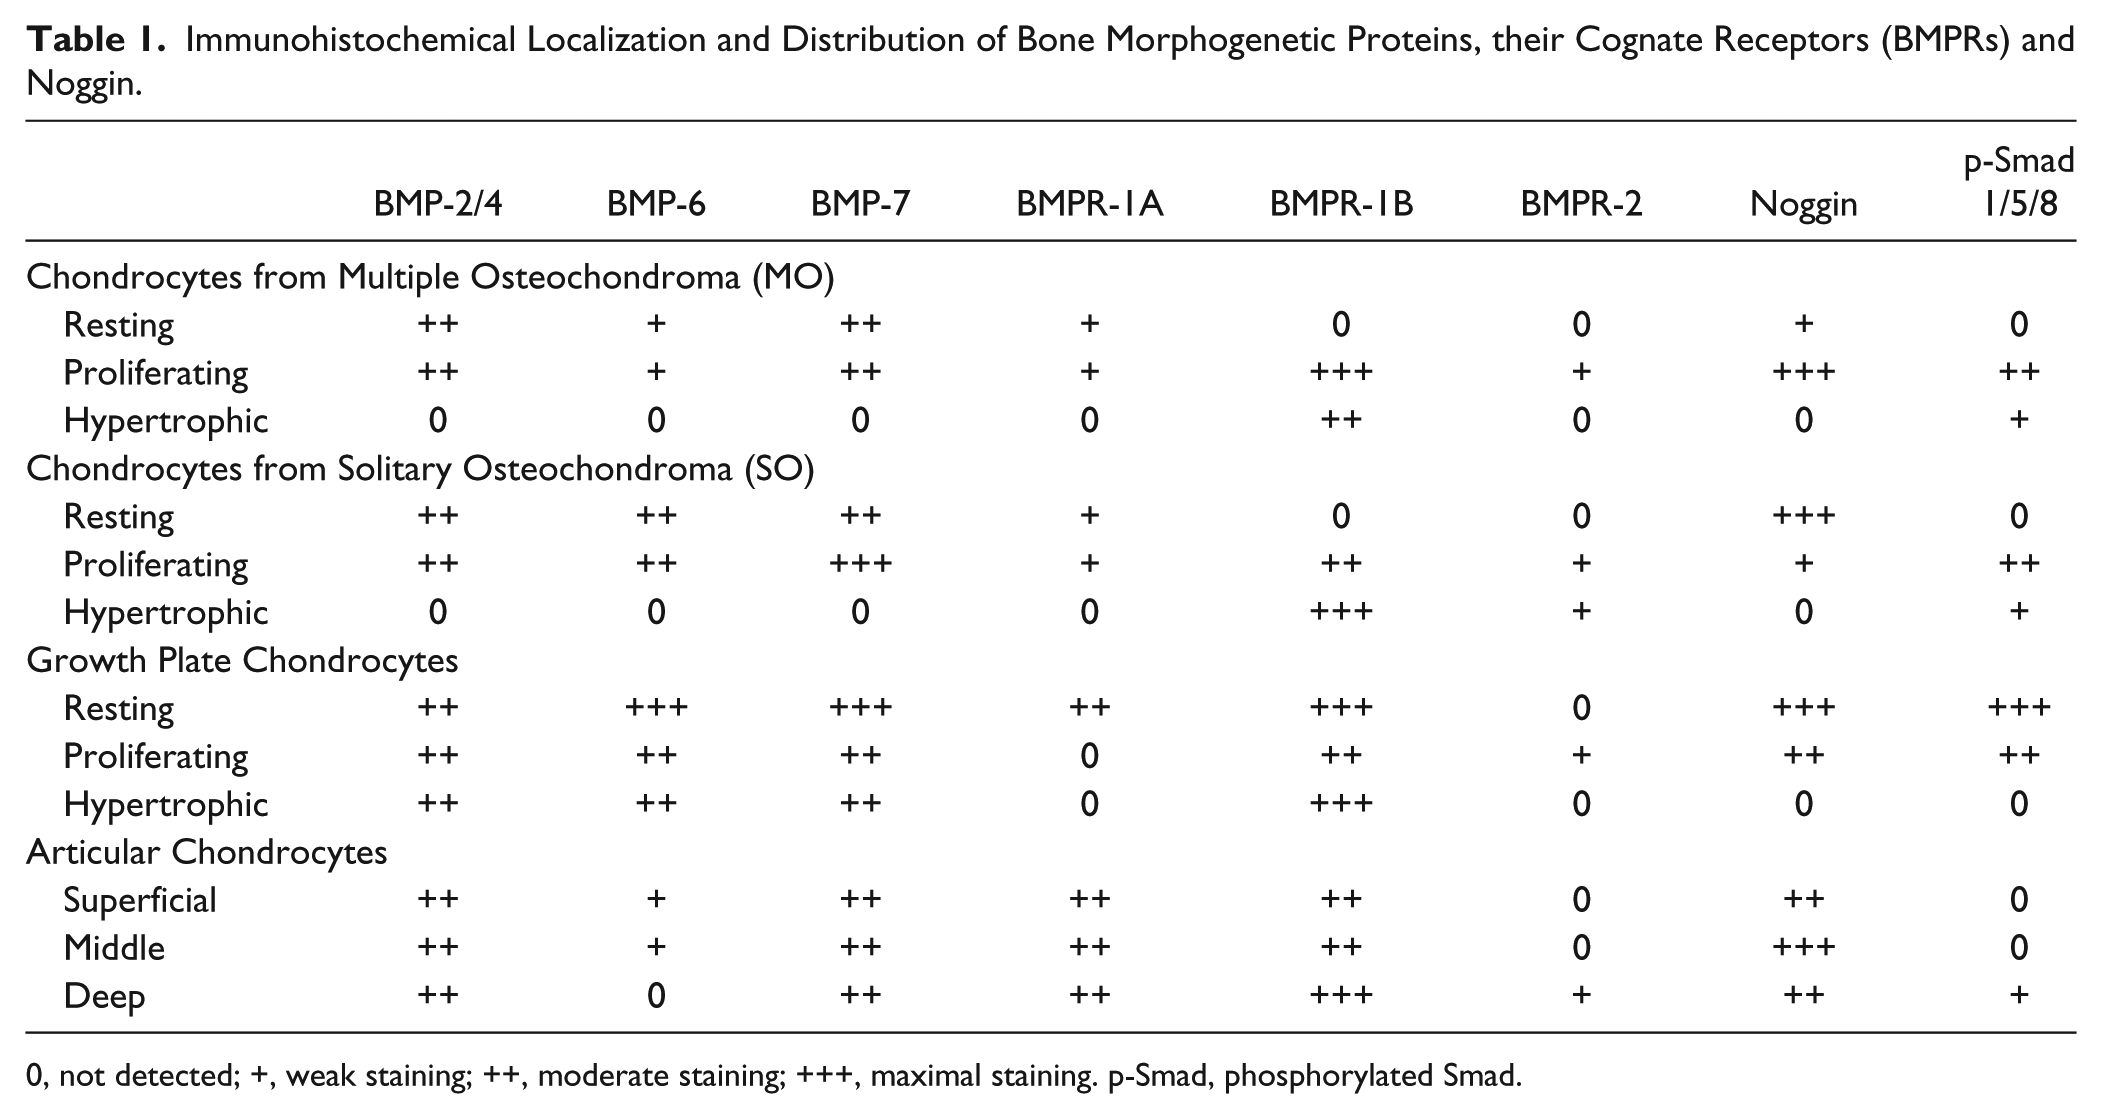
0, not detected; +, weak staining; ++, moderate staining; +++, maximal staining. p-Smad, phosphorylated Smad.
Positive Index Values for Different Entities in the Cartilaginous Caps of Human Osteochondromas.
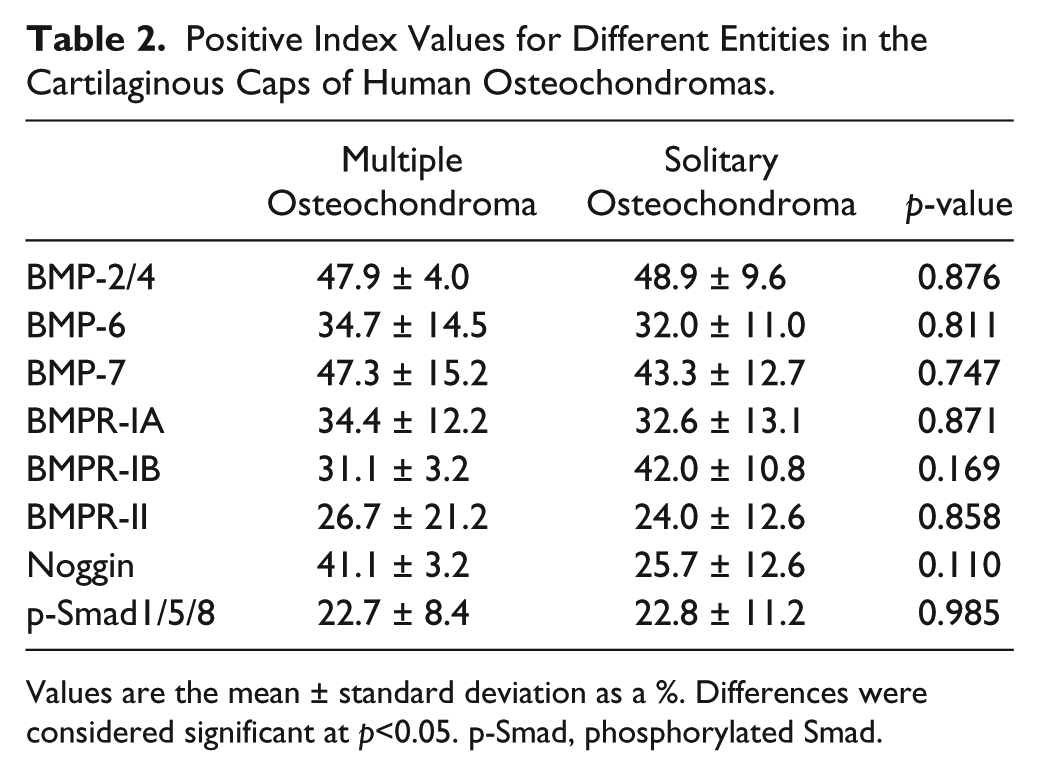
Values are the mean ± standard deviation as a %. Differences were considered significant at p<0.05. p-Smad, phosphorylated Smad.
Growth Plates
The bovine growth plate served as a model of a typical mammalian growth plate, as it demonstrates typical columnar arrangement of chondrocytes into resting, proliferative and hypertrophic zones; showing orderly columnar progression toward endochondral ossification (Fig. 3A). Type II collagen was observed in resting zone chondrocytes. Positive staining for type II collagen and Ki-67 was observed in proliferative zone chondrocytes whereas hypertrophic zone chondrocytes stained positive for type X collagen. Shrinkage between the chondrocyte cytoplasm and the lacunar wall was noted; thus, the appearance of chondrocytes as a densely stained atypical nucleus within lacunae was present. BMP-2/4 was observed in resting, proliferative and hypertrophic zone chondrocytes, but staining of the cytoplasm was more apparent in proliferating chondrocytes (Fig. 3E). The presence of BMP-6 was detected in both resting and proliferative zone chondrocytes (Fig. 3F); however, nuclear-like staining for BMP-6 was visible. Nuclear-like and cytoplasmic staining for BMP-7 was detected throughout the growth plate, with proliferative zone chondrocytes showing prominent staining (Fig. 3G). BMPR-1A was observed mainly in resting zone chondrocytes (Fig. 3H). BMPR-1B was detected throughout the growth plate, with stronger staining in the resting and hypertrophic zones (Fig. 3I). Staining for BMPR-2 was weakly visible in proliferative zone chondrocytes (Fig. 3J). Nuclear-like staining for noggin was observed mainly in resting zone chondrocytes and, to a lesser extent, in proliferating chondrocytes (Fig. 3K). Staining for p-Smad1/5/8 was present in both resting and proliferating zone chondrocytes (Fig. 3L).
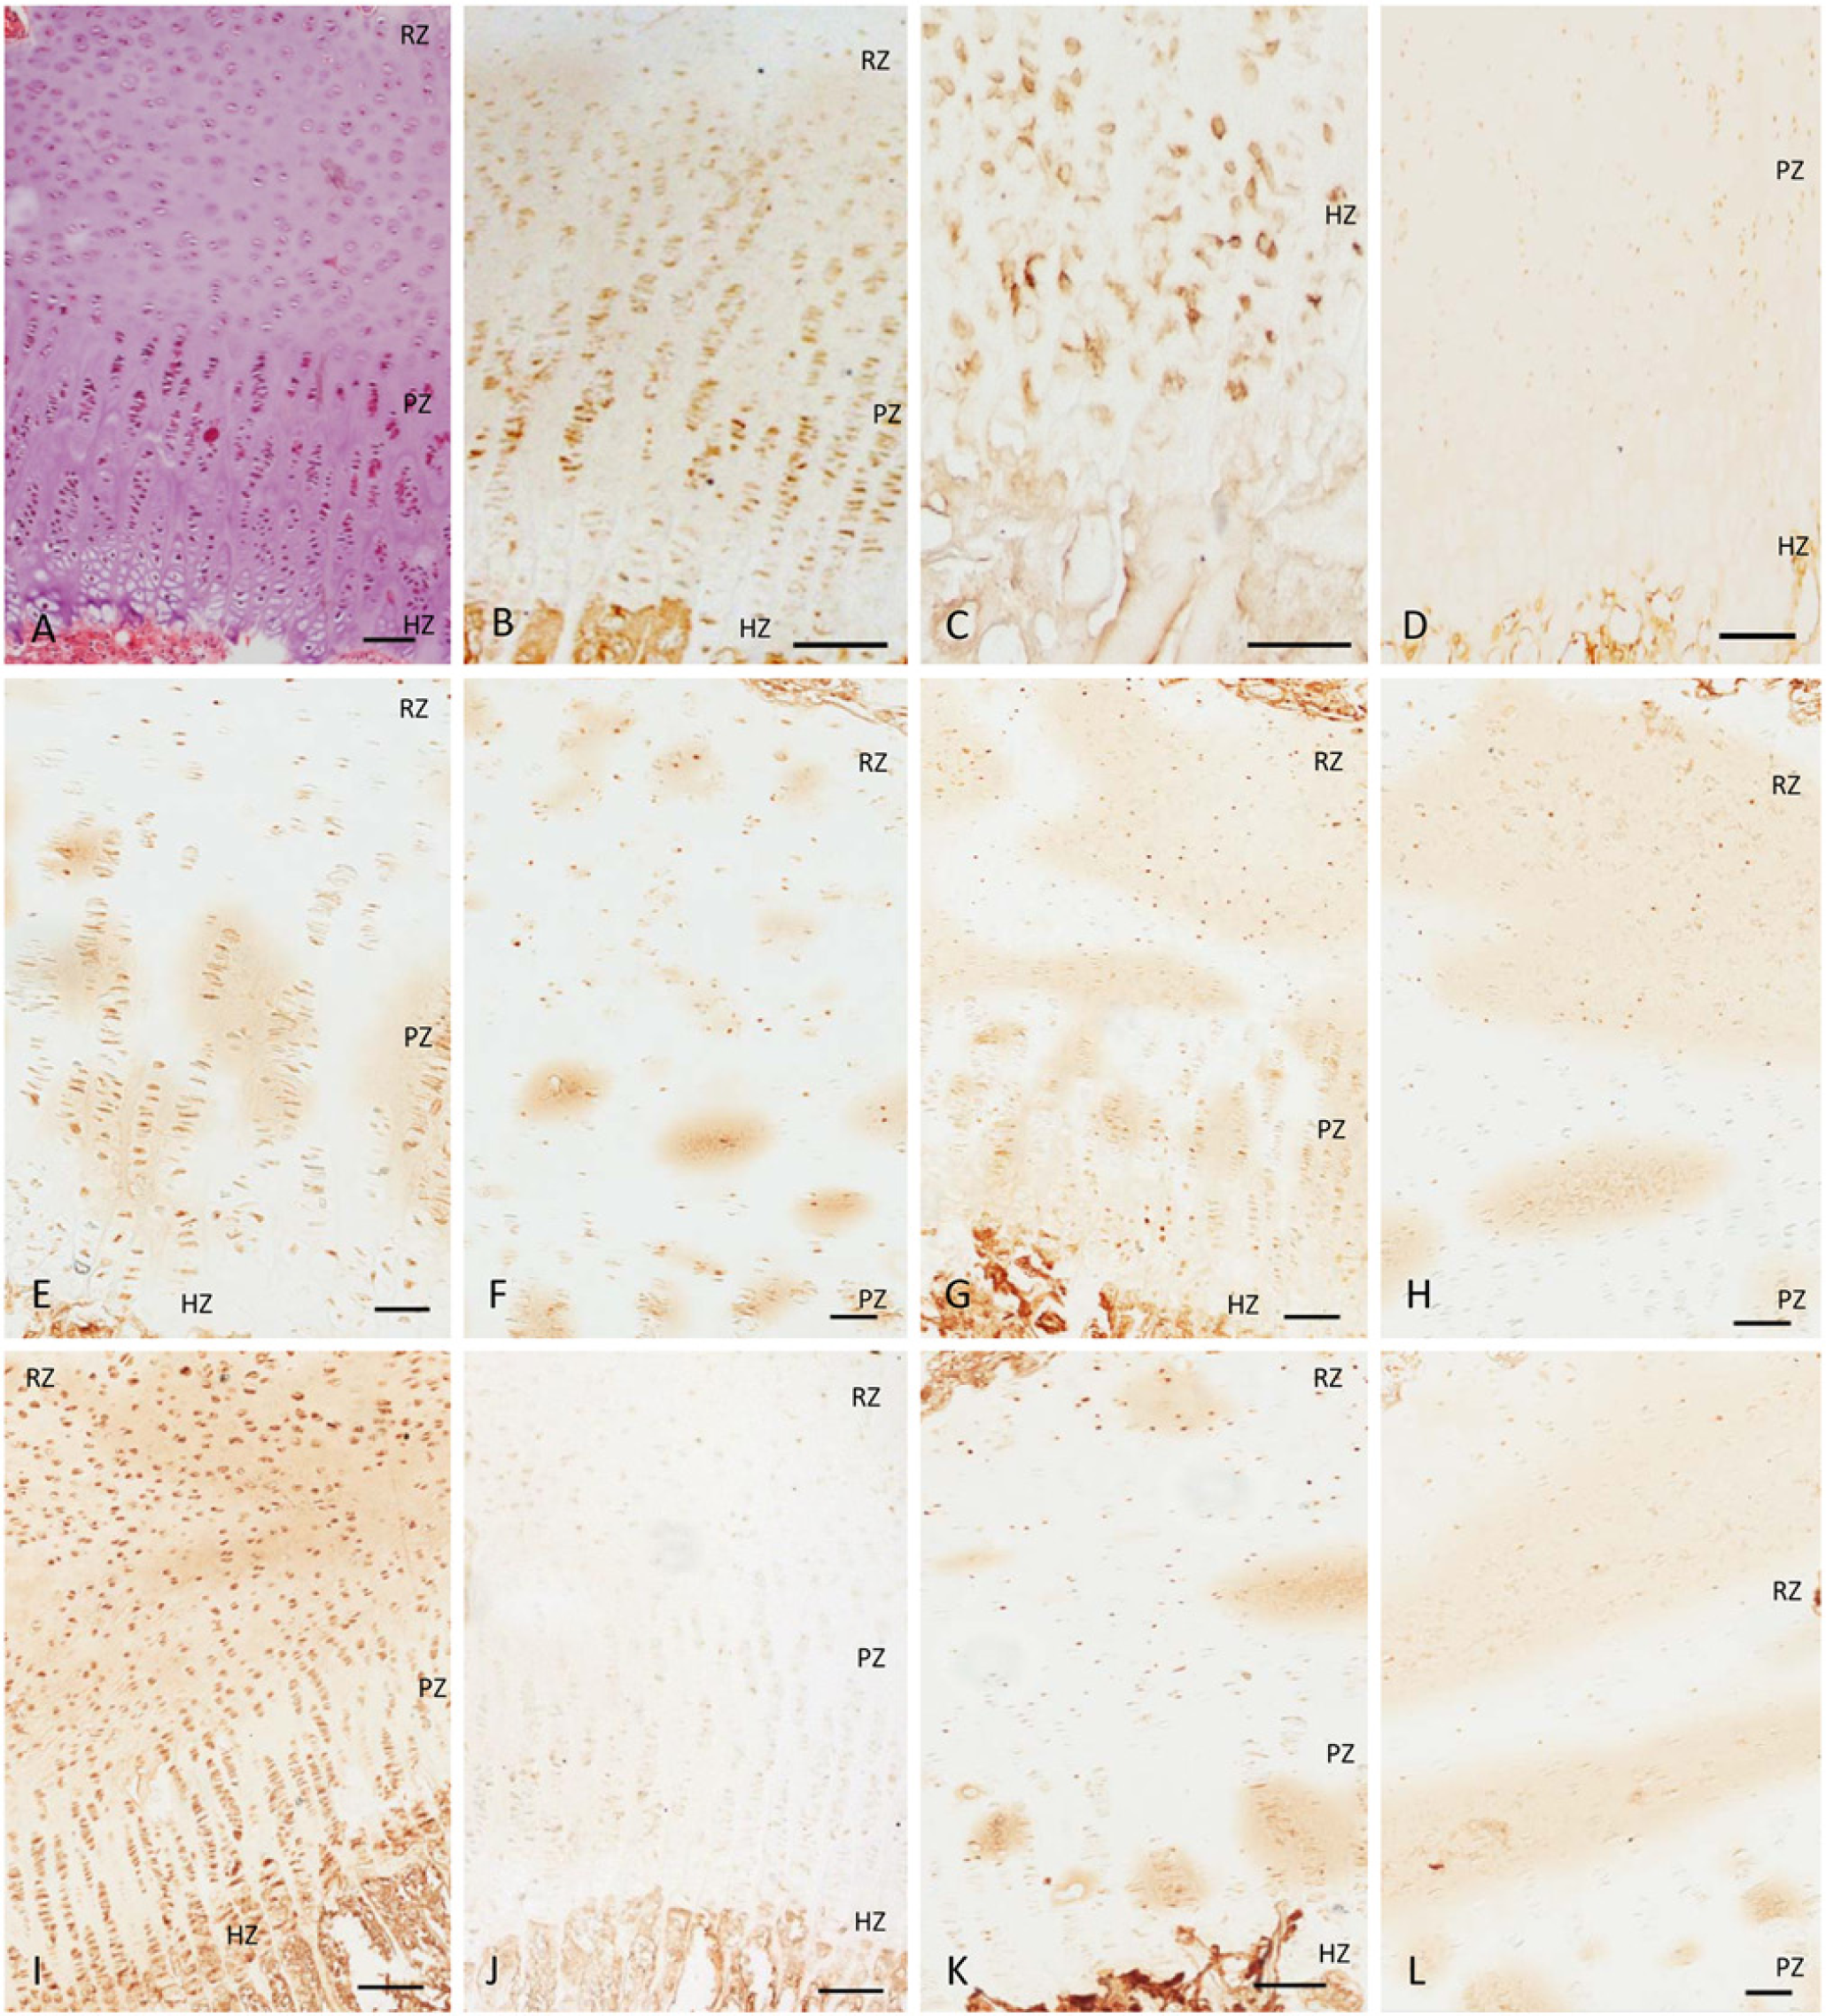
Bovine growth plate. (A) Bovine growth plate shows a normal columnar arrangement of chondrocytes. (B) Type II collagen staining in resting and proliferating zone chondrocytes. (C) Type X collagen in hypertrophic zone chondrocytes. (D) Ki-67 staining in proliferating zone chondrocytes. (E) BMP-2/4 staining in chondrocytes of all zones; cytoplasmic staining is more visible in the proliferating zone. (F) Staining for BMP-6 in resting zone chondrocytes. (G) BMP-7 staining can be observed in all zones of the growth plate; prominent cytoplasmic staining is present in proliferative zone. (H) BMPR-1A staining in resting zone chondrocytes. (I) Staining for BMPR-1B is detected in all zones of the growth plate; strong staining is visible in the resting and hypertrophic zones. (J) Weak BMPR-2 staining in proliferative chondrocytes. (K) Staining for noggin in resting chondrocytes and proliferating chondrocytes. (L) Phosphorylated Smad1/5/8 staining in resting and proliferative zones. RZ, resting zone; PZ, proliferating zone; HZ, hypertrophic zone. Bar = 100 µm.
Articular Cartilage
Bovine articular cartilage demonstrated a typical organization of superficial, middle and deep zones. These zones were distinguishable by cell shape: elongated chondrocytes in the superficial zone and round chondrocytes in the middle and deep zones. Staining for BMP-2/4, BMP-7, BMPR-1A and BMPR-1B was detected in the chondrocytes of all zones (Fig. 4). Weak staining for BMP-6 was observed in the superficial and middle zones (Fig. 4C). Weak staining was observed for BMPR-2 in the deep zone (Fig. 4G). Noggin was observed in all zones of the articular cartilage, with strong staining more visible in the middle zone (Fig. 4H). The detection of p-Smad1/5/8 was rare and weakly observed in the deep zone (Fig. 4I).
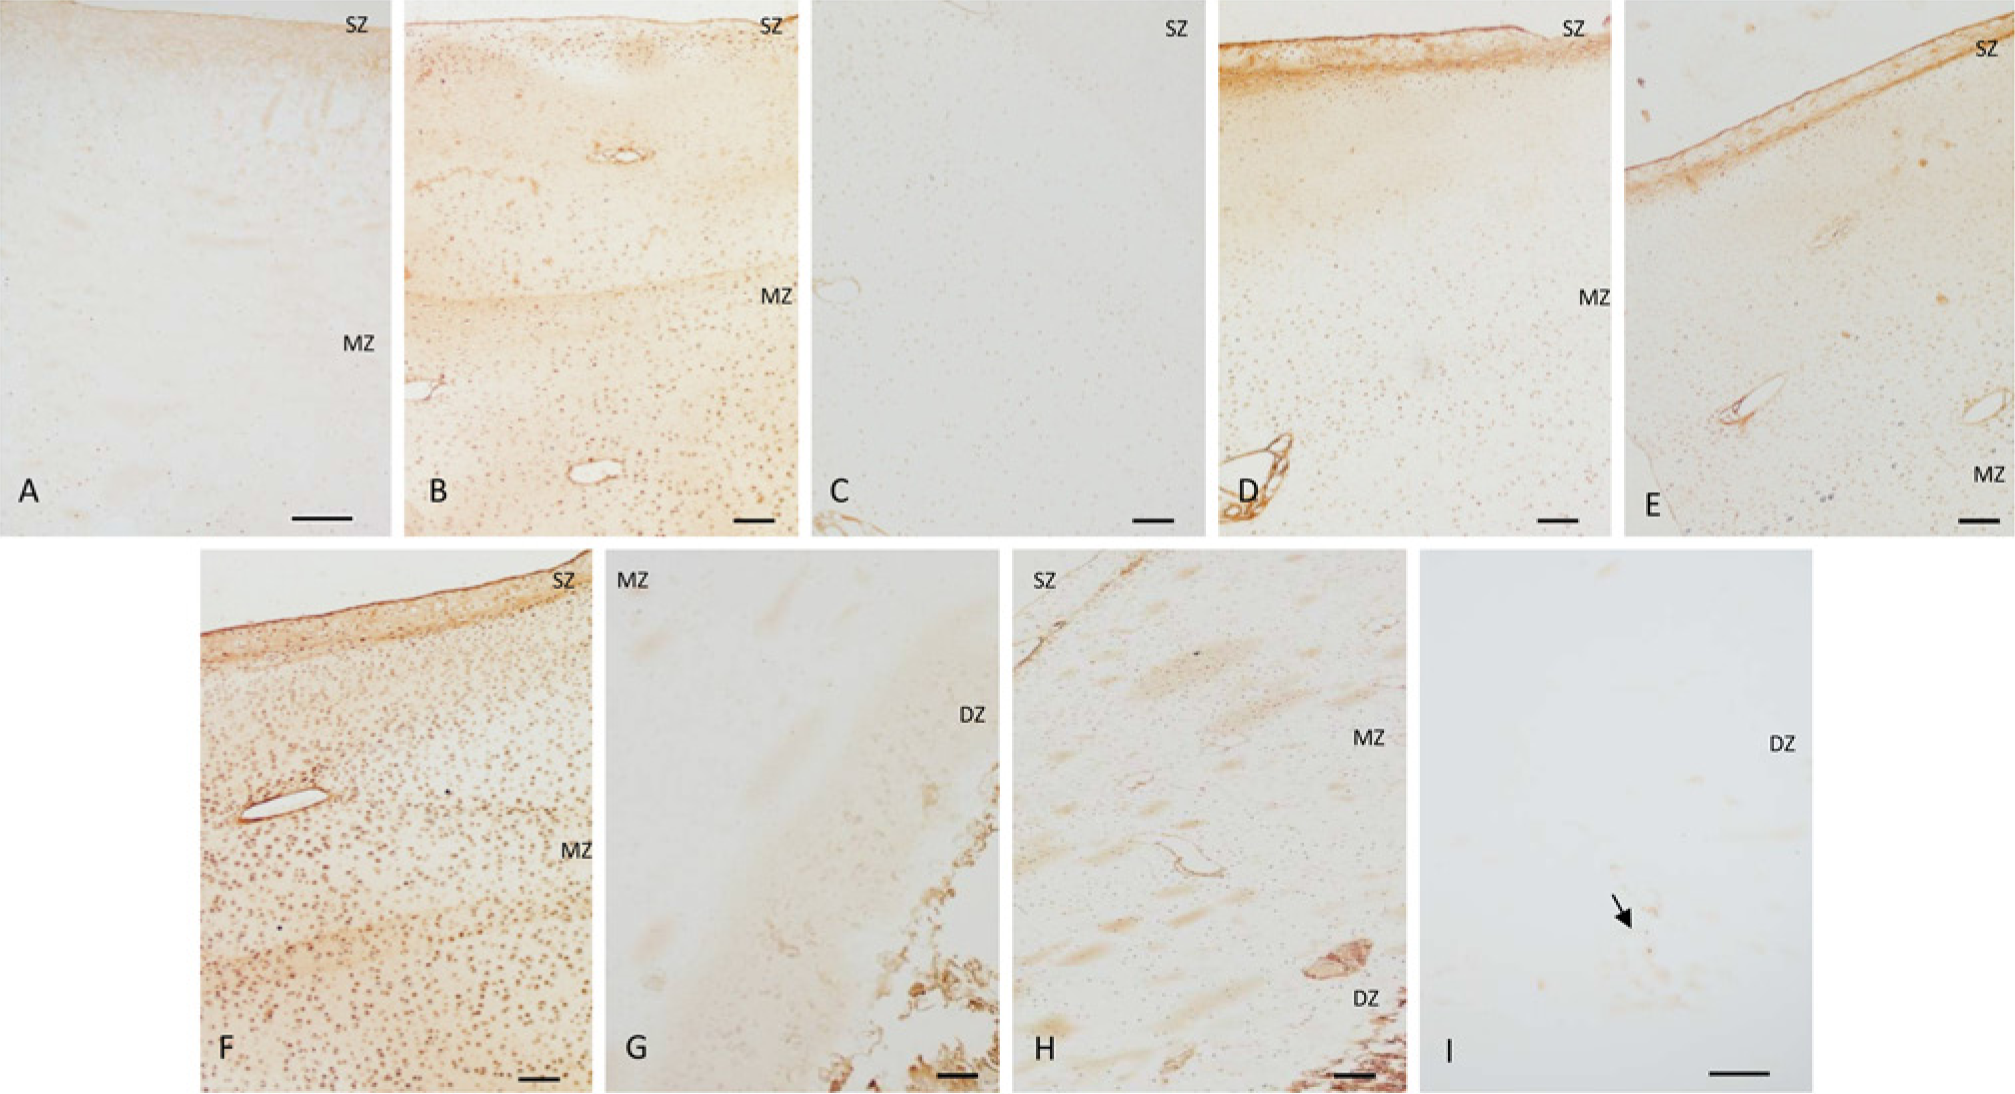
Immunostaining of bovine articular cartilage. (A) Non-immune serum control shows no BMP staining. (B) Cytoplasmic staining for BMP-2/4 can be seen in all zones. (C) Weak staining for BMP-6 in the middle zones. (D-F) BMP-7, BMPR-1A and BMPR-1B, respectively, in all zones of the articular cartilage. (G) Weak BMPR-2 staining in the deep zone. (H) Noggin expression in all zones, with strong staining more visible in the middle zone. (I) Weak staining for phosphorylated Smad1/5/8 was found in the deep zone (arrow). SZ, superficial zone; MZ, middle zone; DZ, deep zone. Bar = 100 µm.
Discussion
Mammalian endochondral ossification depends on controlled proliferation, differentiation and apoptosis of chondrocytes. BMP signaling induces chondrocyte proliferation and delays the differentiation of terminal hypertrophic chondrocytes (Minina et al. 2001). Previous reports have focused on the distribution of BMPs in the mammalian growth plate, a typical model of endochondral ossification. In the growth plate, BMP-2, -4 and -7 are reported in proliferating and hypertrophic chondrocytes and BMP-6 in hypertrophic chondrocytes (Anderson et al. 2000; Nilsson et al. 2007; Yazaki et al. 1998; Sakou et al. 1999; McCullough et al. 2007). Our study found similar staining patterns for BMPs as those reported in previous studies. In addition, we detected BMP-6 in resting and proliferative zone chondrocytes. Others have shown that BMP receptors are found in all zones of the growth plate in slightly different patterns (Nilsson et al. 2007; Sakou et al. 1999). Similarly, we detected BMPR-1B in all zones of the bovine growth plate, with a greater concentration detected in the resting and hypertrophic zones. The detection of BMPR-1A and BMPR-2 was limited to the resting zone and proliferating zone, respectively. The expression of Smad1/5/8 has been reported in proliferating chondrocytes, primarily near the zone of proliferating and hypertrophied chondrocytes in the growth plate (Sakou et al. 1999; Kobayashi et al. 2005). Likewise, the expression of p-Smad1/5/8 in the bovine growth plate has been detected within proliferating and resting chondrocytes. Our study found the distribution of BMPs, BMPRs and their signal transducing proteins in the bovine growth plate to be reasonably similar to that described for other mammalian growth plates reported in the literature, thus ensuring that the bovine growth plate can act as a model of a typical mammalian growth plate and is suitable to be used as a comparison for the cartilaginous cap of osteochondromas.
In this study, we demonstrated the localization and distribution patterns of BMPs and BMPRs in the cartilaginous cap of both SO and MO using immunohistochemistry. Since the cartilaginous cap of human osteochondromas histologically resembles the mammalian growth plate, the distribution and localization pattern comparisons were made between the cartilaginous cap and the bovine growth plate. The present findings showed similarities in the staining patterns for BMP-6 between the cartilaginous cap of human osteochondromas and the growth plate. Besides cytoplasmic staining, we also noted nuclear-like staining in proliferating chondrocytes. In addition, the cartilaginous cap and growth plate shared similar localization patterns for BMP-7, BMPR-1A and BMPR-2. However, BMP-7 appeared to be absent in hypertrophic chondrocytes of the cartilaginous cap of osteochondromas whereas BMPR-2 was also present in calcifying hypertrophic chondrocytes in SO. Although present in all zones of the growth plate, a difference in the staining patterns for BMP-2/4 and BMPR-1B was observed between the cartilaginous cap of human osteochondromas and the growth plate. BMP-2/4 was present in clusters of proliferating chondrocytes in SO whereas cytoplasmic and nuclear-like staining was observed in chondrocytes of MO. Membranous expression of BMPR-1B was found in hypertrophic chondrocytes of SO; yet, the staining in MO was mostly cytoplasmic and nuclear-like in enlarged and proliferating chondrocytes. The expression of BMP-2 and BMP-6 in the layer of hypertrophic chondrocytes stimulates the further differentiation of less-differentiated chondrocytes (Kobayashi et al. 2005). The lack of detectable BMP-2/4 and BMP-6 in hypertrophic chondrocytes of the cartilaginous cap of osteochondromas supports the indication that delayed hypertrophic differentiation may contribute to osteochondroma development, as chondrocytes fail to terminally differentiate.
Studies conducted in mouse models of MHE have shown that conditional ablation of Ext1 in chondrocytes of the growth plate results in the formation of osteochondromas with a mosaic of wild-type and HS-deficient cells (Matsumoto et al. 2010a; Jones et al. 2010). Also, human osteochondroma are a heterogeneous composition of both normal and PG-deficient cells (de Andrea et al. 2011). One possibility for our observations in this study is that HS deficiency endows growth factors (such as BMPs) with the freedom to interact with and act on chondrocytes with less space and time restrictions. Indeed, interference with HS function was recently shown to increase cellular responsiveness to endogenous and exogenous BMPs (Huegel et al. 2013).
To gain insight into the potential alterations to BMP signaling in the cartilaginous cap of human osteochondromas, we assessed the levels of p-Smad1/5/8. In the cartilaginous cap of both MO and SO, p-Smad1/5/8 proteins were mainly localized in proliferating chondrocytes similar to that of the growth plate. Comparing between the cartilaginous cap and the growth plate, we observed no detectable staining for p-Smad1/5/8 in resting chondrocytes but occasional weak staining in hypertrophic chondrocytes of the cartilaginous cap. Postnatal growth is known to influence the degree to which chondrocytes of the growth plate respond to BMP signaling (Dahia et al. 2011). Therefore, it is reasonable to suggest that the growth stage at which our tissue samples were collected could account for the differences in the localization and distribution patterns among the samples. Furthermore, the observed differences in the staining patterns could be attributed to the large amount of matrix present in the MO samples, which caused background staining, as compared with SO and the growth plate samples.
The random dispersion of chondrocytes within the cartilaginous tissue of MO samples also made it challenging to identify the developmental stage of chondrocytes with reference to normal endochondral ossification. For this purpose, we employed type II collagen, Ki-67 and type X collagen staining to classify chondrocyte subtypes in the cartilaginous cap of osteochondromas. Consistent with previous findings (Huch et al. 2002), we found that proliferating chondrocytes stained positively for type II collagen and Ki-67 and were negative for type X collagen; hypertrophic chondrocytes stained negatively for Ki-67 but were positive for type X collagen; and resting chondrocytes stained positively for type II collagen and negative for Ki-67 and type X collagen.
Cartilage fixation usually causes some shrinkage in the tissue between the chondrocyte surface and the lacunar wall (Hunziker et al. 1982). In our staining, the lacunae appeared to be more prominent, and the shrinkage of the cytoplasm made it difficult to decipher properly the details of the cells with a light microscope. For this reason, the chondrocytes give the appearance of a densely stained atypical nucleus within lacunae, which accounts for the nuclear-like BMP staining observed.
BMP-binding proteins, such as noggin, act as extracellular antagonists of BMP signaling by binding directly to BMP and, thus, preventing them from interacting with their cognate receptors on the cell surface. Increased noggin activity results in skeletal dysplasia (Krause et al. 2011). Our study demonstrated a difference in the distribution of noggin in the cartilaginous cap of SO and MO as compared with that of the growth plate. Noggin was observed mainly in resting zone chondrocytes and, to a lesser extent, in proliferative zone chondrocytes of the growth plate. Interestingly, noggin was observed in resting chondrocytes and in few clustered proliferating chondrocytes in the cartilaginous cap of SO, thus demonstrating a similarity between SO tissues and normal growth plate. To our surprise, noggin was observed in proliferating chondrocytes in the MO samples. HSPGs can regulate the distribution of noggin. Noggin has been shown to bind strongly to HSPGs, independent of its action as a BMP antagonist (Paine-Saunders et al. 2002). Thus, HS abnormities associated with osteochondromas could explain the differences observed in noggin distribution.
We also studied the localization and distribution of BMPs and BMPRs in articular cartilage. Earlier studies reported BMP-7 in the superficial zone (Muehleman et al. 2002) and BMP-2, -4, -6 and -7 in the middle zone of articular cartilage (Anderson et al. 2000). BMPR-1B has been reported in the middle and deep zones and, to a lesser extent, in the superficial zone (Muehleman et al. 2002). The expression of Smad1/5/8 has been reported in developing articular cartilage (Pogue and Lyons 2006; Kobayashi et al. 2005). In the present study, BMP-2/4 and -7 and BMPR-1A and -1B were present in all zones of the articular cartilage. BMP-6 and noggin were mainly localized in the middle zone; however, weak staining was observed in the superficial zone. BMPR-2 expression in the deep zone of the articular cartilage was weak, as was p-Smad1/5/8 expression.
In conclusion, we have demonstrated by immunohistochemistry the distribution of BMPs, their receptors and their signal transducing proteins in the cartilaginous cap of solitary and multiple human osteochondromas. We find that the distribution and localization of BMPs and BMPRs in osteochondromas is similar to that which is observed in the normal growth plate. To our knowledge, this represents the first demonstration of BMPs and BMPRs in human osteochondromas. Since BMPs can stimulate the proliferation and hypertrophic differentiation of chondrocytes, these findings suggest that BMP signaling in the cartilaginous cap of osteochondromas may help to maintain cells in a maturing state. Therefore, BMP signaling may be a key mechanism responsible for the abnormal regulation of chondrocyte proliferation and differentiation in the cartilaginous cap of human osteochondromas.
Footnotes
Acknowledgements
We appreciate the assistance of the pediatric orthopedic staff at Shriners Hospital for Children, Northern California.
Declaration of Conflicting Interests
The authors declared no potential conflicts of interest with respect to the research, authorship, and/or publication of this article.
Funding
The authors disclosed receipt of the following financial support for the research, authorship, and/or publication of this article: This work was supported by funds from the Lawrence J. Ellison endowment.