
Abstract
Since being established in 1963, the murine fibroblast cell line NIH 3T3 has been used in thousands of studies. NIH 3T3 immortalized spontaneously and became tetraploid shortly after its establishment. Here we report the first molecular cytogenetic characterization of NIH 3T3 using fluorescence in situ hybridization based multicolor banding (mcb). Overall, a complex rearranged karyotype presenting 16 breakpoints was characterized. Also it was possible to deduce the resulting gains and losses of copy numbers in NIH 3T3. Overall, only 1.8% of the NIH 3T3 genome is disome, 26.2% tri-, 60% tetra-, 10.8% quinta-, and 1.2% hexasome. Strikingly, the cell line gained only 4 derivative chromosomes since its first cytogenetic description in 1989. An attempt to align the observed imbalances of the studied cell line with their homologous regions in humans gave the following surprising result: NIH 3T3 shows imbalances as typically seen in human solid cancers of ectodermal origin.
Keywords
The murine cell line NIH 3T3 has been used as a model system in a multitude of different studies since its first description in 1963. It was established from Mus musculus f. domenstica (“Swiss mouse”) embryo fibroblasts. The cells, which immortalized spontaneously, were designated “3T3” according to “
In their original article Todaro and Green (1963) report that NIH 3T3 evolved within the first 25 cell-transfers from a diploid to a tetraploid cell line. However, detailed analysis of the karyotype was never really done (Hoque et al. 2006) besides a GTG-banding analysis in 1989 (Kasid et al. 1989). Later on, only a few specific molecular cytogenetic aspects were also studied (Denko et al. 1994; Pittoggi et al. 1999; Gilbert and Allan 2001; Guenatri et al. 2004).
Even though more advanced approaches for the analysis of murine karyotypes have since become available, NIH 3T3 was never studied in more detail either by multicolor fluorescence in situ hybridization (FISH) using whole chromosome painting (wcp) probes, or FISH banding-approaches (for review of FISH approaches available for mouse chromosomes, see Liehr 2012). As FISH approaches using murine wcp probes are limited when the exact localization of chromosomal breakpoints is required, a previously reported, more sensitive approach to murine FISH banding, the murine multicolor banding (mcb) (Trifonov et al. 2005; Karst et al. 2006; Trifonov et al. 2010), was established for all murine chromosomes.
Here we present the first genome-wide high resolution characterization of a murine cell line by mcb. As NIH 3T3 has been used in thousands of published studies (http://www.ncbi.nlm.nih.gov/pubmed), its molecular cytogenetic characterization seems to be overdue.
Materials and Methods
NIH 3T3
The cell line NIH 3T3 was cultured in RPMI 1640 media, and cytogenetically worked up according to standard procedures. Chromosome preparation was also performed according to standard protocols.
Molecular Cytogenetics
FISH was done as previously reported using human MCB probe sets (Liehr et al. 2002). Murine mcb probe sets for chromosomes 1, 3, 6, 18, 19, and X were established earlier (Trifonov et al. 2005; Karst et al. 2006; Trifonov et al. 2010). The mcb probe sets for all other chromosomes were established as previously reported for human MCB probes (Liehr et al. 2002) with one major modification: glass needle-based chromosome microdissection was performed after the corresponding homologous murine chromosomes of interest were stained by wcp probes. That is, single-color-based FISH microdissection (Weimer et al. 2000) was performed in order to distinguish the acrocentric murine chromosomes. The applied 123 murine mcb probe sets, their localization and labeling scheme are depicted in Fig. 1. Each mcb probe set was applied separately and at least 25 metaphases were individually evaluated (for details on MCB/mcb evaluation, see Liehr et al. 2002).
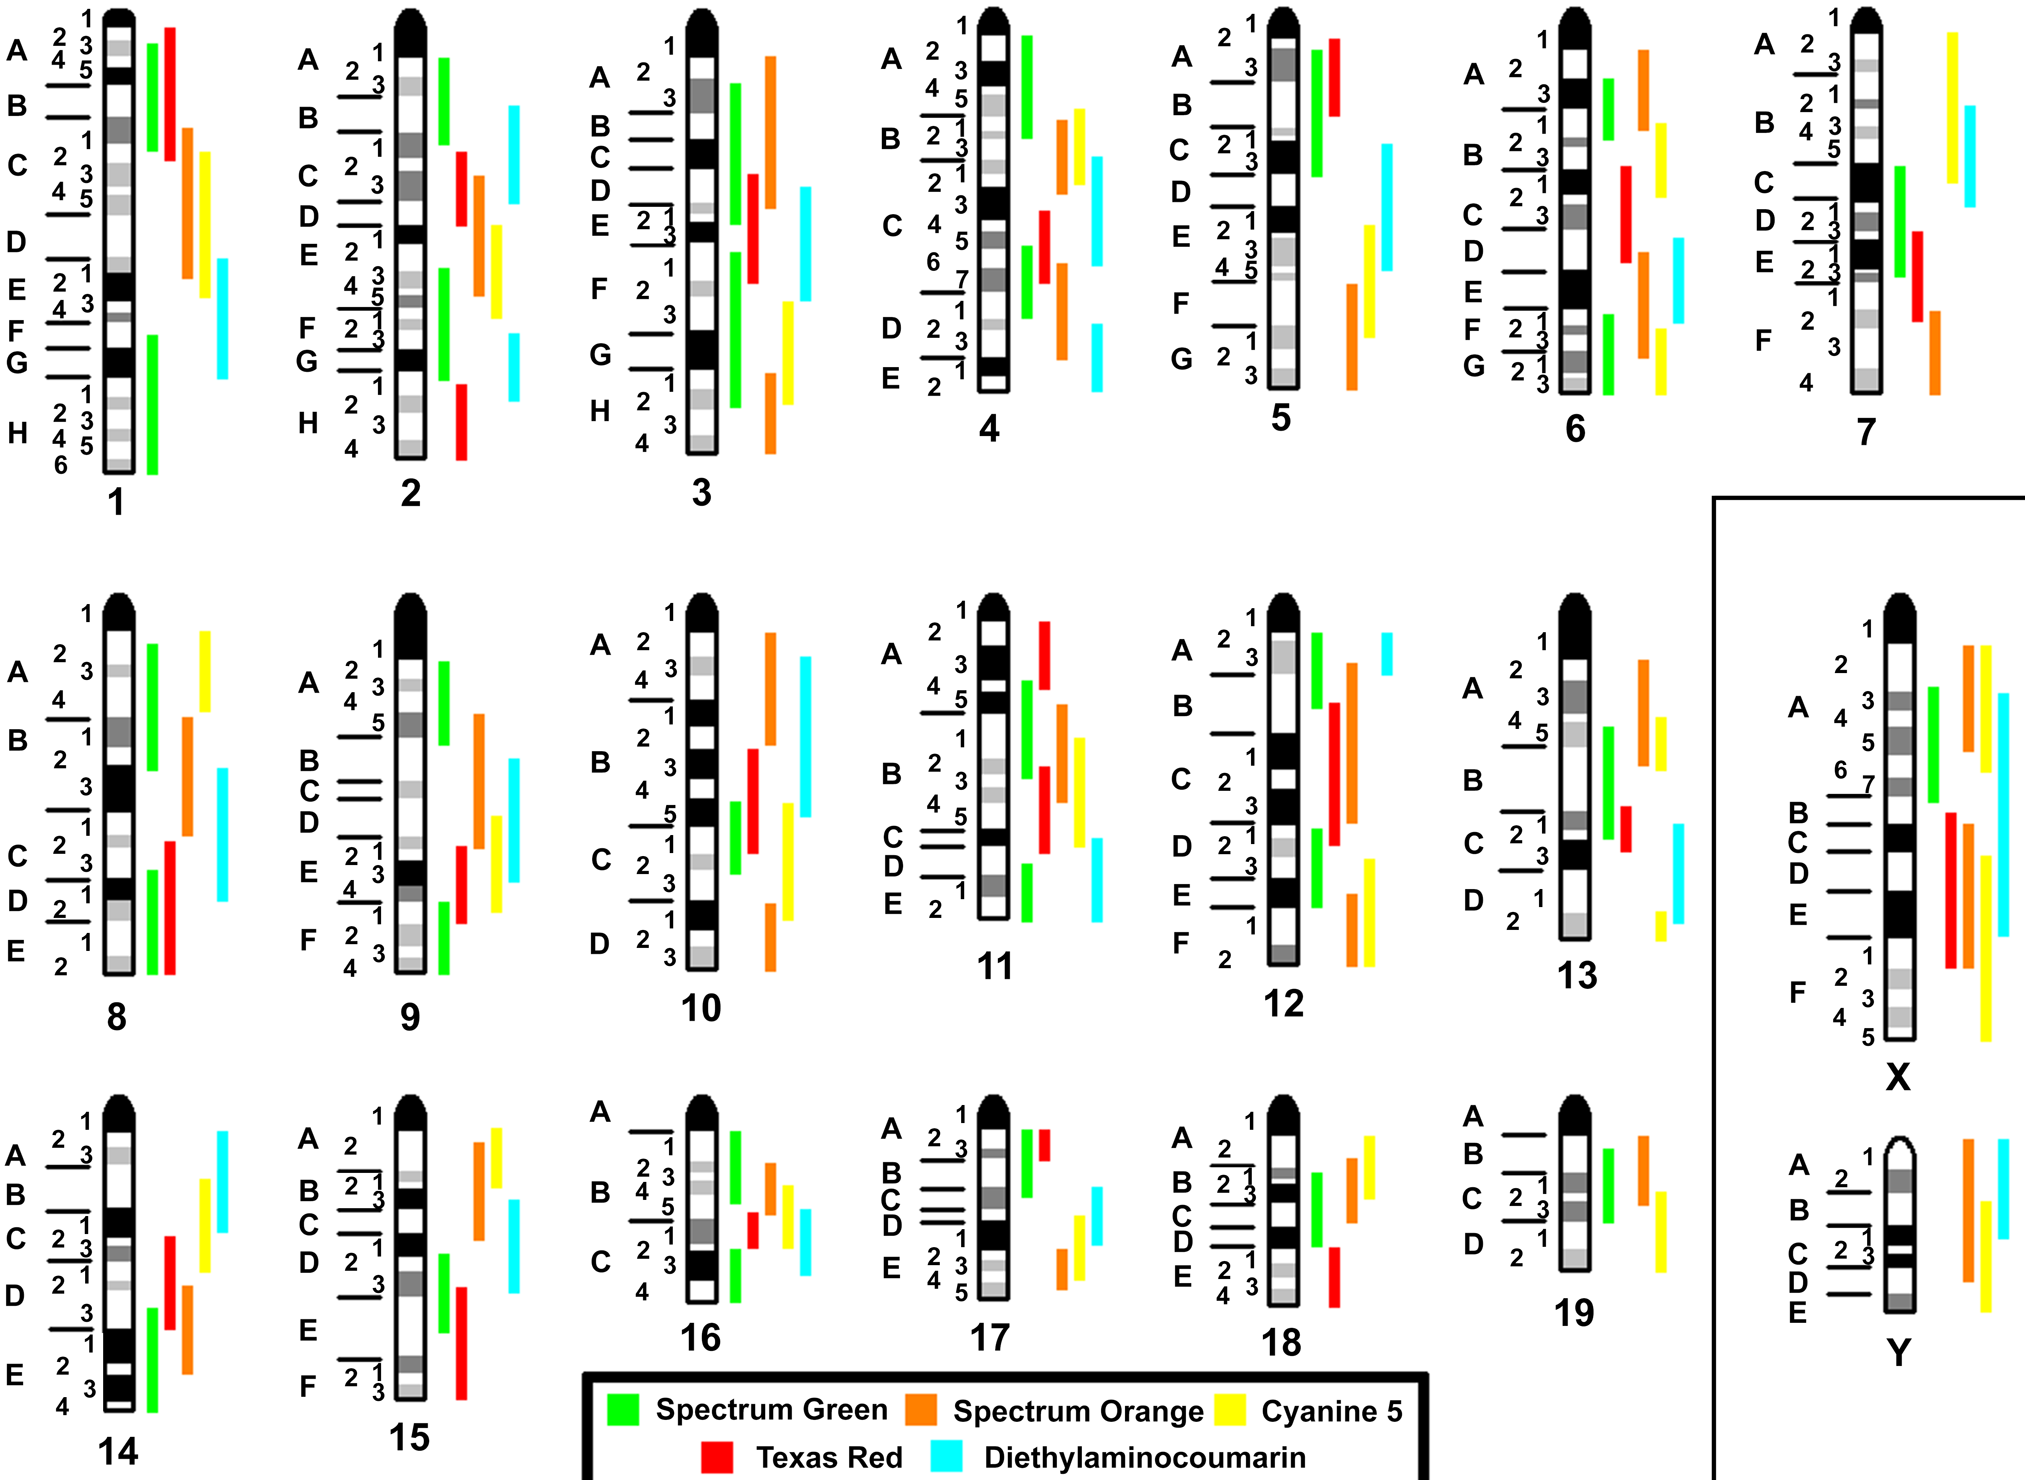
Localization and labeling scheme for the 123 microdissection-derived, region-specific libraries covering the entire murine karyotype. The used fluorochromes are depicted in different colors as explained in the legend at the bottom. The autosomes are depicted consecutively; the sex chromosomes are shown on the left side of the figure.
Data Analysis
The regions of imbalances present in NIH 3T3 were aligned with their human homologous regions using Ensembl and the UCSC Genome Browsers (http://www.ensembl.org/Mus_musculus/Location/Synteny; http://genome.ucsc.edu). That is, for example, the mcb analysis revealed a 2-fold gain in murine chromosome 4 subbands C3 to C7. The latter region is homologous to three regions in human chromosomes 1 and 9; that is, 1p36.33 to 1p36.31, 1p32.1 to 1p31.1 and 9p24.2 to 9p21.2. The corresponding alignments are summarized in Supplementary Tables 1 and 2.
An alignment with previously detected genomic imbalances in human cancer was done using the review of Gebhart and Liehr (2000). Results are summarized in Supplementary Tables 1 and 2, Fig. 5, and Table 1.
Gross Imbalances Larger than One Cytoband as Detected in NIH 3T3
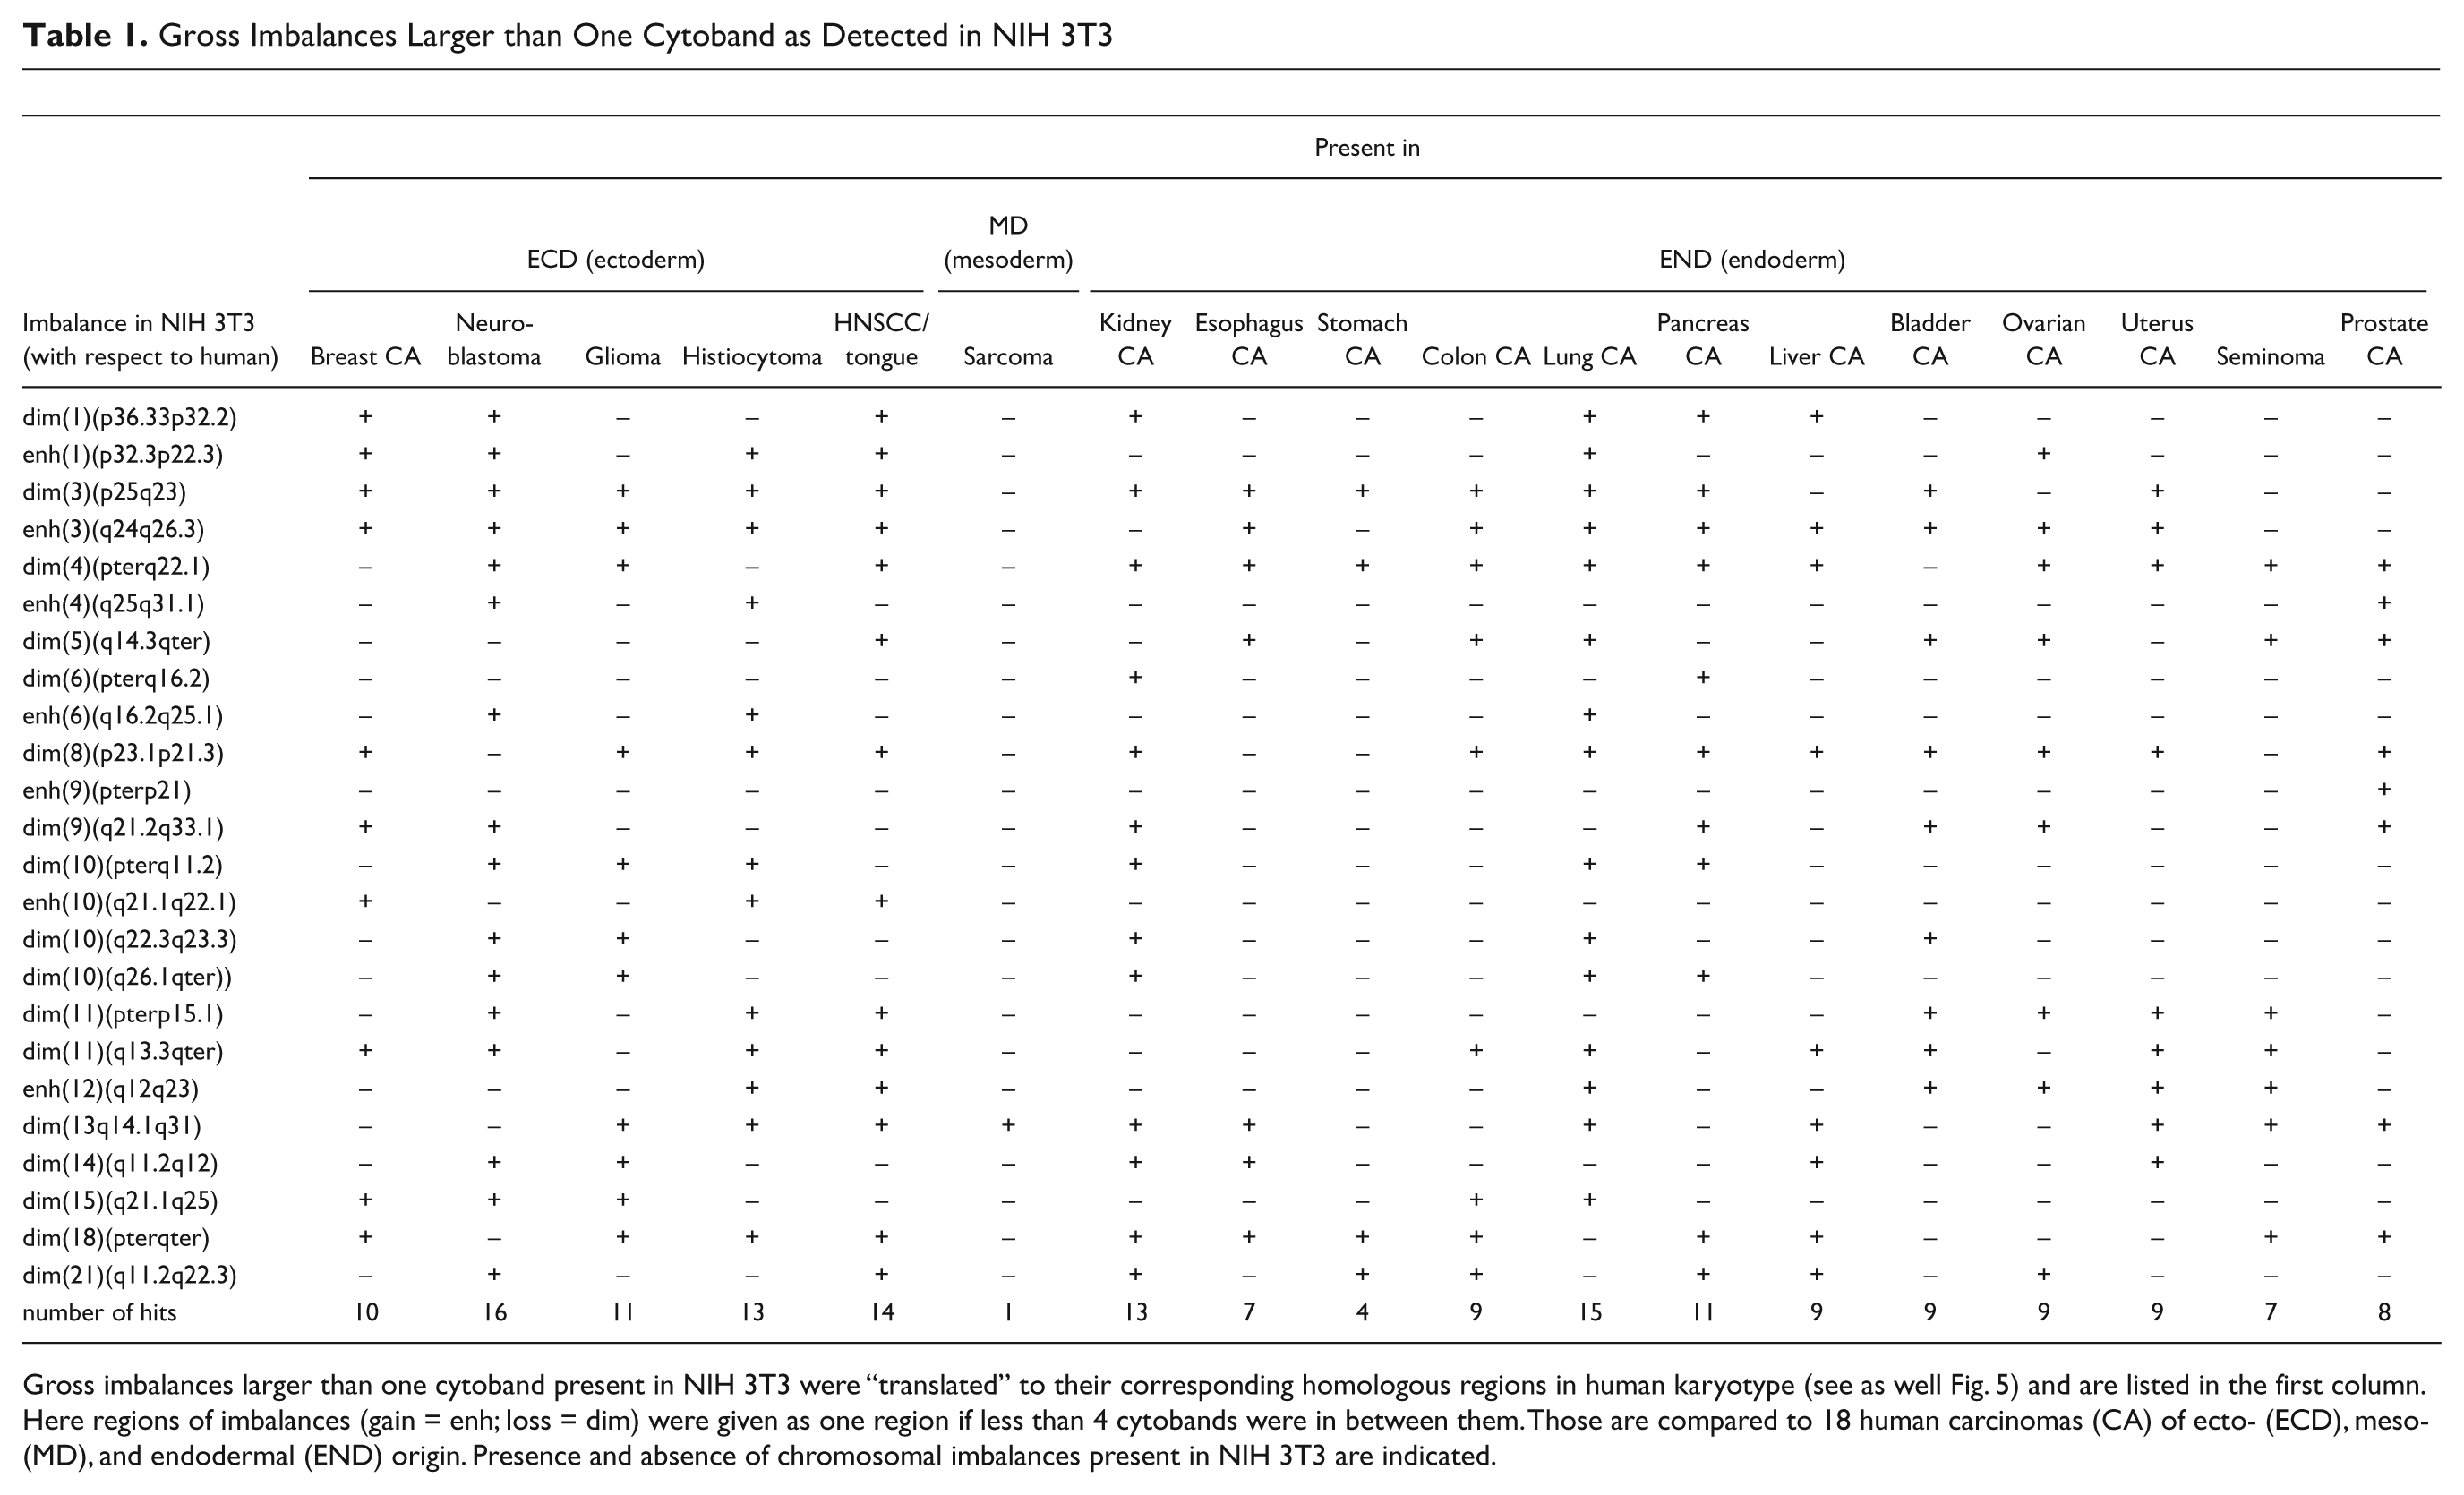
Gross imbalances larger than one cytoband present in NIH 3T3 were “translated” to their corresponding homologous regions in human karyotype (see as well Fig. 5) and are listed in the first column. Here regions of imbalances (gain = enh; loss = dim) were given as one region if less than 4 cytobands were in between them. Those are compared to 18 human carcinomas (CA) of ecto- (ECD), meso- (MD), and endodermal (END) origin. Presence and absence of chromosomal imbalances present in NIH 3T3 are indicated.
Results
Here we present the first comprehensive high resolution characterization of the murine NIH3T3 cell line using all 21 chromosome-specific murine mcb probe sets. In all, 52 to 82 chromosomes were present in the studied NIH3T3 cell line; the majority of the ~550 studied cells had between 70 and 78 chromosomes. The most frequently observed chromosomal constitution is summarized in Fig. 2, as present in ~75% of the studied cells. Numerous single cell aberrations were observed, including a predominant loss or gain of individual chromosomes and, in fewer than 5% of the studied cells, unique structural rearrangements, which are not reported here in detail.
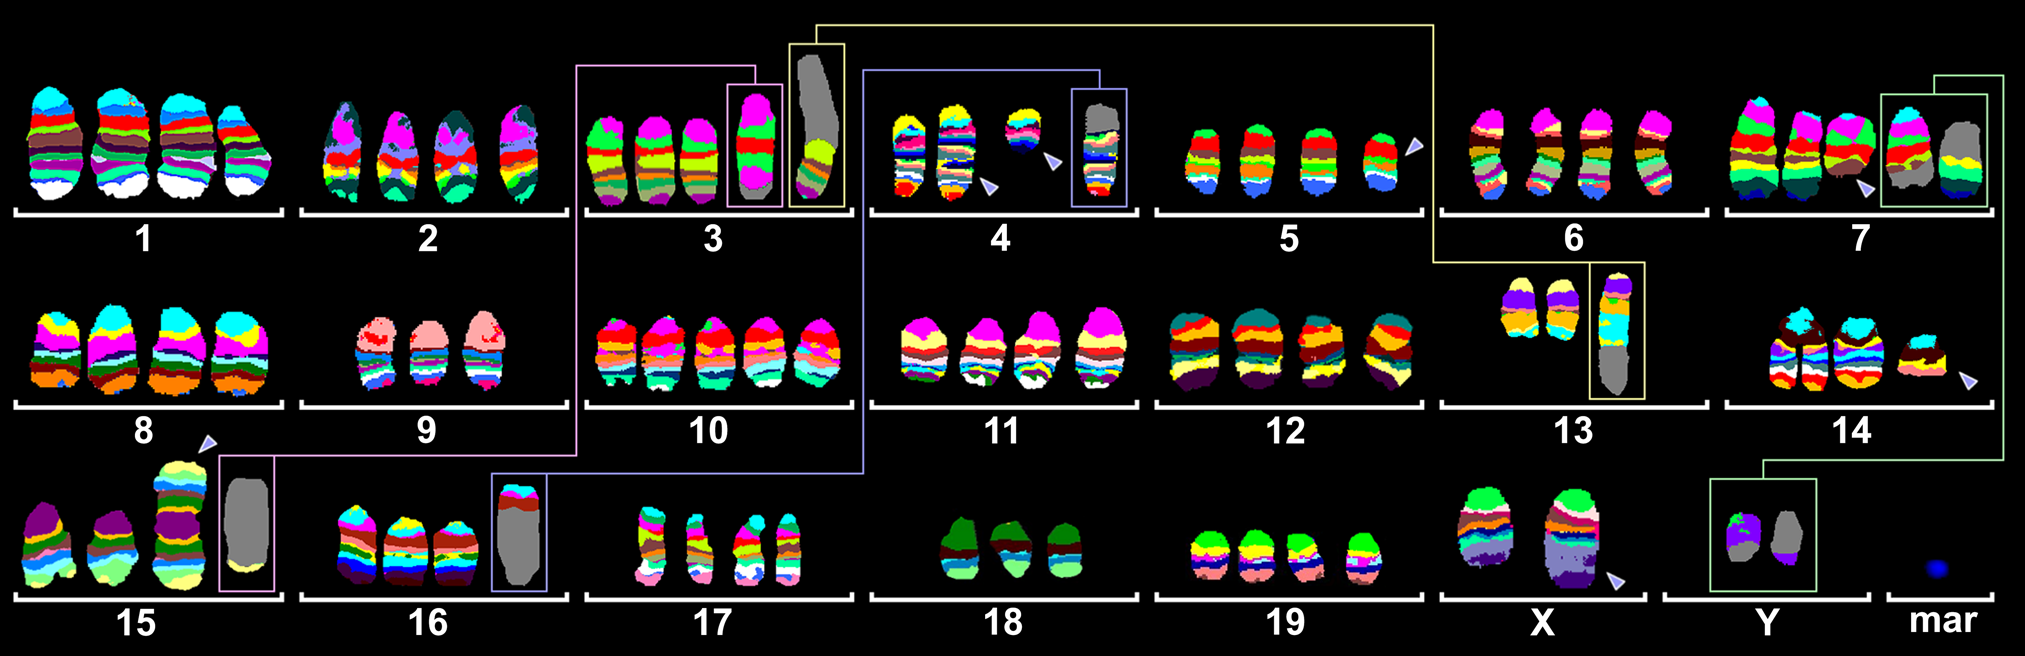
Murine multicolor banding (mcb) was applied on chromosomes of the near tetraploid NIH 3T3 cell line. Typical pseudocolor banding for all 21 different murine chromosomes are shown. This figure summarizes the results for all 21 chromosome-specific FISH experiments. There are five derivative chromosomes consisting of two different chromosomes each. These are highlighted by frames and shown twice in this summarizing karyogram; e.g., the pinkish-framed derivative chromosome 3 contains material derived from #3 and #15; thus, it is shown with the other (derivative) chromosomes 3 and 15, and both depictions are connected by a line. Other derivative chromosomes showing aberrant mcb banding patterns are highlighted by arrowheads. Also, one marker chromosome (mar) remained after all FISH experiments, which did not specifically stain using any of the mcb probe sets; this is most likely material derived from any of the 21 chromosomes from band A1, that is, a del(?)(A1). The detailed karyotype according to mcb is given in the Results section.
Overall 16 breakpoints were determined: XF5, XE, YC3, 3A1, 3E2, 4C3, 4C7, 5B, 5C, 7E3, 13D2, 13C3, 14D2, 15A1, 15F2, and 16B2~B3. Otherwise unclear structural rearrangements, such as balanced and unbalanced translocations, inverted duplications, deletions, or complex rearrangements, could be resolved using mcb. The basic karyotype of NIH 3T3 can be described as
75,X,der(X)(XA1->XF5::XE->Xqter),der(Y)t(Y;7)(C3;E3),-Y,der(3)t(3;15)(3A1->3E2::3E2->3A1::15F2->15qter),-4,del(4)(C3),der(4)(A1->C7::C3->qter),del(5)(BC),del(7)(E3),der(7)t(Y;7)(C3;E3),-9,+10,-13,der(13)t(13;3)(13A1->13D2::13C3->13D2::3E2->3qter),-14,del(14)(D2),-15,der(15;15)(A1;A1),der(16)t(4;16)(16A1->16B2~B3::4C3->4C7::4C3->4qter),-18,+del(?)(A1).
The resulting chromosomal imbalances, which can be deduced quite elegantly from the mcb results, are summarized in Fig. 3. According to this depiction, 1.8% of the NIH 3T3 genome is disome, 26.2% tri-, 60% tetra-, 10.8% quinta-, and 1.2% hexasome.
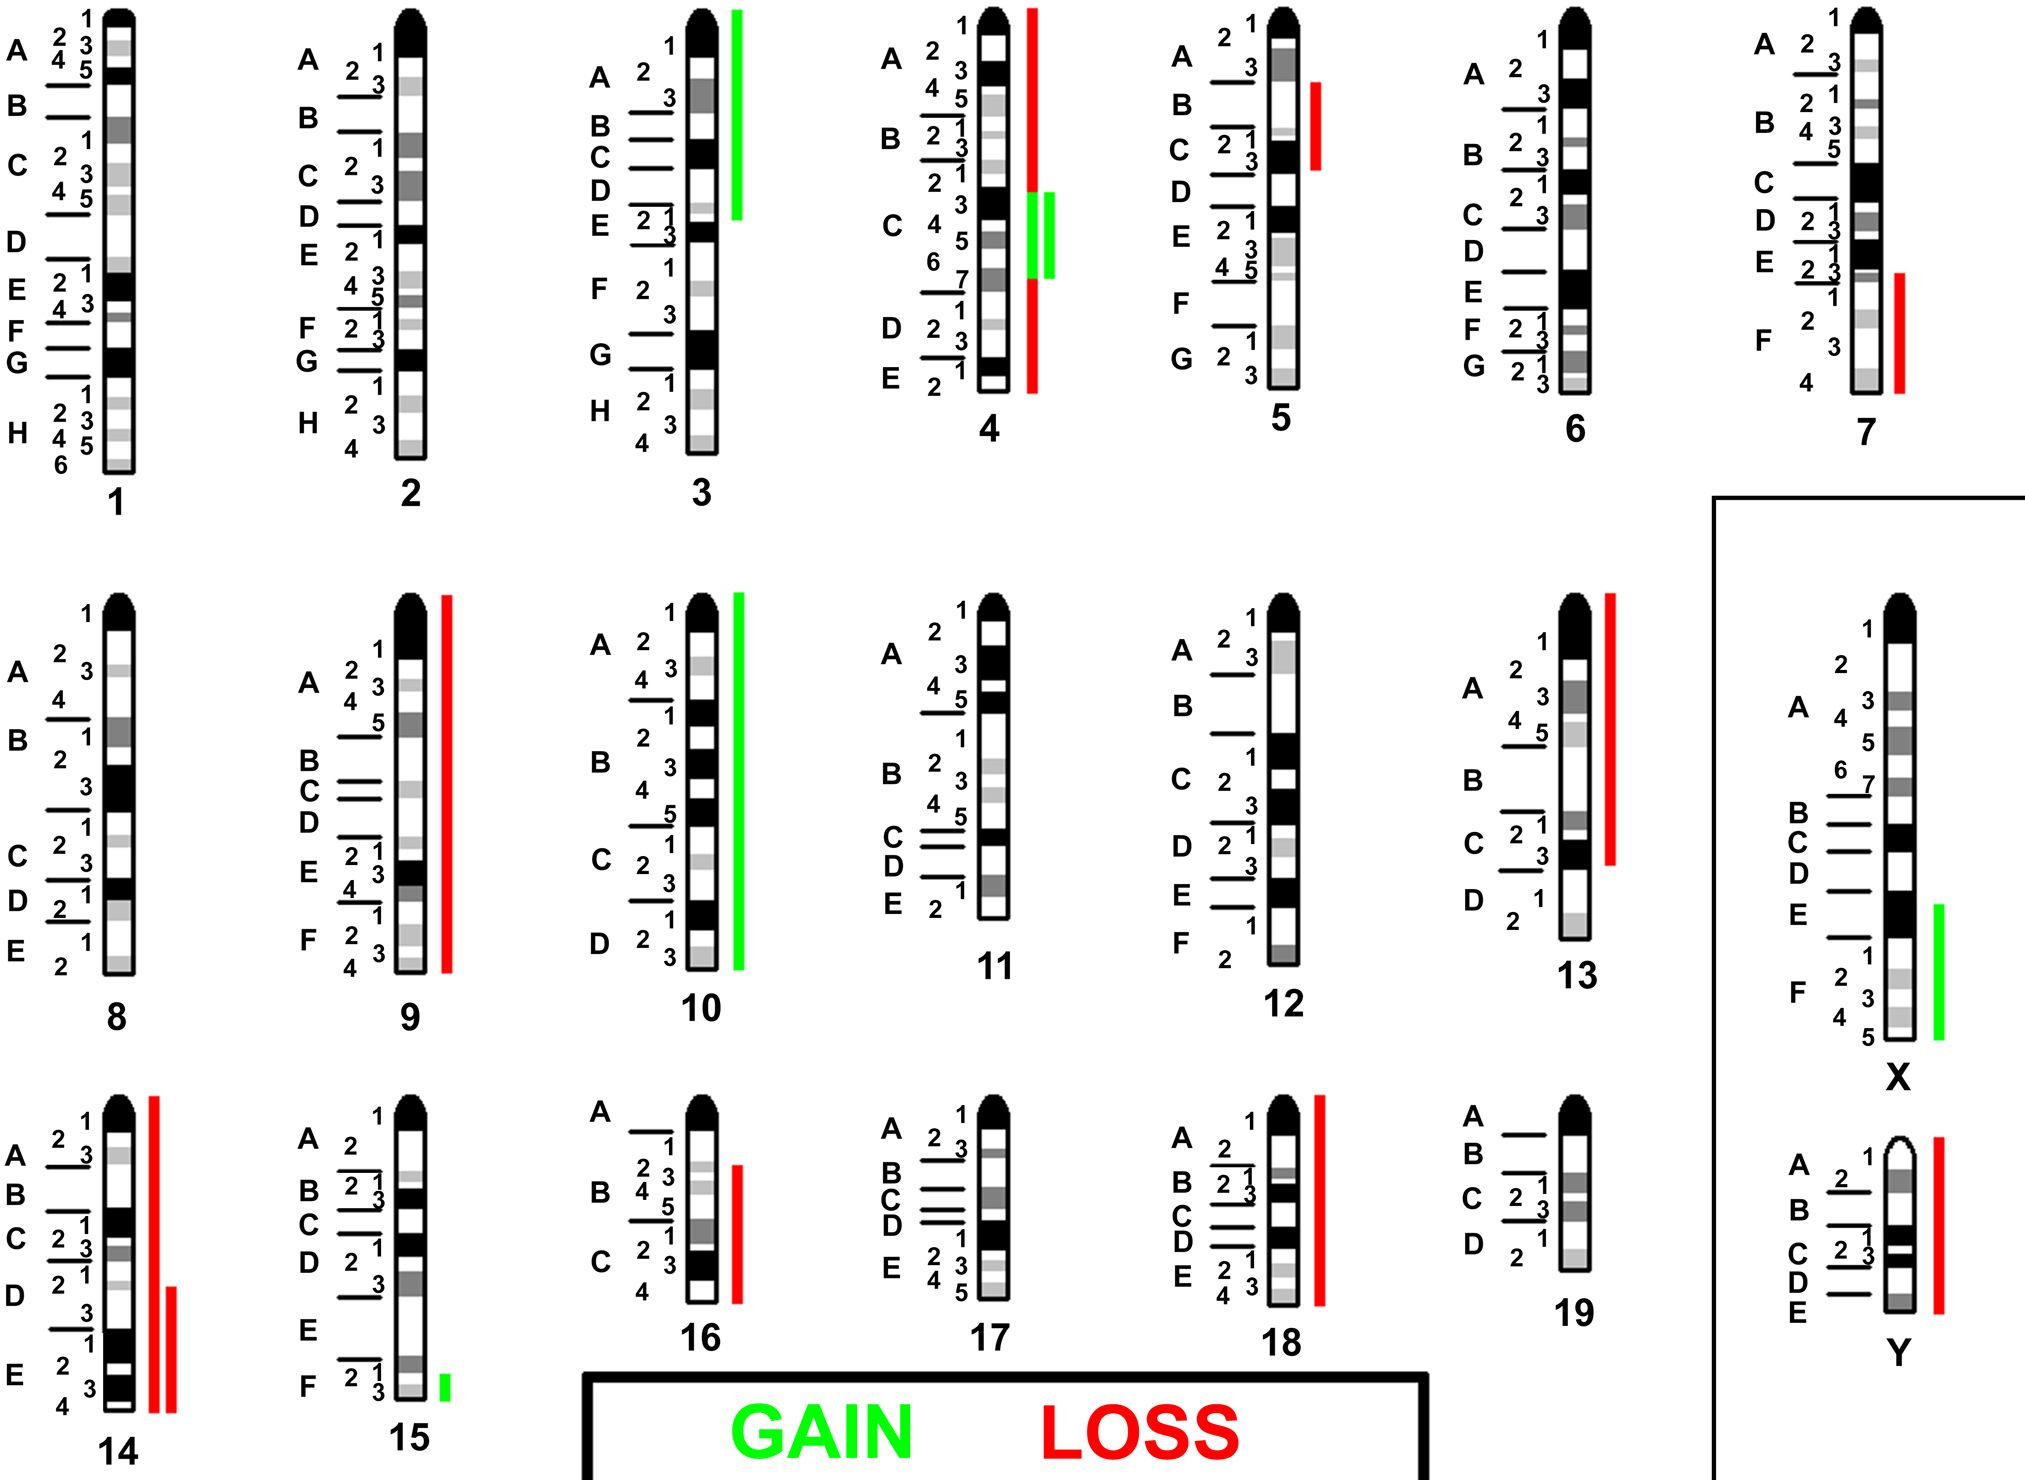
Imbalances present in NIH 3T3 are summarized with respect to a tetraploid basic karyotype. Gains are depicted as green bars, losses as red bars. If there was a 2-fold gain or loss, this is indicated by a double bar.
Overall, the NIH 3T3 cell line was relatively homogeneous. There were only two distinguishable clonal aberrations, one dicentric inv dup(6)(C3) and one monocentric inv dup(16)(A1) present in 10% and 16%, respectively, of the cells scored (Fig. 4).
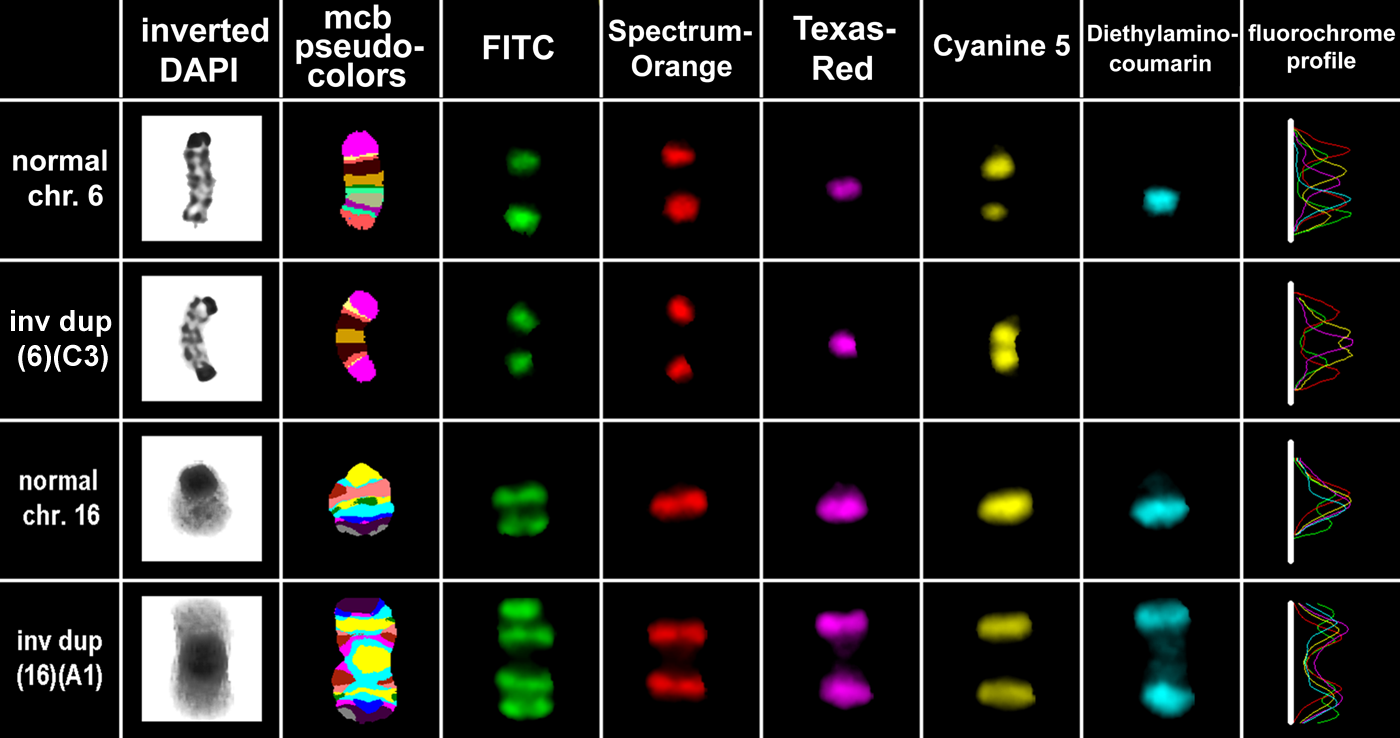
In 10% of the NIH 3T3 cell lines, one chromosome 6 was replaced by a dicentric inv dup(6)(C3); similarly, in 16%, instead of one chromosome 16 there was a monocentric inv dup(16)(A1). These two derivatives are shown here together with one of their corresponding unaltered homologous chromosomes, each. In the eight columns, there are different depictions of the (derivative) chromosomes: inverted 4′,6-diamidino-2-phenylindole (DAPI) banding shows the often low quality of banding cytogenetics in murine chromosomes. The mcb results are shown as pseudo-color depiction in the second column; the following five columns show the separate color channels of the five applied fluorochromes and the patterns of hybridization they achieve. The last column is summarizing the results obtained with five previous columns as fluorochrome profiles. The latter can be translated to the pseudocolor bands by the Isis digital FISH imaging system (MetaSystems, Altlussheim, Germany) as shown in the second column and in Fig. 2.
Based on the results in Fig. 3, the imbalances of NIH 3T3 were aligned with their homologous regions in human (Supplementary Tables 1 and 2) and compared to human cancers of different embryonic origin. The highest concordance was found with cancers of ectodermal followed by endodermal and then mesodermal origins (having 13.4, 9.2, and 1 imbalances in common with NIH 3T3, respectively).
Discussion
The molecular cytogenetic analysis of the cell line NIH 3T3 revealed a near-tetraploid karyotype with 75 chromosomes. Interestingly, the karyotype from the current study is similar to that reported by Kasid et al. in 1989. They characterized 6 unidentified marker chromosomes, which are most likely der(16)t(4;16)(16A1->16B2~B3::4C3->4C7::4C3->4qter) = M1, del(4)(C3) = M2, der(4)(A1->C7::C3->qter) = M3, del(?)(A1) = M4 and der(Y)t(Y;7)(C3;E3) and der(7)t(Y;7)(C3;E3), the latter being reported as “unassigned chromosomes” (= UAS). The main differences in the present results from those of Kasid et al. (1989) were newly acquired der(3)t(3;15) and der(13)t(3;13), two additional chromosomes 10, an additional der(14), and the fusion of two chromosomes 15 to an isochromosome 15. Besides imbalances (see below), one balanced rearrangement, the der(15;15)(A1;A1), and a heterochromatic derivative chromosome, the del(?)(A1), could be comprehensively characterized.
The recent ability to comprehensively resolve a murine karyotype using mcb has been used very successfully in the present study. The applicability of mcb to murine cell lines (Trifonov et al. 2005; Karst et al. 2006) as well as different species of Rhodentia (Trifonov et al. 2010; Graphodatsky et al. 2011) will lead to new karyotypic insights for both in vitro and in vivo systems.
As the murine mcb technique is based on the same principles as the human MCB approach, the resolution is similar, at about 5–10 Mb (Weise et al. 2008). Therefore, the presence of additional, smaller chromosomal alterations or even epigenetic alterations cannot be excluded in NIH 3T3.
Even though the primary goal of this mcb study was to delineate the karyotype, mcb results could be used to depict chromosomal gains and losses in NIH 3T3 (Fig. 3), as in comparative genomic hybridization (CGH) (Kallioniemi et al. 1992). This has not been done before for cell lines, but it is conceivable because imbalances detected by MCB in human patients have been confirmed by array-CGH, demonstrating the transferability of data from both approaches (Liehr et al. 2006; Aktas et al. 2010). Thus, 28% of the NIH 3T3 genome had loss and 12% gain of copy numbers. The imbalances present in the studied murine cell line were “translated” to the corresponding homologous imbalances in the genomes of human cancers (Supplementary Tables 1 and 2, Fig. 5). Interestingly, the highest rate of concordance was observable in solid tumors derived from ectodermal origin (Table 1). This might be indicative of the fact that NIH 3T3 is derived from murine fibroblasts (Todaro and Green 1963). Fibroblasts are thought of as having both a mesodermal and ectodermal origin (Rieske et al. 2005).
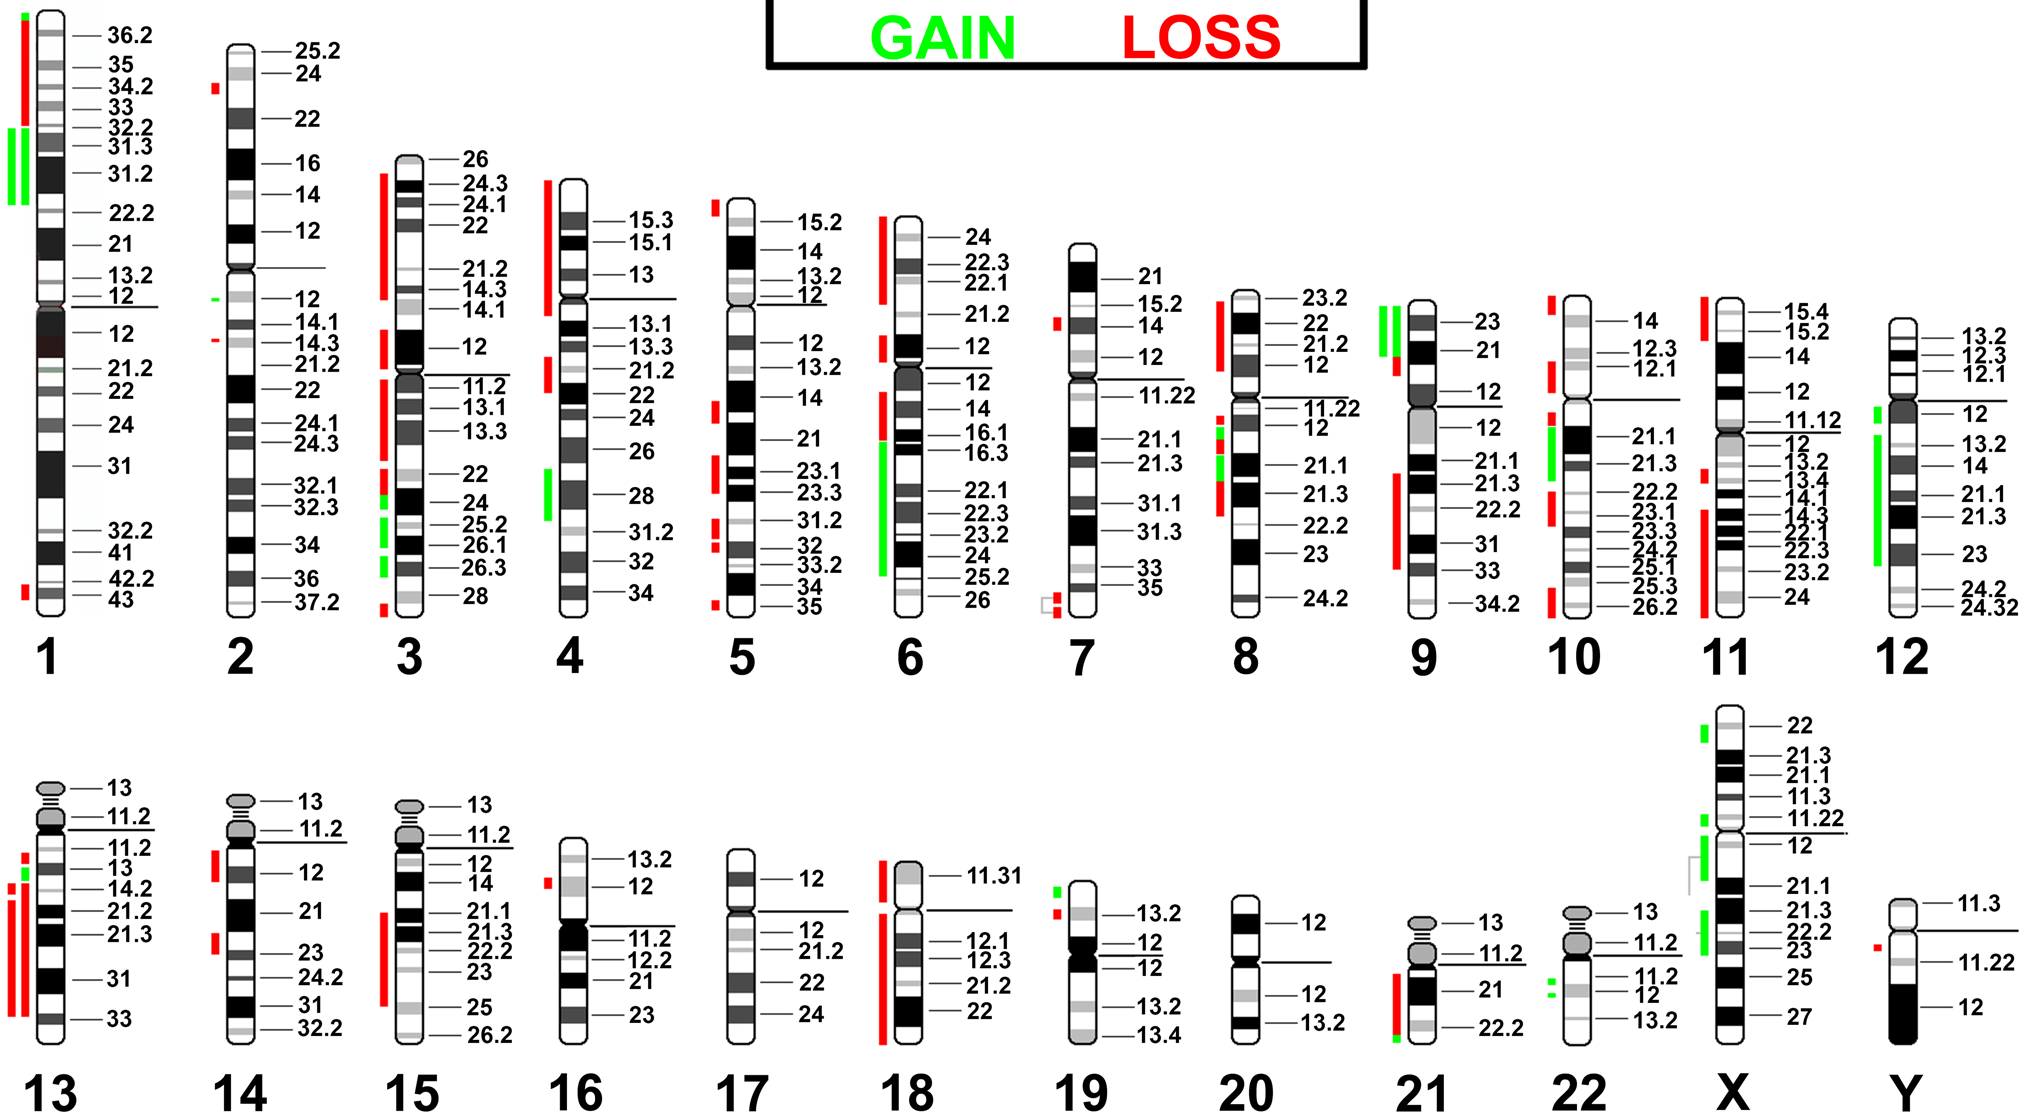
Imbalances present in NIH 3T3 (Fig. 3) are “translated” to the corresponding homologous regions in human. With respect to a basic tetraploid karyotype, gains are depicted as green bars, losses as red bars. If there was a 2-fold gain or loss, this is indicated by a double bar. If the region of imbalance could not be homologized conclusively, the two possible regions are given and connected by gray lines.
The similarities in the genetic imbalances between immortalized mouse cell lines and human solid tumors of ectodermal origin could reflect their increased growth characteristics. These particular genetic alterations might therefore provide some information on the mechanism of both tumorigenesis and spontaneous transformation as has occurred in NIH 3T3.
Footnotes
Declaration of Conflicting Interests
The author(s) declared no potential conflicts of interest with respect to the research, authorship, and/or publication of this article.
Funding
The author(s) disclosed receipt of the following financial support for the research, authorship, and/or publication of this article: Supported by the DFG (LI 820/17-1, 436 RUS 17/49/02, 436 RUS 17/135/03, 436 RUS 17/48/05, LI 820/19-1).
References
Supplementary Material
Please find the following supplemental material available below.
For Open Access articles published under a Creative Commons License, all supplemental material carries the same license as the article it is associated with.
For non-Open Access articles published, all supplemental material carries a non-exclusive license, and permission requests for re-use of supplemental material or any part of supplemental material shall be sent directly to the copyright owner as specified in the copyright notice associated with the article.