
Abstract
We demonstrate that the
Signal amplification systems are widely used in immunohistochemistry to improve epitope detection. The signal can be amplified in various ways. The signal is detected either via an enzyme-substrate step or through binding to a fluorochrome-conjugated reporter molecule (Speel et al. 1992; Dirks et al. 1990). The application of avidin-biotin systems (Guesdon et al. 1979) for detection and amplification of in situ hybridization signals has become widespread (McQuaid and Allan 1992; Pinkel et al. 1986). Increase in background staining, loss of morphology, and less target localization are disadvantages that may be encountered with these methods.
The catalyzed reporter deposition (CARD) method utilizes biotin-labeled probes that are detected by streptavidin conjugated to HRP. The hybridized probe is visualized by the enzyme-mediated deposition of a fluorochrome-conjugated reporter molecule (Chao et al. 1996; Adams 1992; Bobrow 1989).
Application of the CARD method as a posthybridization amplification system for increasing the sensitivity of FISH has recently been described (Kerstens et al. 1995). To accomplish amplification of the FISH signals, Kerstens et al. performed the ABC (HRP) method (Hsu et al. 1981), followed by enzymatic deposition of biotinylated tyramine. The biotin source thus created is detected with fluorochrome- or enzyme-labeled avidin. This procedure involves five steps.
We report a method that combines amplification and visualization in one step (Figure 1). The biotinylated probe is detected with HRP-labeled avidin. Amplification and visualization are accomplished by enzymatic deposition of the novel fluorescent HRP substrate Cy3.29-tyramide. Cy3.29-tyramide is a bright fluorescent substrate of high photostability and water solubility (Chao et al. 1996).
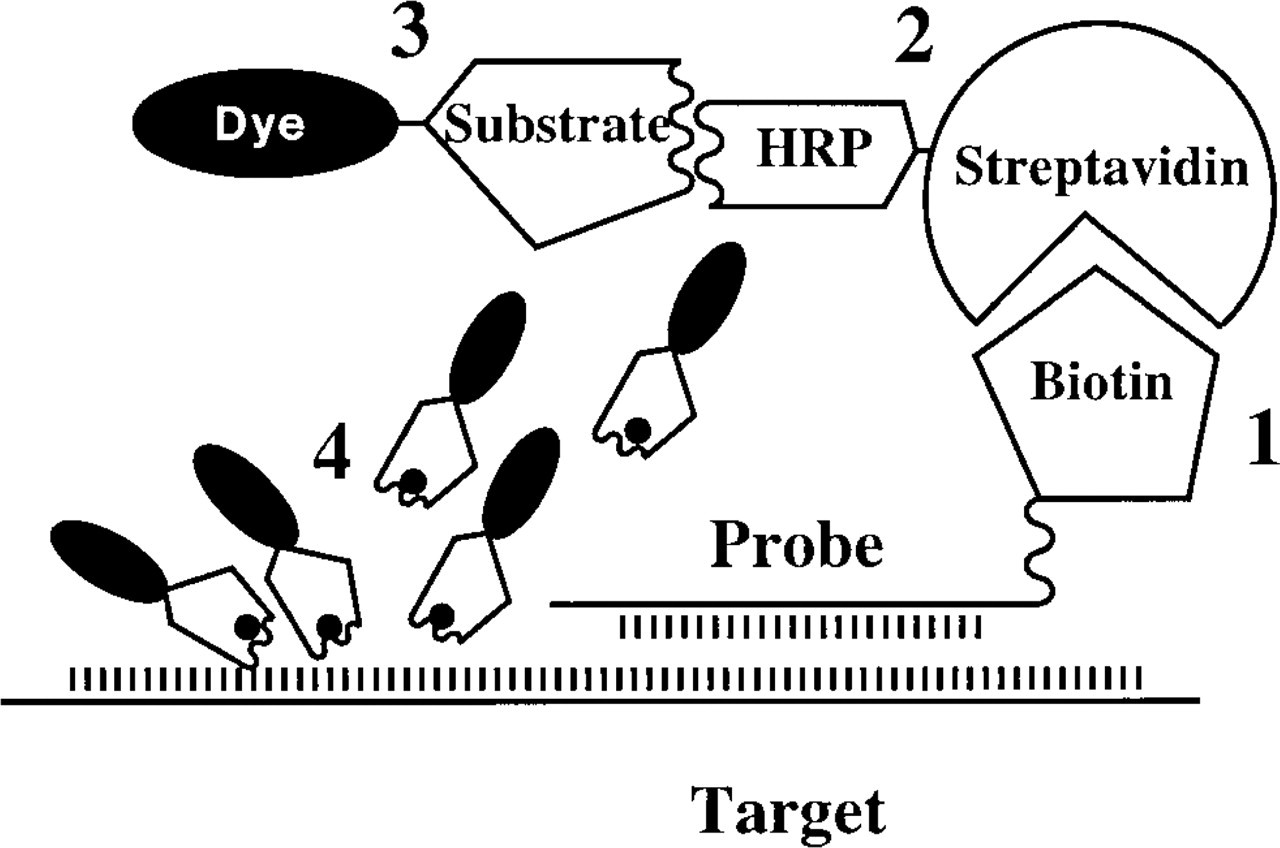
Schematic representation of the CARD-FISH technique. The DNA or RNA probe is (1) detected with a biotinylated probe. (2) HRP-labeled streptavidin is added, followed by (3) the fluorescent HRP substrate Cy3.29-tyramide. HRP reaction with Cy3.29-tyramide results in its deposition in the vicinity of the target (4).
Materials and Methods
RNA Extraction of S-phase HeLa S3 Cells
HeLa S3 cells were grown in DMEM (GIBCO; Grand Island, NY) with 6% calf serum to 50% confluence in 150-ml flasks (Falcon). The cells were washed three times with DMEM, blocked for 12 hr in 2 mM thymidine in DMEM, then released in DMEM with 6% calf serum for 9.5 hr. The cells were then blocked again with thymidine for 12 hr, washed three times with DMEM, and incubated for 5 hr in growth medium. The synchronized S-phase cells were collected after three washes with ice-cold PBS.
The cell pellets were stored at —70C or immediately processed for RNA extraction. The cell pellets were resuspended in ice-cold NP-40 lysis buffer (0.6% NP-40, 150 mM NaCl, 10 mM Tris, pH 7.4, 1 mM EDTA). This solution was vortexed for 10 sec and stored on ice for 5 min. The lysate was layered with 24% (w/v) of sucrose in lysis buffer and pelleted for 10 min in a micro centrifuge (Marathon; Fisher Scientific, Pittsburgh, PA). The turbid cytoplasmic extract remained above the sucrose cushion, while the nuclei and unlysed cells formed a pellet. The cytoplasmic extract was removed with a sterile Pasteur pipette, mixed with an equal volume of 2 X PK buffer (2 X protease K buffer: 300 mM NaCl, 2 X SDS, 200 mM Tris, pH 7.5, and 25 mM EDTA), and digested with proteinase K (200 μg/ml final concentration) (Sigma; St Louis, MO) for 30 min at 37C. The mixture was twice extracted with buffered, distilled phenol that had been equilibrated with 300 mM sodium acetate. The RNA was precipitated at −70C after addition of 2.5 volumes of 95% ethanol, and the RNA pellets were stored at −70C.
Metaphase Chromosome Preparation from HeLa S3 Cells
HeLa S3 cells were grown to 70% confluence in 150-ml tissue culture flasks in DMEM and 10% calf serum. Mitotic block was achieved by addition of medium containing 0.05 μg/ml colcemid (Sigma) for 2 hr at 37C. The mitotic cells were collected by vigorous agitation of the flask and decanting the loosened cells. The remaining cells were scraped from the flask with a rubber policeman for the interphase nuclei. The cells were centrifuged at 1000 rpm for 8 min (Beckman TJ-6 centrifuge, rotor 541G). The cells were swollen in 75 mM of KCl for 22 min at 37C. The KCl solution was added to the cells dropwise. The cells were centrifuged at 1000 rpm for 8 min and fixed in methanol-acetic acid solution (3:1). The cells were then collected by centrifugation. This process was repeated twice. The cell suspensions were added to cleaned microscope slides and dried overnight at 25C.
Interphase Chromosome Preparation from Human Corneal Fibroblast Cells
Human corneal fibroblast metaphase nuclei were prepared analogously to the procedure for the preparation of HeLa S3 metaphase nuclei.
Cell Fixation
HeLa S3 cells were grown in DMEM medium (10% calf serum, 37C) on coverslips in 35-mm cell culture plates to 70% confluence. The cells were washed twice with HBSS and then fixed for 15 min at 25C in 2% paraformaldehyde-PBS with 5 mM MgCl2. After fixation, the cells were washed twice with PBS and then stored in PBS with 5 mM MgCl2 at 4C.
Dot-blot Analysis
Nytran plus membrane (No.78086; Schleicher & Schuell, Keene, NH) was cut in circles by a hole puncher and placed in the wells of sterile 96-well microplates (Falcon). The membrane was wetted with H2O and 15 X SSC buffer. The buffer was then aspirated from the wells. The RNA extracts of S-phase HeLa S3 cells were dissolved in 60 μl of formaldehyde-SSC buffer (6.15 M formamide-10 X SSC) to reach a final RNA concentration of 10 μg/ml and were denatured at 65C for 5 min. Each membrane was spotted with 1 μl of RNA solution and soaked for 30 min at room temperature (RT). RNA crosslinking to the membrane was achieved via UV irradiation.
The RNA was prehybridized for 2 hr at 42C in hybridization buffer (50% deionized formamide, 5 X SSC, 1 X FPG, 25 mM potassium phosphate, 0.2% SDS, 25 μg/ml carrier DNA, and 5% dextran sulfate).
The nine biotinylated histone 4 (H4) probes (see below) were combined in water to give a total concentration of 27 μg. Serial fivefold dilutions in hybridization buffer were prepared, starting with 5 μl probe mixture plus 45 μl hybridization buffer. The H4 probe mixtures were denatured at 100C for 2 min and cooled to 0C. The probes were then added to the membrane-crosslinked RNA after aspirating excess hybridization buffer from the wells. The hybridization step was performed at 42C with gentle shaking for 18 hr. The supernatant was aspirated and membranes were washed twice (15 min per wash) with 0.1 SSC-0.1% SDS washing buffer at 55–65C. The membranes were further washed with 2 X SSC for 10 min at 25C, followed by two washes with 4 X SSC-0.005% Tween-20 for 10 min at 25C. The washing buffer was removed and 6% BSA in 4 X SSC-0.05% Tween was added for 1 hr at 37C for blocking, and then removed.
For the non-amplified control, 50 μl of a 300-μg/ml solution of streptavidin-Cy3 (Amersham Life Science, Arlington Heights, IL; cat. no. PA43001) in 10% BSA-4 X SSC-0.05% Tween-20 was added. For the CARD-amplified membranes, 50 μl of 1.5 U/ml either neutralite avidin-HRP or streptavidin-HRP in 10% BSA-4 X SSC-0.05% Tween-20 was added. The membranes were then incubated for 1 hr at 25C and washed four times with PBST (PBS-0.1% Tween-20). The CARD-amplified membranes were stained with 50 μl of Cy3.29 tyramide at concentrations of 50 μg/ml (0.07 mM) in 0.1 M Na borate buffer, pH 8.5 with 0.003% H2O2, and incubated for 1 hr at 25C [Cy3-OSu, monofunctional, the precursor of Cy3-tyramide (Chao et al. 1996) is commercially available from Amersham Life Science, cat. no. PA13102; a similar Cy3-tyramide derivative is commercially available from NEN Life Science Products, Boston, MA]. The membranes were air-dried after washing four times with PBST.
Biotinylated Histone 4 Probes
Nine 25-base oligonucleotide probes complementary to 70% of the histone H4 coding region were synthesized at 1.3 μmol scale on the Gene Assembler Plus (Pharmacia LKB Biotechnology; Piscataway, NJ) and purified according to the procedure of Yu et al. (1992). The 60 nanomoles of each oligo-probe were labeled with biotin. The pH of the oligonucleotide solution was adjusted to 9.5 with Na2CO3 and then 300 ml of N-hydroxy-succinimido-biotin (Sigma) in dry DMF was added. The reaction mixture was vortexed and incubated at RT for 2 hr. To remove unreacted biotin, the labeling mixture was applied to Biogel-P4. The unlabeled oligonucleotides were removed by reverse-phase HPLC on a 150 × 4.1-mm Hamilton PRP-1 column using a biphasic linear gradient as previously described (Smith et al. 1985). The purified probes were concentrated, and dialyzed against double-distilled water, and stored at —20C.
HRP-labeled Histone 4 Probes
The nine 25-base oligonucleotide probes complementary to 70% of the histone H4 coding region [1.25 nM (10 μg) per probe] were lyophilized. Each probe was dissolved in 5 μl of 0.1 M NaHCO3-0.9% NaCl, pH 9.5 and mixed together to give a total volume of 45 μl. The activated HRP (Pierce, Rockford, IL; cat. no. 31496) was dissolved in 50 μl of H2O. The H4 oligonucleotide probes were added and the mixture was incubated at 4C overnight. After addition of 2 ml H2O, unlabeled H4 probe was removed by centrifugation at 8000 rpm (Beckman TJ-6 centrifuge, rotor 541G, 7–96) for 40 min and repeated exchange (three times) of the conjugate buffer to H2O.
RNA In Situ Hybridization with Biotinylated Histone 4 Probes
Forty μl of an RNAse inhibitor, (DEPC, 10% in 70% ethanol) in 2 ml of PBS was added to the cell culture dish containing the HeLa cells on a coverslip. The cells were incubated for 15 min at 25C. The DEPC was removed and the cells rehydrated for 10 min at 25C in PBS-5 mM MgCl2. The PBS was removed and 2 ml of 20 mM Tris-HCl-2 mM CaCl2 containing 1 μg/ml of proteinase K was added for 5 min at 37C. The proteinase K solution was removed, the cells were washed once with HBSS, and prehybridization was achieved in 1 volume of 20 X SSC-2 volumes of formamide solution at 25C for 10 min. The dried, biotinylated RNA probes (0.2–0.5 ng/probe, nine probes total) were dissolved in 15 μl of hybridization buffer (Trask 1991), denatured at 100C for 2 min, and immediately cooled to 0C for 10 min. The biotinylated RNA probe in hybridization buffer was added to the cells on the coverslip and hybridized at 40C overnight. The coverslips were washed for 30 min with 2 X SSC, then twice at 40C with 4 X SSC, 0.1% Tween 20 to remove nonspecific binding. They were then blocked with 10% BSA-4 X SSC, 0.1% Tween-20 for 20 min at 37C. Fifty μl of neutralite avidin-HRP or streptavidin-HRP at a 1.5 U/ml dilution in 1% BSA-4 X SSC with 0.1% Tween-20 was added and the cells were incubated at 25C for 1 hr. Sixty μl of Cy3-labeled streptavidin at concentrations of 5 μg/ml was added to the non-amplified control. The cells were then washed three times with 4 X SSC, 0.1% Tween-20 at RT, 8 min each wash. One hundred μl of a 6-μg/ml solution of Cy3.29-tyramide in 0.1 M of Na borate buffer, pH 8.5, with 0.003% H2O2 was added. The cells were incubated for 15 min at 25C and then washed four times with PBS, 8 min each wash. The coverslips were mounted on the cells on the microslides and the edges sealed with nailpolish.
RNA In Situ Hybridization with HRP-labeled Histone 4 Probes
The enzyme HRP is heat-sensitive. Therefore, the H4 probes could not undergo a denaturing step without loss of enzymatic activity. The HRP probes were therefore used at a concentration of 0.9 pM. The hybridization was carried out in the same fashion, with the exception of the last posthybridization wash. The hybridized probe was finally washed for 5 min with 0.1 M of Na borate buffer, pH 8.5, to equilibrate the probe for the staining procedure. The cells were blocked with 10% BSA-4 X SSC, 0.1% Tween-20 for 20 min at 37C. For fluorescent staining of the hybridization signal, 100 μl of a 6-μg/ml Cy3.29-tyramide solution in 0.1 M Na borate buffer, pH 8.5, with 0.003% H2O2 was added to each slide. The cells were incubated for 15 min at 25C, then washed four times with PBS for 8 min each wash. The coverslips were mounted on the specimens and the edges of the coverslips sealed with nailpolish.
DNA Probe and Labeling
We used a genomic 5.2-
In Situ Hybridization
The hybridization protocol for metaphase nuclei chromosome spreads is based on the procedure published by Trask (1991). The human corneal fibroblast interphase nuclei on the slide were denatured by a 5-min treatment with 70% formamide in 2 X SSC at 75C. The corneal cells were then sequentially dehydrated through ethanol (70%, 90%, 100%, 2 min each). An analogous procedure was used for the HeLa S3 chromosome spreads. Each slide was treated with 15 μl of denatured DNA probe (20 ng). One μg of human Cot-1 DNA (GIBCO BRL; Grand Island, NY) was added to the single-copy DNA probes to reduce nonspecific background hybridization. For identification of chromosome 3 in the HeLa S3 metaphase chromosome spreads, 0.75 μl of the FITC direct-labeled chromosome 3 α-satellite (D3Z1) (Oncor; Gaithersburg, MD) was added together with the pEFD64.1 single-copy probe. For identification of chromosome X, 0.75 μl of the FITC direct-labeled chromosome X α-satellite (DXZ1) probe (Oncor) was added together with the q27.2 single-copy probe. The slides were covered with coverslips, air bubbles were removed, and the coverslip sealed with rubber cement. The slides were hybridized overnight at 37C.
Posthybridization Fluorescent Staining
The slides were gently agitated in 50% formamide-2 X SSC at 42C for 8 min to “float off” the coverslips. The slides were washed twice in 2 X SSC for 8 min at 42C. The slides were then transferred to 4 X SSC-0.1% Tween-20 for 10 min at 25C. The slides were removed from the bath and excess liquid was removed by carefully blotting the slides with bibulous paper. Then 60 μl of 10% BSA (protease-free grade)-4 X SSC with 0.1% Tween-20 was added. The slides were covered with parafilm and incubated for 20 min at 37C. Signal amplification was performed as follows. First, 50 μl of neutralite avidin-HRP or streptavidin-HRP (1.5 U/ml dilution in 1% BSA-4 X SSC with 0.1% Tween-20) was applied per CARD slide. The slides were incubated for 1 hr at 25C. Sixty μl of 5 μg/ml of streptavidin-Cy3 was then applied for the biotin-labeled non-amplified control slides. The slides were washed three times with 4 X SSC-0.1% Tween-20 at 25C, 8 min per wash. The control slides were washed twice in PBS buffer and mounted on the coverslips with Permount. The CARD slides were washed at 25C in 0.1 M Na borate buffer, pH 8.5, for 8 min and treated with 50 μl of Cy3.29-tyramide [concentration 6 μg/ml (8 μM) in 0.1 M Na borate buffer, pH 8.5, with 0.003% H2O2]. After 15-min incubation at 25C, the CARD slides were washed four times with PBS buffer. To view the chromosomes and the fluorescence signals simultaneously, Hoechst 33342 (Molecular Probes; Eugene, OR) was used as a counterstain. Eighty μl of Hoechst 3342 in PBS (25 μg/ml) was added to the slides for 15 min immediately after the CARD detection. After staining the slides were rinsed with PBS, excess fluid was shaken off, and they were mounted on the coverslips. The slides were viewed through the microscope immediately after staining.
Quantitation of FISH Histone 4 Signals on HeLa S3 Cells
Images were taken on an analytical cytometry system composed of a Macintosh Quadra 950, Carl Zeiss Axioplan microscope (Carl Zeiss; Oberkochen, Germany) equipped with a mercury arc lamp and a Photometrics (Tucson, AZ) cooled CCD camera. A Zeiss Plan-Neofluar X20, 0.5 NA dry objective was used for the H4 hybridization. BDS-Image software (now STC-View, a Carnegie Mellon enhancement of the original BDS-Image package) was used for image collection and processing including registration, uniform field correction, and background correction.
Signal intensity measurements were taken from populations of positive and negative cells. The brightness of the signals was calculated as the ratio of gross fluorescence intensity of each cell/cell area. The area of the cell is determined by dilating a spot at the center until its fluorescent intensity no longer decreases by a predetermined threshold intensity.
Measurements from positive and negative cells were compared by the following equation:

where Mp and σp are mean brightness and standard deviation of a positive cell population, Mn and σn of a negative cell population, respectively.
Metaphase Chromosome Imaging
Images were taken with a multimode light microscope based on a Zeiss Axiovert microscope (Thornwood, NY) that had been optically and mechanically modified (DeBiasio et al. 1996). Optical components included a Zeiss X100 oil-immersion objective and the following filter sets: fluorescein (485-nm excitation filter with a 22-nm bandpass, 510-nm longpass dichroic, 530-nm emission filter with a 30-nm bandpass), Cy3 (rhodamine filter; 540-nm excitation filter with a 23-nm bandpass, 572-nm longpass dichroic, 590-nm emission filter with a 35-nm bandpass), and Hoechst (355-nm excitation filter with a 40-nm bandpass, 400-nm longpass dichroic, 450-nm emission filter with a 50-nm bandpass). Fluorescence images were collected using a cooled CCD camera with a 576 × 384 Thompson chip (Photometrics) as 16-bit data. All images were acquired using BDS-Image software (now STC-View, a Carnegie Mellon enhancement of the original BDS-Image package) and processed on a Macintosh Quadra 950 computer (Apple Computer). Images were grouped using the collage feature in STC-View software, saved as PICT files, registered, pseudo-colored, and resized electronically in Adobe 2.5 (Adobe Systems; Mountain View, CA). The images were printed out on a Codonics NP-1600 color printer (Codonics; Middleburg Heights, OH).
Results
Dot-blot Analysis of Histone 4 Expression of S-phase, Synchronized HeLa Cells
The sensitivity of mRNA detection by fluorescent hybridization utilizing CARD was compared by semi-quantitive dot-blot analysis to non-amplified staining with streptavidin-Cy3.18. RNA derived from extraction of S-phase HeLa S3 cells was immobilized on NYTRAN plus membranes and hybridized with serial dilutions (1, 5, 25, 125, 625) of a mixture of nine biotinylated H4 probes. The control was visualized by addition of streptavidin-Cy3.
CARD Amplification
Visualization involves the addition of HRP-labeled streptavidin to the hybridized probe, followed by addition of the reporter Cy3.29-tyramide. The results are shown in Figure 2. A fluorescent hybridization signal could not be detected in the non-amplified control even at the highest probe concentration of 27 μg/ml. With the detection of H4 mRNA at probe concentrations of 0.54 μl/ml, CARD shows at least a 25-fold amplification over the non-amplified staining method utilizing only streptavidin-Cy3.
Gene Expression of Histone 4 in HeLa Cells Detected by FISH
In most eukaryotic cells, histone gene expression is temporally coupled to DNA synthesis, occuring predominantly during the S-phase of the cell cycle. The regulation of histone gene expression in DNA synthesis during the HeLa cell cycle is well studied (Baumbach et al. 1987; Heintz et al. 1983; Plumb et al. 1983; Rickles et al. 1982). There is a large increase in the levels of histone mRNAs during S-phase of the cell cycle.
HeLa S3 cells were synchronized at the G1/S boundary by colcemid block, as described in Materials and Methods. H4 mRNA was detected by in situ hybridization using biotin-labeled and HRP-labeled oligonucleotides. We utilized Cy3.29-tyramide in the two-step CARD method (Figure 3 A) for amplification and visualization of H4 mRNA detected with biotinylated 25-mer probes.
The second detection method that we tested utilized HRP-labeled probes for detection of H4 mRNA. The hybridization signal was amplified and visualized in a one-step staining process using the fluorescent HRP substrate Cy3.29-tyramide (Figure 3 C).
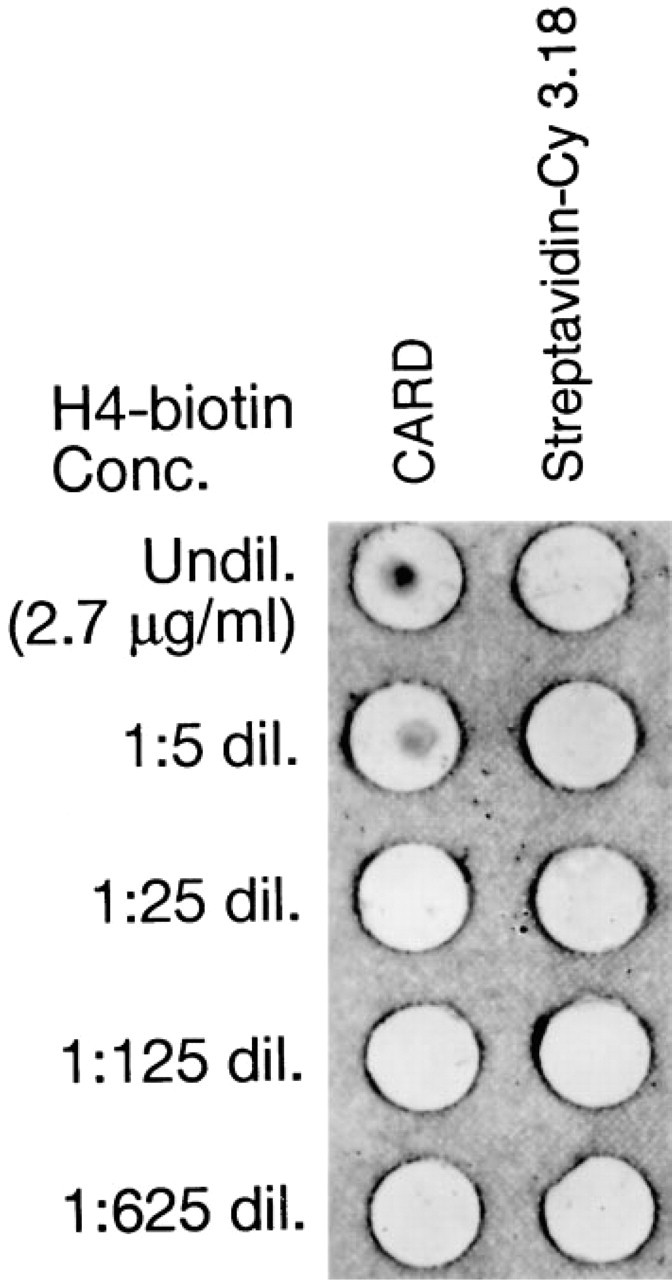
Dot-blot analysis of H4 expression on the RNA extract of S-phase, synchronized HeLa cells. Left column, CARD staining; right column, control stained with streptavidin-Cy3.
These two detection methods were compared to each other by fluorescence intensity measurements and to the non-amplified control visualized by streptavidin-Cy3. In the non-amplified control, none of the cells showed significantly above the image background (approximately 5–10 CCD units) (Figure 3 B). The mean brightness of 27 positive cells detected with biotinylated H4 probes (exp. 0.1 sec) was measured to be 157 CCD units (σ 20.9) vs 73.6 CCD units (σ 6.64) for the population of 27 negative cells. The signal-to-noise ratio was determined to be 3.87 (Figure 3 A).
For FISH detection with HRP-labeled H4 probes, the exposure time had to be increased from 0.1 sec to 0.3 sec to obtain good signal resolution (Figure 3 C). The brightness of 27 positive cells detected with the HRP-labeled H4 probes (exp. 0.3 sec) was measured to be 85 CCD units (σ 8.24) vs 50.6 CCD units (σ 3.36) for the population of 27 negative cells. The signal-to-noise ratio was determined to be 3.83. Because the output of the camera is linear in the range of 0.1 sec to 0.3 sec, the mean brightness value for the HRP-labeled H4 probes was divided by 3 to be comparable to the brightness of the CARD signal of the biotinylated histone, to give a value of 26 CCD units.
CARD on biotinylated H4 probes compared to CARD on HRP-labeled H4 probes increases the brightness of the signal by the factor 6 and the ratio Mp/Mn by 1.28. However, it also increases the variance in signals, and the signal-to-noise ratio for both methods is therefore comparable.
Single-copy DNA Detection on Interphase Nuclei from Human Corneal Fibroblast Cells
The FISH detection via CARD of single-copy DNA probe pEFD64.1 (5.2-
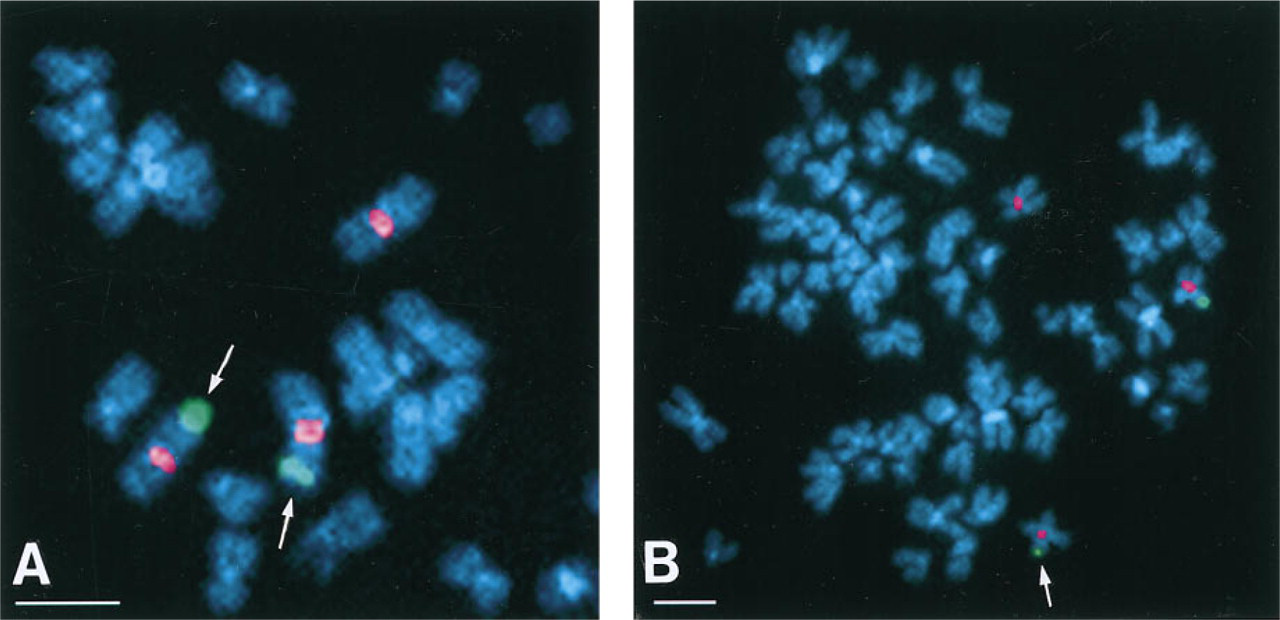
This method, utilizing the reporter Cy3.29-tyramide, enabled us to detect two copies (two dots) in 30% of the investigated corneal fibroblast cell population and one copy in 34% of the remaining nuclei (number of cells counted, 100). The FISH detection via CARD of the single-copy DNA probe pEFD64.1 was performed on HeLa S3 interphase nuclei. Trisomy (three dots) was detected in 24% of the interphase nuclei of an average population of the transformed cell line HeLa S3. Two copies (two dots) were detected in 40% and one copy in 32% (number of cells counted, 100). Localization experiments were performed on HeLa S3 metaphase chromosome spreads with the probe pEFD64.1. The signals were proved to be located on chromosome 3 by a triple staining experiment utilizing Hoechst 33342 to view the chromosomes and an FITC direct-labeled chromosome 3 satellite marker for chromosome identification (Figure 5 A).
The FISH detection via CARD of single-copy DNA was also proved to be successful for a 10.7-
Discussion
An increase in the sensitivity of detection systems is still needed to permit routine detection of low copy-number nucleic acid sequences. Bobrow et al. published in 1989 a signal amplification method, catalyzed reporter deposition (CARD), which has been successfully applied to immunoassay and in histochemistry. CARD has been applied in a multistep in situ signal amplification method based on the deposition of biotinylated tyramine (Kerstens et al. 1995). Recently, FISH detection of hapten-conjugated DNA phage probes from chromosome 15q11.2 containing 15-
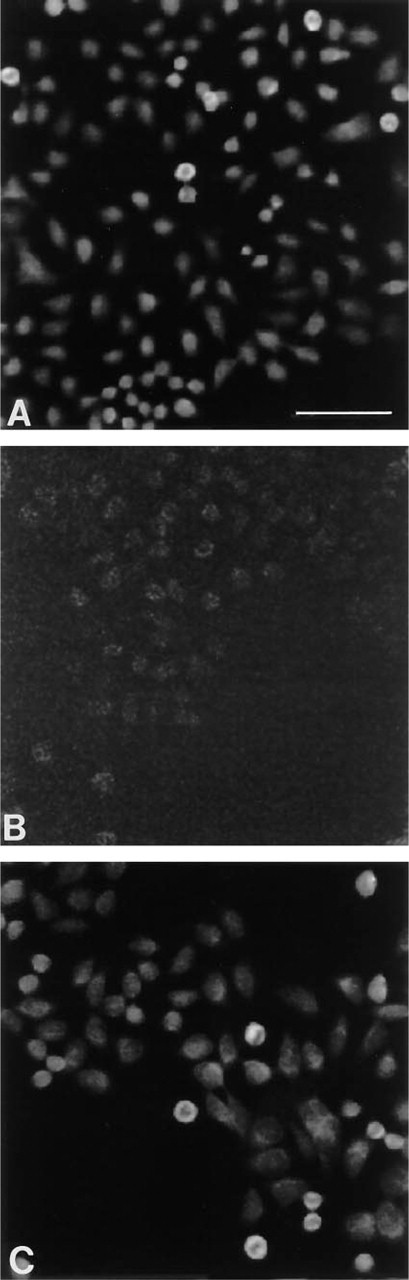
RNA expression of H4 in HeLa cells detected by FISH. (
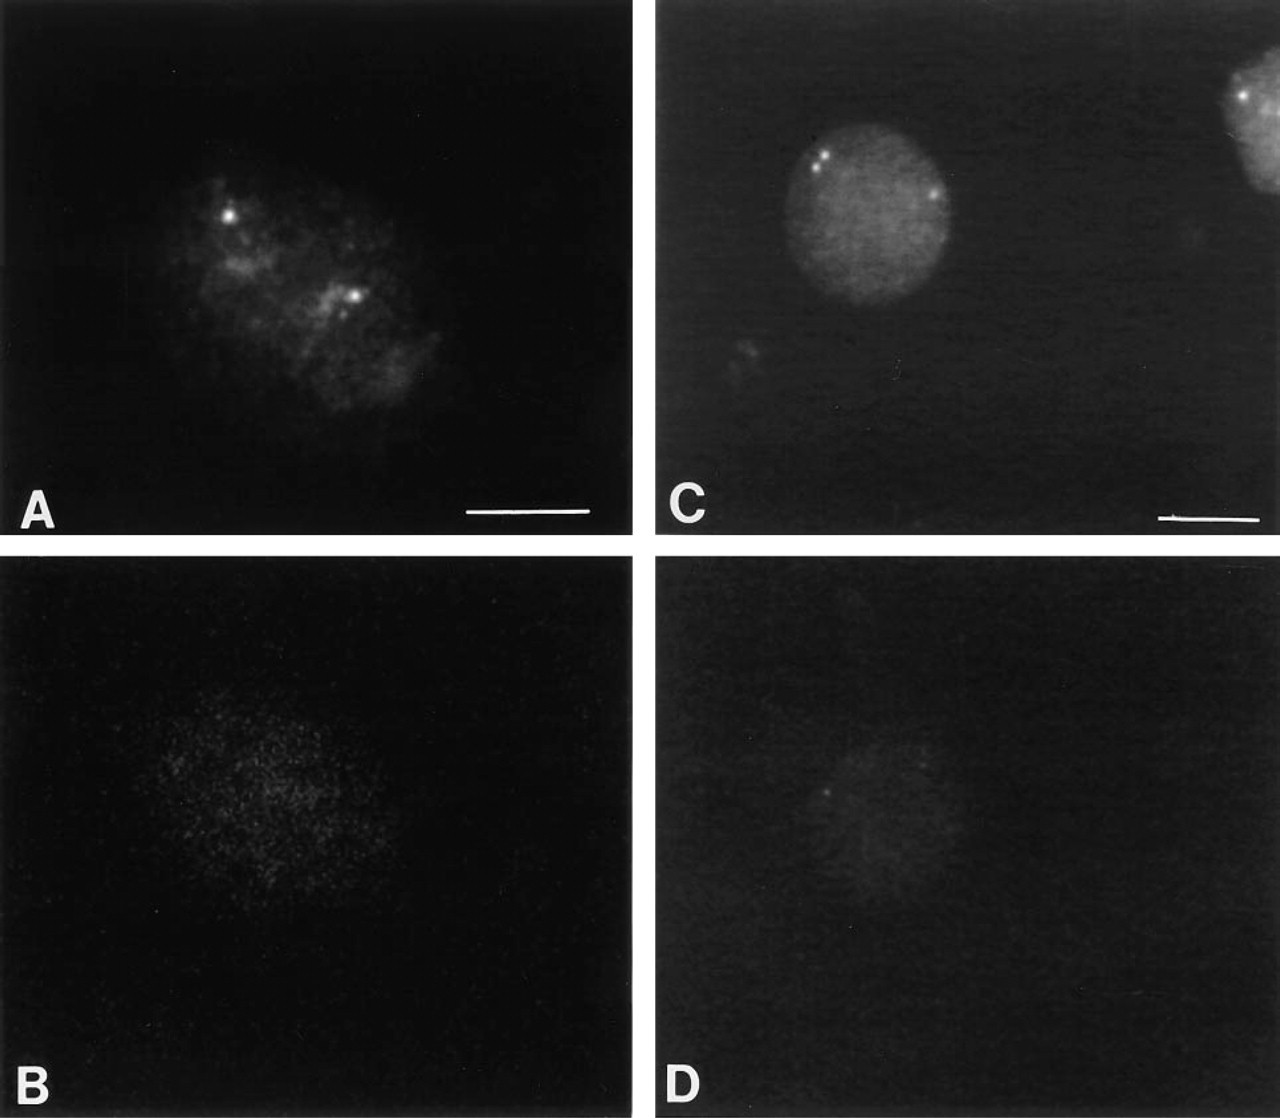
FISH detection of the biotinylated 5.2-
In this study we describe a CARD-amplified FISH procedure that utilizes the novel fluorescent reporter Cy3.29-tyramide. Initially this technique was tested by dot-blot analysis of H4 expression on S-phase HeLa S3 cells. Non-amplified FISH fails to detect a signal. The CARD-amplified FISH procedure detects a fluorescent hybridization signal at probe concentrations of 0.54 μg/ml of H4 RNA. A signal could not be detected in the non-amplified control, even at the highest probe concentration of 27 μg/ml.
These results encouraged us to apply our method to detect the gene expression of H4 in HeLa S3 interphase nuclei by FISH with oligonucleotide probes.
Oligonucleotide probes, because of their small size, have the advantage of better penetration into fixed tissue and cell matrices than larger RNA probes, making the sensitivity of detection less dependent on penetration problems caused by probe fragment size (Trembleau et al. 1990). The major problem encountered with oligonucleotide probes is their detection (Hoyland and Freemont 1991). Large probes can be labeled with a much larger number of chemically tagged bases than small oligonucleotide probes. This implies that significantly fewer labeled bases are added than with larger probes, thus reducing the relative sensitivity of in situ hybridization.
Localization of FISH signals via CARD for biotinylated 5.2-
Signal amplification is achieved with both CARD detection techniques that use biotin-labeled H4 probes and HRP-labeled probes. FISH with biotin-labeled H4 probes on HeLa S3 cells detected with the streptavidin-conjugated HRP-Cy3.28-tyramide system shows an excellent result, with a 25-fold amplification vs the non-amplified system stained with streptavidin-Cy3. HRP-labeled probes, CARD-amplified and visualized by Cy3.28-tyramide, show a sixfold amplification vs control. A signal-to-background ratio greater than 3.0 allows a clear distinction of positive and negative cells in both amplification methods, whereas direct labeling with streptavidin-Cy3 does not allow detection of S-phase cells. The one-step amplification system with HRP-labeled H4 probes gives a weaker signal but is less susceptible to variations in the reagent concentrations.
For specific applications in which sensitivity is less of a problem, in situ hybridization detected by the Cy3.29-tyramide deposition on HRP-labeled oligonucleotides provides a valuable alternative to detection with biotinylated probes.
Finally, we tested our method for detection of single-copy DNA. We chose to detect locus pEFD64.1 positioned on an arm of chromosome 3. Traditional fluorescence-based detection systems, such as biotinylated probe-streptavidin-fluorescent dye, fail to detect single-copy DNA as short as 5.2
Our CARD technique, which involves fewer steps, shows comparable sensitivity for the FISH detection of single-copy DNA on interphase S3 HeLa cells. The method allows localization of the FISH signal on metaphase chromosome spreads. We performed another single-copy DNA detection with a 10.7-
Utilization of the fluorescent reporter Cy3.29-tyramide results in a hybridization signal that is very stable to photobleaching and does not exhibit the rapid fading that has been described for the use of FITC-labeled oligonucleotides (Dirks et al. 1990).
Footnotes
Acknowledgements
Supported in part by a Science and Technology Center Grant from the National Science Foundation, MCB-8920118 and by E.I. Dupont de Nemours & Co.
We thank the EYE and EAR Institute in Pittsburgh for providing human corneal fibroblasts. We thank Alasdair Dow for his assistance in the fluorescent intensity measurements.