
Abstract
Keywords
I
Materials and Methods
Mononuclear cells were isolated from adult venous blood by Ficoll separation (density 1.077). Cells at 5 × 10⁶ cells/ml were resuspended in either PBS alone, 1% PF, or 3% PF and then incubated on ice for 15 or 60 min. Cells were washed twice and resuspended in PBS at 10 × 106 cells/ml and stored in suspension at 4C.
At each time point, samples were examined by flow cytometry for light scatter changes (data not shown) and 20 μl of concentrated cell suspension was dropped onto a clean slide, air-dried, and stained for morphology using a threestep Leukostat differential stain (Fisher Scientific; Pittsburgh, PA). Slides were analyzed and photographed using a Leica DMRB microscope under × 400 magnification (Leica; Deerfield, IL).
For FISH analysis, 20 μl of concentrated cell suspension was dropped onto a silylated glass slide and air-dried. Slides were incubated twice in fresh Carnoy's fixative (3:1, methanol: glacial acetic acid) for 15 min each, air-dried, completely, and stored at −20C until FISH. Nuclear DNA was denatured in 70% formamide and 2 × SSC at 70C for 15 min. The probe mixture contained 0.3 μl chromosome X-specific direct-labeled probe, CEP X-SpectrumOrange (Vysis; Downers Grove, IL). Probe denaturation, hybridization, and postwash were done as previously described (Bischoff et al. in press) Nuclei were counterstained with DAPI II (Vysis) and viewed under a Zeiss Axiophot microscope with a × 100 plan-neofluor objective (Carl Zeiss; Thornwood, NY). A digital imaging system (Perceptive Scientific Instruments; League City, TX), with a CCD-cooled camera was used to capture images.
The ratio of probe to background fluorescence intensity was determined using the Adobe Photoshop 3.0 color imaging software. Histograms displayed the tonal distribution (brightness and darkness levels) of color in each image. Using an area of 64 pixels (equivalent to the area of one typical probe signal), statistical information about red color values of the pixels was displayed, including the mean signal (red brightness) intensity value. Because the FISH quality was consistent in over 1000 nuclei counted for each fixation condition, five nuclei were selected for specific evaluation. The mean fluorescence intensity value and standard deviation was collected and intensities averaged. Mean noise intensity observed in the nuclear area was recorded by selecting two 64-pixel areas in the DAPI-positive stained area. The signalto-noise ratio was calculated as the ratio of the mean signal intensity to the mean noise intensity. The ratio of mean standard deviation to the mean signal intensity compared relative signal disbursements between different samples.
Results and Discussion
To document changes occurring in the cell population distributions by flow cytometry, we examined forward scatter and side scatter with each fixation condition at 3, 7, 10, and 21 days. A reduction in forward light scatter occurred at Day 3 in 1% PF but not in 3% PF. By Days 7, 10, and 21, a progressive reduction in scatter was observed in all fixed cells. However, in 3% PF the reduction was consistently less and the distribution of populations was maintained (data not shown). These results suggest that fixation in 3% PF results in cells with greater stability and integrity over time than fixation in 1% PF. This is important because light scatter is used as a gating parameter when the nucleated erythroid cells are sorted.
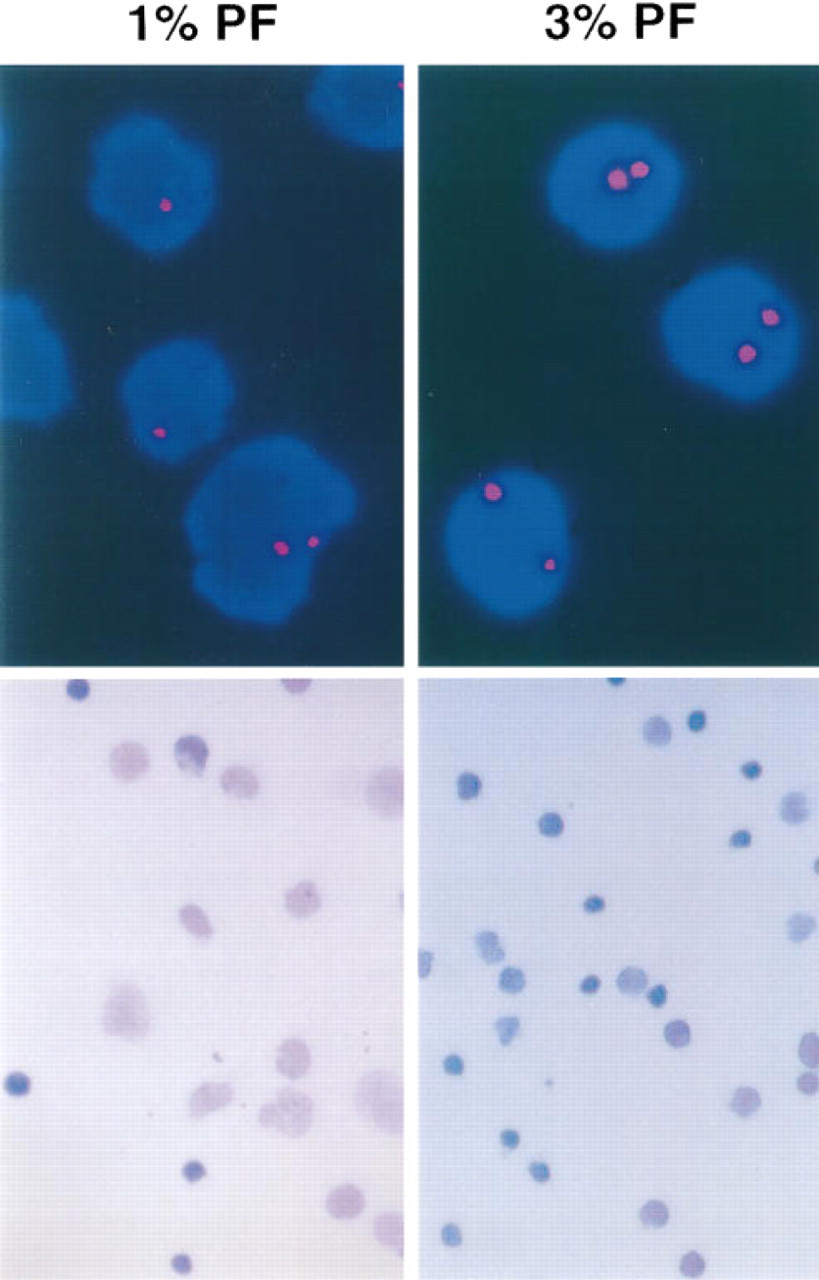
FISH quality and morphology at Day 10. Cells from the 1% PF fixation show variable numbers of FISH signals (top left) and deteriorating morphology (bottom left). Cells from the 3% PF fixation show two consistent bright FISH signals (top right) and sustained morphological integrity (bottom right).
Morphological observations over the course of the 21-day experiment provided a visual indicator of cell deterioration relative to fixation and storage. Cell damage, characterized by cell lysis, break-up of nuclear material, and increased cell debris, was observed beginning at Day 3 in the 1% PF sample and worsened by Day 10. Cells fixed in 3%PF maintained their integrity until Day 21. Examples of morphological staining are shown in Figure 1.
To quantitate FISH signal intensity and definition, we compared samples fixed with 1% PF for 60 min to those in 3% PF for 60 min relative to the time of storage in PBS (Table 1). Higher mean signal intensity to mean noise intensity ratios indicate a greater gap between probe fluorescence intensity and background, thus indicating sharper signals for FISH analysis. Samples fixed in 3% PF showed a signal-to-noise ratio that increased up to Day 10 but decreased by Day 21. By contrast, samples fixed in 1% PF had an increased signal/noise ratio at Day 3, which decreased thereafter. This suggests that 1% PF is adequate up to 3 days. However, 3% PF is better at maintaining cells for a sharp, intense FISH signal relative to background beyond 3 days of storage.
FISH signal intensity analysis after either 1% or 3% PF fixation following storage in PBS a
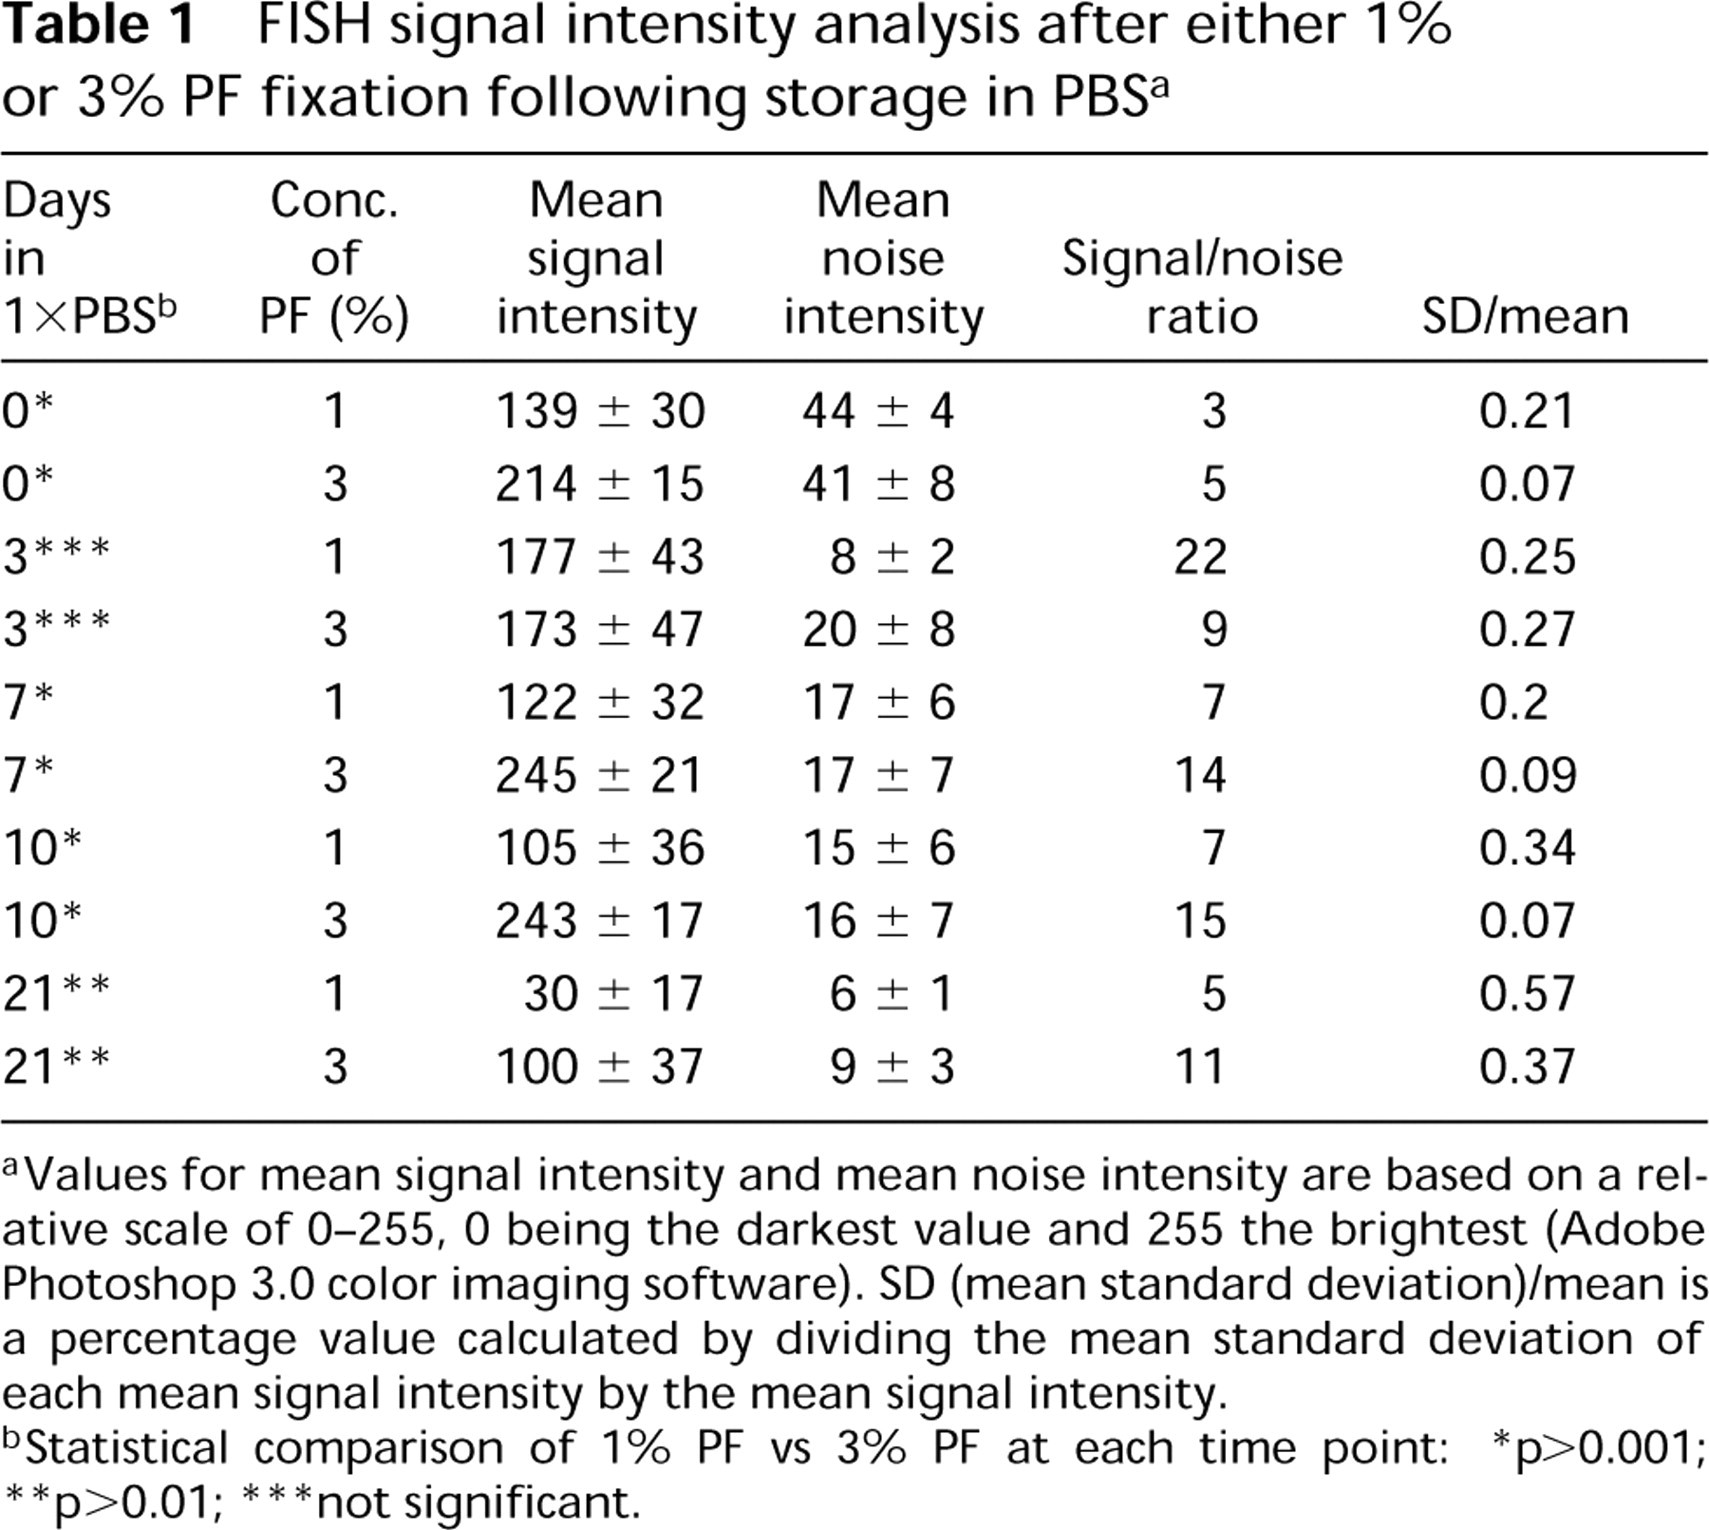
aValues for mean signal intensity and mean noise intensity are based on a relative scale of 0-255, 0 being the darkest value and 255 the brightest (Adobe Photoshop 3.0 color imaging software). SD (mean standard deviation)/mean is a percentage value calculated by dividing the mean standard deviation of each mean signal intensity by the mean signal intensity.
bStatistical comparison of 1% PF vs 3% PF at each time point: ∗p > 0.001; ∗∗p >0.01; ∗∗∗not significant.
To quantitate the clarity of the X-probe signals, we divided the mean standard deviation by the mean signal intensity for each sample. The calculated percentages rise as signals become more disperse (i.e., standard deviation increases). Three percent PF samples showed sharper signals compared to 1% PF samples, with the exception of Day 3, for which the results were approximately equal. Both fixation conditions show relatively stable percentages up to Day 10, with a sharp increase by Day 21 indicating deterioration in quality of interphase FISH signals. Examples of FISH hybridization are given in Figure 1.
To incorporate blood separation, flow cytometric selection by surface antigens, and interphase FISH into a protocol that can be used for clinical prenatal diagnosis, it is necessary to store samples after major steps in the protocol. However, efficient interphase FISH analysis of these cells requires multiple chromosome-specific probes that display consistent clarity and intensity. We routinely perform five-color FISH on samples fixed in 3% PF (Bischoff et al. in press). Therefore, cellular DNA must be preserved in optimal condition to ensure FISH quality.
Our flow cytometric, morphological, and singleprobe FISH analysis showed that greater PF concentrations and longer fixation times maintained the size and cellular integrity of discrete nucleated cell populations found in Ficoll-separated peripheral blood. However, even the 3% PF-60-min fixation proved unsuitable to sustain cells for FISH analysis up to 21 days. Considering that further increasing the PF concentration or PF incubation time would jeopardize subsequent interphase FISH, we conclude that a fixation in 3% PF for 60 min is optimal for storing cells in suspension up to 10 days before flow cytometry and subsequent FISH analysis.
Footnotes
Acknowledgements
Supported by NIH grant no. HD43203.
We would like to thank Boehringer Mannheim for their support and Vysis for providing probes.