
Abstract
Luminescent semiconductor quantum dots (QDs) are a new class of fluorescent label with wide-ranging applications for cell imaging. The electron density and elemental composition of these materials permit the extension of their use as probes in conventional electron microscopy (TEM) and energy-filtered TEM (EFTEM). Here we illustrate the feasibility of using streptavidin-conjugated QDs as TEM tags by labeling a nuclear protein on cell sections and obtaining correlative fluorescence and TEM data. We also show that QD probes can be employed in conjunction with immunogold for co-localization of proteins at the ultrastructural level. Furthermore, by obtaining cadmium elemental maps of CdSe/ZnS QDs distributed on a nuclear structure, we demonstrate the potential of QDs for co-localization of multiple proteins when used in combination with EFTEM.
Keywords
A
To illustrate the value of QDs as probes for EM studies of cell components, the nuclear promyelocytic leukemia (PML) protein was chosen as the target biomolecule. The localization of PML protein in discrete subnuclear bodies has been well characterized with both fluorescence and electron microscopy (Boisvert et al. 2000,2001).
Materials and Methods
Reagents
All reagents were purchased from Sigma-Aldrich (St Louis, MO). Qdot 605 streptavidin conjugate was purchased from Quantum Dot (Hayward, CA).
Cell Growth, Fixation, and Embedding
HEp-2 PML I (GFP-PML I/IV stable cell line; a kind gift from Dr. J. Taylor) cells were cultured per ATCC recommendations. Cells were seeded onto coverslips, cultured overnight in Dulbecco's modified Eagle's medium (DMEM) (GIBCO; Carlsbad, CA) with 500 μg/ml G418 sulfate (Calbiochem; San Diego, CA) and 10% FBS (Invitrogen; Carlsbad, CA), then fixed in a 1% paraformaldehyde and 2% glutaraldehyde mix in PBS (pH 7.5) at ambient temperature for 10 min and rinsed three times with PBS. Then the cells were dehydrated with a graded ethanol series, consisting of 30%, 50%, and 70% ethanol at 10 min each. Cells were then incubated in a 2:1 mix of 70% ethanol:LR White (Electron Microscopy Sciences; Fort Washington, PA) for 10 min and then rinsed twice with LR White. The coverslip was placed cell side down onto a mold filled with LR White. The assembly was inserted into a vacuum chamber and placed in a 60C oven for 24 hr.
Thin Sectioning
The block of resin attached to the coverslip was removed from the mold, placed in liquid nitrogen briefly, and then peeled off the coverslip. A selected area of the block was excised, glued on a bullet of resin, and mounted in the ultramicrotome for sectioning. Sections 60-70-nm thick were picked up on 400-mesh nickel grids.
Post-section Labeling
For all incubations, drops of solution were placed on a sheet of Parafilm and grids were floated on the drops, section side down. All antibody incubations were performed for 1 hr, and all blocking and rinsing steps were performed for 10 min. The sections were blocked twice with a solution of 0.5% BSA, 0.15% glycine, then three times with 2% BSA in PBS (incubation buffer). The sections were then incubated with a rabbit polyclonal anti-PML antibody (Chemicon; Temecula, CA) diluted in incubation buffer, then rinsed three times with the incubation buffer. For immunogold labeling, a goat anti-rabbit IgG-10-nm gold antibody (Electron Microscopy Sciences) was used for the secondary antibody incubation. After rinsing three times with the blocking buffer, goat anti-rabbit-Cy3 was employed to fluorescently label the remaining sites on the primary antibody. The sections to be labeled with QDs were incubated with a biotin-SP-conjugated donkey anti-rabbit biotinylated antibody (Jackson ImmunoResearch; West Grove, PA) and rinsed as before. The Qdot 605 conjugate was incubated at 10 nM for 30 min with the Qdot Incubation Buffer (Quantum Dot). The section was then placed on a drop of this solution. After the immunogold or QD incubation, the samples were rinsed once with PBS for 10 min. Grids were then placed on drops of distilled water (Invitrogen; Grand Island, NY) four times for 10 min each and finally air-dried. For the double-labeling experiment, the rabbit anti-NH2-terminal CBP antibody (Santa Cruz Biotechnology; Santa Cruz, CA) was incubated concurrently with a mouse monoclonal anti-PML antibody 5E10 (a kind gift from R. van Driel). Immunogold was targeted against PML and QD against CBP.
Staining
Staining was performed by placing grids on drops of 1% uranyl acetate (Electron Microscopy Sciences) solution for 5 min. The grids were then rinsed three times on drops of distilled water.
Fluorescence Microscopy
Thin sections supported on grids were placed on glass slides and covered with coverslips for examination at high magnification (×63) with a Leica DMRA2 epifluorescence microscope (Leica Microsystems; Wetzlar, Germany). Digital images were collected with a 14-bit CCD camera. Images were captured and processed with Open Lab 3.0.7 software (Improvision; Boston, MA). The fluorescence filter set used for Cy3 was also well suited for imaging the Qdot 605 tag.
Electron Microscopy
Before ESI analysis the sections were coated with a carbon film approximately 3 nm thick to stabilize the section from physical distortions caused by the electron beam (Ren et al. 2003). The regions of interest were imaged with a Tecnai 20 (FEI; Eindhoven, The Netherlands) transmission electron microscope equipped with an electron imaging spectrometer (Gatan; Pleasanton, CA) and operated at 200 kV. Elemental maps were generated by dividing the element-enhanced post-edge image by the pre-edge image after alignment by cross-correlation. Net ratio elemental maps were produced from pre- and post-edge images recorded at 120 and 155 eV (LII,III edge) for phosphorus, edges recorded at 385 and 415 eV (K edge) for nitrogen (Bazett-Jones and Hendzel 1999), and edges collected at 415 and 510 eV (MIV,V edge) for cadmium. The recording times required to obtain the pre-edge and post-edge images are in the range of 10-30 sec. The images were collected with a cooled CCD camera. Because the images are captured at a resolution of 1024 × 1024 pixels, they have a pixelated appearance when inspected closely or zoomed. The images were processed using Digital Micrograph software (Gatan).
Results
The PML protein was detected with a commercially available streptavidin-conjugated QD, Qdot 605. The dimensions of this QD conjugate necessitated post-section labeling because the 10-15-nm diameter particles are incapable of penetrating the nuclear envelope. Pre-embedment labeling of nuclear components is possible with “harsher” fixatives such as acetone (Wu et al. 2002) or methanol because these agents remove the nuclear membrane. However, an undesirable consequence is the significant disruption of the structure and the relative position of chromatin and other nuclear components. To preserve the nuclear ultrastructure, we employed fixation with paraformaldehyde and glutaraldehyde, followed by embedding, sectioning, and immunodetection. With correlative fluorescence and electron microscopy, PML bodies are initially located in thin sections by the fluorescence signal observed in the light microscope. These identified structures are then imaged at high resolution by conventional TEM, with heavy atom staining, or by ESI, with or without staining. Fluorescence microscopy and low-magnification TEM images are used to identify PML bodies in the cell nucleus (Figures 1A and 1D), and PML bodies are then imaged at higher resolution by TEM. The distribution of PML protein in the nuclear body is indicated with immunogold (Figures 1B and 1C) or QDs (Figures 1E and 1F). The nuclear bodies in this cell line form easily recognized ring structures. In the brightfield images, the QDs are recognized by a lower mass density relative to the 10-nm gold spheres, yet they are clearly visible under conventional operating TEM conditions at the appropriate magnification. The oblong shape and lower electron density of the QD nanocrystal relative to gold lead to the impression that the QD is much smaller relative to the gold sphere, even though the length of the QD particle is comparable to the diameter of the gold sphere. The 10-15-nm diameter of Qdot 605, as specified by the manufacturer, includes the metal core/shell, a polymer coating, and an outer layer of streptavidin. However, in brightfield TEM, only the metal component is of sufficient electron density to yield contrast. Because the metal component of the QD is smaller than that of the 10-nm gold probe, the object appears smaller in the image. The manufacturer of the 10-nm gold probe specifies only the diameter of the gold component. The attached antibody also increases the physical diameter of the probe, but this dimension is not specified.
The characterization of the PML body by ESI is a prime example of the capability of this imaging technique to provide chemical and structural information about subcellular components. Nitrogen and phosphorus elemental maps of the PML body reveal a biochemically distinct substructure (Figures 2B and 2C). The ring-shaped core of the nuclear body is enriched in nitrogen and depleted in phosphorus. This indicates that the ring structure is composed primarily of protein and is devoid of nucleic acid components, such as chromatin and RNA. We can exploit the elemental composition of QDs to our advantage if an ionization edge of one of its elemental components is resolvable from neighboring ionization edges. The core material of Qdot 605 is CdSe, and the MIV,V ionization edge of cadmium allows us to obtain a cadmium elemental map without interference from the nitrogen signal (Figure 2D). The contribution of the nitrogen K edge ionization is excluded by careful selection of the region of the energy loss spectrum chosen to produce the cadmium pre-edge and post-edge images. Nitrogen pre- and post-ionization signals were collected at 385 and 415 eV, whereas those for cadmium were collected at 415 and 510 eV.
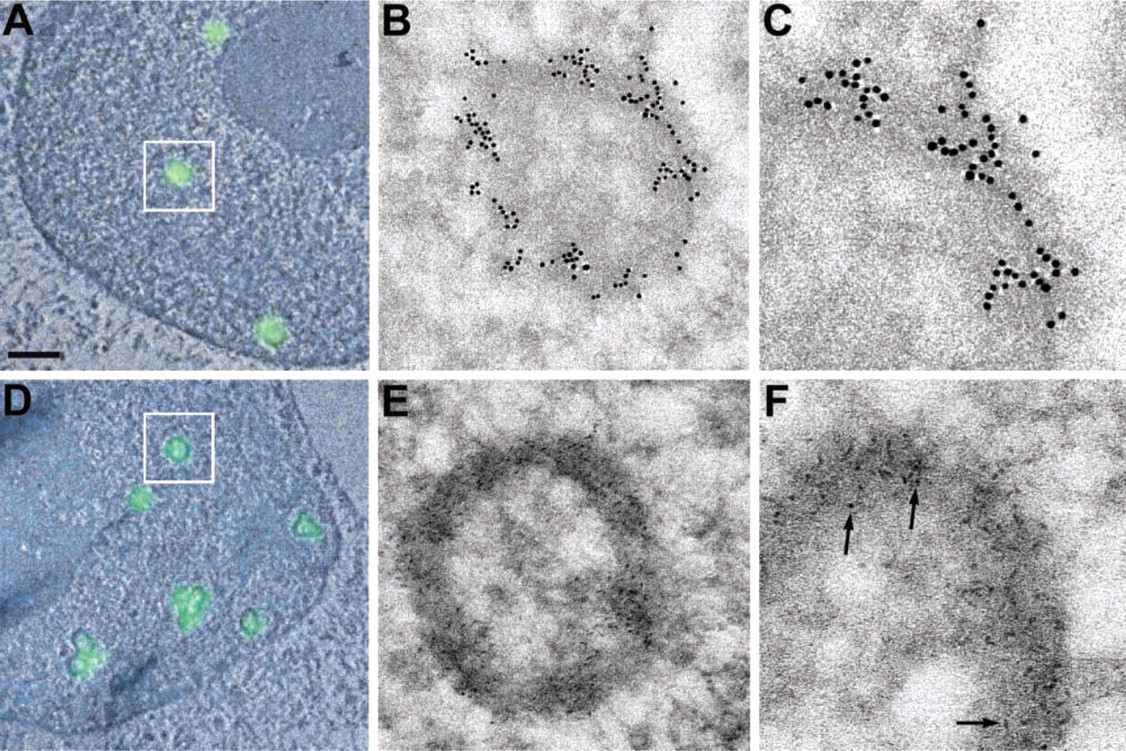
Detection of PML bodies with 10-nm gold and quantum dots. (
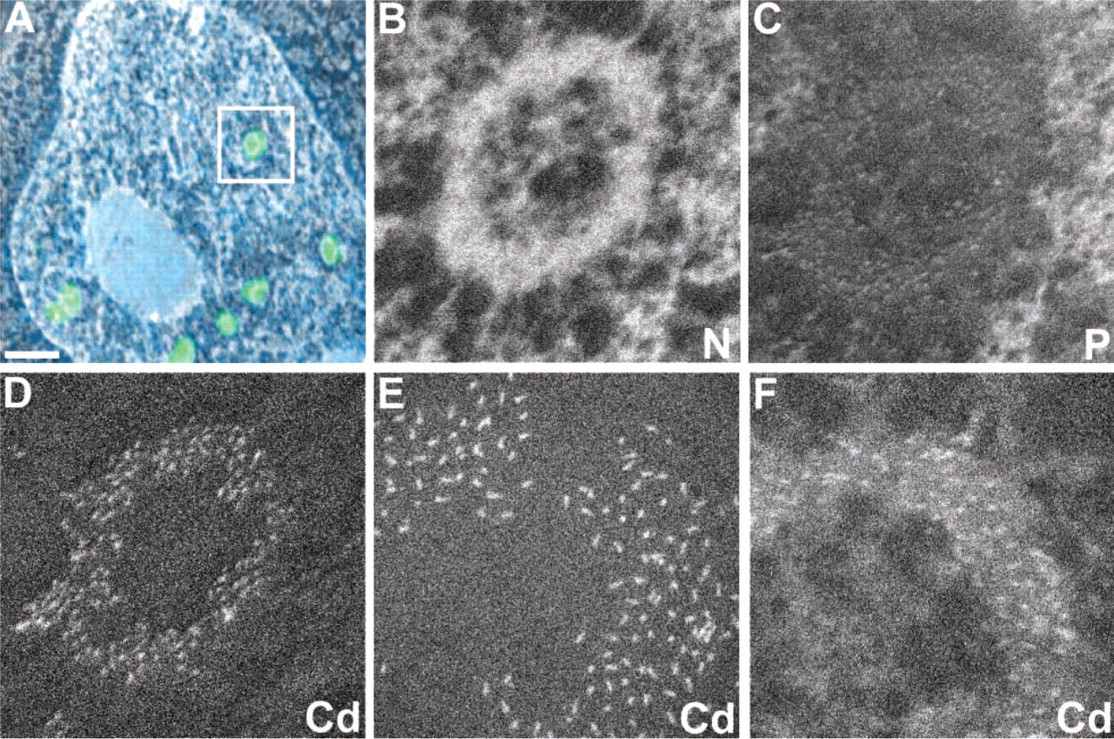
ESI of nuclear components and quantum dots. (
An ESI elemental map of QDs can also be obtained from a sample lightly stained with uranyl acetate (Figure 2F). The cadmium signal-to-background ratio is lower than in the unstained section (Figure 2E) because of the background signal generated by the uranyl acetate stain. However, if stains must be employed for ease of cell and substructure identification, this example illustrates that ESI is still fully capable of detecting the cadmium-based nanocrystal tag on the basis of its chemical composition.
The electron dose for detection via ESI is on the order of 300 electrons/Å2 for the pre- or post-edge images. This is approximately a 100-fold increase from the dose used for brightfield imaging. Terminal mass loss occurs within the first second of imaging and no further loss occurs during image collection. Nevertheless, damage of structural detail at the level that is required is not a major problem. An order of magnitude greater dose exposure would be required before physical damage from the beam would become apparent. The integrity of the plastic sections is enhanced with a carbon coating 2-3 nm thick.
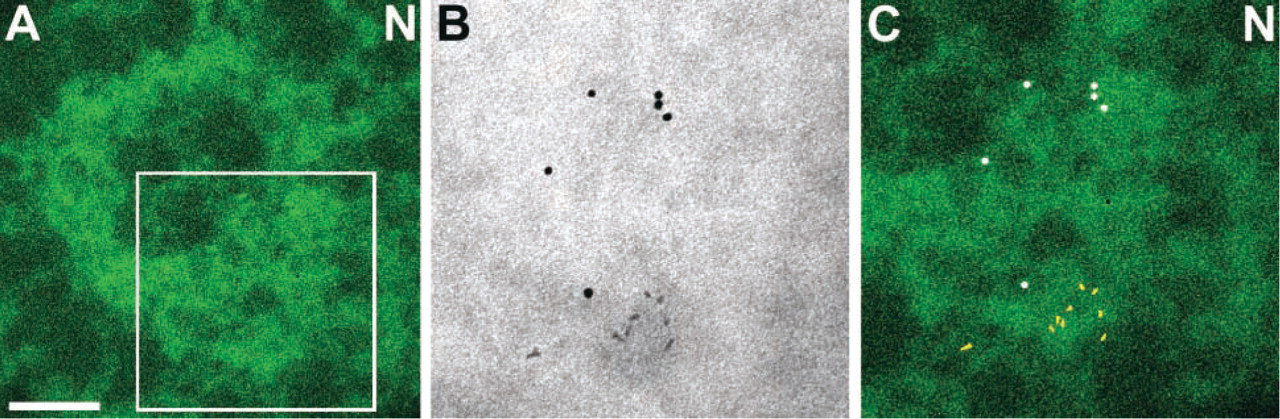
Double labeling of PML and CBP with gold and quantum dots. (
We observed that colloidal gold used for immuno-detection can be distinguished from the QDs on the basis of mass density and shape. This provides an opportunity for multiple labeling in EM studies. As an example of this application, we investigated the localization of the transcriptional co-activator CREB binding protein (CBP) with respect to the PML body, using a double-labeling technique. We have observed with ESI and in situ nanogold labeling that the CBP protein localizes primarily to the periphery of PML bodies and not to their core (our unpublished data). Here we labeled PML protein with an immunogold probe and CBP with a QD-streptavidin probe directed against a biotinylated secondary antibody (Figure 3). With sufficient magnification, the gold probes can be easily distinguished from QDs on the basis of electron density and shape. In the overlay of the high contrast brightfield image, which clearly shows the QD and gold distributions on the nitrogen elemental map (Figure 3C), we observe that a domain on the periphery of the ring-shaped PML body is enriched in CBP. The PML protein, as indicated by the colloidal gold spheres, is distributed throughout the ring structure.
Discussion
These data demonstrate the utility of the nanocrystals in conjunction with immunogold as probes for multiple-labeling EM techniques. The practical value of using QDs as ESI probes is twofold. First, because staining of cell sections is not required, the probe can be used in conjunction with elemental mapping of nitrogen and phosphorus in cell components. Elemental mapping yields far greater structural information relative to conventional TEM of stained sections. Because ESI does not require heavy atom stains, the artifacts associated with stains are avoided, such as the lack of uniformity of staining of structures that differ in biochemical composition. Second, the composition of QDs can be tuned so that elemental mapping can be employed to distinguish several probes, and this leads to the potential of multiple labeling of cell components.
The full potential of this class of probes is yet to be realized, because the ability to use chemical signatures with ESI to determine the co-localization of subcellular components hinges on the development of QDs of various chemical compositions. The core/shell configuration offers the choice of several atomic constituents, although the larger number of atoms in the core of nanocrystals results in an inherent advantage of the core vs the shell component. For the CdSe/ZnS material, cadmium provides the highest ESI sensitivity. The determinant criteria for an element suitable for energy-filtered mapping are the energy and the profile of its ionization edge. Ionization edges far from the zero loss peak are less favored than edges in the low-energy loss region of the spectrum. This is due to higher beam exposures required for edges that are farther out in the spectrum. Therefore, elemental maps of Cd are easier to obtain than those for Se. Moreover, the ionization edge should not overlap with the edge of another element of interest within the sample. Nanocrystals composed of CdTe (Wuister et al. 2003), GaSb (Muller-Kirsch et al. 2003), InGaAs/GaAs (Guffarth et al. 2003), and Fe2O3 (Lu et al. 2003) have been synthesized, and Te, Sb, In, As, and Fe are all elements that have appropriate ionization edges for obtaining ESI maps. Furthermore, doping nanocrystals with transition metal ions suitable for ESI, to achieve materials such as Co2+-doped ZnAl2O4 (Duan et al. 2003) and Mn2+-doped CdS/ZnS (Yang and Holloway 2003), is another method of creating novel probes. Doping techniques can be adjusted to produce up to 3-7 atom % of the dopant in a nanocrystal (Zhuang et al. 2003). For a nanocrystal consisting of 1500 atoms, 2% of the dopant would result in up to 30 atoms, which is theoretically within the limit of detection of ESI, for an element of high ESI sensitivity (Bazett-Jones and Hendzel 1999).
As conditions for nanocrystal growth are optimized for a variety of elemental components and bioconjugation of these materials becomes routine, QDs will attain prominence in the arsenal of probes for high-resolution mapping of biochemicals in macromolecular complexes visualized in vitro and in situ by ESI.
Footnotes
Acknowledgements
Supported by an operating grant to DPB-J from the Natural Sciences and Engineering Research Council. DPB-J holds a Canada Research Chair in Molecular and Cellular Imaging. GD is a Senior Postdoctoral Fellow of the Canadian Institutes of Health Research (CIHR).