
Abstract
Identification of cell types in tumor-associated stroma that are involved in the development of melanoma is hampered by their heterogeneity. The authors used flow cytometry and immunohistochemistry to demonstrate that anti–MART-1 antibodies can discriminate between melanoma and stroma cells. They investigated the cellular composition of the MART-1−, non-hematopoietic melanoma-associated stroma, finding it consisted mainly of Sca-1+ and CD146+ cells. These cell types were also observed in the skin and muscle adjacent to developing melanomas. The Sca-1+ cell population was observed distributed in the epidermis, hair follicle bulges, and tumor capsule. The CD146+ population was found distributed within the tumor, mainly associated with blood vessels in a perivascular location. In addition to a perivascular distribution, CD146+ cells expressed α-smooth muscle actin, lacked expression of endothelial markers CD31 and CD34, and were therefore identified as pericytes. Pericytes were found to be associated with CD31+ endothelial cells; however, some pericytes were also observed associated with CD31−, MART-1+ B16 melanoma cells that appeared to form blood vessel structures. Furthermore, the authors observed extensive nuclear expression of HIF-1α in melanoma and stroma cells, suggesting hypoxia is an important factor associated with the melanoma microenvironment and vascularization. The results suggest that pericytes and Sca-1+ stroma cells are important contributors to melanoma development.
An emerging theory in cancer biology proposes that melanoma development occurs from the clonal expansion of an epidermal melanocyte stem cell population that accumulates mutations in genes that control fundamental cellular functions such as cell division and apoptosis (Fang et al. 2005; Quintana et al. 2008; Schatton et al. 2008). However, the proliferation and expansion of this melanoma stem cell population do not occur as an isolated event. Rather, melanoma cells recruit and interact with a number of nontransformed, host-derived mesenchymal stroma cells that, together with an extracellular matrix meshwork, constitute the tumor stroma (Ruiter et al. 2002; Li et al. 2003). Increasing evidence supports the hypothesis that melanoma–stroma cell interactions are critical for tumor growth and progression. In response to heterotypic interactions with nearby melanoma cells, tumor-associated stroma cells release multiple cytokines and growth factors to create a rich paracrine microenvironment that fosters cancer proliferation, invasiveness, and metastasis (McAllister and Weinberg 2010). Therefore, the tumor-associated stroma has become an important focus of melanoma research with significant therapeutic implications (Udagawa and Wood 2010).
Tumor-associated stroma cells include cancer-associated fibroblasts (CAFs), smooth muscle cells, myofibroblasts, endothelial cells, pericytes, and inflammatory cells. The precise origin of tumor-associated stroma cells remains largely unknown, except for the inflammatory cells, whose source in the bone marrow is less contentious. Evidence from breast and prostate cancer studies suggests that stroma cells derive either from the local parenchyma where the tumors arise (McAllister and Weinberg 2010; Olumi et al. 1999; Muehlberg et al. 2009) or from direct recruitment of circulating mesenchymal precursor cells, whereupon they transdifferentiate into tumor-associated stroma cells (Placencio et al. 2010; Sangai et al. 2005; Guest et al. 2010). In addition, a third mechanism has been described involving local mesenchymal stem cell (MSC) transdifferentiation into different tumor-associated cell types (Spaeth et al. 2009; Karnoub et al. 2007).
The cellular composition of the melanoma-associated stroma has not been completely characterized. This is partly due to the heterogeneity exhibited by stroma cells, which hampers their unambiguous identification among the cancer cells (Huber et al. 2006; Perego et al. 2010; Klein et al. 2007). To overcome this issue and achieve reliable tumor versus stroma discrimination, different methodological approaches that include several transgenic mouse strains expressing green fluorescent protein (GFP) have been developed (Udagawa et al. 2006; Duda et al. 2004; Yang et al. 2003).
As an alternative approach, we have used the detection of antigens aberrantly expressed by tumor cells to discriminate them from the stroma. This strategy forms the basis of the clinical histopathological diagnosis of melanoma, which relies on the detection of cancer-specific antigens expressed by melanoma cells (Ohsie et al. 2008). Among the different melanoma-specific antigens, MART-1 exhibits a higher specificity for the assessment of primary and metastatic melanoma (Reinke et al. 2005; Zubovits et al. 2004; Ohsie et al. 2008; Yu et al. 1999; Fetsch et al. 1997; Shidham et al. 2001). MART-1, whose expression is restricted only to melanin-producing cells (Kawakami et al. 1994), is a type III transmembrane protein located in stage I to II early melanosomes (De Maziere et al. 2002). MART-1 immunostaining in clinical diagnoses allows for the identification of primary and metastatic melanocytic lesions with a sensitivity ranging from 72% to 92% and a specificity of 95% to 100% (Ohsie et al. 2008).
Although MART-1 constitutes one of the most important clinical markers employed for the histopathological assessment of melanoma, its value as an experimental marker to distinguish tumor cells from host-derived stromal cells, either by immunohistochemistry (IHC) or by flow cytometry, has not been reported in an experimental animal model.
In the present study, we report MART-1 to be reliable for tumor versus stroma discrimination in a melanoma mouse model. We demonstrate that the host-derived, melanoma- associated MART-1− stroma fraction is composed of different mesenchymal subpopulations, of which CD146+ and Sca-1+ subpopulations predominated. We further demonstrate that the CD146+ subpopulation corresponds to pericytes, which in tumor blood vessels associate with endothelial cells and also with blood vessel–forming melanoma cells under a hypoxic tumor microenvironment.
Materials and Methods
Tumor Cell Line and Culture Conditions
The murine B16-F10 melanoma cell line (henceforth referred to as the B16 melanoma cell line, ATCC no. CRL-6475; ATCC, Manassas, VA) was cultured in DMEM supplemented with 10% fetal bovine serum (FBS), Glutamax 2 mM, penicillin 100 U/ml, streptomycin 100 µg/ml, and amphotericin 0.25 µg/ml (all from GIBCO, Invitrogen; Carlsbad, CA) and was incubated at 37C in a 5% CO2 atmosphere.
Mice
CB17/lcr-Prkdc scid mice were purchased from Charles River (Wilmington, MA). CByJ.B6-Tg (UBC-GFP) mice were obtained from the Jackson Laboratory (Bar Harbor, ME). CB17/lcr-Prkdc scid /CByJ.B6-Tg (UBC-GFP)–(GFP/SCID mice) were generated by breeding SCID mice with GFP mice. F1 progeny were screened and selected for GFP expression by flow cytometry. The F2 generation, produced from the cross of F1 GFP+ mice, was screened for a mutation on the PRKDC locus as follows: Genomic DNA was isolated from tails using the DNeasy blood and tissue kit (Qiagen; Valencia, CA). The PRKDC locus was amplified from genomic DNA using the forward primer 5′-GGAAA- AGAATTGGTATCCAC-3′ and the reverse primer 5′-AGTTATAACAGCTGGGTTGGC-3′. SCID mutation generates an AluI restriction site in the amplified fragment (Araki et al. 1997); therefore, amplified fragments were digested with AluI (Invitrogen) and resolved by electrophoresis in 3.5% LE agarose gel. Mice homozygous for the PRKDC mutation were selected and crossed to generate the F1 GFP/SCID transgenic mice used in our studies.
All animal studies were performed under Institutional Animal Care and Use Committee (IACUC)–approved protocols, according to institution regulations in facilities approved by the Association for Assessment and Accreditation of Laboratory Animal Care (AAALAC) and in accordance with regulations of the United States Department of Agriculture, Department of Health and Human Services, and the National Institutes of Health.
Tumor Induction
B16 melanoma cell cultures, 90% confluent at the second or third passage, were detached with 0.25% trypsin (GIBCO), washed with Dulbecco’s phosphate-buffered saline (DPBS; Lonza, Walkersville, MD), and resuspended in DPBS at a final concentration of 1 × 10⁷ cells per ml. Tumors were induced by subdermally injecting 100 µl of a B16 cell suspension, containing 1 × 10⁶ cells, to the shaven rear flank of anesthetized GFP+/SCID or GFP–/SCID mice. An immunodeficient mouse model was chosen because we sought to investigate the specific contribution of the non-hematopoietic tumor fraction to melanoma stroma development. We decided to focus on the non-hematopoietic fraction because previous reports suggest that a stroma progenitor population may reside within the CD45– fraction of the tumor-associated stroma (Udagawa et al. 2006). In addition, the CD45– fraction of the tumor stroma might contain vascular/endothelial progenitor cells of interest (Kerbel 2008).
Tissue Processing
Tumors were removed from animals and processed after 7 or 14 days of induction. These time points were chosen because they represent the early and late phases of B16-induced melanoma development in our SCID mouse model (Seo et al. 1998). Tumor processing proceeded as follows: The immediately adjacent skin, peritumoral fat, and muscle were dissected from the tumoral mass and processed separately. Each tissue was minced into ~2-mm pieces and enzymatically digested using a digestion buffer consisting of Dispase grade II (1 U/ml; Roche Applied Science, Penzberg, Germany), type I and IV collagenase (100 U/ml; GIBCO), and type I DNAse (50 U/ml; Sigma, St. Louis, MO) diluted in Hank’s buffered salt solution (HBSS). Digestion buffer was applied at a ratio of 5 ml per gram of tissue. After 35 min of incubation at 37C, the medium was removed and stored on ice. The remaining undigested tissue was washed in HBSS and reincubated in digestion buffer for another 15 min. The products of both digestions were pooled, triturated with a 10-ml pipette, and filtered through a 70-µm cell strainer (BD Bioscience; Franklin Lakes, NJ). The resulting suspension was washed and incubated in red blood cell lysis buffer (155 mM NH4Cl, 10 mM KHCO3, 0.1 mM EDTA), washed again, and resuspended in DPBS + 10% FBS for cell counting and viability determination. Subcutaneous adipose tissue from naive mice was digested as follows: After mincing, the fat was washed with prewarmed DMEM and transferred to vented-cap culture flasks containing digestion buffer in DMEM. The digestion was performed at 37C in a CO2 atmosphere of 5%.
Bone Marrow Cell Isolation
Bone marrow (BM) cells were isolated by flushing the femur and tibia with HBSS using a 25-G needle. The harvested cell suspension was triturated with a 10-ml pipette and filtered through a 70-µm cell strainer (BD Bioscience). After red blood cell lysis with NH4Cl buffer, the BM cells were resuspended in DPBS + 10% FBS for counting and viability determination.
Immunomagnetic Depletion of Hematopoietic Cells from Tumors and Other Tissues
To study the contribution of the non-hematopoietic tumor-associated stroma to melanoma development, tissues were depleted of hematopoietic cells as follows: After blocking with rat serum (eBioscience; San Diego, CA), the suspension was incubated for 30 min with an APC-rat anti-mouse CD45 antibody (clone 30-F11; eBioscience) diluted in binding buffer (DPBS pH 7.4, EDTA 2 mM, 0.5% [v/v] bovine serum albumin [BSA]). Thereafter, the suspension was washed and incubated for 15 min with a goat anti-rat IgG microbead antibody (Miltenyi Biotec, GmbH, Bergisch Gladbach, Germany) diluted 1:5 in binding buffer. Then, the cells were washed and passed through an LD-negative depletion column following the manufacturer’s instructions (Miltenyi Biotec). Depletion was confirmed by flow cytometry analysis.
B16: Bone Marrow Mixed Suspensions
The efficiency of MART-1 to discriminate melanoma cells from non-tumor cells was tested in a series of experiments involving cellular mixtures of B16 cells with BM cells. BM cells were chosen because of their heterogeneous cellular constitution, which may resemble to some extent the stroma population within tumors (Roorda et al. 2009; Direkze and Alison 2006). BM cells derived from C.B-17 SCID mice were mixed with B16 cells at the following ratios: 0% to 100%, 30% to 70%, 50% to 50%, and 100% to 0%. Then, each suspension was labeled for MART-1 and analyzed by flow cytometry.
Antibodies
For flow cytometry analysis, the following primary antibodies were used: Alexa 488 rabbit anti-GFP (1:500 diluted; Molecular Probes, Carlsbad, CA); APC–anti–Sca-1 (clone Dj), APC–anti–c-Kit (clone ACK2, eBioscience, both at 2 µg/ml), PE-Cy7–anti–c-Kit (clone 2B8), PE-Cy7–anti–Sca-1 (clone D7), PE-Cy7–anti CD34, and PerCP-Cy 5.5 anti–CD45 PE–anti–Sca-1 (clone E13-161.7, all from BD Bioscience and used at 2 µg/ml); rabbit anti–α-smooth muscle actin (α-SMA) (Abcam; Cambridge, MA; 2.5 µg/ml); mouse anti–MART-1 [DT101 + BC199] (Abcam; 1 µg/ml); and biotin rat anti-CD146 (Miltenyi Biotec, 1:11 diluted). FITC and PE-goat anti-mouse IgG (Abcam; 2.5 µg/ml) and FITC goat anti-biotin (Miltenyi Biotec; 1:11 diluted) secondary antibodies were used. For immunohistochemistry, the following antibodies in the following dilutions were used: mouse anti–MART-1, 1:20; FITC goat anti-mouse IgG, 1:200; biotin rat anti-mouse CD146, 1:10 (Miltenyi Biotec) rat anti–Sca-1, 1:500 (Abcam); rabbit anti–c-Kit, 1:200 (Abcam); mouse anti–HIF-1α, 1:300 (Abcam); rat anti–CD31, 1:50 (eBioscience); rabbit anti-GFP, 1:350; Alexa Fluor 568 goat anti-rat IgG, 1:500; Alexa Fluor 568 goat–anti-rabbit IgG, 1:250; and streptavidin Alexa Fluor 488, 568, 1:500 (all from Molecular Probes), as well as FITC anti-biotin, 1:20 (Miltenyi Biotec). For every antibody, isotype-matched fluorochrome-conjugated antibodies with irrelevant antigen specificities were used as controls.
Analysis of Tumors Induced on GFP/SCID Mice and Fluorescence-Activated Cell Sorting of GFP– Cells
Tumors were induced by subcutaneously injecting 1 × 10⁶ B16 cells in the shaven rear flank of anesthetized GFP/SCID mice. After 14 days of induction, tumors were processed to a unicellular cell suspension following the protocol previously described, and the percentage of GFP+ and GFP– cells was analyzed by flow cytometry. Gates were established using appropriate fluorescence minus one controls (FMOC) consisting of GFP– B16 cells as negative control and peripheral blood cells derived from GFP+/SCID mice as positive control. Dead cells were excluded by 7-amino-actinomycin (BD Bioscience), and doublets were excluded by gating on FSC-H versus FSC-W and SSC-H versus SSC-W. The GFP– population was sorted from the tumor cell suspension using a FACS Aria cell sorter (BD Bioscience) and was further stained for MART-1 following the protocol described below.
MART-1 Labeling and Flow Cytometry Analysis
For MART-1 labeling, the cells were fixed 10 min in 2% (v/v) paraformaldehyde in PBS, washed in permeabilizing buffer (0.2% [v/v] saponin in PBS), and incubated in permeabilizing buffer for 30 min at 4C. After three washes, the cells were incubated with the anti–MART-1 antibody diluted in permeabilizing buffer. After 30 min, the cells were washed and incubated with a secondary antibody. After the final incubation, the cells were washed, resuspended in DPBS, and analyzed by flow cytometry using a BD CANTO II flow cytometer (BD Bioscience). Analyses were performed using Diva software (BD Bioscience) and F
Immunohistochemistry
Tumors were divided by mincing into approximately <2-mm pieces, fixed in 4% (v/v) paraformaldehyde in DPBS for 12 hr, and embedded in paraffin for sectioning. For deparaffinization, tissue sections were baked for 30 min at 65C in an oven and then immersed in two xylene baths of 10 min each. After rehydration with decreasing ethanol immersion series, heat-induced antigen retrieval was performed by incubating the tissue sections in sodium citrate (pH 6.0) antigen retrieval buffer and prewarmed at 97.5C in a standard water bath. After 20 min of antigen retrieval, tissues were washed and permeabilized for 15 min with saponin 0.2% (v/v) in PBS; blocked 30 minutes with PBS containing 10% (v/v) normal serum of the species from which the primary antibody was obtained, 2% (w/v) BSA, and glycine 0.3 M; and incubated overnight with the primary antibody diluted in DPBS with 0.2% (v/v) Tween 20 and 2% (w/v) BSA. After washing, tissues were incubated with the secondary antibody and mounted in a Vectashield mounting medium containing 4′,6-diamidino-2-phenylindole (DAPI; Vector Laboratories, Burlingame, CA) for DNA staining. Tissue sections were visualized in a Nikon ECLIPSE TE 2000-U fluorescence inverted microscope (Nikon; Melville, NY). Images were acquired with a high-resolution RT monochrome SPOT digital camera (Diagnostic Instruments; Sterling Heights, MI) and processed using Image J (National Institutes of Health; Bethesda, MD) and Adobe Photoshop 11.0.2 (Adobe Systems; San Jose, CA).
Statistical Analysis
Differences in the tumor and stromal fractions were assessed with a two-way analysis of variance (ANOVA), using a Bonferroni posttest to ascertain significance. The percentages of the different stroma subpopulations were compared to their respective controls with one-way ANOVA, and a Dunnett posttest was used to determine significance. Statistical analyses were performed using GraphPad software (GraphPad Software; La Jolla, CA), and p values <0.05 were required for significance.
Results
MART-1 expression discriminates B16 cells from non-tumor cells
MART-1 was highly expressed by B16 cells in culture (98.7 ± 1.4%; Fig. 1A), independent of their subculture passage (passages 2–9; Fig. 1B). In contrast, MART-1 expression in tissue samples from healthy control mice was less than 1% in BM, adipose tissue, and muscle (Fig. 1C–E) and 2.6 ± 0.9% in skin (Fig. 1F).
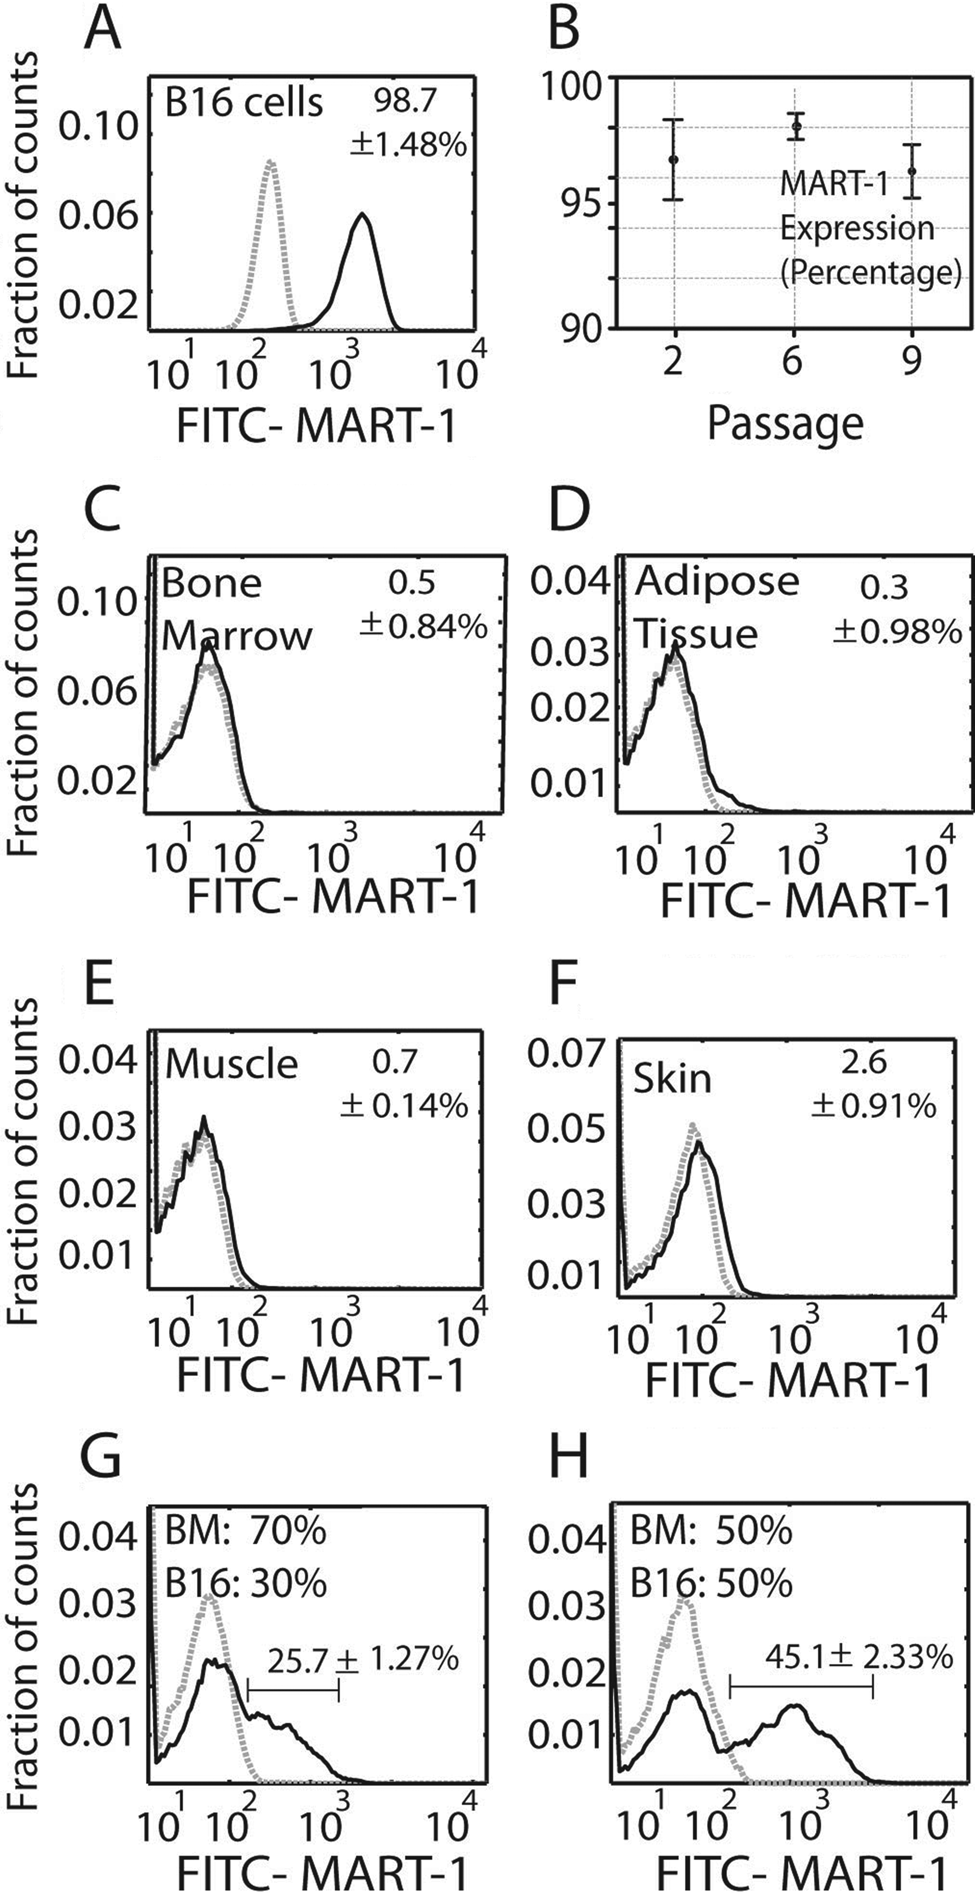
(A) Histogram showing MART-1 expression in B16 cells. The data represent the mean value ± standard deviation (SD) of cells expressing MART-1 at all subculture passages. (B) Plot showing the percentage of B16 cells expressing MART-1 at the separate culture passages tested. Each value represents the mean ± SD of cells expressing MART-1 at a given subculture passage. (C–F) Percentage of cells expressing MART-1 bone marrow (C), muscle (D), adipose tissue (E), and skin (F). (G, H) MART-1 discrimination of B16 cells from heterogeneous cell mixtures. B16 cells were mixed at 30:70% (G) and 50:50% (H) ratios with bone marrow cells (B16: BM) and further stained for MART-1. Gray dashed histograms represent controls stained with isotype antibodies of irrelevant specificity. Black lines correspond to FITC–MART-1. Expression threshold was determined as the level of fluorescence greater than 99% of the isotype-matched control antibody-labeled cells. The data were normalized against the isotype control, and the mean value ± SD is expressed.
We next mixed known proportions of B16 cells and BM cells and used MART-1 antibody labeling to differentiate between these two populations by flow cytometry. From a mixture of 30% B16 and 70% BM cells, 25.7 ± 1.2% of the cells were identified as MART-1+ (Fig. 1G). From a mixture of 50% B16 and 50% BM cells, 45.1 ± 2.3% were identified as MART-1+ (Fig. 1H). In cell suspensions derived from 14-day-old enzyme-digested tumors, we found that MART-1 identified 55.3 ± 3.2% of the population, whereas 40.55 ± 7.8% of the cells were MART-1−.
MART-1 expression discriminates B16 cells from stroma cells in tumors
To test the specificity of MART-1 for B16 cell discrimination among tumor-associated stroma, we used a GFP/SCID mouse model. GFP– B16 cells were injected into GFP+ host animals, and after 14 days of induction, tumors were harvested, enzymatic digested, and analyzed by flow cytometry for GFP expression. We observed that 37.4 ± 5.2% of the cell population was GFP+ (Fig. 2C), whereas the remaining 63.4 ± 7.7% was GFP– (Fig. 2C). When sorted and labeled by fluorescence-activated cell sorting (FACS), 93.3% of the GFP– population expressed MART-1, confirming that the GFP– fraction corresponded to B16 cells (Fig. 2D).
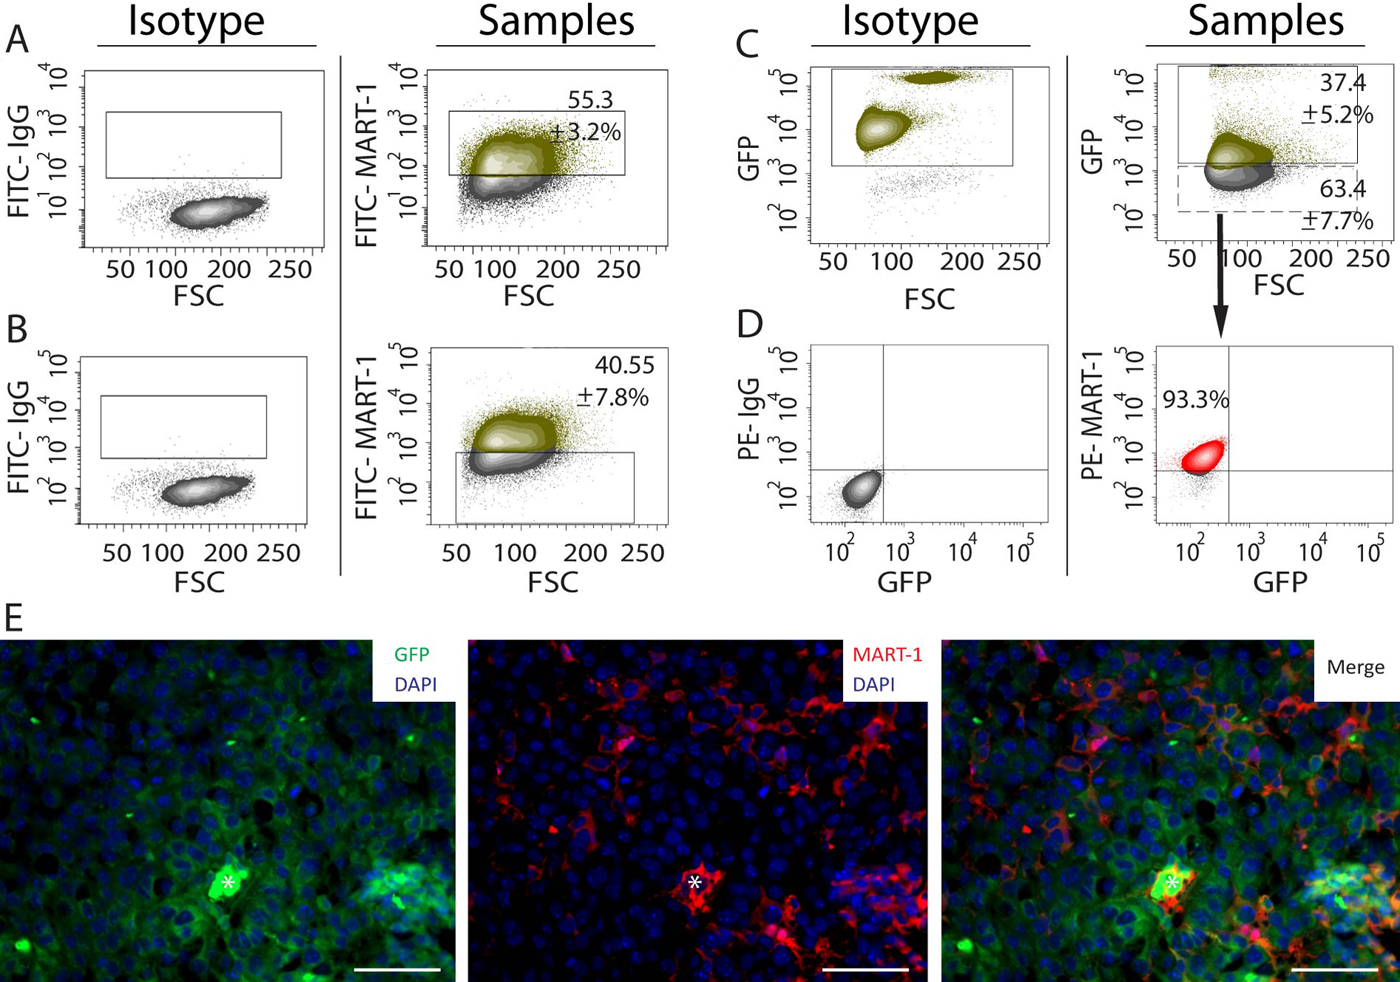
(A) Dot plot analysis showing the percentage of MART-1+ cells in cell suspensions derived from B16-induced melanomas. The gate in the right panel was set using an appropriate fluorescence minus one (FMO) isotype control (left panel). The green-labeled population corresponds to the MART-1+ fraction, whereas the gray population corresponds to the MART-1− fraction. (B) Left panel: FMO isotype control used to set the gates for FITC–MART-1 in the right panel. Right panel: Percentage of MART-1− cells in tumor cell suspensions derived from B16-induced melanomas. (C) Left panel: Peripheral blood from green fluorescent protein–positive (GFP+) mice was used as positive control to set the gate for GFP expression shown in the right panel. Right panel: Percentage of cells expressing GFP on tumor cells suspensions derived from B16 melanomas induced in GFP+/SCID mice. The green population corresponds to the GFP+ fraction, whereas the gray population corresponds to the GFP– fraction. (D) Left panel: FMO isotype controls used to set the gates shown for the right panel. Right panel: The MART-1− population shown in C (manually drawn dashed rectangle) was sorted by fluorescence-activated cell sorting (FACS), labeled for MART-1, revealed with a PE-conjugated antibody, and analyzed by flow cytometry, gating PE–MART-1 versus GFP. (E) Immunohistochemistry of a representative B16 melanoma induced in a GFP/SCID mouse and labeled for GFP (left), MART-1 (center), and FITC/MART-1 (right panel). Nuclei were stained blue with DAPI. White asterisk is positioned over erythrocytes located at the center of a blood vessel transversely cut. Scale bar: 50 µm.
MART-1 suitability for tumor from stroma discrimination was also investigated by IHC. When tumors induced in GFP/SCID mice were co-labeled for MART-1 and GFP, MART-1 expression was observed restricted to GFP– cells only (Fig. 2E). Conversely, GFP expression was not observed in MART-1+ cells. Therefore, MART-1/GFP co-labeling precisely discriminated B16 cells from surrounding GFP+ stroma in our B16-induced melanoma model.
Mesenchymal subpopulations expressing stem cell markers are present in B16 melanoma-associated stroma composition
We used the flow cytometry gating strategy depicted in Figure 3 to investigate the contribution of the tumor-associated stroma to melanoma total cell composition during the early and late phases of melanoma development. As observed in Figure 4A,B, there was a progressive increment in tumor mass and diameter from the early to the late phase of melanoma development. Using MART-1 antibody labeling and flow cytometry analysis, we found that after 7 days of tumor development, 44 ± 6.2% of the cell population were MART-1+ melanoma cells, whereas the remaining 56 ± 6.2% were MART-1− stromal cells (Fig. 4C). After 14 days, 55.3 ± 3.2% of the cell population were MART-1+, whereas 40.5 ± 7.8% of the cells were MART-1− (Figs. 3C and 4C). No significant difference was found in the percentage of MART-1+ and MART-1− cells observed between 7 and 14 days of tumor development (p>0.05), suggesting both fractions are required throughout melanoma development.
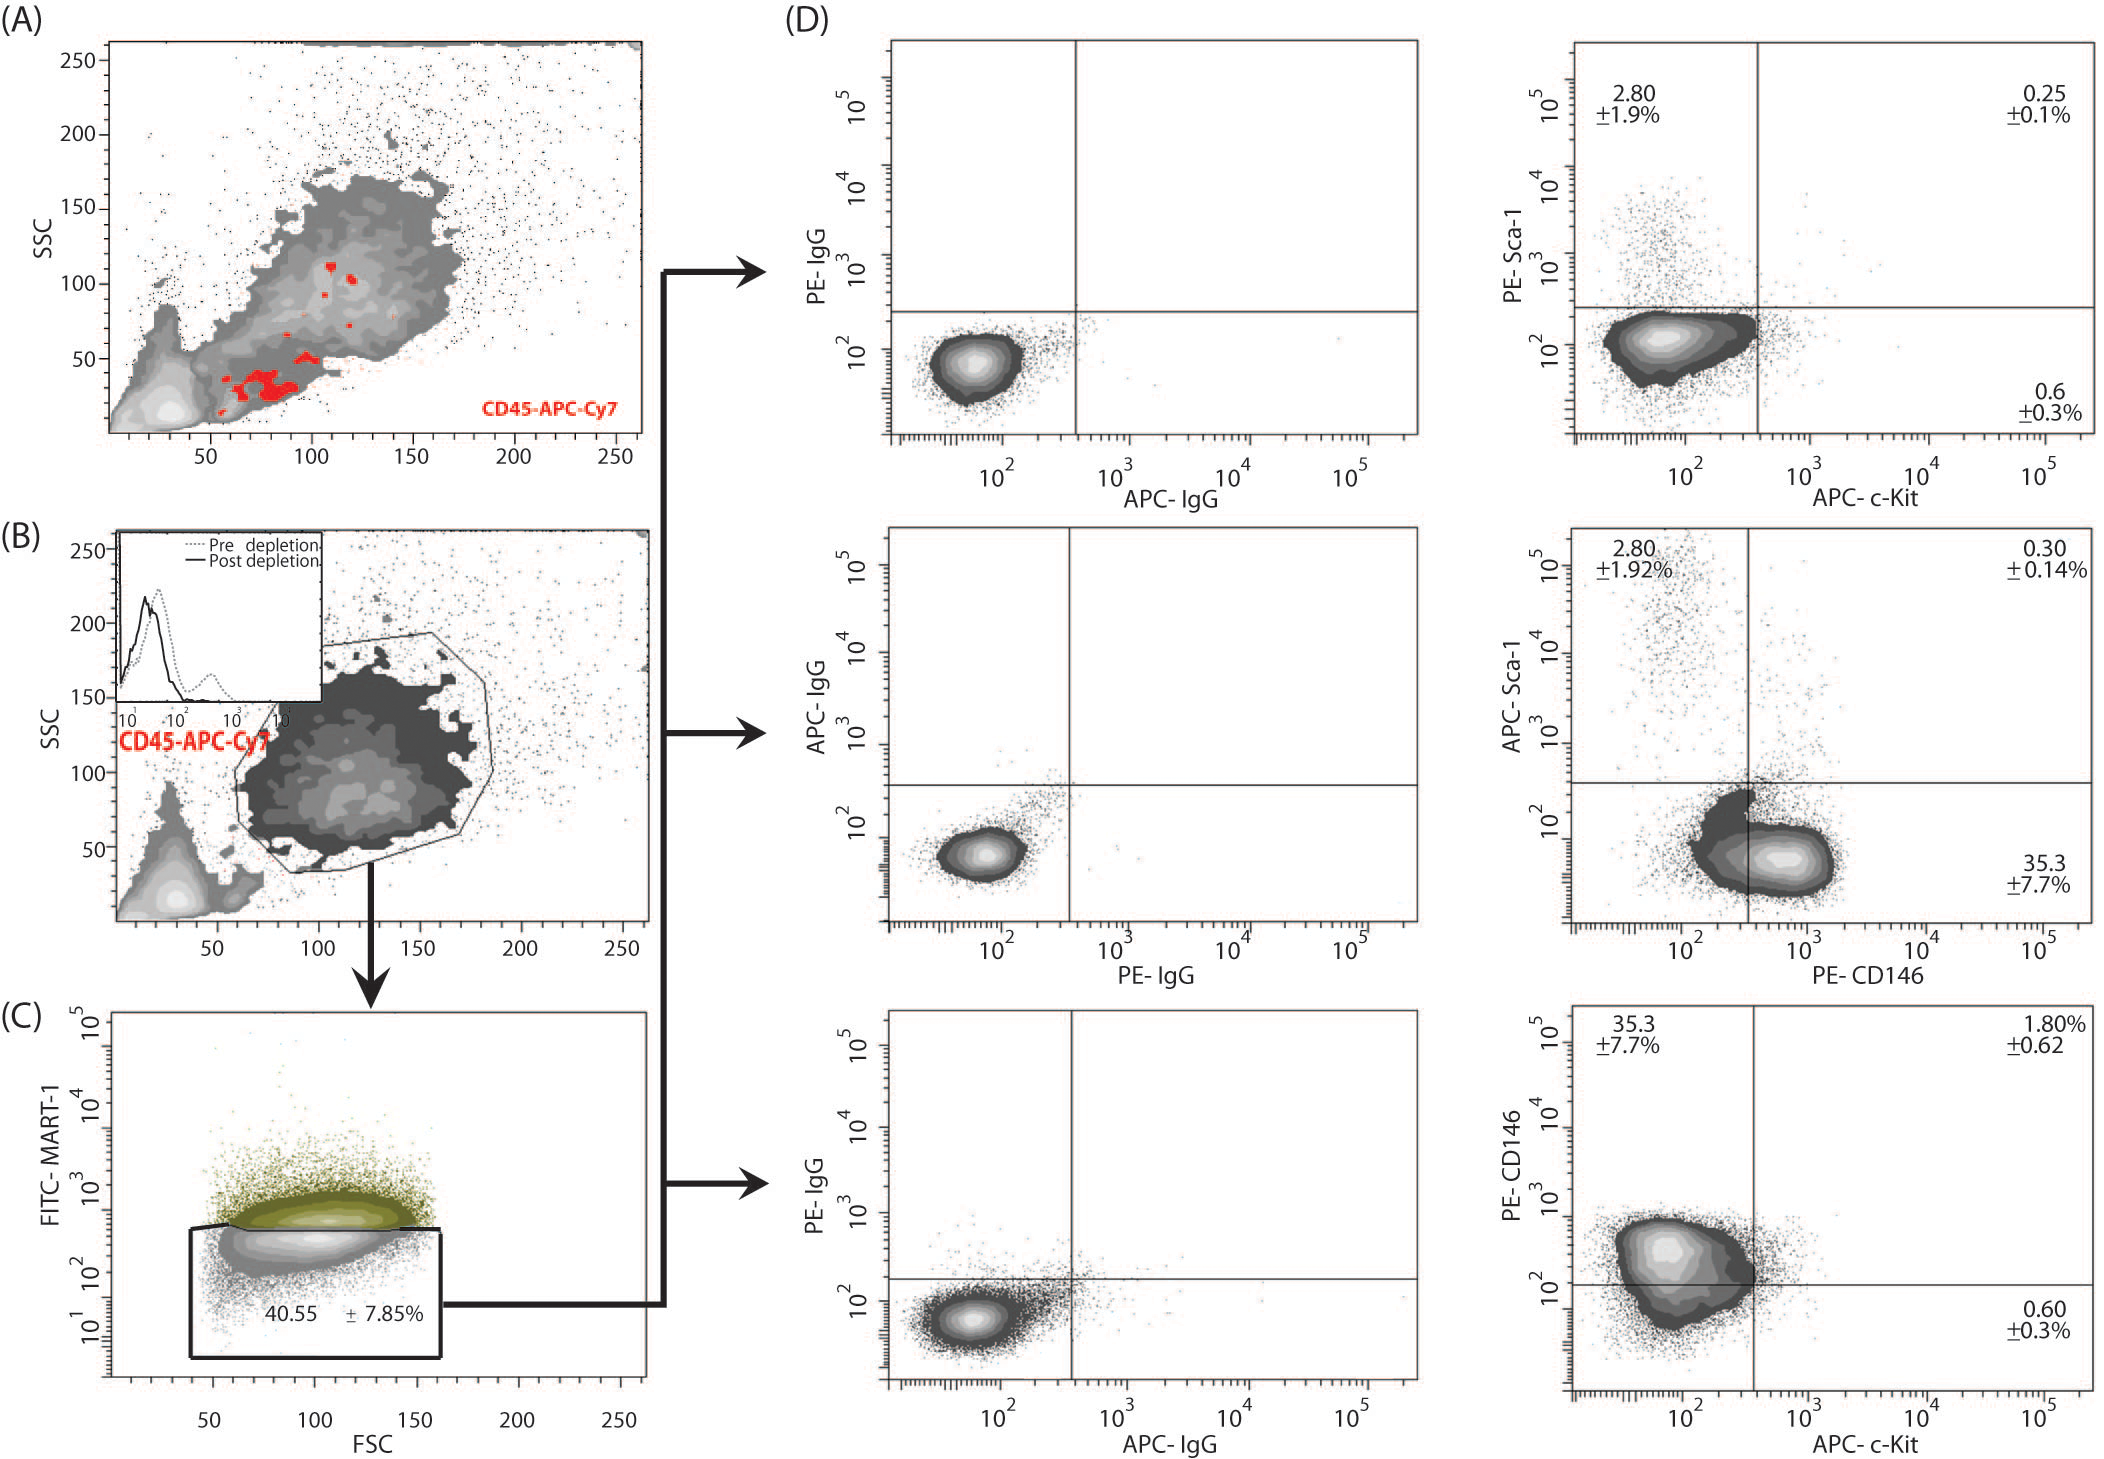
Dot plot analysis of the MART-1− stromal fraction for the identification of putative stromal stem cells in B16-induced melanoma tumors. (A) Side versus forward light scatter plot of a B16-derived tumor cell suspension. (B) Before analysis for MART-1 expression and stromal stem cells, the tumor cell suspension was depleted of its hematopoietic CD45+ fraction using magnetic beads. The insert shows the histogram of the tumor suspension prior to depletion (gray dashed line) and after CD45 depletion (solid black line). (C) The resulting hematopoietic-depleted population was then gated against MART-1, and the negative population was selected for further analysis. (D) Analysis of the subpopulations based on the pattern of expression of Sca-1, c-Kit, and CD146 in the stromal fraction. The MART-1− population is plotted against the antibodies of interest. Positive reactivity for each antibody is defined as the level of fluorescence greater than 99% of the isotype-matched control antibodies (left panels).
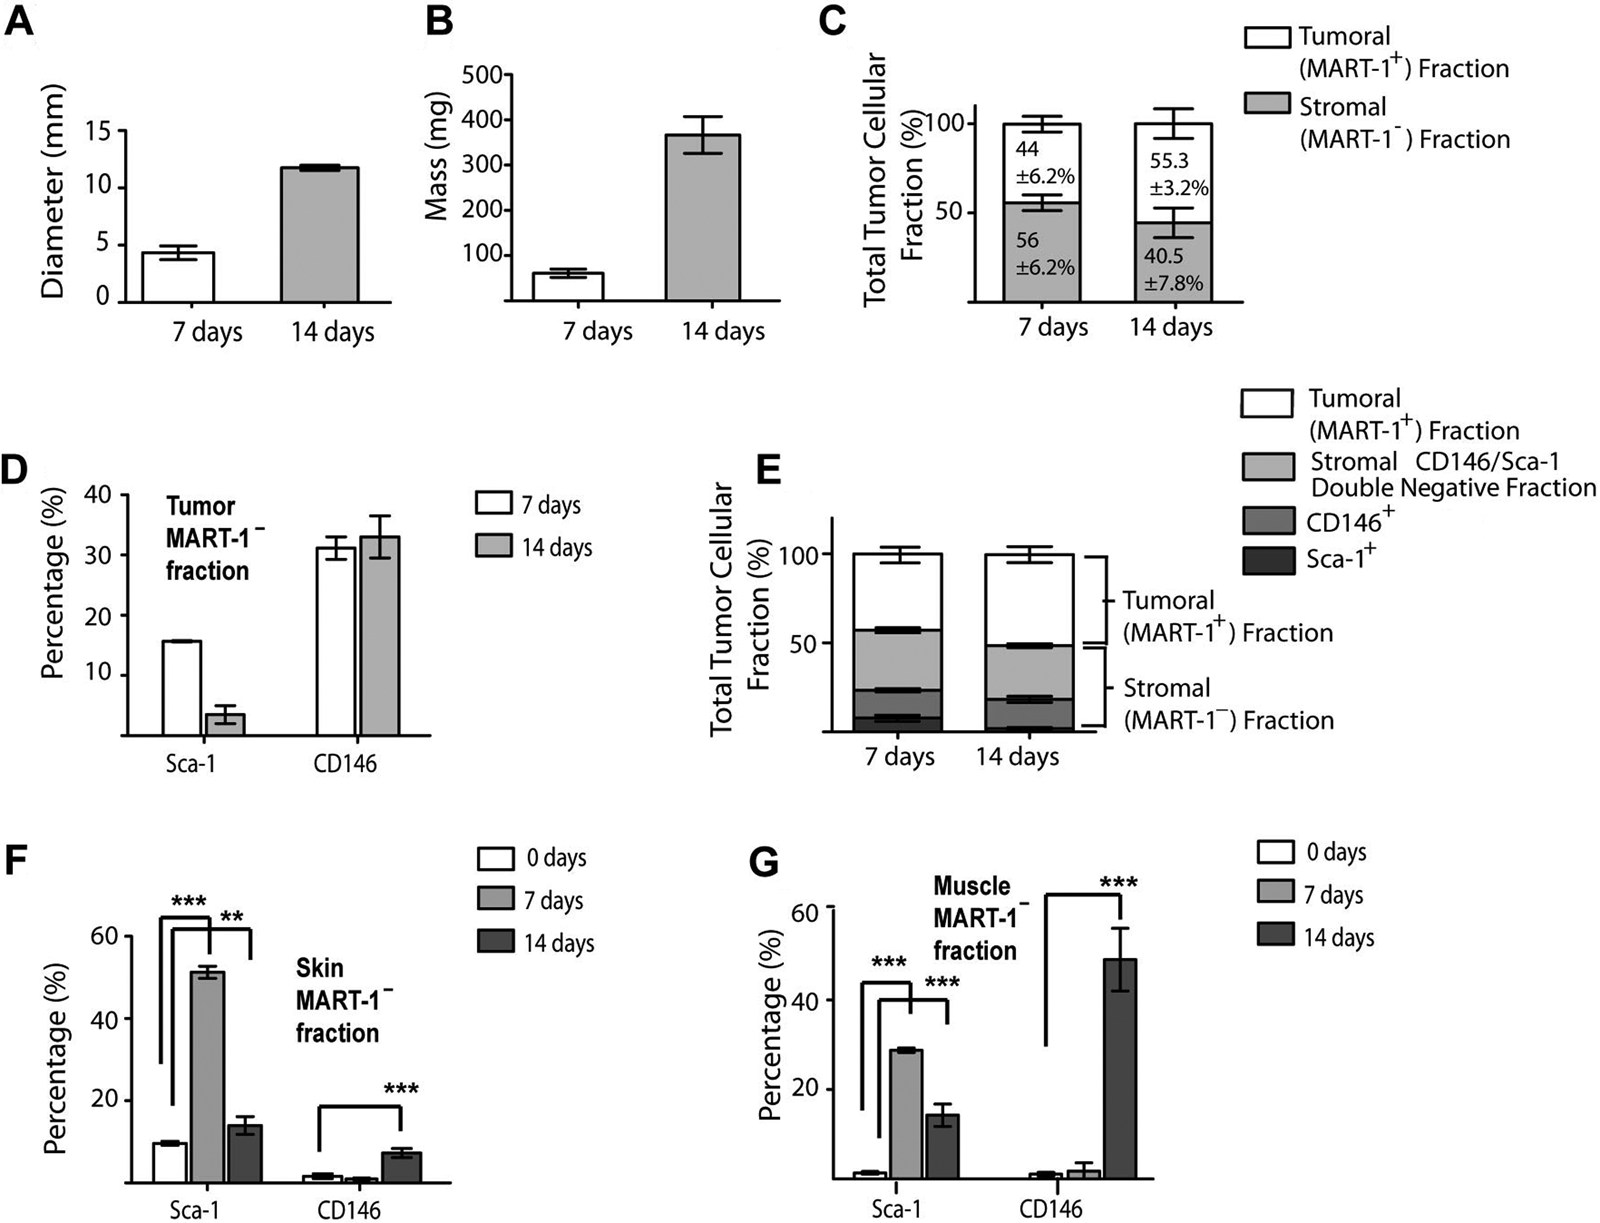
(A, B) Bar graphs showing the mean diameter (A) and mass (B) of 7- and 14-day-old tumors. (C) The tumor fraction expressed as total number of tumoral (MART-1+) or stromal (MART-1−) cells in B16-induced melanoma at 7 and 14 days after tumor induction. Light gray bars represent the stromal MART-1− fraction, whereas the MART-1+ tumoral fraction is represented by white bars. (D) Percentage of the Sca-1+ and CD146+ subpopulations in the MART-1−, CD45– stromal fraction of 7- and 14-day-old tumors. (E) Bar graph as in C, showing the subdivision of the tumor cell suspension into tumoral MART-1+ fraction (white) and stroma fractions (gray bars). The stroma fraction is further subdivided into the Sca-1+ (dark gray), CD146+ (medium gray), and Sca-1−/CD146– double-negative fraction (light gray). (F, G) Percentage of the Sca-1+ and CD146+ subpopulations in the MART-1− stroma fraction of skin (F) and muscle (G) immediately adjacent to the developing tumors at 7 (n=4, light gray) and 14 (n=6, medium gray) days. Significance was determined by comparing the values obtained from tumor-stimulated tissues against skin or muscle derived from wild-type mice (white bars). Data expressed as mean ± SD. **p<0.001. ***p<0.0001.
We next investigated the MART-1− stromal fraction of B16-induced melanomas for the presence of putative mesenchymal stem cell subpopulations. Putative mesenchymal stromal stem cell subpopulations were identified by flow cytometry as those cells co-expressing the stem cell markers Sca-1, CD146, and c-Kit in the non-hematopoietic (CD45–), MART-1− stromal fraction (Fig. 3A,B). Six subpopulations were identified (Fig. 3D and Table 1), among which c-Kit–, Sca-1−, CD146+ (henceforth CD146+) and c-Kit–, CD146–, Sca-1+ (henceforth Sca-1+) subpopulations predominated.
Putative Stromal Stem Cell Subpopulations Identified in the MART-1− Stroma Fraction of the Tumor and Surrounding Skin and Muscle of 7- and 14-Day-Old B16-induced Melanomas
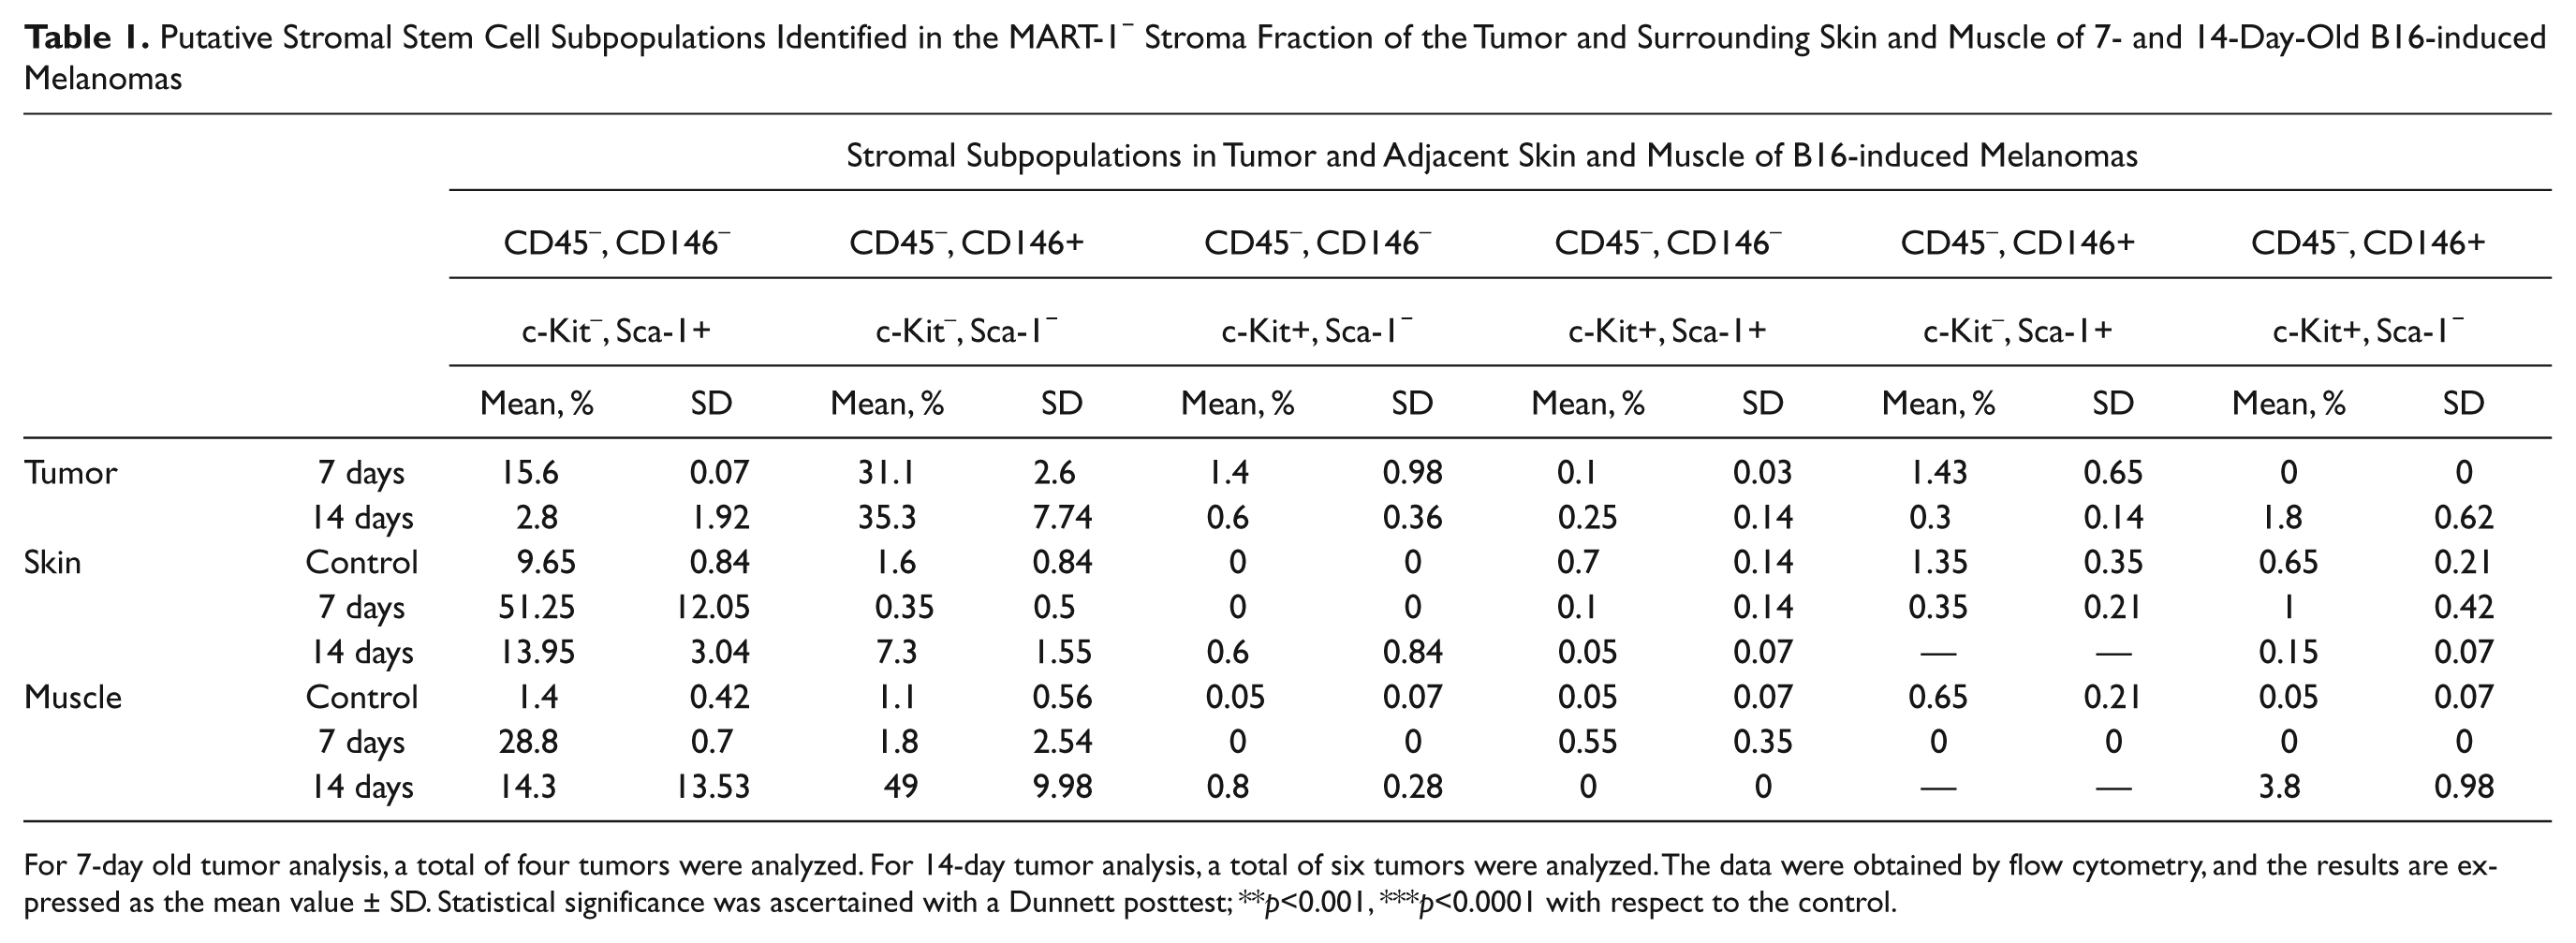
For 7-day old tumor analysis, a total of four tumors were analyzed. For 14-day tumor analysis, a total of six tumors were analyzed. The data were obtained by flow cytometry, and the results are expressed as the mean value ± SD. Statistical significance was ascertained with a Dunnett posttest; **p<0.001, ***p<0.0001 with respect to the control.
The Sca-1+ subpopulation accounted for 15.6 ± 0.07% of the total tumor-associated stromal cells in 7-day-old tumors (Table 1 and Fig. 4D,E). This subpopulation decreased to 2.8 ± 1.92% after 14 days of tumor induction (Fig. 4D). The CD146+ subpopulation contributed to more than 30% of the tumor-associated stroma at both 7 and 14 days of tumor development (see Table 1 and Fig. 4D,E).
Skin and muscle surrounding the tumors contain a high percentage of Sca-1+ and CD146+ cells
Skin and muscle tissues closely interact with developing melanomas (Suppl. Fig. S1). Therefore, these tissues were investigated for the presence of a putative stromal stem cell subpopulation. Of six different subpopulations observed in cell suspensions derived from skin and muscle tissues adjacent to 7- and 14-day-old melanomas, the Sca-1+ and CD146+ subpopulations predominated (Table 1).
The Sca-1+ subpopulation was significantly increased in skin and muscle adjacent to the developing tumor at both 7 and 14 days of tumor development compared to healthy controls (p<0.001; Table 1 and Fig. 4F,G). In skin, the Sca-1+ subpopulation decreased from 7 to 14 days of tumor development (51.2 ± 2.05% and 13.95 ± 3.04%, respectively). This was also observed in muscle, where Sca-1+ cells composed 28.8 ± 0.70% of the population after 7 days (Table 1 and Fig. 4G) and later decreased to 14.3 ± 3.53% after 14 days (Fig. 4G).
The percentage of CD146+ cells in the skin and muscle adjacent to the developing tumor was significantly higher after 14 days of tumor development compared to controls (p<0.001; Table 1 and Fig. 4G). However, no significant difference from controls was observed after 7 days (p>0.05; Table 1). In skin, the CD146+ subpopulation increased significantly after 14 days compared to control skin (7.3 ± 1.55% and 1.6 ± 0.85%, respectively; p<0.0001; Table 1 and Fig. 4F). In muscle, a similar observation was made, where after 14 days, the percentage of CD146+ cells increased significantly compared to control muscle (1.1 ± 0.56% and 49 ± 9.98%, respectively; p<0.0001; Table 1 and Fig. 4G).
Sca-1+ and CD146+ subpopulations are differentially distributed in B16 melanomas
The presence of the Sca-1+ and CD146+ subpopulations was confirmed by IHC analysis of paraffin-embedded whole tumor sections. In skin, the Sca-1+ subpopulation was observed distributed in the epidermis and closely associated with hair follicle bulges (Fig. 5A). In the tumor, the Sca-1+ subpopulation was abundantly distributed throughout the tumor capsule, especially near the developing melanoma (Fig. 5B).
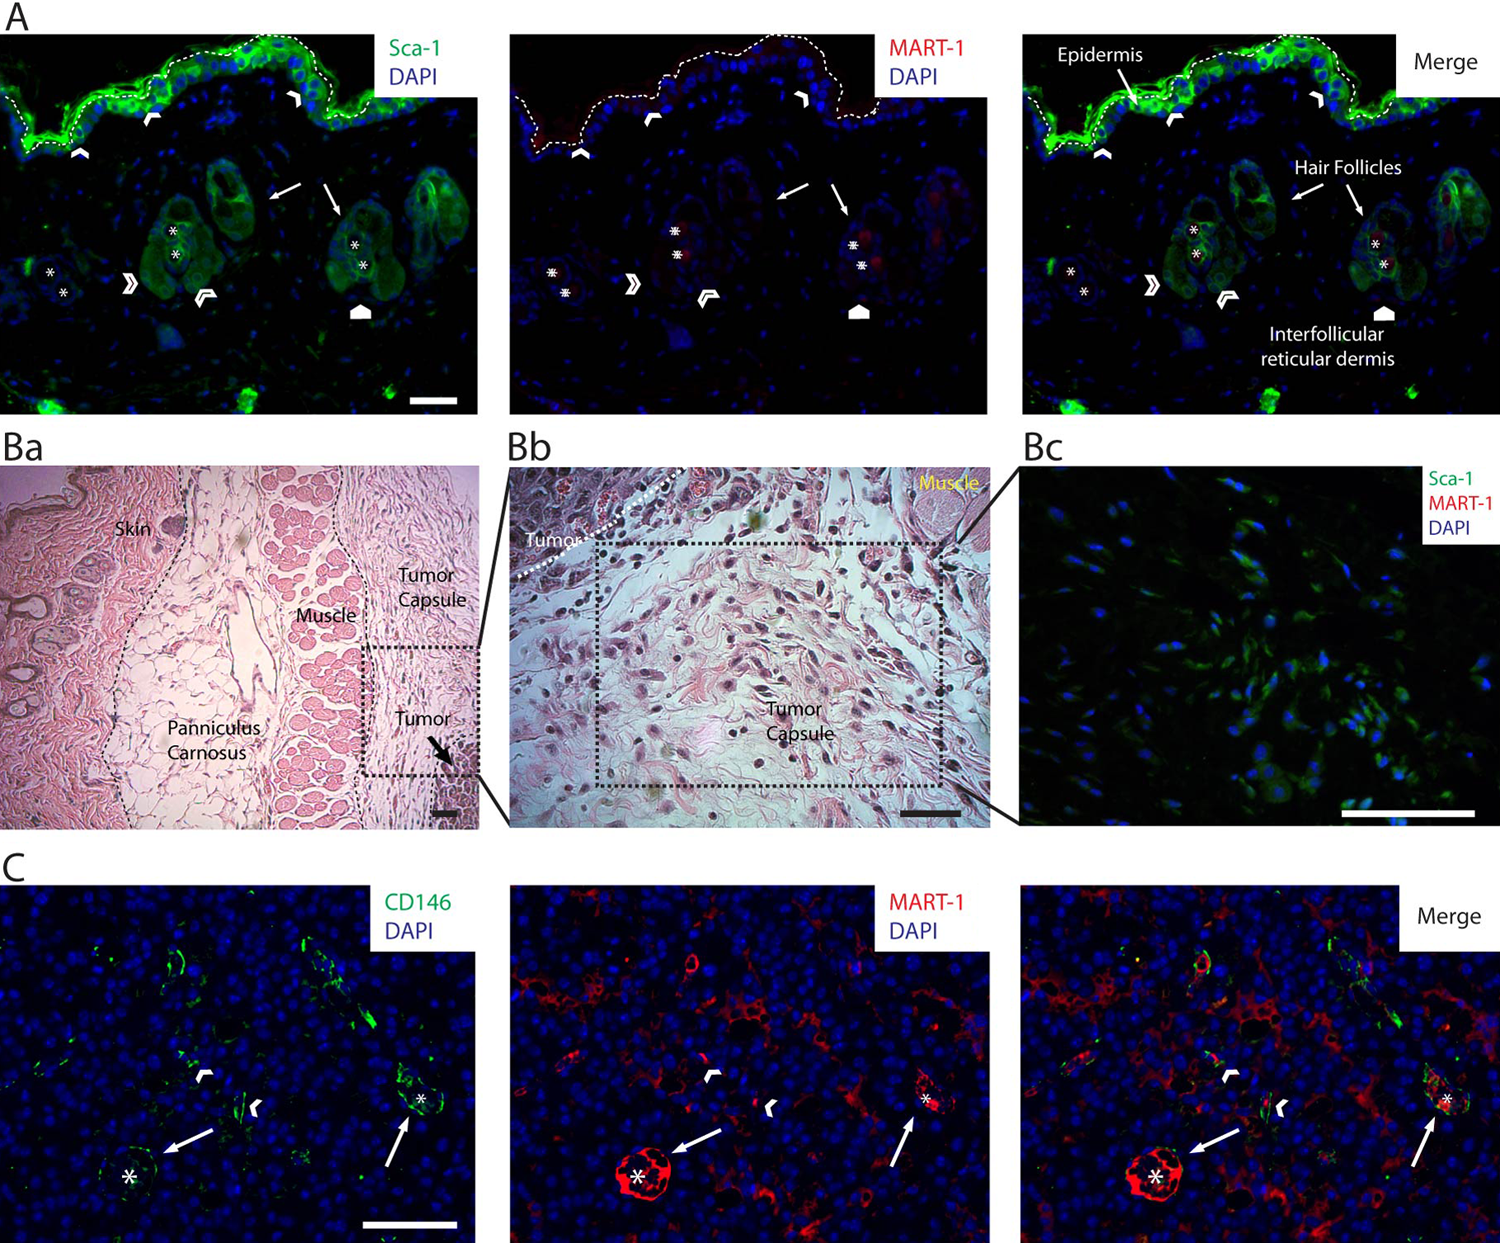
Panel of photomicrographs showing the distribution of the Sca-1+, CD146+, Sca-1+/CD146+, and MART-1+ subpopulations in 14-day-old B16 melanoma tumors. (A) Image of a low-magnified field of view of the skin overlying a B16 melanoma tumor, co-labeled by immunohistochemistry (IHC) for DAPI, Sca-1 (green, left panel), and MART-1 (red, central panel). MART-1 expression in skin was minimal (center and right panels); however, very few MART-1+ cells were observed in some areas of the epidermis and reticular dermis (white pentagon). The host-derived MART-1−, Sca-1+ subpopulation (left and right panels) was observed scattered throughout the epidermis (white arrowheads) and associated with hair follicle bulges (open arrowheads). In this image, the epidermis is delineated from the external autofluorescence of skin collagen by a white dashed line. Asterisk points to autofluorescent hair follicle shafts. (B) In addition to skin, the Sca-1+ subpopulation is abundantly observed distributed throughout the tumor capsule. (Ba) Low-magnification field of view of a B16 melanoma tumor, showing the distinct structures associated with the developing melanoma such as skin, panniculus carnosus, muscle, and tumor capsule. (Bb) Magnified field of view of the area delineated in Ba. In this image, the histological composition of the tumor capsule near the tumor boundary is shown. We observe the presence of abundant fibroblastoid cells distributed within a loose connective tissue matrix. (Bc) Sca-1, MART-1, and DAPI co-labeling by IHC. In this image, the three markers (Sca-1 in green, MART-1 in red, and DAPI in blue) are shown merged. The field of view shown in this micrograph corresponds to an area of the tumor capsule similar to the one shown in Bb. In this image, numerous fibroblastoid cells expressing Sca-1+ (green), although lacking MART-1 expression (note the absence of red MART-1 labeling), are observed scattered throughout the tumor capsule. (C) Field of view recorded from the intratumoral region of a B16-induced melanoma that was co-labeled for CD146, MART-1, and DAPI by IHC. In this image, the host-derived CD146+ subpopulation (green cells) is readily discriminated from the tumor fraction by the absence of MART-1 expression (red cells). By this means, the distribution of the CD146+ subpopulation within the tumor was investigated. We observed CD146+ cells to be scattered throughout the tumor as a component of the stroma (white arrowheads) but most closely associated with tumoral blood vessels (white arrows). Asterisks denote the center of tumor blood vessels. Scale bars: 50 µm.
The CD146+ subpopulation was rarely observed in skin, interfollicular reticular dermis, or tumor capsule. However, CD146+ cells were observed distributed throughout the tumor, mixed with MART-1+ tumor cells, and closely associated with tumor vessels (Fig. 5C).
The CD146+ subpopulation corresponds to pericytes, closely associated with MART-1+ vascular lining cells and endothelium in the tumor blood vessels
The CD146+ subpopulation was frequently observed associated with the external perivascular adventitia surrounding tumor blood vessels (Figs. 5C and 6A). Using flow cytometry, we observed that the CD146+ subpopulation expressed α-SMA (Fig. 6B). This subpopulation did not express the endothelial markers CD31 and CD34 (Fig. 6B), showing that it corresponds to pericytes.
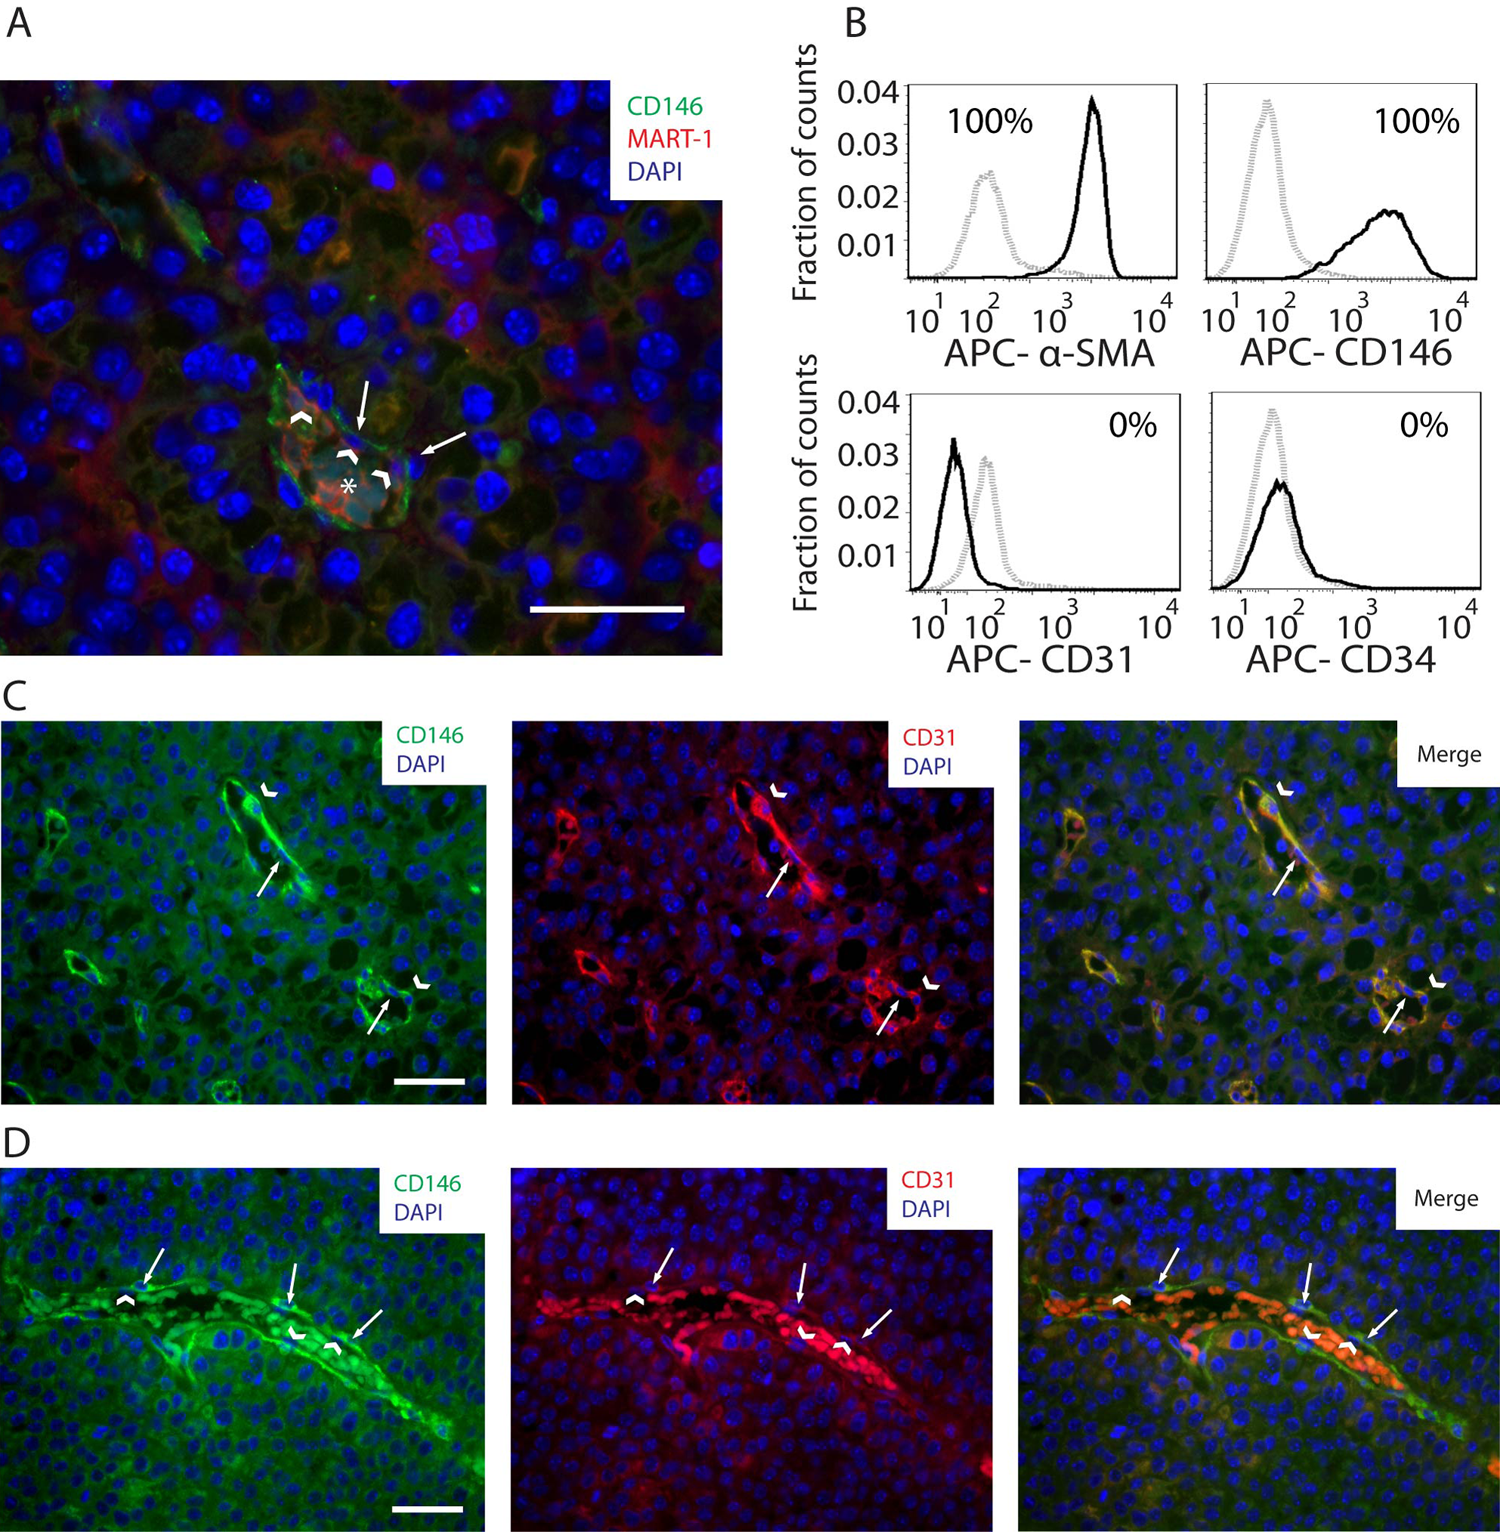
(A) Image of a B16 melanoma tumor section showing CD146 (green), MART-1 (red), and DAPI (blue) co-labeling by immunohistochemistry (IHC). In this field of view, CD146+ cells (white arrows) are observed distributed perivascularly to intratumoral blood vessels, closely associated with blood vessel–lining cells (white arrowheads). An asterisk is positioned over the erythrocytes located in the center of the blood vessel. (B) Histograms of CD146, α-smooth muscle actin (α-SMA), CD31, and CD34 expression in the CD45–, MART-1−, CD146+ fraction of cell suspensions derived from B16-induced melanomas. Gray dashed histograms correspond to isotype controls. Solid black histograms correspond to the marker of interest. Expression threshold was determined as the level of fluorescence greater than 99% of the isotype-matched control antibody-labeled cells. (C) CD146/CD31 co-labeling by IHC of tumor sections derived from B16-induced melanomas. In this micrograph, a tumor section containing an intratumoral vessel is observed. Note the perivascular distribution of CD146+ cells (white arrowheads), closely associated with CD31+, endothelial cells (white arrows). (D) In the same tumor specimen shown in C, a different pattern of blood vessels, constituted by perivascular CD146+ cells (left and right panels, in green, pointed by white arrows), associated with CD31− blood vessel–lining cells (center and right panels, pointed by white arrowheads in the nucleus), is observed. Scale bars: 50 µm.
To investigate pericyte association with blood vessel–lining cells, CD146 and CD31 co-labeling was performed on B16 melanoma tumor sections and analyzed by IHC. As shown in Figure 6C (left panel), CD146+ pericytes were located perivascularly, in association with CD31+ blood vessel–lining endothelial cells (Fig. 6C). However, pericytes were also found associated with CD31− blood vessel–lining cells (Fig. 6D).
CD146/MART-1 IHC further characterized CD31− blood vessel–lining cells in tumors. We observed that cells composing these vessel-like structures expressed MART-1 (Fig. 7A). Characteristically, all MART-1+ blood vessel–lining cells lacked CD31 expression (Fig. 7B), suggesting that B16 cells can form vascular structures within the melanomas.
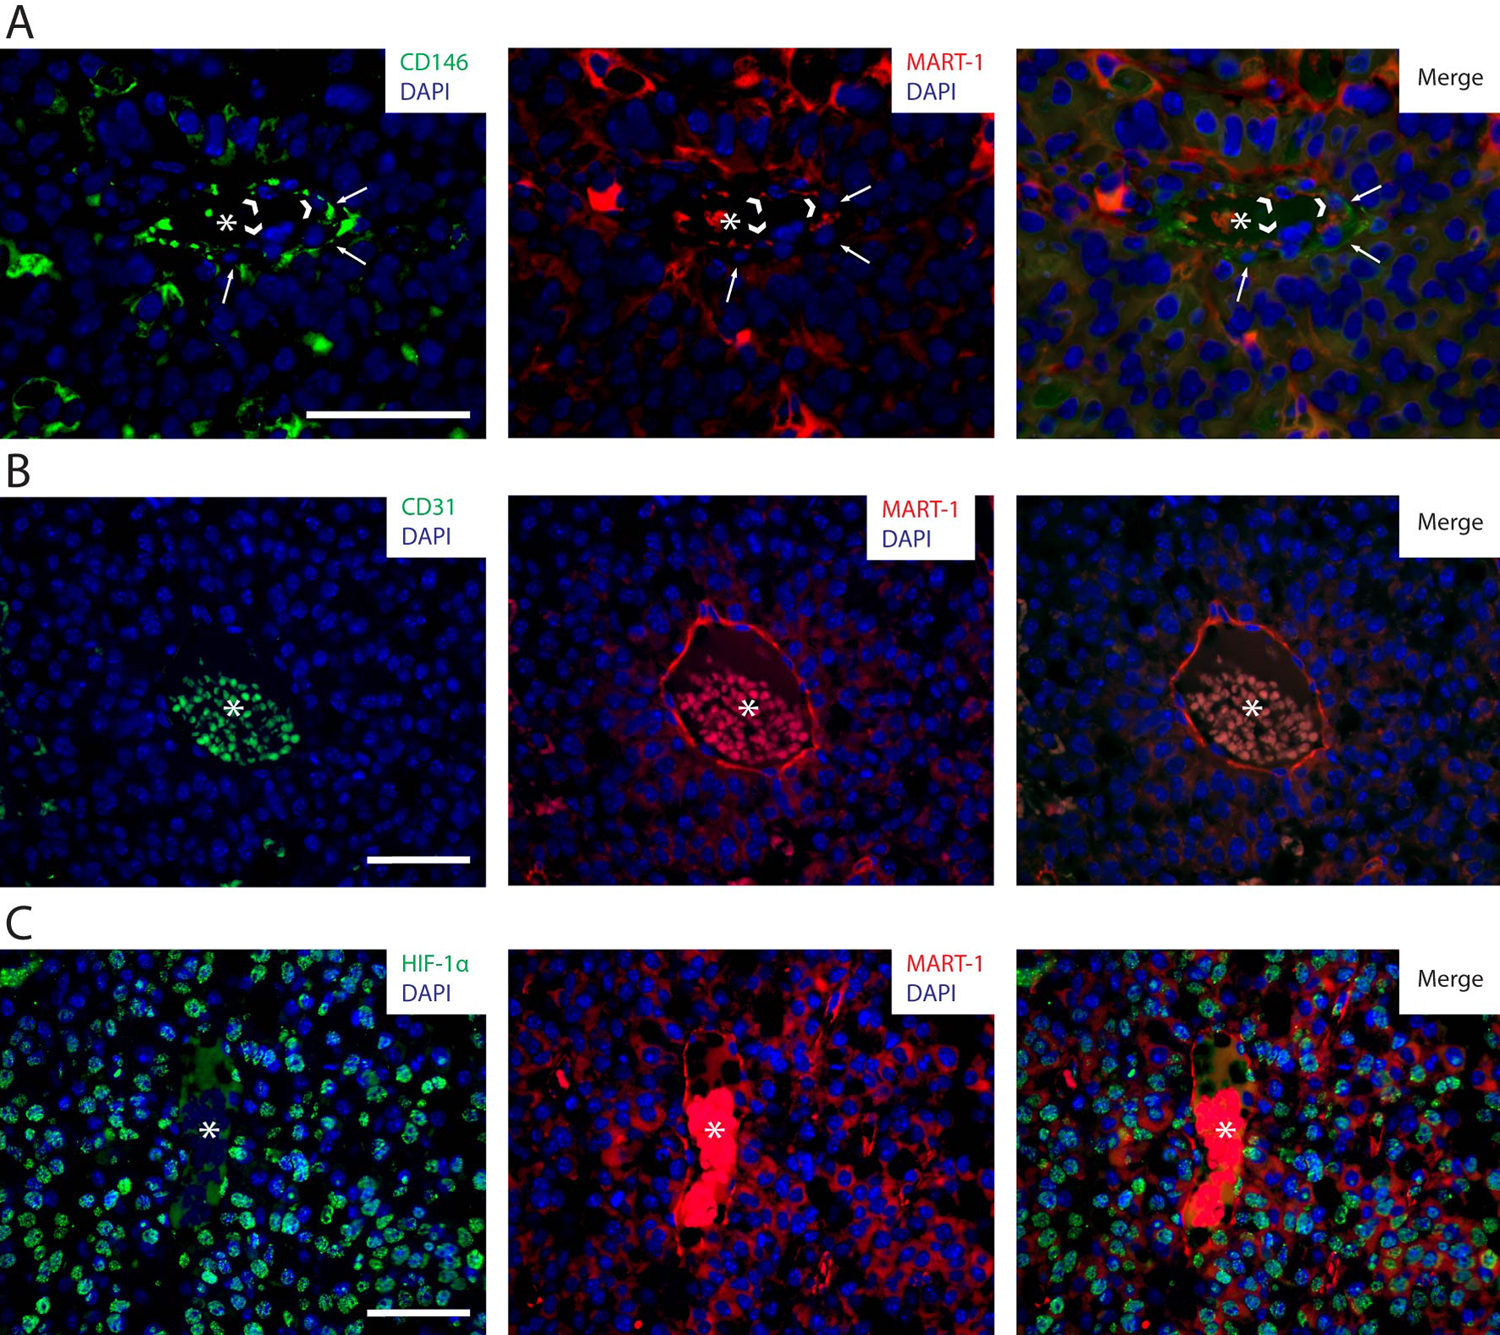
(A) CD146/MART-1 co-labeling by immunohistochemistry (IHC) of tumor sections derived from B16-induced melanomas. In this image, an intratumoral vessel constituted by perivascular CD146+ cells (left and right panels, in green and pointed by white arrows) and vessel-lining MART-1+ cells (center and right panels, in red and pointed by arrowheads) is observed. (B) CD31/MART-1 co-labeling by IHC of tumor sections derived from B16-induced melanomas. In this image, an intratumoral blood vessel composed of MART-1+ blood vessel–lining cells (center and right panels, in red) lacking CD31 expression (left and right panels) is observed. (C) HIF-1α/MART-1 co-labeling by IHC of tumor sections derived from B16-induced melanomas. Numerous cells within the tumor are observed to express HIF-1α (left and right panels, in green) in the nucleus (in blue). HIF-1α-expressing cells comprise both MART-1+ cancer cells (central and right panels, in red) and MART-1− stromal cells. HIF-1α expression also localizes to blood vessel–lining MART-1+ cells associated with intratumoral vessels. Asterisks are located in the center of intratumoral blood vessels. Scale bars: 50 µm.
Tumor cells and tumor-associated stroma show abundant nuclear expression of HIF-1α, indicating a hypoxic tumor microenvironment
To investigate whether the tumor microenvironment was hypoxic, we analyzed the distribution of HIF-1α+ cells within B16-induced melanomas by IHC. As shown in Figure 7C (left panel), abundant cells with a nuclear pattern of HIF-1α expression were scattered throughout the tumor and were also observed associated with tumor blood vessels. MART-1/HIF-1α co-staining demonstrated that nuclear HIF-1α expression was present in both MART-1+ cancer cells and MART-1− stroma cells (Fig. 7C).
Discussion
MART-1 has a high specificity for melanoma identification and is used for clinical diagnosis (Zubovits et al. 2004; Ohsie et al. 2008; Fetsch et al. 1997; Chen et al. 1996; Reinke et al. 2005). In this study, we demonstrate that MART-1 antibody labeling is also an effective tool for discriminating tumor from stroma in an experimental melanoma mouse model. MART-1 is highly expressed in cultured B16 melanoma cells (98.7%), making MART-1 a good marker for B16 melanoma cell detection. In addition, MART-1 expression in B16 cells was not downregulated with continuous cell passaging (Fig. 1A,B), suggesting that MART-1 expression is stable in B16 cells and, therefore, that MART-1 effectively discriminates B16 cells from non-melanoma cells. Consistent with human studies (Busam et al. 1998), we found that MART-1 is minimally expressed in normal tissues such as BM, muscle, adipose tissue, and skin. In skin, we found a minimal percentage of cells expressing MART-1, which corresponds to melanocytes bearing MART-1+ early melanosomes that are normally present in skin (De Maziere et al. 2002; Kushimoto et al. 2001). In our study, we found that the skin MART-1+ population did not fluctuate along the course of melanoma development, suggesting that this subpopulation is not induced to proliferate by melanoma cells and hence does not participate in melanoma development.
Our B16/BM mixture experiments provided a controlled in vitro setting where MART-1 efficiency for B16 cell discrimination was initially validated. However, a conclusive demonstration of the suitability of MART-1 for B16 cell discrimination from stroma was obtained using a GFP/SCID mouse model of tumor induction. The GFP/SCID mice represent the most stringent model for tumor versus stroma discrimination available (Okabe et al. 1997; Udagawa et al. 2006). In this model, non-GFP B16 cells are discriminated from tumor-associated stroma cells based on GFP expression. We demonstrated, by IHC of tumors induced in GFP/SCID mouse, that MART-1 was not expressed in GFP+ stromal cells. In addition, GFP was not expressed in MART-1+ cells (Fig. 2E). By flow cytometry, MART-1 identified more than 93% of the FACS-sorted GFP– cells present in suspensions derived from tumors induced in GFP/SCID mice.
In our model, GFP expression was driven by the ubiquitin promoter, and only viable cells could express GFP (Udagawa et al. 2006). We observed about 6% of the GFP– cell fraction not expressing MART-1, corresponding to non-viable stromal cells that have lost their cytoplasmic GFP label as a result of the enzymatic cell isolation process.
A clear advantage of using GFP mouse strains, however, is that they allow live-cell isolation, whereas our MART-1 approach does not. However, MART-1 antibody labeling to distinguish tumor versus stroma appears to be a robust and rapid method to investigate the contribution of different cells such as tumor-associated macrophages (Gazzaniga et al. 2007) or fibroblasts (Li et al. 2003) to melanoma development.
In the context of analyzing stromal cell subpopulations, we investigated the contribution of the tumor-associated MART-1− fraction to B16 melanoma development, finding that cancer cells recruit host-derived stroma cells during melanoma formation. This finding contradicts some aspects of the melanoma stem cell hypothesis (Quintana et al. 2008; Schatton et al. 2008), which states that a single melanoma-initiating cell can produce the bulk of cells that compose the tumor (Tomasson 2009). Our results show that in order for cancer cell proliferation to occur, a constant number of host-derived stroma cells is required during melanoma progression, possibly to maintain viability and sustain proliferation of cancer-initiating cells or to induce differentiation of cancer stem cells from cancer-initiating cells (Chaffer and Weinberg 2011; Visvader 2011).
The source and nature of the different host-derived tumor-associated stroma cells recruited by B16 melanoma cells are two important issues of clinical relevance. First, the proportional increase in the MART-1+ tumoral fraction observed in B16-induced melanoma is in agreement with the unlimited replicative potential that characterizes cancer cells (Hanahan and Weinberg 2000). In contrast, expansion of the stromal fraction can be explained either by continuous cell recruitment of host cells from the bloodstream, as proposed in prostate and breast cancer (Mishra et al. 2008; Spaeth et al. 2009; Kidd et al. 2009), or by continuous proliferation of preexisting tumor-associated stroma cells in response to tumor cell stimulation. In this context, the proliferating stroma population can consist of either fully differentiated tumor-associated stroma cells such as myofibroblasts or carcinoma-associated fibroblasts (McAllister and Weinberg 2010) or tumor-associated resident stromal stem cells (Karnoub et al. 2007).
Our results suggest that resident stromal stem cells may be implicated in the development of the tumor-associated stroma population. This comes from the observation that several putative stromal progenitors are present in the B16-induced melanoma. Stromal progenitors were defined based on the pattern of Sca-1, CD146, and c-Kit co-expression. These markers were chosen because they clearly identify mesenchymal cells with pluripotent capabilities (Xin et al. 2005; Wilson et al. 2007; Crisan et al. 2008). Using this strategy of stromal progenitor identification, six different stroma subpopulations were identified (Table 1), among which the CD146+ and Sca-1+ subpopulations predominated within tumors and exhibited significant fluctuations in skin and muscle.
In the tumor, Sca-1+ cells were mostly observed scattered throughout the tumor capsule, close to the tumor-capsule boundary (Fig. 5B). In skin, Sca-1+ cells were observed predominantly distributed in the epidermis and hair follicle bulge (Fig. 5A). Interestingly, Sca-1+ skin-derived precursor (SKP) cells possessing mesodermal and ectodermal differentiation capabilities have been reported in skin epidermis and hair follicle bulge (Toma et al. 2001; Lavoie et al. 2009). In skin and tumor, the Sca-1+ subpopulation fluctuated from day 7 to day 14 of tumor induction. At day 7, the Sca-1+ subpopulation was abundant in the tumor, correlating with the maximal concentration of these cells in skin. After 14 days of tumor development, the presence of Sca-1+ cells decreased in tumors, correlating with an important decrease of Sca-1+ cells in skin (Table 1). This suggests that tumor induces stimulation and expansion of a skin-derived Sca-1+ subpopulation at early phases of melanoma development, which could be incorporated into the tumor capsule (Fig. 5B) before reaching the tumor. Considering a similar phenotype and anatomic location, our observations raise the possibility of a role of SKP cells in melanoma development.
The CD146+ subpopulation was present at stable levels during melanoma development, as determined by flow cytometry and IHC (Fig. 4E and Table 1). CD146+ cells were observed distributed throughout the stroma but particularly in close perivascular association with blood vessels (Figs. 5C and 6A). Several observations led to our conclusion that the MART-1−, CD45–, CD146+ stroma subpopulation identified in this study represents pericytes. First, pericytes are cells located in close perivascular association with endothelial cells (Fig. 6A). In addition, pericytes characteristically express CD146 and α-SMA, as well as lack expression of endothelial (CD31 and CD34) and hematopoietic (CD45 or CD11b) markers (Crisan et al. 2008; Zimmerlin et al. 2010). We observed the CD146+ subpopulation to be perivascularly associated with intratumoral blood vessels. Moreover, we observed by flow cytometry that the CD146+ subpopulation expresses α-SMA and lacks CD31 and CD34 expression (Fig. 6B). On the basis of the pattern of expression and the phenotype, we conclude that the CD146+ subpopulation corresponds to perivascular mural cells (pericytes).
In the blood vessels, pericytes were closely associated with blood vessel–lining cells, including CD31+ endothelial cells (Fig. 6C) and, interestingly, CD31−, MART-1+ cells (Fig. 6B). Our observation that MART-1+ cells co-localize with vessel-like tubes in the tumor supports the idea that B16 cells differentiate and form functional blood vessel–like structures in this region, giving rise to vascular mimicry (Maniotis et al. 1999; Ruiter et al. 2002).
Melanoma vascular mimicry is mediated by melanoma stem cells through a mechanism dependent on the vascular endothelial growth factor (VEGF)/VEGF receptor (VEGFR) signaling axis (Frank et al. 2011). However, the source of VEGF-1 and the mechanism implicated in VEGF induction are not known. Pericytes regulate endothelial vascular maturation via VEGF production (Evensen et al. 2009). Considering the close association between vessel-associated MART-1+ cells and pericytes, we suggest that pericytes could be the source of VEGF required for melanoma-mediated vascular cord formation.
VEGF production is induced in response to hypoxia via HIF-1α activation. Upon activation, HIF-1α translocates to the nucleus and binds to hypoxia-responsive elements located in the VEGF gene promoter region, inducing its transcription (Pouyssegur et al. 2006). We observed an abundance of melanoma and tumor-associated stroma cells expressing HIF-1α in their nucleus in this region (Fig. 6C). Moreover, it has been described that increased expression of HIF-1α along with VEGF is linked with poor prognosis in patients with melanoma (Giatromanolaki et al. 2003).
In addition to the positive effect on melanoma tumorigenesis, HIF-1α has also been implicated in mediating the recruitment of several cellular elements implicated in angiogenesis (Du et al. 2008), including pericytes (Song et al. 2009). Consistent with these reports, it is possible that hypoxia mediates CD146+ pericyte recruitment into melanoma, whereupon they associate with CD31−/MART-1+ melanoma cells, inducing the formation of the melanoma-derived blood vessels reported in this study.
In conclusion, we demonstrate that MART-1 antibody labeling is a reliable marker for tumor versus host-derived stromal cell discrimination in a B16-induced melanoma mouse model. We demonstrate that the host contributes an important cellular reservoir composed of MART-1− stroma cells associated with melanoma tumor development. Among these, pericytes and Sca-1+ cells are important constituents of melanoma-associated stroma. Pericytes associate with melanoma cells, forming tumoral vascular structures in a hypoxic melanoma microenvironment, suggesting that pericytes and hypoxia are important contributors to melanoma vascular mimicry. Experimental demonstrations of these important hypotheses are crucial toward a better understanding of the basic mechanisms implicated in melanoma development.
Footnotes
Acknowledgements
The authors are grateful to Royce Clifford and Brendan Clifford for helpful comments and constructive criticism in the preparation of this manuscript.
The author(s) declared no potential conflicts of interest with respect to the authorship and/or publication of this article.
The author(s) disclosed receipt of the following financial support for the research and/or authorship of this article: This work was supported by funding from NIH-NCI grant R21CA141130-01. O.M. acknowledges funding from the Hellmuth Hertz Foundation.