
Abstract
The somatic IDH1R132 mutation in the isocitrate dehydrogenase 1 gene occurs in high frequency in glioma and in lower frequency in acute myeloid leukemia and thyroid cancer but not in other types of cancer. The mutation causes reduced NADPH production capacity in glioblastoma by 40% and is associated with prolonged patient survival. NADPH is a major reducing compound in cells that is essential for detoxification and may be involved in resistance of glioblastoma to treatment. IDH has never been considered important in NADPH production. Therefore, the authors investigated NADPH-producing dehydrogenases using in silico analysis of human cancer gene expression microarray data sets and metabolic mapping of human and rodent tissues to determine the role of IDH in total NADPH production. Expression of most NADPH-producing dehydrogenase genes was not elevated in 34 cancer data sets except for IDH1 in glioma and thyroid cancer, indicating an association with the IDH1 mutation. IDH activity was the main provider of NADPH in human normal brain and glioblastoma, but its role was modest in NADPH production in rodent brain and other tissues. It is concluded that rodents are a poor model to study consequences of the IDH1R132 mutation in glioblastoma.
The finding of the high frequency of the somatic IDH1R132 and IDH2R172 mutations in the isocitrate dehydrogenase (IDH) genes in glioma (Parsons et al. 2008; Bleeker et al. 2009) has recently revolutionized brain tumor research. The IDH2R172 mutation occurs at a relatively low frequency in glioma (Hartmann et al. 2009; Sonoda et al. 2009; Yan et al. 2009), but the IDH1R132 mutation occurs in 70% to 80% of secondary glioblastoma (Balss et al. 2008; Bleeker et al. 2009; Hartmann et al. 2009; Ichimura et al. 2009; Nobusawa et al. 2009; Parsons et al. 2008; Sanson et al. 2009; Sonoda et al. 2009; Watanabe et al. 2009; Weller et al. 2009; Yan et al. 2009). The IDH1R132 mutation is an early event in gliomagenesis, and patients with low-grade glioma show even higher frequencies (Parsons et al. 2008; Balss et al. 2008; Bleeker et al. 2009; Ohgaki and Kleihues 2009). The mutation is also associated with a subset of acute myeloid leukemia (Mardis et al. 2009; Chou et al. 2010; Ward et al. 2010), its precursor myelodysplastic syndrome (Andrulis et al. 2010), and thyroid cancer (Murugan et al. 2010). The IDH1 gene encodes for NADP+-dependent IDH1, which is found in cytoplasm, peroxisomes, and endoplasmic reticulum of cells (Geisbrecht and Gould 1999; Margittai and Banhegyi 2008). IDH2 is the second NADP+-dependent IDH localized in mitochondria (Hartmann et al. 2009; Sonoda et al. 2009; Yan et al. 2009). The other three members of the IDH family are NAD+ dependent, exclusively localized in mitochondria and involved in the Krebs cycle (Ying 2008). NAD+-dependent IDHs have not been found to be mutated in relation with gliomagenesis in particular and cancer in general (Yan et al. 2009).
The causal relationship between IDH mutations and gliomagenesis is only partly understood. Both mutations in the IDH1 and IDH2 genes affect evolutionary-conserved residues (arginines R132 and R172, respectively). The arginines are localized in the isocitrate binding site of the NADP+-dependent IDHs (Xu et al. 2004). The mutations inactivate the enzymatic activity of IDH1 and IDH2 (Ichimura et al. 2009; Yan et al. 2009; Bleeker et al. 2010). They cause reduced production of α-ketoglutarate and NADPH from isocitrate and NADP+.
The most important functional consequence of mutated IDH1 is that it converts α-ketoglutarate and NADPH into 2-hydroxyglutarate and NADP+ (Dang et al. 2009). In patients with L-2-hydroxyglutaric aciduria, the accumulation of 2-hydroxyglutarate is associated with a higher risk of gliomagenesis (Aghili et al. 2009). Moreover, 2-hydroxyglutarate may inhibit degradation of hypoxia-inducible factor (HIF) subunit HIF-1α (Gross et al. 2010). HIF-1α can thus form the heterodimer HIF-1, consisting of HIF-1α and HIF-1β, that is transported into the nucleus as transcription factor (Hughes et al. 2010; Pollard and Ratcliffe 2009; Thompson 2009). HIF-1 is the master switch of cellular adaptation to low oxygen levels and induces transcription of more than 100 genes involved in angiogenesis, cell motility, invasion, and anaerobic glycolysis (Bjerkvig et al. 2009; Nobusawa et al. 2009; Atai et al. 2011; Hughes et al. 2010). HIF-1α thus provides a survival kit for glioma cells.
IDH1 can be considered either as a tumor suppressor gene (the mutation causes loss of function by reducing cytoplasmic α-ketoglutarate levels) or as an oncogene (the mutation causes gain of function by increasing levels of 2-hydroxyglutarate levels and increasing HIF-1α levels). Reduced α-ketoglutarate levels in the cytoplasm due to the IDH1R132 mutation may also reduce degradation of HIF-1α (Zhao et al. 2009). However, α-ketoglutarate levels were found not to be reduced in glioma and acute myeloid leukemia with the IDH1R132 mutation (Dang et al. 2009; Gross et al. 2010).
Another clinically important phenomenon of the IDH1R132 mutation is the prolonged survival of glioblastoma patients with the mutation (Bleeker et al. 2009; Hartmann et al. 2009; Hartmann et al. 2010; Nobusawa et al. 2009; Sanson et al. 2009; Sonoda et al. 2009; Watanabe et al. 2009; Weller et al. 2009). The IDH1R132 mutation was associated with improved survival of 1 year on average in our set of 98 glioblastoma patients, of whom 18 had the IDH1R132 mutation (Bleeker et al. 2010). We hypothesized in that study that reduced NADPH production in the cytoplasm of glioma cells is responsible for prolonged survival. We found that the capacity to produce NADPH was reduced by 38% in glioblastoma samples harboring the IDH1R132 mutation, as demonstrated by metabolic mapping (Bleeker et al. 2010). Moreover, the mutated IDH1 consumes NADPH rather than producing it. Thus, the NADPH production in IDH1-mutated glioblastoma is likely to be even more profoundly decreased. NADPH has a major impact on detoxification. NADPH is among others necessary for the production of reduced glutathione (Koehler and Van Noorden 2003) and reduced thioredoxins (Holmgren and Lu 2010; Biaglow and Miller 2005), formation of active catalase tetramers (Salvemini et al. 1999), and the activity of the members of the cytochrome P450 family (Van Noorden and Butcher 1986, 1991; Koehler and Van Noorden 2003). Oxygen radicals are metabolized by NADPH-dependent systems, and oxygen stress is particularly induced by irradiation and chemotherapy (Ozben 2007). Recently, it was reported that patients with low-grade glioma with the mutation responded better to telozolomide treatment (Houillier et al. 2010).
Surprisingly, it appeared that the capacity of IDH to produce NADPH represents 65% of the total NADPH production in the human brain (Bleeker et al. 2010). This is in contrast with the general concept that the irreversible oxidative part of the pentose phosphate pathway by activity of glucose-6-phosphate dehydrogenase (G6PDH) and 6-phosphogluconate dehydrogenase (6PGDH) is the major NADPH provider in the cytoplasmic compartment of cells, whereas IDH, malate dehydrogenase (MDH), and hexose-6-phosphate dehdrogenase (H6PDH) play a minor role (Van Noorden 1984; Stoward et al. 1991; Koehler and Van Noorden 2003; Kil et al. 2006; Reitman and Yan 2010). Therefore, we further investigated the relative role in NADPH production by IDH and the other NADPH-producing dehydrogenases in normal human, mouse, and rat tissues and glioblastoma samples using metabolic mapping (Van Noorden 2009, 2010). Furthermore, we analyzed expression of these dehydrogenases in human cancer relative to normal human tissue in silico (Atai et al. 2011; Mir et al. 2010) to establish their potential role in the generation of NADPH in cancer.
Materials and Methods
Glioblastoma Samples
The activity of NADPH-producing dehydrogenases was localized using metabolic mapping according to Van Noorden (2009, 2010) in cryostat sections of samples from glioblastoma patients and non-cancerous brain tissue samples. Twenty-six glioblastoma samples that were classified by the pathologist (DT) according to the World Health Organization (WHO) 2007 classification and five non-cancerous brain tissue samples containing both white and grey matter were used in the study. Tumor samples were included only when at least 80% of the samples consisted of cancer cells, as verified by hematoxylin–eosin staining. Use of patient material fell under the Dutch Code of proper secondary use of human tissue and was waived by the local ethics committee.
All glioblastoma and non-cancerous brain tissue samples were obtained from the tumor bank maintained by the Departments of Neurosurgery and Neuropathology at the Academic Medical Center, Amsterdam, the Netherlands. All samples were snap-frozen in liquid nitrogen in the operating room and stored at −80C until used. The mutational status of the IDH1 and IDH2 genes was determined previously (Bleeker et al. 2009; Bleeker et al. 2010). Thirteen glioblastoma samples mutated in the IDH1 gene (IDH1R132) and 13 glioblastoma samples with wild-type IDH1 and IDH2 genes were selected for further studies described here.
Normal Mouse Tissues
The activity of NADPH-producing dehydrogenases was localized in tissues of five young adult C57 B1/6 mice (Charles Rivers, Someren, the Netherlands) with body weight of 22 to 26 g. The animals were kept under constant environmental conditions with a 12-hr dark/12-hr light cycle and free access to food and water. Animals were kept under these conditions for at least 2 weeks. The animals were sacrificed by CO2 exposure and subsequent cervical dislocation. Animal procedures were carried out in compliance with Institutional Standards for Human Care and Use of Laboratory Animals. The Institutional Animal Care and Use Committee approved the experiments.
Samples of tissues were slowly snap-frozen in small plastic vials in liquid nitrogen and stored at −80C until used as described by Vogels et al. (2009) to ensure preservation of optimum tissue morphology. Cerebrum, cerebellum, spinal cord, tongue, small and large intestines, pancreas, liver, and kidney were collected.
Human Glioblastoma in Nude Rat Brain
Tissues of five glioblastoma tumors were grafted in the brain of eight nude rats (Han: rnu/ruu Rowett) as described previously (Wang et al. 2009). The tumors were allowed to grow for 4 to 5 months, and then brains with tumors were removed and frozen in liquid nitrogen. All procedures and experiments were approved by the National Animal Research Authority in Norway and conducted according to the European Convention for the Protection of Vertebrates Used for Scientific Purposes.
Metabolic Mapping
Six-µm-thick cryostat sections were cut of all patient samples and rodent tissue samples at −25C on a HM560 cryostat (MICROM, Walldorf, Germany), picked up on glass slides, and stored at −80C until used. By keeping the cabinet temperature in the cryostat as low as possible, cryostat sectioning of brain could be done despite the high lipid content, as shown by De Witt Hamer et al. (2006). Cryostat sections of these tissues were allowed to dry at room temperature for 5 min and were then incubated for the localization of the activity of G6PDH, 6PGDH, IDH, MDH, and H6PDH, according to Van Noorden and Frederiks (1992). Incubation medium contained 18% polyvinyl alcohol (PVA, weight average Mr 70,000–100,000; Sigma-Aldrich, St. Louis, MO) in 0.1 M phosphate buffer (pH 7.4), 0.32 mM 1-methoxyphenazine methosulphate (Serva, Heidelberg, Germany), 0.8 mM NADP+ (Roche, Mannheim, Germany), 5 mM sodium azide, 5 mM MgCl2, 5 mM nitro blue tetrazolium salt (nitro BT; Sigma-Aldrich), and the respective substrates. For G6PDH, 6PGDH, IDH, MDH, and H6PDH, the following substrates and concentrations were used: 10 mM glucose-6-phosphate (G6P; Serva), 10 mM 6-phosphogluconate (PG; Sigma), 20 mM D,L-isocitrate (Sigma), 100 mM L-malate (Serva), and 10 mM galactose-6-phosphate (Sigma-Aldrich), respectively. The media were freshly prepared just before incubation, and nitro BT was added after being dissolved in a heated mixture of dimethylformamide and ethanol (final dilution of each solvent in the medium was 2% v/v).
For the demonstration of the activity of G6PDH, 6PGDH, IDH, MDH, and H6PDH, sections were incubated at 37C for 10 to 45 min depending on the reaction rate. The incubation was stopped immediately by rinsing the sections in phosphate buffer (0.1 M, pH 5.3, 60C) to remove the viscous incubation medium. Afterward, sections were embedded in glycerin–gelatin. Experiments were performed in duplicate, and the concentrations of the substrates and coenzymes in the incubation media were sufficiently high to ensure maximum velocity (Vmax) of the enzyme activities (Stoward and Van Noorden 1991; Van Noorden and Butcher 1991). Control reactions were performed in the absence of substrate (Butcher and Van Noorden 1985).
Image Analysis
The final reaction product of NADPH-producing dehydrogenase activity (nitro BT-formazan) was analyzed in three areas in each of five sections with the use of quantitative image analysis, using a Vanox-T photomicroscope with a 10× objective (Olympus, Tokyo, Japan) and a CFW-1312M 1360 × 1024-pixel 10-bit monochrome FireWire camera (Scion, Tucson, AZ) mounted on the front port of the microscope using adapting optics. Sections were illuminated with white light that was filtered by a monochromatic filter of 585 nm and an infrared blocking filter to correctly measure the absorbance of both mono- and diformazans (Van Noorden and Butcher 1991; Van Noorden and Frederiks 1992). Absorbance calibration of the images was performed with the use of a calibrated 10-step density tablet (Stouffer, South Bend, IN). After measuring the step tablet, known absorbance values were related to measured gray values using the built-in calibration function of ImageJ, using the Rodbard function. Density calibrated images were recorded in one single run and stored on disk for analysis. The resolution used prevented distributional errors (Chieco et al. 1994). All settings were maintained throughout the recording session and at the end of the session verified against the step tablet values. Software used for capturing was swf-image, a Scion proprietary camera driver, as an extension to the image-processing application of ImageJ, developed by Rasband (2009). ObjectJ, a plug-in for non-destructive image marking and result linking developed by Vischer and Nastase (2009), was used to indicate regions of interest (ROI) that were measured. Using the ObjectJ plug-in, mean absorbance values within the ROI were collected from the test reaction and the control reaction, allowing calculation of specific activity of the NADPH-producing dehydrogenases. Activity was expressed as µmoles NADPH produced per ml of tissue per min (Van Noorden and Frederiks 1992). The use of ObjectJ allows a retrospective quality control of areas measured.
In Silico Analysis
The genome databases of PubMed (http://www.ncbi.nlm.nih.gov/sites/entrez) were used to collect information on the human NADPH-producing dehydrogenase genes such as Entrez Gene ID, gene name, gene symbol, and gene synonyms.
The Gene Expression Omnibus (http://www.ncbi.nlm.nih.gov/geo/) and ArrayExpress (http://www.ebi.ac.uk/microarray-as/ae/) were searched to retrieve published human microarray gene expression data sets comparing cancer samples with normal tissue samples. Microarray expression data were retrieved from 34 data sets (after excluding 29 data sets for various reasons such as normal tissue samples consisting of cells in culture; for references, see Table 1) comparing cancer with normal human samples as described previously (Atai et al. 2011; Mir et al. 2010). For all data sets, log2-transformed signal intensity measurements were available for each probe in every sample, including probes for the genes investigated.
In Silico Analysis of the Expression of NADPH-Producing Dehydrogenases in Cancer versus Normal Tissue Expressed as (A) Percentile Fold Change and (B) Frequency of Overexpression in 34 Data Sets
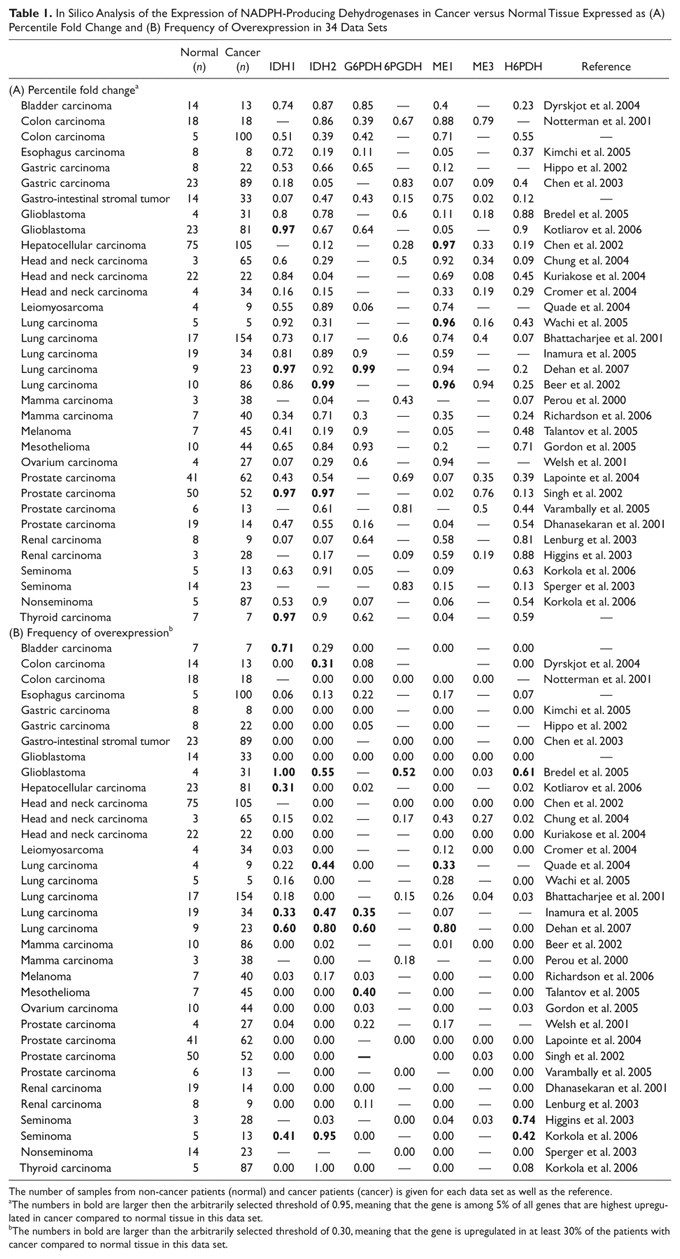
The number of samples from non-cancer patients (normal) and cancer patients (cancer) is given for each data set as well as the reference.
The numbers in bold are larger then the arbitrarily selected threshold of 0.95, meaning that the gene is among 5% of all genes that are highest upregulated in cancer compared to normal tissue in this data set.
The numbers in bold are larger than the arbitrarily selected threshold of 0.30, meaning that the gene is upregulated in at least 30% of the patients with cancer compared to normal tissue in this data set.
The original method of spot qualification and data normalization was maintained for each data set. To compare between platforms, expression intensity was calculated for each Entrez Gene ID by averaging multiple probe intensities. To retrieve expression data of NADPH-producing dehydrogenases from the data sets, Entrez Gene ID coding for G6PDH, 6PGDH, H6PDH, IDH1, IDH2, ME1, and ME3 (2539, 5226, 3417, 3418, 4199, 10,873, and 9563, respectively) was used. Two expression parameters—namely, frequency of overexpression (the fraction of patients in a data set who showed overexpression of the specific gene in cancer tissue vs normal tissue) and percentile fold change (the level of overexpression of the specific gene determined as a percentile of expression levels of all genes in a particular data set again when comparing cancer tissue and normal tissue)—were used to quantify the frequency and level of gene expression (Atai et al. 2011; Mir et al. 2010). A percentile fold change >0.95 was arbitrarily considered as substantial overexpression, and a frequency of overexpression >30% was arbitrarily considered as frequent overexpression.
Data Analysis
The R-program (http://www.r-project.org) and Matlab (MatWorks, Natick, MA) were used to calculate the in silico data (expression parameters of NADPH-producing dehydrogenases).
Results
Localization of the activity of the major NADPH-producing dehydrogenases IDH and G6PDH in wild-type and IDHR132-mutated glioblastoma is shown in Figure 1. IDH activity is reduced in the mutated glioblastoma. First, an in silico analysis of microarray studies in human cancer versus normal tissue of the seven NADPH-producing dehydrogenases genes was performed to establish the relevance for the NADPH production capacity of the individual dehydrogenases in cancer in general and in glioma in particular. Table 1 shows that both parameters that we used to analyze the data, percentile fold change and frequency of overexpression, were upregulated to a limited extent only in relation to any type of cancer for each of the seven genes. Remarkably, IDH1 showed the strongest upregulated expression in glioblastoma, lung carcinoma, and thyroid carcinoma (Table 1). Prostate cancer also showed an elevated percentile fold change, but the frequency of overexpression was small. The two glioma data sets of Bredel et al. (2005) and Kotliarov et al. (2006) both showed upregulation of IDH1 gene expression (Table 2). The percentile fold change is high in all glioma stages in both data sets, but the frequency of overexpression is high only in data set of Bredel et al. (2005). The IDH2 gene also shows upregulation but to a lesser extent (Table 2).
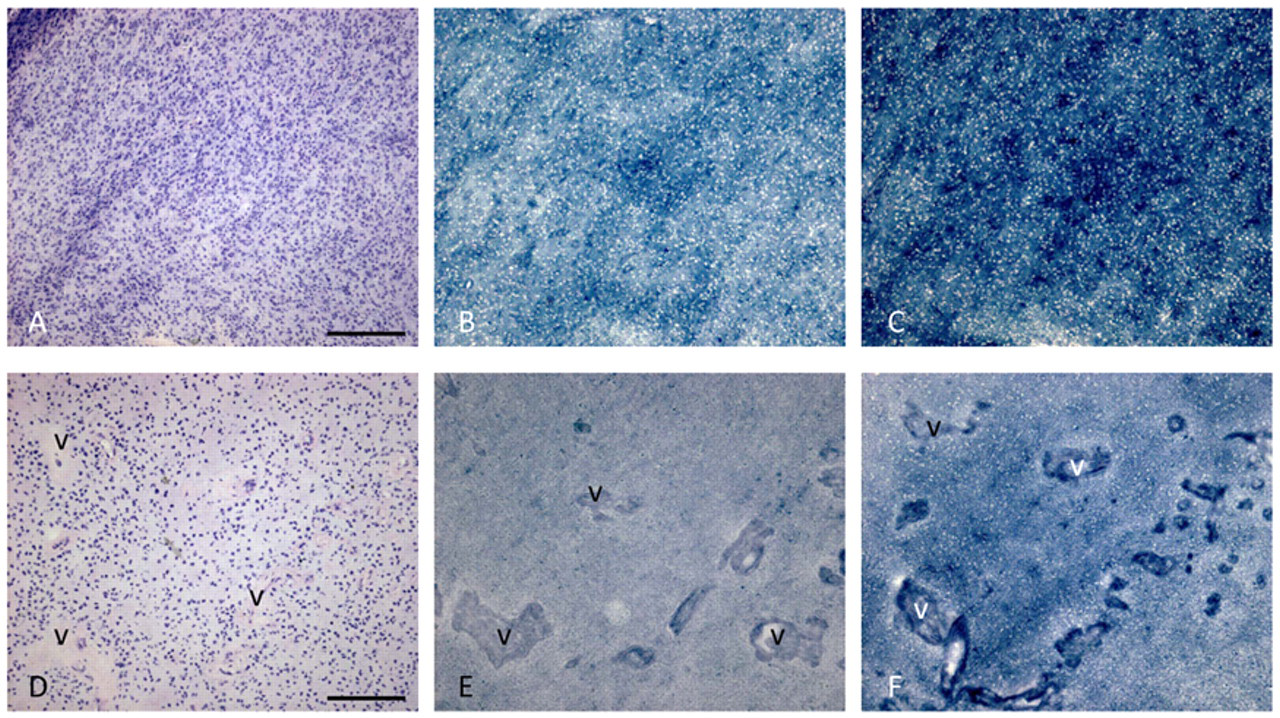
Metabolic mapping of the activity of IDH (B, E) and G6PDH (C, F) in serial cryostat sections of human wild-type (A-C) and IDHR132-mutated (D-F) glioblastoma. Hematoxylin–eosin (HE)–stained sections (A, D) are shown for morphological purposes. The amount of blue dye (nitro BT-formazan) reflects IDH or G6PDH activity. v, blood vessel. Bars = 150 µm.
In Silico Analysis of the Expression of NADPH-Producing Dehydrogenases in Stages WHO2, WHO3, and WHO4 (Glioblastoma) of Glioma versus Non-cancerous Brain in the Microarray Data Sets of Bredel et al. (2005) and Kotliarov et al. (2006) Expressed as (A) Percentile Fold Change and (B) Frequency of Overexpression
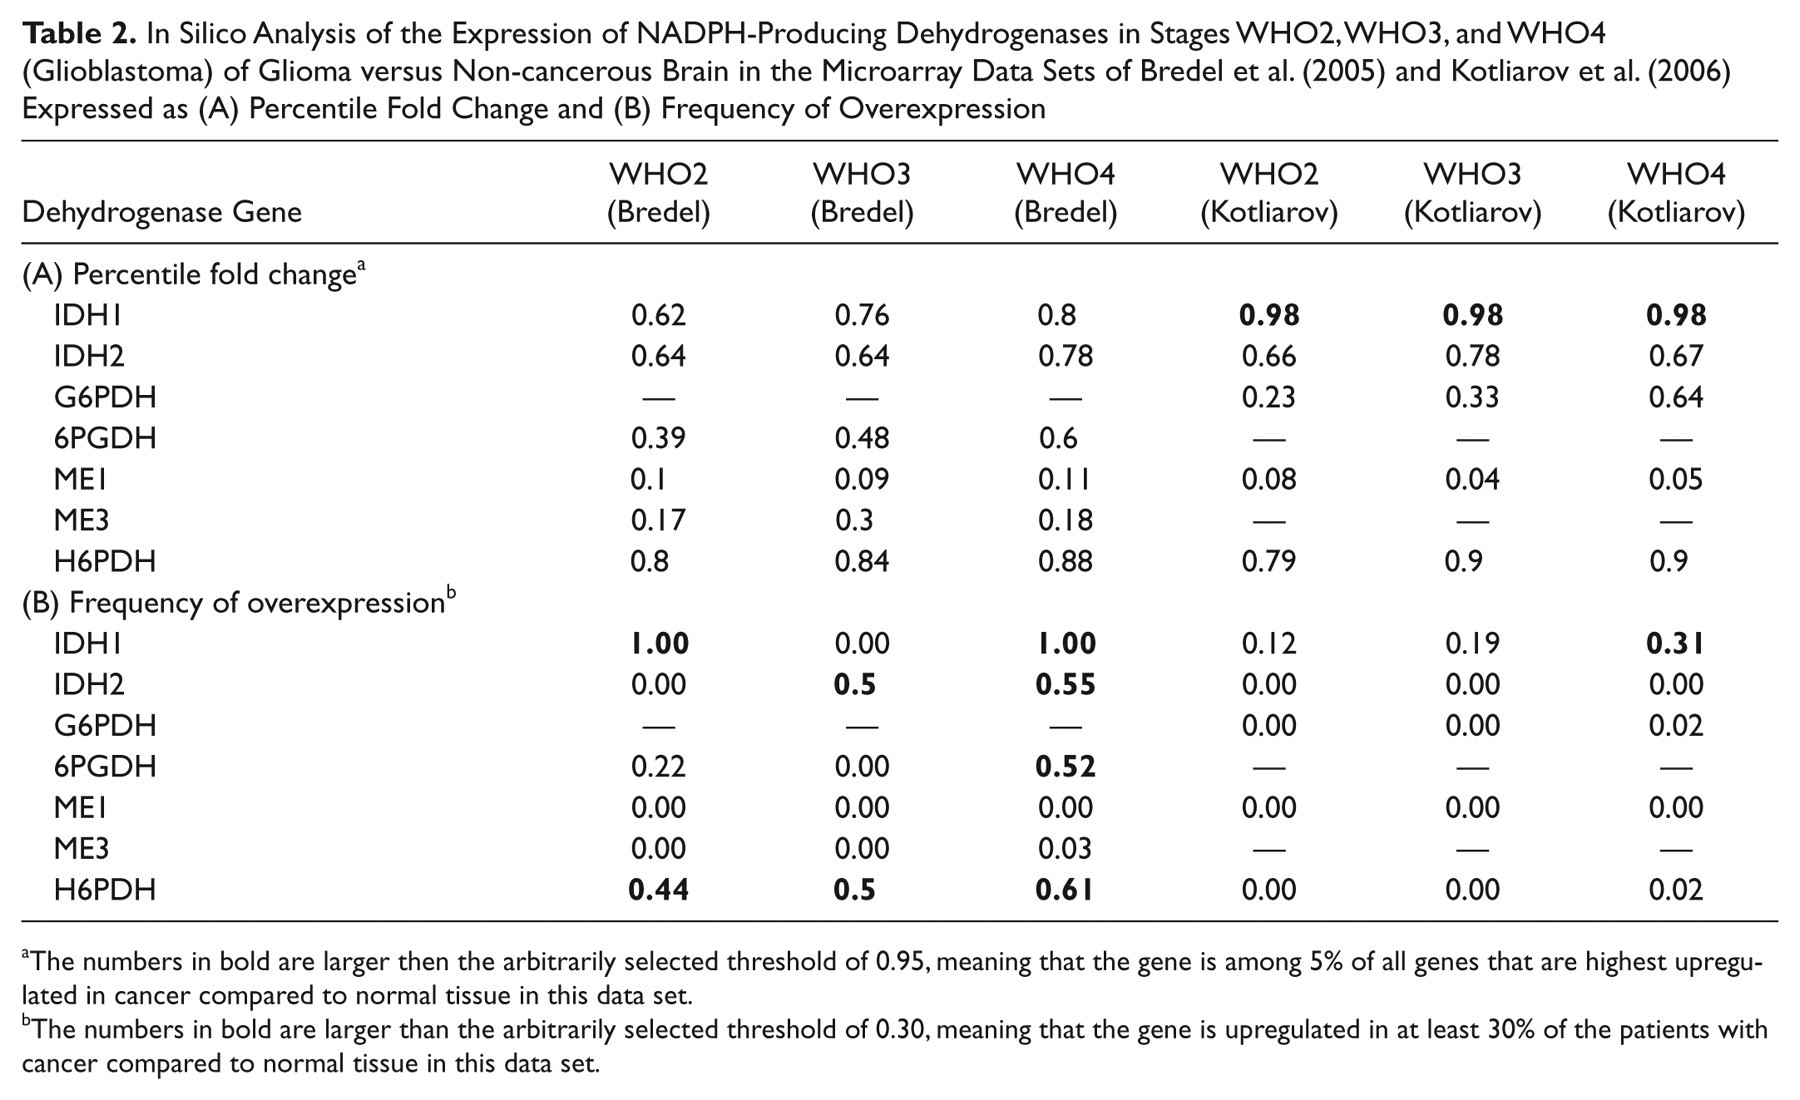
The numbers in bold are larger then the arbitrarily selected threshold of 0.95, meaning that the gene is among 5% of all genes that are highest upregulated in cancer compared to normal tissue in this data set.
The numbers in bold are larger than the arbitrarily selected threshold of 0.30, meaning that the gene is upregulated in at least 30% of the patients with cancer compared to normal tissue in this data set.
Localization of the activity of NADP+-dependent IDH and the dehydrogenases of the pentose phosphate pathway, G6PDH and 6PGDH, in control mouse central nervous system, tongue epithelium, and liver is shown in Figure 2. The figure shows strong heterogeneity of activity of the dehydrogenases in all tissues. Image analysis data of the activity of the dehydrogenases in various regions of tissues are shown in Table 3. Remarkably, when we calculated the NADPH production capacity of IDH and the dehydrogenases of the pentose phosphate pathway, G6PDH and 6PGDH, they showed a similar proportion in each tissue compartment despite the heterogeneity of activity in the tissues. In all mouse tissues, G6PDH and 6PGDH together produced more NADPH than IDH1 and IDH2 did together. Particularly, G6PDH is important for NADPH production. This proportion is 25% versus 75% in the cerebellum, 5% versus 95% in the cerebrum, 10% versus 90% in the spinal cord, 10% versus 85% in tongue epithelium, and 50% versus 50% in the liver. H6PDH activity was below the detection limit in all cases and MDH activity as well except for a low MDH activity in tongue (5%). All other mouse organs studied (small and large intestines, pancreas, and kidney) showed similar patterns of NADPH production capacity (data not shown).
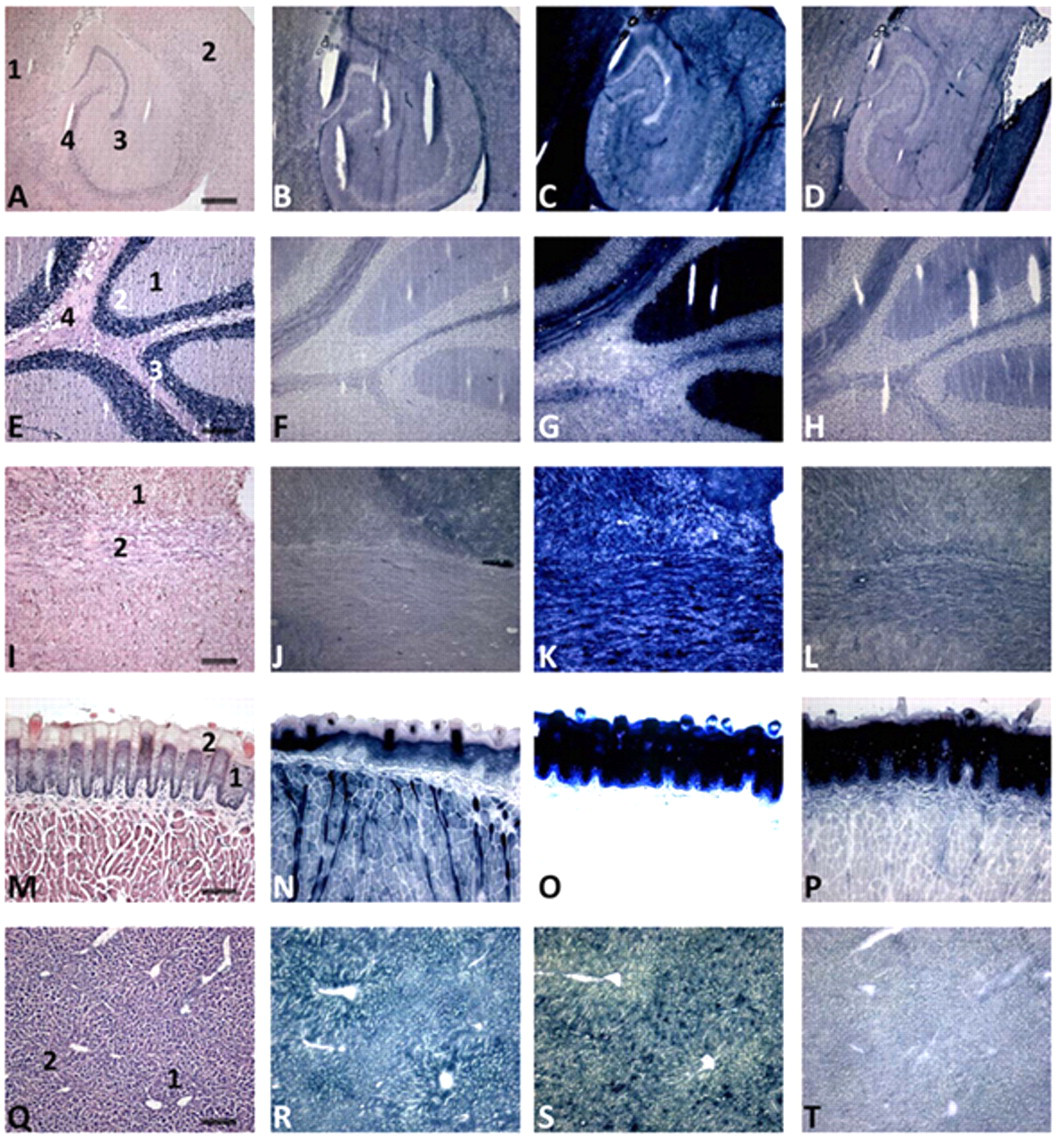
Localization of the activity of IDH (B, F, J, N, R), G6PDH (C, G, K, O, S) and 6PGDH (D, H, L, P, T) in serial cryostat sections of mouse cerebrum (A–D), cerebellum (E–H), spinal cord (I–L), tongue (M–P), and liver (Q–T). Hematoxylin–eosin (HE)–stained sections (A, E, I, M, Q) are shown for morphological purposes. The amount of blue dye (nitro BT-formazan) reflects IDH, G6PDH, or 6PGDH activity. Note the strong heterogeneity of activity in the tissues and the specific staining patterns throughout the different structures of the tissues. Cerebrum: 1, gray matter; 2, 3, white matter; 4, archecortex. Cerebellum: 1, molecular layer; 2, Purkinje cells; 3, granular layer; 4, white matter. Spinal cord: 1, gray matter; 2, white matter. Tongue epithelium: 1, basal cell layers; 2, upper cell layers. Liver: 1, periportal area; 2, pericentral area. Note that micrograph O is overexposed because of the intense staining of the epithelium. Bars = 75 µm.
Quantitative Histochemical Analysis of the Activity of the NADPH-Producing Dehdrogenases IDH, G6PDH, 6PGDH, MDH, and H6PDH (expressed as µmoles NADPH Generated per min per ml of Tissue) in Normal Mouse Tissue (n=5) and Given as a Percentage (%) of the Total NADPH Production Capacity
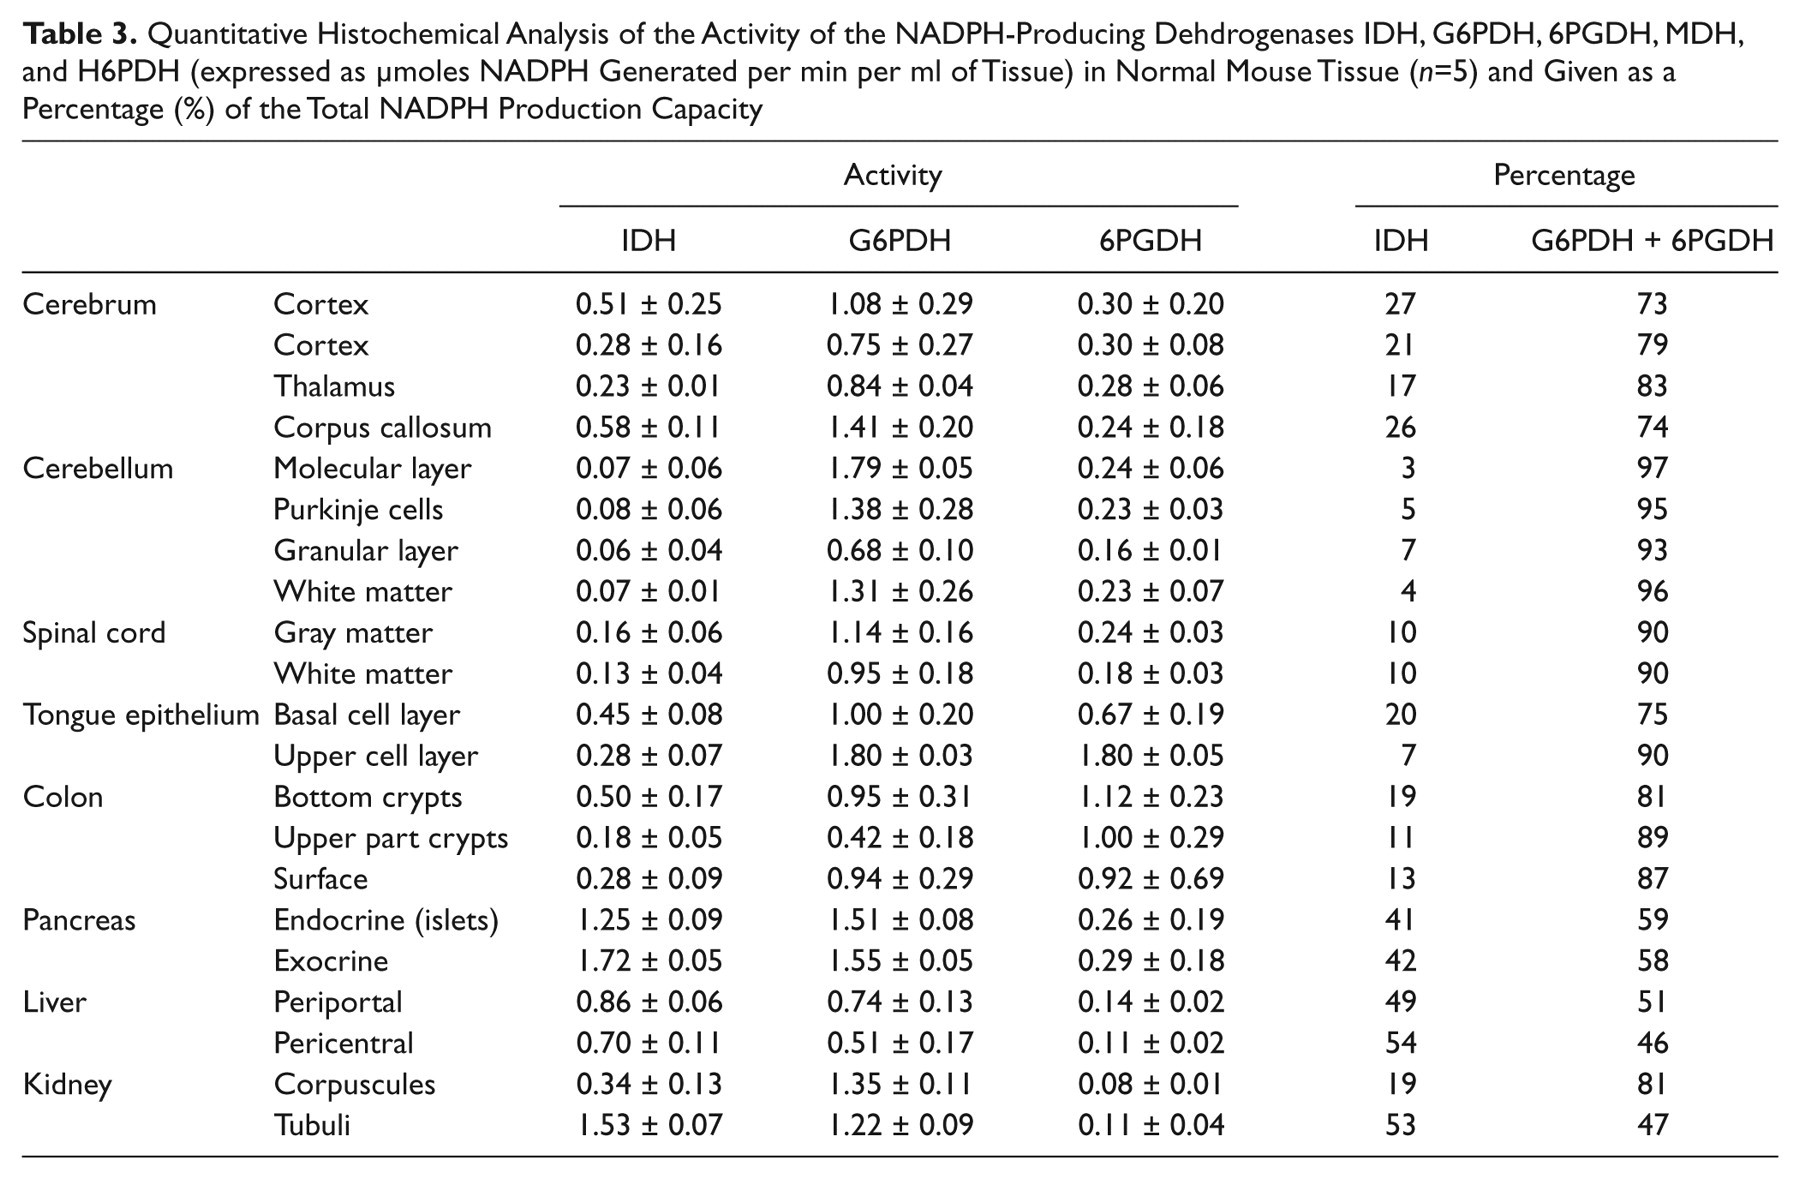
In general, our findings show that IDH activity contributes relatively little to the NADPH production in control mouse tissues and particularly in the central nervous system, whereas the pentose phosphate pathway is responsible for the major part of NADPH production. This is in contrast to the human cerebrum, where IDH activity is responsible for 60% of the NADPH production capacity (Bleeker et al. 2010).
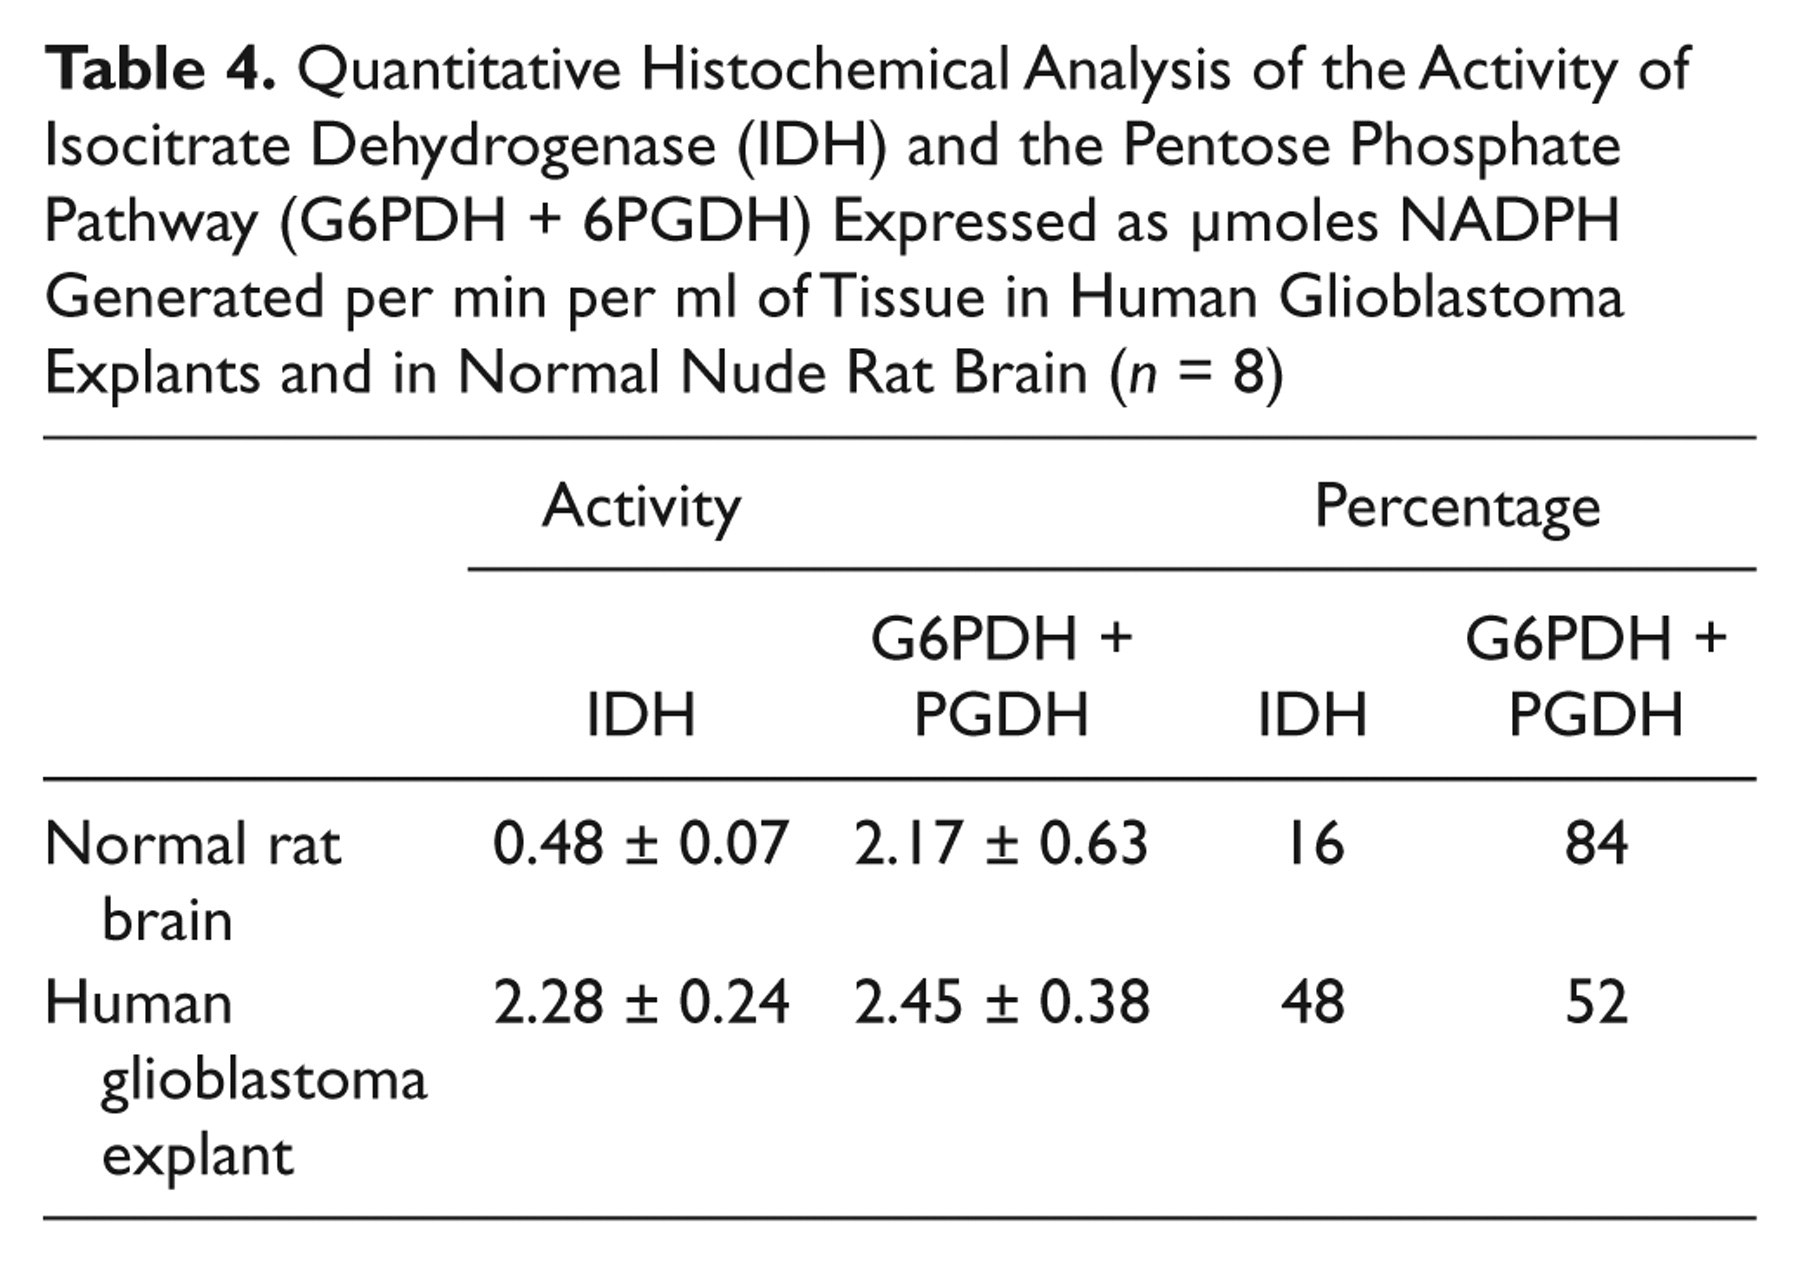
To test the discrepancy that we observed between human and rodent tissues, we determined IDH activity in rat brain in which human glioblastoma explants were grown (Fig. 3; Table 4). Here, IDH activity was responsible for 16% and the pentose phosphate pathway for 84% of the NADPH production capacity in rat cerebrum and in human glioblastoma for 48% and 52%, respectively, again showing differences in the role of IDH activity in NADPH production between rodents and human.
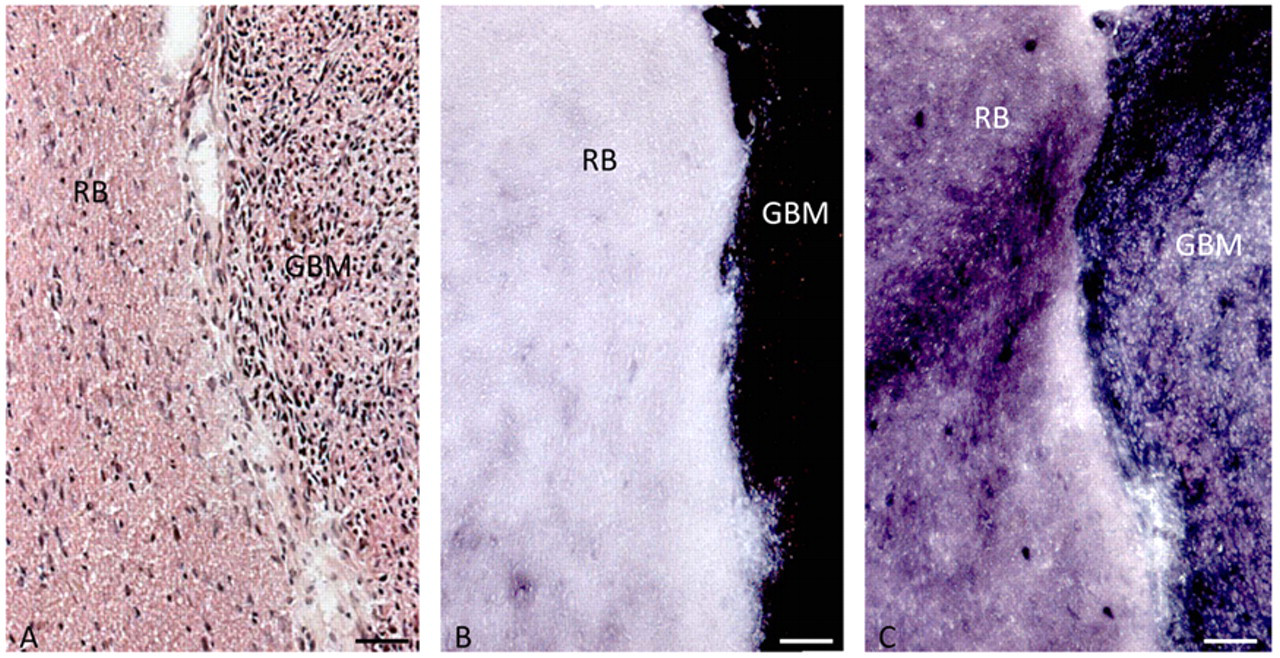
Localization of activity of IDH (B) and G6PDH (C) in serial cryostal sections of human glioblastoma explants (GBM) in normal nude rat brain (RB). Hematoxylin–eosin (HE)–stained section (A) is shown for morphological purposes. Bars = 100 µm.
Quantitative Histochemical Analysis of the Activity of Isocitrate Dehydrogenase (IDH) and the Pentose Phosphate Pathway (G6PDH + 6PGDH) Expressed as µmoles NADPH Generated per min per ml of Tissue in Human Glioblastoma Explants and in Normal Nude Rat Brain (n = 8)
Discussion
NADPH is an essential compound for detoxification reactions in cells. In particular, the cellular antioxidant system relies heavily on NADPH (Koehler and Van Noorden 2003). The general opinion based on rodent models is that the irreversible oxidative part of the pentose phosphate pathway with G6PDH and 6PGDH is the main provider of NADPH. However, this may not be the case in humans (Kil et al. 2006) except for erythrocytes in which NADPH is mainly provided by G6PDH (Scott et al. 1991; Peters and Van Noorden 2009).
Indeed, our metabolic mapping study shows a major role for IDH in NADPH production capacity in the normal human brain and glioma (Fig. 1; Bleeker et al. 2010). In contrast, in normal mouse tissues, including the central nervous system, we found that the irreversible oxidative part of the pentose phosphate pathway has the major capacity to generate NADPH, and IDH has only limited capacity (Fig. 2; Table 3). Localization of activity of G6PDH in these mouse organs (Fig. 2) is in good agreement with previous metabolic mappings studies (Van Noorden 1984; Biagotti et al. 2000; Biagotti et al. 2002; Biagotti et al. 2005; Ferri et al. 2005). Therefore, we conclude that the concept that NADPH is mainly provided by the pentose phosphate pathway and not by IDH is based on studies of organisms other than humans. This is further confirmed by the metabolic mapping data on the experimental model of human glioblastoma tumors in the brain of nude rats (Fig. 3; Table 4). The relative contribution of IDH to the capacity of NADPH production is much larger in the human glioblastoma explants than in the rat brain. Furthermore, Lee et al. (2002) and Kil et al. (2006, 2007) demonstrated that IDH is essential in human cells for the provision of NADPH because specific reduction of IDH activity increased oxidative damage, apoptosis, and senescence. Silencing of IDH1 expression by siRNA is even lethal in human cancer cells (Abdel-Wahab and Levine 2010), indicating that one wild-type allele must be retained in IDH1 mutant cancer cells. Moreover, homozygously mutated IDH1 glioma has not been found yet. These data show once more that a mouse is not a man and stress that data obtained in rodent models of glioblastoma may not reflect the situation in the glioblastoma patient.
The quantitative analysis of the activity of NADPH-producing dehydrogenases in normal mouse tissues (Table 3) revealed another surprising finding. Despite the strong heterogeneity in activity in the different compartments of a tissue, the relative NADPH production capacity of the dehydrogenases was similar in those tissues. In the cerebrum, 25% was represented by IDH and 75% by G6PDH and 6PGDH; these percentages were 5% and 95% in the cerebellum, 10% and 90% in spinal cord, and so on (Table 3). These data indicate that the regulation of the activity of these enzymes is coordinated per tissue, be it on the transcriptional, translational, or posttranslational level. This aspect of the activity of NADPH-producing dehydrogenases warrants further study.
The IDH1 and IDH2 gene mutations are linked with gliomagenesis, acute myeloid leukemia, and thyroid cancer because of 2-hydroxyglutarate production, which is considered an oncometabolite (Dang et al. 2009; Ward et al. 2010; Fu et al. 2010; Gross et al. 2010). However, it was recently found that glioblastoma cells expressing mutant IDH1 show reduced growth when α-ketoglutarate production via glutaminase is inhibited as well (Seltzer et al. 2010), indicating that not only production of the oncometabolite is involved in gliomagenesis but also reduced production of α-ketoglutarate and/or NADPH. We found that the IDH1 mutation reduced the NADPH production capacity as well in glioblastoma. The consequence of the mutations is that NADPH is consumed rather than produced during 2-hydroxyglutarate production. The affinity (Km) for NADP+ of wild-type IDH1 is 49 µM and that of the IDH1R132 mutation is 84 µM. The affinity for NADPH of wild-type IDH1 is not measurable but is 0.44 µM of the IDH1R132 mutation, which means that NADPH consumption is manifold higher by IDH1R132 than NADPH production in glioblastoma cells (Dang et al. 2009). In acute myeloid leukemia cells, a similar upregulation of the affinity for NADPH of IDH1R132 was demonstrated (Gross et al. 2010). Therefore, it cannot be ruled out that loss of NADPH production in the cytoplasm contributes to gliomagenesis due to a diminished antioxidant system. However, loss of NADPH production is more likely involved in prolonged survival of glioblastoma patients with the mutation because cellular damage during irradiation and chemotherapy is largely induced by reactive oxygen species. When NADPH availability is limited in cancer cells, therapy may well be more effective. This hypothesis will be investigated because a better response to telozolomide treatment of low-grade glioma with the mutation has been found (Houillier et al. 2010). The IDH1 and IDH2 mutations in acute myeloid leukemia are not positive prognostic factors but rather negative prognostic factors (Boissel et al. 2010; Paschka et al. 2010).
The in silico analysis of microarray data sets (Tables 1 and 2) did not show much upregulation of expression of most of the genes of NADPH-producing dehydrogenases. The changes in expression of these genes are especially modest when compared with our previous in silico analyses of expression of kinase genes (Mir et al. 2010) and the osteopontin gene (Atai et al. 2011), which showed strong overexpression in both percentile fold change and frequency of overexpression in patients. These findings indicate that cancer does not particularly induce transcription of genes of dehydrogenases that can provide NADPH, which is considered of vital importance for cells, particularly cancer cells, to survive because it is needed for many detoxification processes. It suggests that under stress—for example, during irradiation or chemotherapy—the cancer cells have to rely on the NADPH-producing dehydrogenases that are available. This may explain why the IDH1 mutation may have the prolonging effect on patient survival.
It is remarkable that overexpression of IDH1 was observed in glioma (Table 2) and thyroid cancer (Table 1), besides two out of five data sets of lung carcinoma, because the IDH1 mutation has only been found in glioblastoma, thyroid cancer, and acute myeloid leukemia. The relationship between IDH2 expression and the mutation in cancer is less clear (Tables 1 and 2). We did not have access to microarray data sets on acute myeloid leukemia to investigate whether IDH1 and/or IDH2 expression is also elevated in this type of cancer.
The capacity to produce NADPH in normal human brain, as well as wild-type and IDH1R132-mutated glioblastoma, is represented for 55% to 65% by IDH, for 30% by the irreversible oxidative pentose phosphate pathway, and for 10% by MDH and H6PDH (Bleeker et al. 2010). Again, this was a surprising finding. We expected at least to find a lower contribution of IDH to the total capacity of NADPH production in IDH1R132-mutated glioblastoma. However, the relative contributions by the different dehydrogenases remained the same, despite the fact that only IDH activity was decreased significantly. This discrepancy may well be due to the small number of glioblastoma samples included in the metabolic mapping study (n=13 for both groups), but it may also be a biological phenomenon that is related to the constant contribution of the dehydrogenases to the total NADPH production capacity in the different tissues as discussed above.
In conclusion, the present study reveals that in humans, the relative contribution of IDH activity to NADPH production capacity in the cerebrum and glioblastoma is largely unlike that in other organisms such as rodents, substantiating that reduction in NADPH production capacity is significant due to the IDH1R132 mutation in humans but not in rodents. It makes rodents an unsuitable model to study functional consequences of the IDH1R132 mutation in human glioblastoma.
Footnotes
Acknowledgements
The careful preparation of the manuscript by Ms. Monique Arendse is gratefully acknowledged. We are also grateful to Prof. Dr. Alberto Bardelli, Laboratory of Molecular Genetics, University of Torino Medical School, Italy, who enabled the sequencing of the IDH1 and IDH2 genes in the glioblastomas.
The author(s) declared no potential conflicts of interest with respect to the authorship and publication of this article.
The author(s) received no financial support for the research and authorship of this article.