
Abstract
We had previously shown NADPH diaphorase activity in fixed tissue slices of the insular cortex of the Syrian golden hamster (Mesocricetus auratus). The objective of this work was to determine the chemical identity of agents responsible for the observed NADPH diaphorase activities. Three different enzymatic NADPH diaphorase activities were distinguished in the insular cortex. (a) The activity seen in endothelial cells was not characterized histochemically, but it co-localized with eNOS-like immunoreactivity. (b) The neuronal Type I activity showed little sensitivity to 10-5 M dicoumarol, could use either α- or β-NADPH with almost equal facility, and co-localized with nNOS-like immunoreactivity. This activity was primarily attributable to nNOS. (c) The neuronal Type II activity was greatly attenuated by 10-5 M dicoumarol, had a strong preference for β-NADPH (rather than α-NADPH), and did not co-localize with any NOS-like immunoreactivity. These characteristics also apply to the NADPH diaphorase activity observed in the diffuse blue band in Layers II and III of agranular and dysgranular insular cortex and in the meshwork of cortical fibers. This staining was due primarily to a dicoumarol-sensitive dehydrogenase(s), either an isozyme of DT diaphorase (EC 1.6.99.2), or NADPH dehydrogenase (quinone) (EC 1.6.99.6), or to a novel dicoumarol-sensitive NADPH dehydrogenase.
AN ENZYME is said to be an NADPH diaphorase if it can transfer electrons from NADPH to a colorless, soluble tetrazolium salt, producing a colored, insoluble formazan derivative (Stoward et al. 1991a). In unfixed tissue or cell extracts, many different enzymes [e.g., nitric oxide synthase (NOS), dehydrogenases, the enzymes of the mitochondrial respiratory chain, and the cytochrome P450 system](Pearse 1972b; Vincent 1995) have NADPH diaphorase activity. In fixed cell extracts and tissues, many of these enzymes are apparently inactivated, and in some cases only NOS retains its NADPH diaphorase activity (Hope et al. 1991; Matsumoto et al. 1993; Tracey et al. 1993).
Nitric oxide (NO) is believed to serve as a neuromodulator or neurotransmitter in a number of different processes, including a model of a mechanism for a type of memory, long-term potentiation (LTP) (for review see Schuman 1995). The insular cortex is crucial for another type of memory, the conditioned taste aversion (CTA) (for review see Yamamoto et al. 1994).
The Syrian golden hamster (Mesocricetus auratus) is a well-established animal model for gustatory studies (for review see Smith and Frank 1993). Previous work in our laboratory has shown NADPH diaphorase activity in formalin-fixed slices of the insular cortex (the region of cortical gustatory activity) of the Syrian golden hamster (unpublished observations). This activity was observed in two different types of neurons (Types I and II), fibers, blood vessels, and a diffuse, broad band of staining located in Layers II and III of dysgranular and agranular insular cortex (unpublished observations). Given the specific association of both NO (and hence NOS) and the insular cortex with memory processes (i.e., LTP and CTA, respectively) we wanted to determine if any of the NADPH diaphorase activities of the insular cortex were caused by NOS.
Two experimental approaches were used: (a) a systematic study of the effects of variation in reaction parameters on diaphorase staining to determine which staining responses most closely reflect the known NOS diaphorase responses, and (b) direct determination of the presence of NOS by immunohistochemistry with commercially available antibodies to the isozymes of NOS.
Materials and Methods
All experiments were carried out on male Syrian golden hamsters (Charles River Labs; Wilmington, MA) weighing 120-190 g and were approved by the Center for Laboratory Animal Care of the University of Connecticut Health Center. All chemicals were purchased from Sigma (St Louis, MO) unless otherwise indicated. Animals were deeply anesthetized (Nembutal 80 mg/kg, IP; Abbot Laboratories, King of Prussia, PA) and intracardiac perfusion was performed using a constant pressure pump at an approximate flow rate of 2.8 ml/min. Washout (3-5 min) was followed by fixation in 4% formaldehyde (electron microscopic grade; Tousimis Research, Rockville, MD) or freshly depolymerized paraformaldehyde in 0.1 M sodium phosphate buffer, pH 7.4, for 45 min. The brain was removed and postfixed for 2 hr at 4C in the same fixative. The brain was then immersed either in 30% sucrose in 0.1 M sodium phosphate buffer, pH 7.4, until it sank to the bottom of the solution (for frozen sections) or in 0.1 M sodium phosphate buffer, pH 7.4 (for vibratome sections). Sections were cut at 35-μm thickness in the transverse plane and collected serially into cold (4C) 0.1 M sodium phosphate buffer, pH 7.4. To maintain enzymatic activities intact, sections were maintained at 4C in as many steps of the tissue cutting and processing as possible.
NADPH Diaphorase Histochemistry
The standard NADPH diaphorase reaction (Hope and Vincent 1989) consisted of preincubation of free-floating sections for 30 min in 0.3% Triton X-100 in 0.1 M sodium phosphate buffer, pH 8.5, followed by incubation for 1.5 hr at room temperature (22-26C; RT) in 1.04 mM NADPH, 0.315 mM nitroblue tetrazolium (Polysciences; Warrington, PA) in 0.3% Triton X-100 in 0.1 M sodium phosphate buffer, pH 8.5. For reactions that studied the effects of co-factors, chelators, enzyme inhibitors, competitive electron acceptor, or sulfhydryl inhibitor, it was necessary to ensure that the compound penetrated into cell compartments. For these studies, the preincubation step of both experimental and control groups was extended to 2 hr at RT. The NADPH diaphorase reaction was stopped by rinsing with 0.1 M phosphate buffer, pH 8.5. Sections were mounted on chromalum-subbed slides and allowed to air-dry. Sections were either counterstained with Neutral Red or dehydrated through graded ethanols to acetone (Valtschanoff et al. 1993a), then to xylenes, and coverslipped with DPX (BDH Laboratory Supplies; Poole, UK).
The reaction permitted ready visualization of Type I and II neurons, as well as the diffuse blue band and the background meshwork of fibers (see Results). At 1.5 hr, the reaction typically was not long enough to stain endothelial cells, so the effects on endothelial cell staining were not determined. The effects of several variables were studied.
pH. Preincubation and incubation reactions were run at pH 6.8, 7.4, or 8.5.
Elevated Temperature. Free-floating sections were placed in phosphate buffer in a microcentrifuge tube. The tube was then incubated for 5 min in a water bath at either RT or 55, 65, or 77C. Sections were then removed from the microcentrifuge tube and placed in phosphate buffer at RT. Preincubation and incubation then proceeded as normal.
Co-factors. Sections were incubated using equimolar amounts of either β-NADPH, α-NADPH, or β-NADH.
Chelators. Both the preincubation and incubation media included EDTA (1-10 mM) or EGTA (1-10 mM).
Enzyme Inhibitors. Both the preincubation and incubation media included one of the following (all referenced in Stoward et al. 1991b, unless otherwise noted): levamisole (2.5 mM; noncompetitive inhibitor of alkaline phosphatase); sodium azide (5mM; competitive inhibitor of mitchondrial respiratory enzyme transfer of reducing equivalents to terminal O2); miconazole (10-4 M; competitive inhibitor of cytochrome P450); a mixture of sodium azide (5 mM) and miconazole (10-4 M) to see if the staining was due to a combination of mitochondrial and cytochrome P450 enzymes; dicoumarol [10-4-10-6 M; competitive inhibitor of DT diaphorase and NADPH dehydrogenase (quinone) (Bairoch 1996)]; pyruvate (60 mM; competitive inhibitor of lactate dehydrogenase).
Competitive Electron Acceptor. Dichlorophenolindophenol (DPIP, 10-4 M) was used to capture electrons enzymatically transferred from NADPH (Pearse 1972a). Both preincubation and incubation media included DPIP.
Sulfhydryl Inhibitor. N-ethyl maleimide (NEM, 10 mM) was used to irreversibly modify sulfhydryl groups (such as glutathione or thiols on proteins) that could otherwise donate their reducing hydrogens. NEM (10 mM) was also combined with pyruvate (60 mM), because this combination inhibits activity due to both endogenous sulfhydryls and to lactate dehydrogenase (NADPH diaphorase activity produced by this combination is the so-called “nothing dehydrogenase” effect) (Van Noorden et al. 1985).
Each histochemical test was assessed in at least three animals, and in each animal a minimum of nine sections were examined. Results were qualitatively consistent for all sections. For each animal, adjacent sections served as controls. Experimental sections were scored relative to their controls, which were preincubated and reacted for the same lengths of time and at the same pH as the experimental sections.
Immunohistochemistry
Washout, fixation, postfixation, and sectioning were the same as for brain sections used for NADPH diaphorase histochemistry. Polyclonal antibodies were preincubated with hamster liver acetone proteins (1% in 0.01 M PBS, pH 7.4, 30 min at RT) (Sandra Hill, personal communication) to quench nonspecific antibodies. Free-floating sections were blocked with 10% heat-inactivated goat serum (HIGS; Boehringer Mannheim, Indianapolis, IN) in PBS + 0.1% NP40 for 2 hr at RT with agitation. The blocking solution was aspirated, and then free-floating sections were incubated with antibodies to human NOS (rabbit polyclonal anti-nNOS, anti-eNOS and anti-macNOS; mouse monoclonal anti-nNOS and anti-eNOS) (Transduction Laboratories; Lexington, KY) all at 1:500 in 10% HIGS in PBS + 0.1% NP40 for 24 hr at 4C. Sections were rinsed with PBS + 0.1% NP40. After a second blocking with 10% HIGS in PBS + 0.1% NP40 (2 hr at RT), sections were incubated with the species-appropriate biotinylated goat anti-IgG (1:100; Boehringer Mannheim) in 10% HIGS in PBS + 0.1% NP40 overnight at 4C. Sections were then rinsed in PBS + 0.1% NP40, followed by further rinsing in 0.1 M sodium phosphate buffer + 0.1% NP40 (pH 7.4), and endogenous peroxidases were quenched with 0.5% H2O2, in 0.1 M phosphate buffer (pH 7.4) for 20 min. Sections were rinsed with 0.1 M sodium phosphate buffer + 0.1% NP40 (pH 7.4), and then antibodies were visualized with an ABC reaction (Vectastain Elite ABC Peroxidase kit; Vector Laboratories, Burlingame, CA) in 0.1 M sodium phosphate buffer, pH 7.4, using DAB histochemistry. Two sets of control experiments were carried out: sections were incubated either without the primary or without the secondary antibody.
Two methods were used to determine if individual neurons stained for both nNOS and NADPH diaphorase. (a) After reaction with DAB, sections were temporarily mounted (on plain, nonsubbed slides) and coverslipped using a 3:1 mixture of glycerol and 0.1 M sodium phosphate buffer, pH 7.4. The location of cells stained with DAB was mapped using a camera lucida. Coverslips were then removed, sections returned to phosphate buffer, and subsequently reacted for NADPH diaphorase as previously described. These sections were then mounted, cleared, and coverslipped with DPX. The sections were then re-drawn, and the location of cells that stain for NADPH diaphorase was drawn. Alternatively, (b) after reaction with DAB, free-floating sections were reacted for NADPH diaphorase, and then mounted but not coverslipped. Drawings were made of the mounted sections, marking the location of cells that stain for NADPH diaphorase. The slides were then treated with a warm (#72C) mixture of alkali (pH 9 glycine-NaOH buffer) and dimethylformamide to remove the blue formazan precipitate (Richard Weinberg, personal communication), so as to reveal the DAB reaction product. Slides were allowed to dry. Some sections were de-fatted in xylene for 4 hr, and then osmicated (0.2% OsO4) to intensify the DAB reaction product. Sections were then cleared and coverslipped with DPX, and the location of the cells reacted with DAB (i.e., cells that contain NOS) was drawn.
Statistical Analysis
For comparison of double- and single-labeled cells in each animal, the number of cell profiles in each category (i.e., NADPHd+/nNOS+, NADPHd+/nNOS−, NADPHd−/nNOS+) was counted in the insular cortex in at least six sections per animal and was expressed as a percent of the total number of labeled cells in each animal. The percentages in each category from three animals were compared with the analysis of variance for repeated measures (StatMost for Windows; Data-Most, Sandy, UT). Post hoc comparisons were made using Newman-Keuls' test.
Photographs
Photographs were taken using a Leitz microscope (Leica; Deerfield, IL) and Ektachrome 160T color slide film (Kodak; Rochester, NY). Developed photographic slides were scanned (Microtek Lab; Redondo Beach, CA) and then cropped, arranged, and labeled in Photoshop 4.0 (Adobe Systems; San Jose, CA).
Results
Control Results
Details of the control results for the NADPH diaphorase activity in the insular cortex of the Syrian golden hamster will be presented elsewhere (unpublished observations). Briefly, after 1.5 hr of incubation at RT, pH 8.5, the following types of activities were observed.
Neuronal Type I. These cells resembled Golgi-impregnated neurons, with dark blue reaction product appearing to fill the perikarya, dendrites, and axons (Figure 1a). The reaction product was confined to the cytoplasm, because when the plane of section revealed the nucleus the nucleus was unstained. Type I cells were scattered, with most present in the deep layers (unpublished observations).
Neuronal Type II. These cells also had a nonstaining nucleus, but the histochemical reaction only stippled the perikarya and the most proximal regions of dendrites (Figure 1b). This stippling did not reflect an incomplete reaction because the NADPH diaphorase reaction never filled in these cells, even when the reaction was allowed to proceed for over 12 hr. Type II neurons were almost exclusively located in an accumulation of many such cells in Layers II and III of dysgranular and agranular insular cortex (Figures 1c and 1d).
Neuronal Fibers. In transverse sections, stained fibers could be seen running in all directions and in all layers throughout the insular cortex (Figures 1a and 4c). Some were quite fine and followed tortuous paths in their travel. Many had swellings or varicosities which were either globular or elongated. Although fine fibers twisted around neurons, none formed clearly identifiable pericellular nests.
Diffuse Blue Band. There was a diffuse blue band of staining in Layers II and III of agranular and dysgranular insular cortex (Figures 1b–1d) and extending along the rostrocaudal length of the rhinal fissure (unpublished observations). Nonstained cell profiles were visible within this band, as was the accumulation of neuronal Type II cells described above (Figure 1b). The combination of many Type II cells and the diffuse blue band easily marked this region by the rhinal fissure so that it was visible even to the naked eye (Figure 1c).
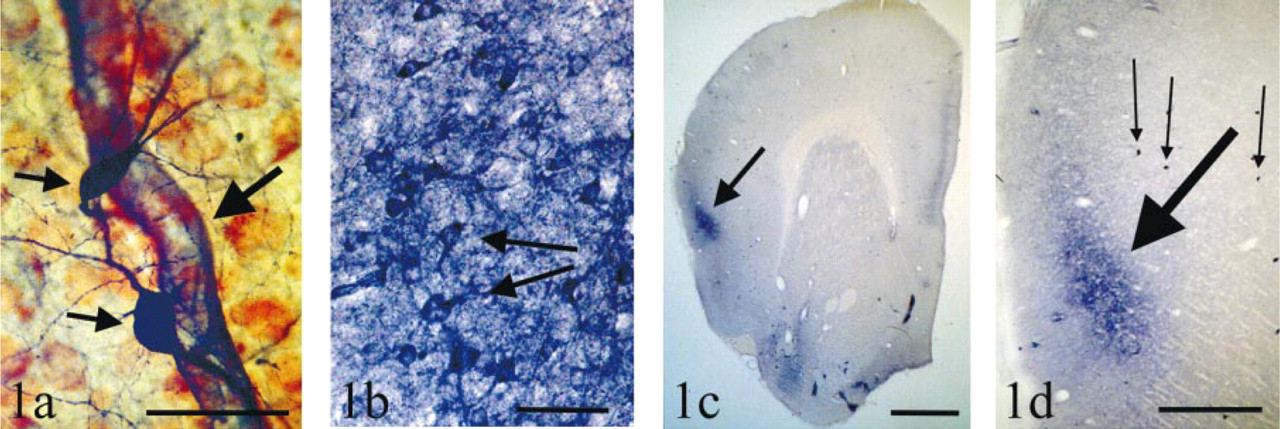
Examples of control NADPH diaphorase staining in the insular cortex of the Syrian golden hamster. (a) Examples of Type I neuron and endothelial cell staining. Type I neurons (small arrows) are typically scattered singly throughout the insular cortex. The cytoplasm and the axonal and dendritic processes of Type I neurons are densely stained but the nucleus is unstained. Type I neurons are typically relatively large, with multipolar processes and very few spines. In this example, two neurons are near a blood vessel (large arrow), and the endothelial cells of the blood vessel are also stained blue by the NADPH diaphorase reaction. Red cells are neurons counterstained with neutral red. Transverse section. Bar = 50 μm. (b) Examples of Type II neurons and the diffuse blue band staining. Many Type II neurons are seen (arrows mark two examples) and are mostly restricted to Layers II and III of dysgranular and agranular insular cortex. There is a “stippled” or “punctate” reaction product in the cytoplasm of the soma and the most proximal regions of dendrites, and the nucleus is unstained. Type II neurons are typically smaller than the Type I neurons. Type II neurons are surrounded by diffuse dark blue staining, part of the “diffuse blue band” (see c and d). Tangential section. Bar = 24 μm. (c) The diffuse blue band is seen even with the naked eye. Transverse section of one cerebral hemisphere of the hamster. Dorsal is up, lateral is to the left. A dark blue band (arrow) is restricted to Layers II and III of dysgranular and agranular insular cortex. This diffuse blue band consists of an accumulation of many Type II neurons and the diffuse blue staining shown in Figure 1b. Bar = 1000 μm. (d) Comparison between diffuse blue band and Type I neuron staining. This is a detail of c, with dorsal up and lateral to the left. The diffuse blue band (large arrow) and Type I neurons (small arrows mark three examples) are both shown. Note that Type I neurons are typically scattered singly, and are very easy to discern. Bar = 500 μm.
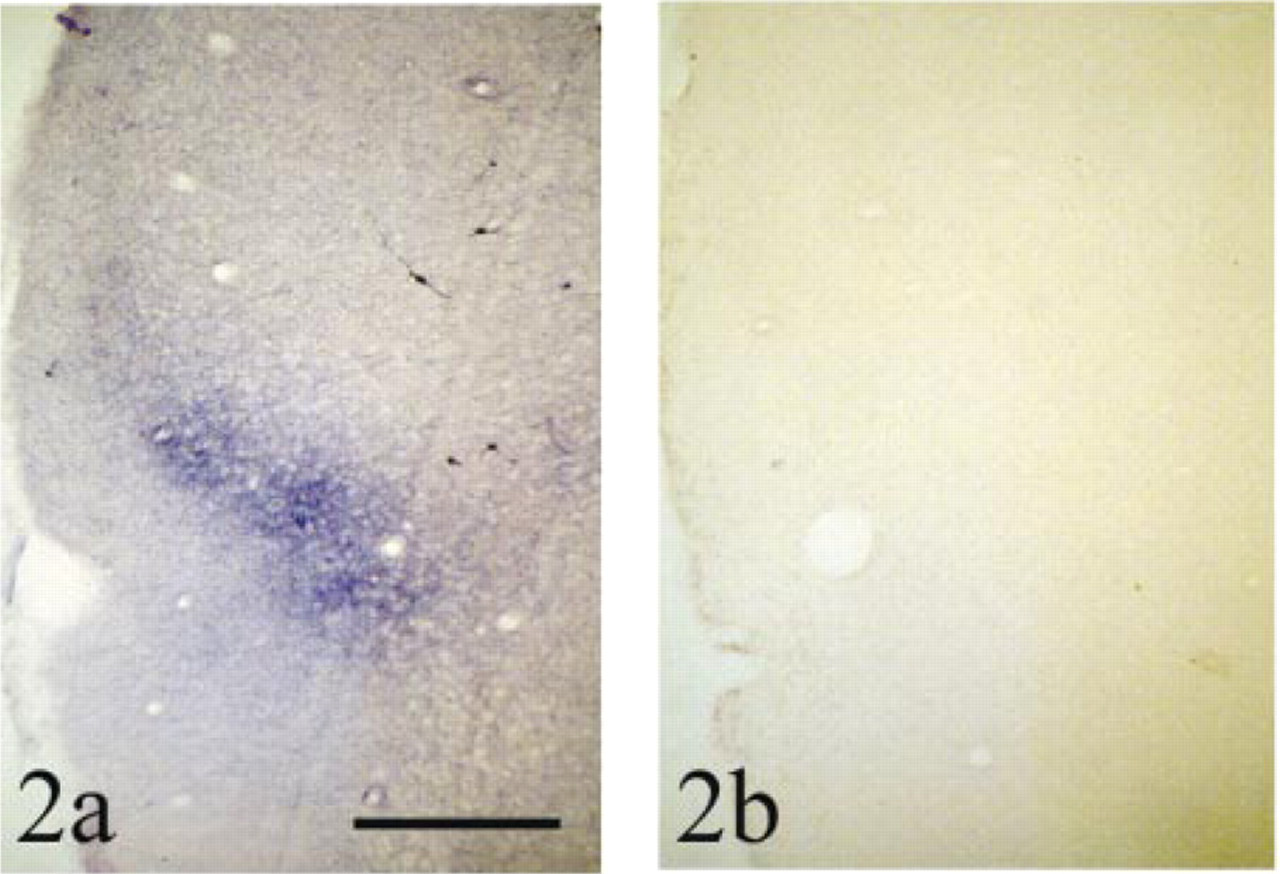
Effects of a 5-min pre-exposure to elevated temperature on the NADPH diaphorase reaction in the insular cortex. Both examples are from transverse brain sections from the same animal (oriented as in Figure 1c) with β-NADPH, pH 8.5, for 1.5 hr at room temperature (23C). (a) Pre-exposure to 23C (control). (b) Pre-exposure to 77C. All staining is abolished by pre-exposure to 77C and therefore is enzymatic in origin. Bar = 1000 μm.
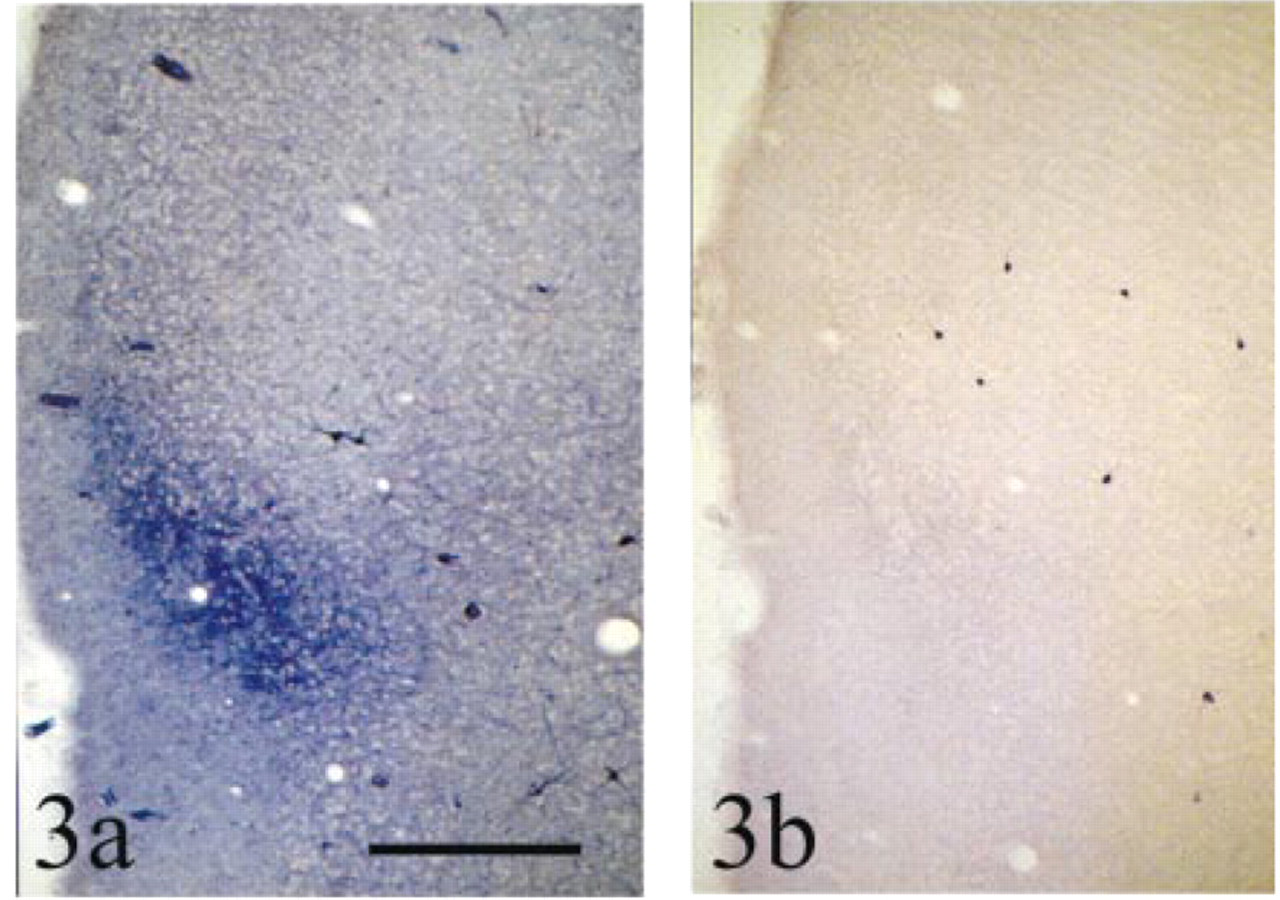
Effect of different co-factors on the NADPH diaphorase reaction in the insular cortex. Both examples are from transverse brain sections from the same animal (oriented as in Figure 1c), pH 7.4 for 1.5 hr at room temperature (23C). (a) β-NADPH as co-factor (control). (b) α-NADPH as co-factor. Note that the staining of the diffuse blue band is much attenuated but that Type I neurons are still easily discernible. Also note that background staining is much attenuated. See text for details. Bar = 1000 μm.
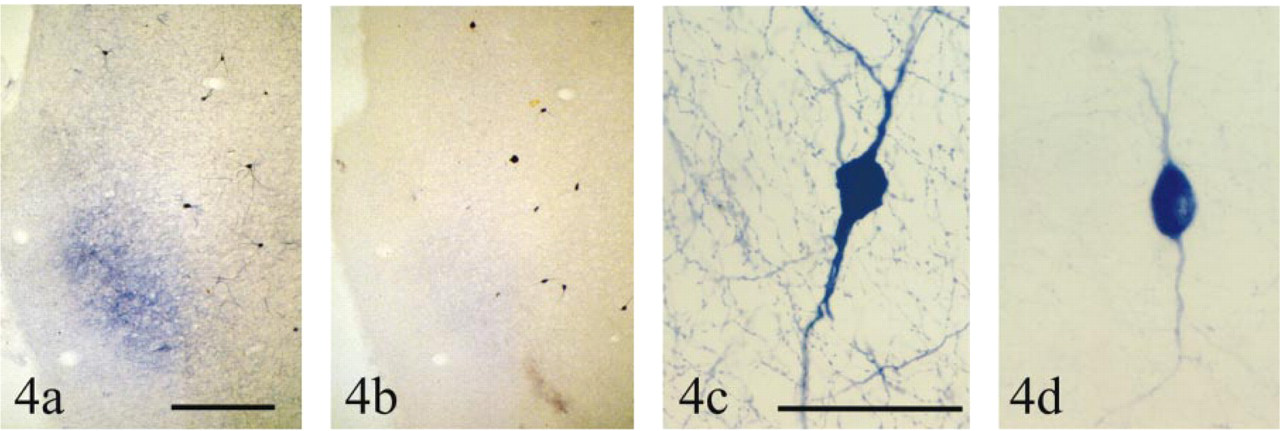
Effects of dicoumarol on the NADPH diaphorase reaction in the insular cortex. All reactions are in transverse sections through the insular cortex (oriented as in Figure 1c) using β-NADPH, pH 8.5, for 1.5 hr at room temperature (23C). (a) Control, showing the diffuse blue band (with a few Type II cells contained within it), many Type I cells, and the meshwork of fibers in the background. (b) When incubated in the presence of 10-5 M dicoumarol, the staining in the diffuse blue band is much attenuated, as is much of the background meshwork, but Type I neurons are still easily discernible. Bar = 1000 μm. (c) Control, showing staining in a Type I neuron and the rich meshwork of stained fibers (d) Staining of a Type I neuron incubated in the presence of 10-5 M dicoumarol, showing that much of the staining of the soma and principal dendrites is still present but that staining in the meshwork of background fibers is much attenuated. See text for details. Bar = 50 μm.
Neurons of the insular cortex are labeled by antibodies to nNOS but not to eNOS. (a) Neuron labeled by antibodies to nNOS; background is somewhat dark because this section was osmicated after the ABC reaction. No endothelial cells are labeled. Bar = 25 μm. (b) Endothelial cells labeled by antibodies to eNOS; no neurons are labeled. Bar = 63 μm.
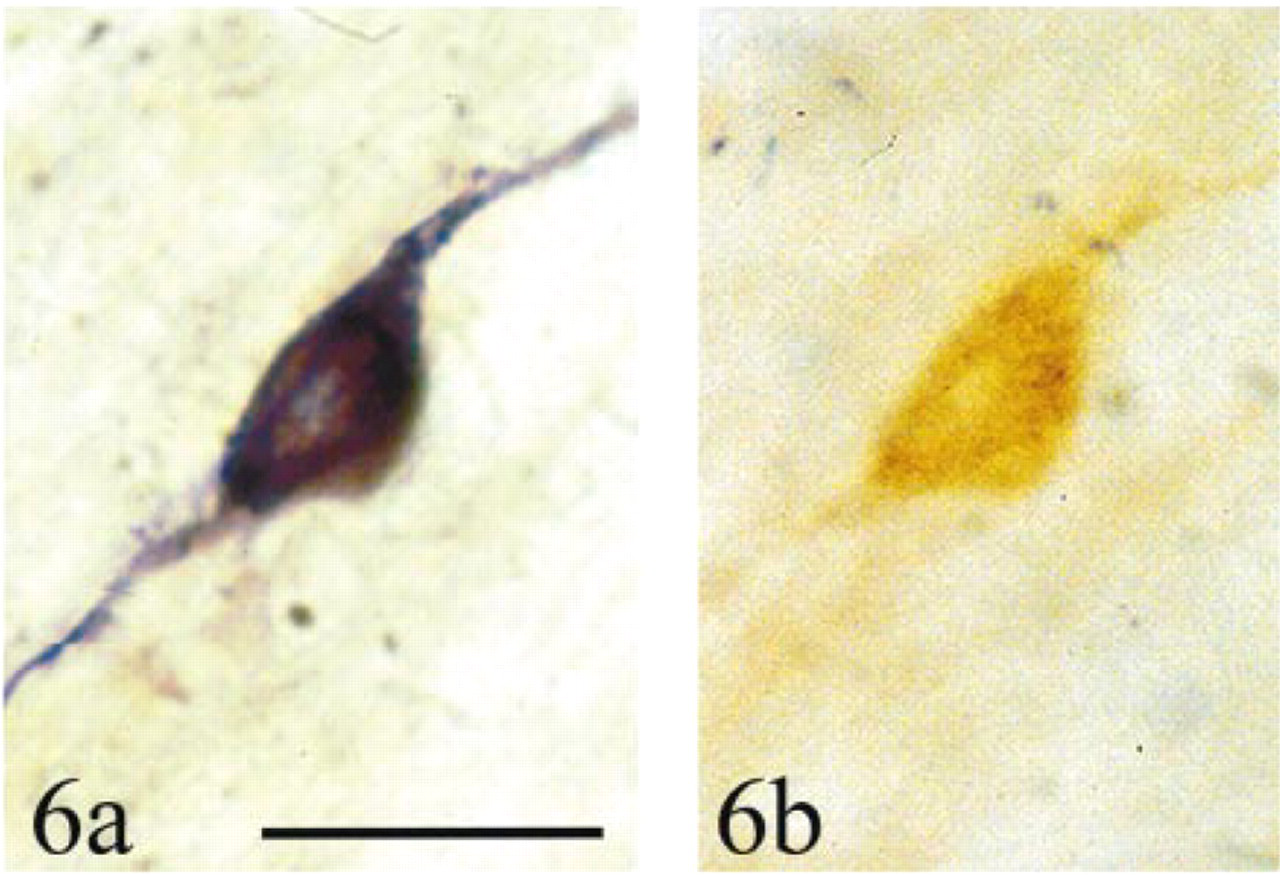
Example from a double label experiment: Type I neurons show nNOS-like immunoreactivity. (a) Neuron in the external capsule labeled with anti-nNOS antibody and then reacted with NADPH diaphorase histochemistry. (b) After removal of the blue formazan precipitate of the NADPH diaphorase reaction, the nNOS-like immunoreactivity (stained brown with an ABC reaction) can be seen. Bar = 25 μm.
In addition, although not typically seen after 1.5 hr, after the reaction had proceeded for several hours the endothelial cells lining the cerebral blood vessels also stained with NADPH diaphorase activity (Figure 1a).
Histochemical Experiments for NADPH Diaphorase Activity
Effects of pH 6.8-8.5 (n = 4 animals). Within this range, a change in pH affected the background color of the sections. They were very pale lavender at pH 8.5, light blue at 7.4, and dark blue at 6.8. Although it appeared that the neuronal Type II response was abolished at pH 6.8, close examination revealed that the response was still present but was masked by the dark blue color of the background at this pH. It was not possible to determine from visual inspection if either the diffuse blue band or the fiber meshwork was present at pH 6.8. The neuronal Type I response, far more robust than the Type II, was easy to see at all three pHs. All subsequent qualitative tests were run at both pH 7.4 and 8.5, and the only discernible effect was to change the background color of the reaction, irrespective of the test (compare Figures 1d and 3a).
Effect of Pre-exposure to Elevated Temperatures (n = 3 animals). Exposure of sections to elevated temperature for 5 min diminished (65C) or abolished (77C) both neuronal Type I and Type II responses, as well as that of the diffuse blue band. Sections exposed to RT and 55C were unaffected in their staining. This sensitivity to elevated temperatures indicates that these responses are enzyme-mediated (Figures 2a and 2b).
Effect of Different Co-factors. Neuronal Type I cells were stained when either α-NADPH (n = 5 animals) or β-NADPH (n = 10), was used (Figures 3a and 3b). At the standard incubation time of 1.5 hr, however, the response with α-NADPH was slightly less robust than with β-NADPH. Somata were more weakly stained and dendrites were not stained for long distances (Figure 3b). Type II neurons and the diffuse blue band, however, were virtually absent when α-NADPH was used as substrate for the standard incubation time of 1.5 hr (Figure 3b). This was not an absolute inability to use α-NADPH, however, because when the reaction was allowed to proceed for many hours (10-20 hr) the response intensity resembled the normal response (data not shown). Interestingly, much of the meshwork of fine cortical fibers seen with β-NADPH was also absent at 1.5-hr incubation with α-NADPH and yet was present after extended incubation. nNOS has been reported to use both α- and β-NADPH (Hope and Vincent 1989). When the sections were incubated with β-NADH (n = 5 animals) instead of β-NADPH, the entire section was darkly stained so that it was not possible to tell if β-NADH could be used by the Type I neurons (data not shown). Incubation in the absence of either α- or β-NADPH or of β-NADH (n = 4 animals) resulted in no staining (data not shown), so the reactions required a co-enzyme.
Effects of Chelators (n = 3 animals). In the concentration range tested, EDTA and EGTA had no effect. Therefore, none of the responses required Ca2+ or Mg2+ (data not shown).
Effect of Enzyme Inhibitors. The inhibitors were selected on the basis of their effect on common enzymes that are known to produce a response in the NADPH diaphorase reaction (Stoward et al. 1991b). None of the inhibitors had any effect on neuronal Type I responses, except for a slight attenuation of the intensity of staining (similar to what was seen after 1.5-hr incubation with α-NADPH) with ≥ = 10-5 M dicoumarol (n = 5 animals) (Figures 4a–4d). The same concentrations of dicoumarol, however, greatly attenuated the neuronal Type II response seen in the standard 1.5-hr incubation (n = 5 animals) (Figures 4a and 4b). Similarly, the same concentrations of dicoumarol greatly attenuated the NADPH diaphorase activities of the diffuse blue band and much of the meshwork of cortical fibers (n = 5 animals) (Figures 4a–4d). Dicoumarol is known to be a specific and potent inhibitor of two diaphorases, DT diaphorase (E.C. 1.6.99.2) (Ernster et al. 1962), and NADPH dehydrogenase (quinone) (E.C. 1.6.99.6) (Koli et al. 1969). The other inhibitors had no effect on any of the staining.
Effect of Electron Acceptor. DPIP greatly attenuated all responses: neuronal Types I and II, the diffuse blue band; and the meshwork of cortical fibers (n = 3 animals; data not shown). This indicates that the NADPH diaphorase activities correspond to enzymes at the correct redox potential difference to transfer electrons from NADPH to DPIP instead of to NBT. Failure to transfer electrons to NBT results in an absence of colored formazan reaction product. The NADPH diaphorase activities of both NOS and dehydrogenases are known to transfer electrons from NADPH to DPIP (Levine et al. 1960; Ernster et al. 1962; Hope and Vincent 1989).
Effect of Sulfhydryl Inhibitors. NEM markedly attenuated neuronal Type I responses and abolished neuronal Type II and diffuse blue band responses (n = 3 animals; data not shown). Therefore, the reaction mechanism for these reactions required sulfhydryl groups. The mechanisms for NOS and dehydrogenase NADPH diaphorases are known to proceed via binding to sulfhydryl groups (Pearse 1972b; Hope and Vincent 1989). The combination of NEM + pyruvate, which eliminates the “nothing dehydrogenase” effect (Van Noorden et al. 1985; Stoward et al. 1991), had similar inhibitory effects as NEM alone (data not shown). Pyruvate alone had no effect (tested as an inhibitor of lactate dehydrogenase; data not shown), so the effect of NEM + pyruvate was due to the effect of NEM.
These histochemical tests showed that all NADPH diaphorase activities were abolished by elevated temperature and were attenuated by DPIP and NEM. The NADPH diaphorase activity of Type I neurons could use either α- or β-NADPH. In contrast, the NADPH diaphorase activities of Type II neurons and of the diffuse blue band had a strong preference for β-NADPH over α-NADPH and were greatly attenuated by dicoumarol (Table 1). Taken together, these results indicate that the bulk of the neuronal Type I response was most likely produced by NOS (Hope and Vincent 1989) but that the neuronal Type II response, the diffuse blue band, and much of the cortical meshwork of fibers were most likely produced by DT diaphorase and/or NADPH dehydrogenase (quinone), and/or by a novel but similar enzyme (Levine et al. 1960; Ernster et al. 1962; Koli et al. 1969; Dixon 1979). The neuronal Type II and diffuse blue band responses were easier to see at pH 8.5, but this was probably because the background was pale (relative to pH 6.8 and 7.4) and not because the responses were more intense at pH 8.5.
Differential histochemical responses: visual assessment of NADPH diaphorase activity after 1.5 hr at room temperature a
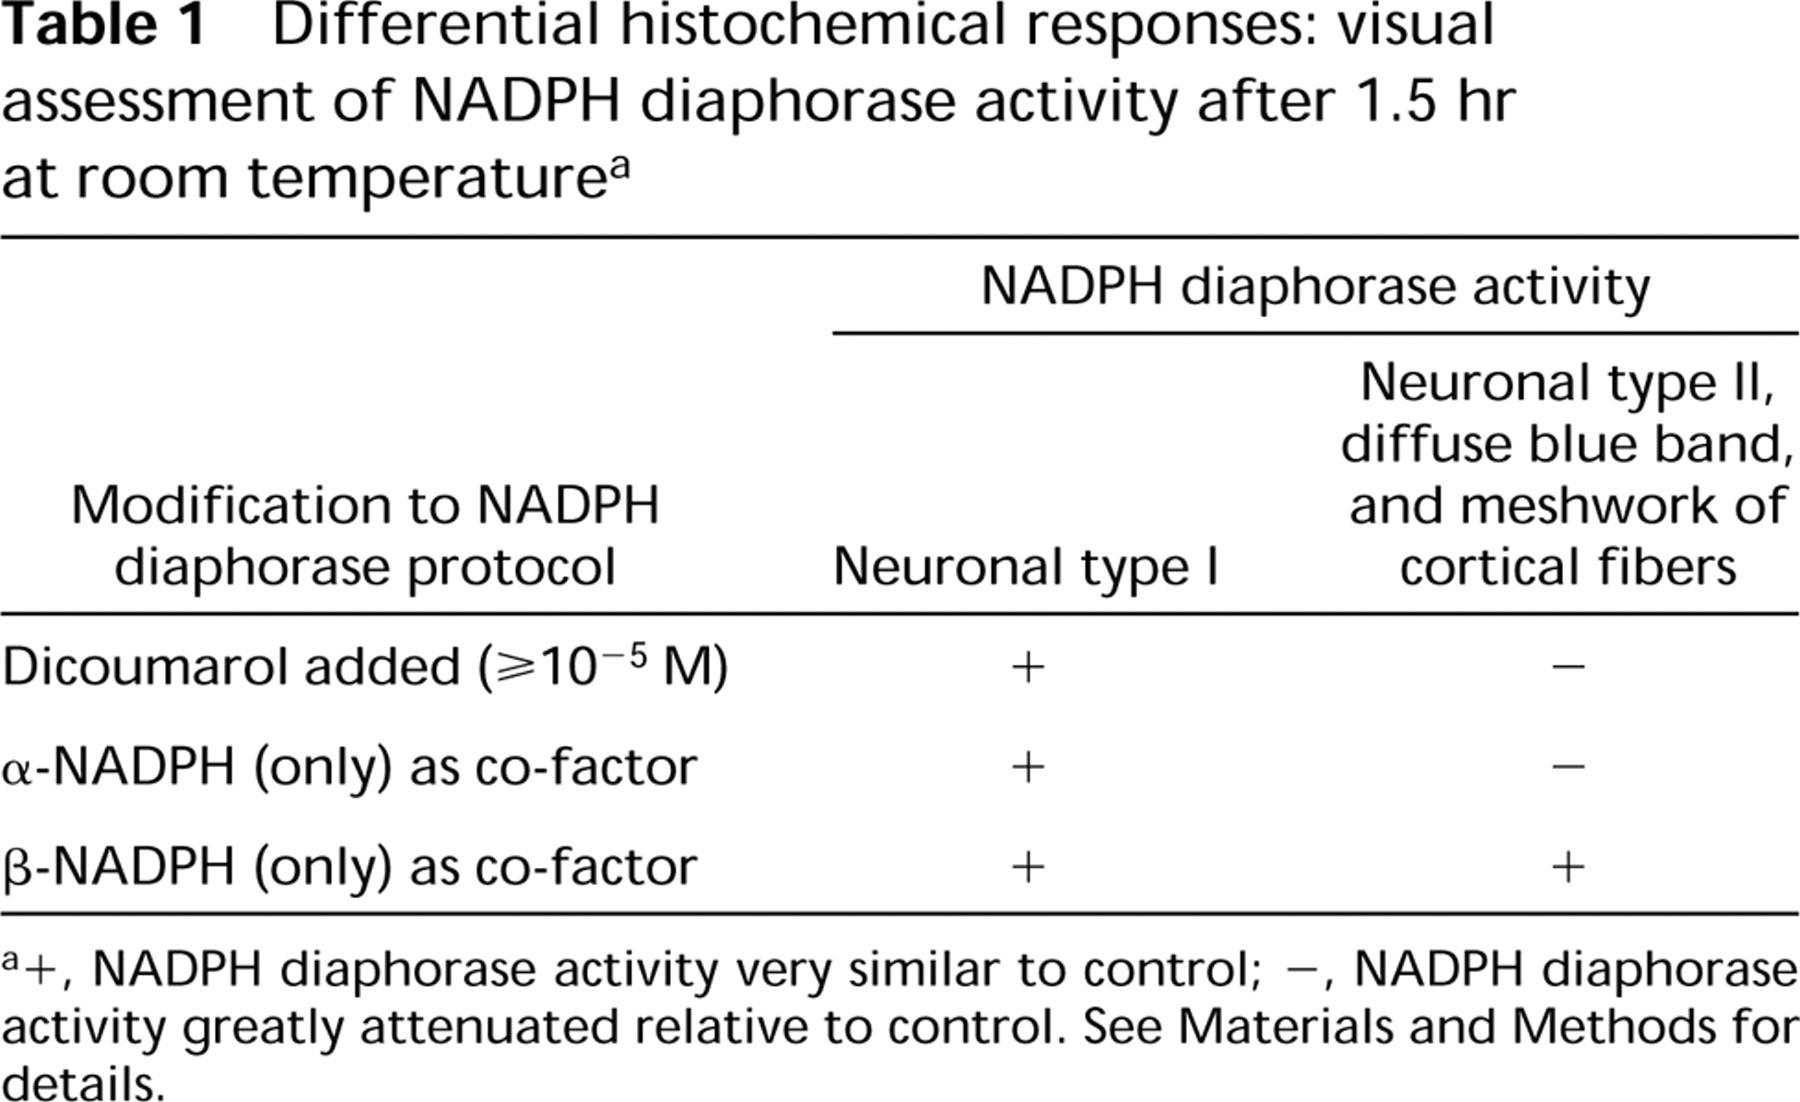
+, NADPH diaphorase activity very similar to control; −, NADPH diaphorase activity greatly attenuated relative to control. See Materials and Methods for details.
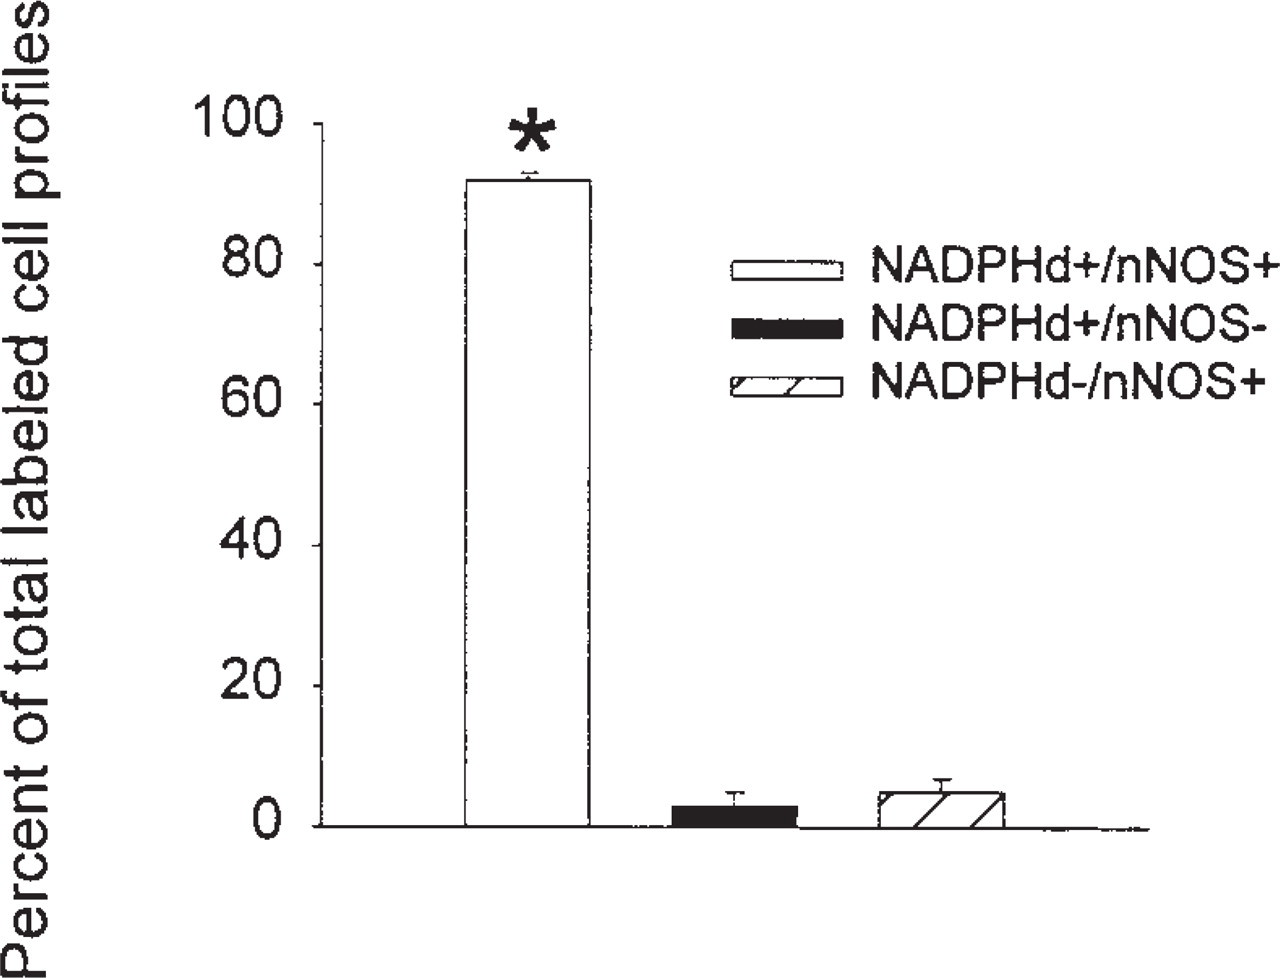
Results of double label experiments with anti-nNOS antibodies and NADPH diaphorase histochemistry. Most cells are double labeled (NADPHd+/nNOS+). The percentage of double labeled cells is larger than the percentage of singly labeled cells (∗ p<0.05). n = 3 animals; total number of cells was 484.
Antibody Experiments
Preliminary dilution series experiments established 1:500 as the most effective concentration for specific labeling by polyclonal anti-nNOS and monoclonal anti-eNOS in the hamster insular cortex. There was slightly less background in vibratome than in frozen sections (data not shown). The other antibodies (polyclonal anti-macNOS and anti-eNOS, monoclonal anti-nNOS) were also tested with dilution series but did not show any specific labeling.
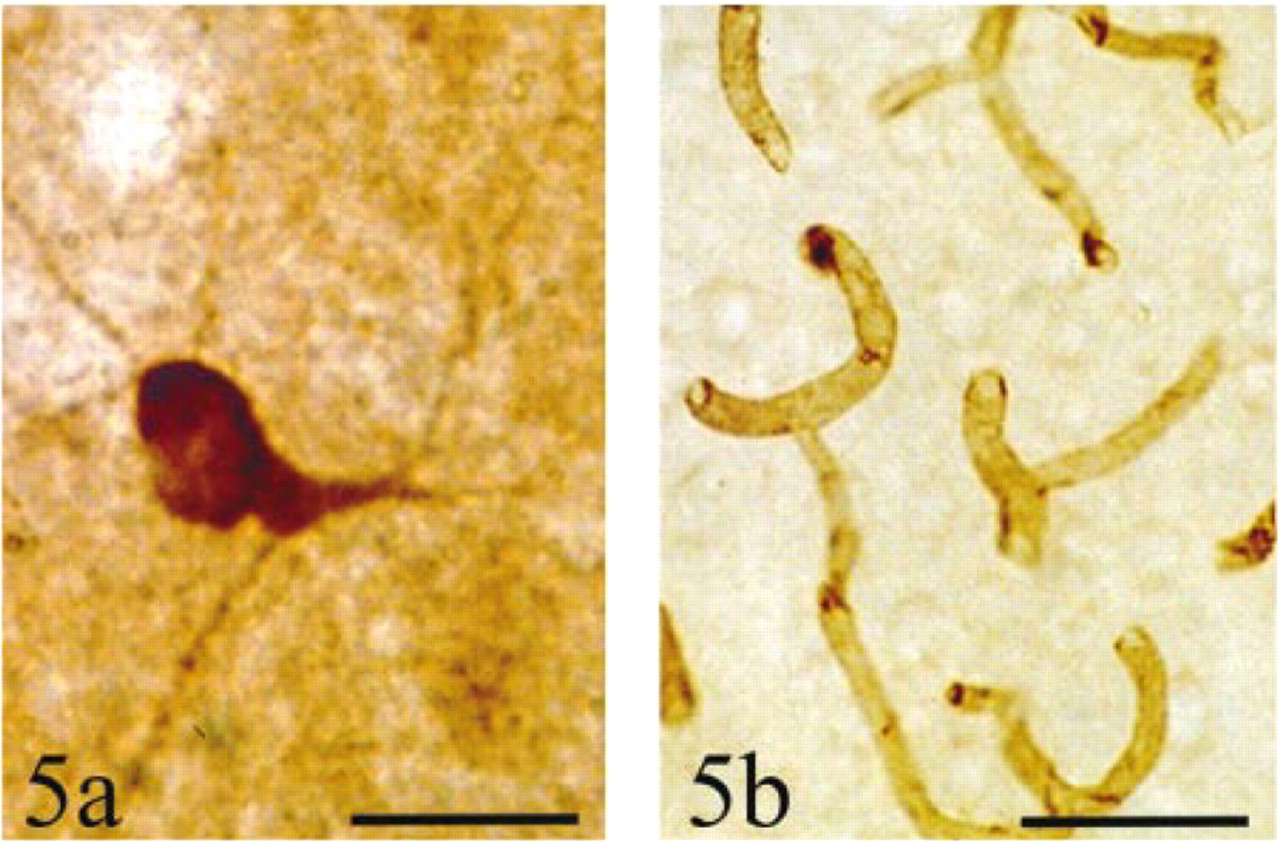
Antibodies against the nNOS isozyme labeled scattered single cells. Cell somata and principal dendrites were labeled, as were a few scattered fibers running through the cortex (Figure 5a). Neither fine dendrites nor dendritic spines were seen. Similarly, the rich meshwork of cortical fibers visible with NADPH diaphorase staining was not seen. Occasionally a cell was labeled in Layers II-III of dysgranular and agranular insular cortex, but this label resembled that of Type I neurons. No label resembling the accumulation of Type II neurons or the diffuse blue band was observed.
Antibodies against the eNOS isozyme labeled only cortical endothelial cells (Figure 5b). Nothing resembling Type I or II neurons was labeled, and there was no label corresponding to the diffuse blue band.
In double label experiments (NADPH diaphorase and nNOS) in three animals, the number of labeled cell profiles in the insular cortex was scored in one of three categories: NADPHd+/nNOS+, NADPHd+/nNOS−, or NADPHd−/nNOS+ (Figures 6a and 6b; total number of cells counted was 484). Most cells were double labeled (92 ± 1%), some cells were labeled by NADPH diaphorase but not anti-nNOS (3 ± 2%), and others were labeled by anti-nNOS but not NADPH diaphorase (5 ± 2%) [F(2,4) = 659.88; p<0.001] (Figure 7). Subsequent analysis showed that the number of double labeled cells was significantly different from that of singly labeled cells (p<0.05), but that the number of singly labeled cells was not different from each other. These results showed that under the present experimental conditions the neuronal Type I response was reliably associated with the presence of the nNOS isozyme.
No antibody label was ever seen to correspond to the diffuse blue band, despite repeated attempts with prolonged incubations, permeabilizing agents, frozen and vibratome tissues, and use of commercially available mono- and polyclonal antibodies to nNOS, eNOS, and macNOS.
Discussion
Methodological Considerations
The preservation of activity (both enzymatic and immunologic) in the tissue was central to the results. This was facilitated in two ways: by fixation with 4% formaldehyde and by maintaining the tissues at 4C for as many steps of the processing as possible.
There has been much debate as to the proper fixation conditions for histo- and immunohistochemical demonstration of NOS. Sensitivity to fixation by NOS was reported by Bredt et al. (1990) and Dawson et al. (1991), who used 0.1% and 2% formaldehyde, respectively, and by Schmidt et al. (1992), who used a mild acetone fixation. The sensitivity of NOS to fixation has been also reported by Wenland et al. (1994), who noted nNOS in hippocampal pyramidal cells when 2% but not 4% formaldehyde was used. Contrasting with these reports of the necessity of light fixation to properly reveal NOS are studies by Spessert and Layes (1994) and Valtschanoff et al. (1993a,b), who found that the intensity but not the pattern of staining was affected by fixation with either formaldehyde or a mixture of formaldehyde and glutaraldehyde. These contrast with the findings of Matsumoto et al. (1993) showing that extended fixation with 4% formaldehyde was necessary to inactivate all other diaphorases except for NOS. This issue has not been resolved satisfactorily. This issue of fixation sensitivity notwithstanding, the results strongly suggest at least three different enzymatic sources for the observed diaphorase activity (see below).
The histochemical experiments were subject to certain limitations. First, they were qualitative, not quantitative. The experiments were run for a period of time sufficient to see a qualitative difference, if one existed, on gross or microscopic visual inspection. For our purposes, 1.5 hr at RT was sufficient to see a difference between control and experimental conditions. Results that are more subtle than this would not be detected and would unknowingly be false-negatives.
Second, the conclusions from the inhibitor experiments depended on correct identification of the action of inhibitors. All inhibitor effects and working concentrations were selected from the literature. If an inhibitor has an undocumented effect, this will result in a false identification. Alternatively, if insufficient time was allotted to permit the inhibitor to penetrate into the appropriate cell compartment, a false-negative will be reported. This latter possibility was minimized by preincubating for 2 hr in the presence of 0.3% Triton X-100, far longer than the usual preincubation time of 10-20 min.
Third, most inhibitors were presented singly. Therefore, if several different enzymes contribute to the overall staining, inhibition of one or a few may not be sufficient to diminish the total staining. Two combinations were tested, (a) sodium azide and miconazole and (b) NEM and pyruvate. Sodium azide (5 mM) and miconazole (10-4 M) were presented simultaneously to see if a combination of mitochondrial and cytochrome P450 enzymes was contributing to the staining. This combination was found to have no detectable effect on the observed staining. NEM (10 mM) and pyruvate (60 mM) were also tested, because this combination inhibits the “nothing dehydrogenase” effect. This effect, first noted in the 1950s, occurred when no substrate was present in an enzymatic control reaction, but a colored reaction product was observed (Racker 1955). It was determined that part of the effect was due to endogenous sulfhydryls (e.g., cysteine side chains or glutathione) that were donating their hydrogens for reduction of the electron acceptor (Van Noorden et al. 1985). Another part of the effect was due to lactic dehydrogenase acting on endogenous lactate (Van Noorden et al. 1985). The combination of NEM and pyruvate, however, inhibits activity due to both endogenous sulfhydryls and lactate dehydrogenase but was no more effective than NEM alone, indicating that the Type II response was not a “nothing dehydrogenase” effect.
Fourth, experiments with inhibitors work only in a negative sense. If a reaction is blocked by the inhibitor, then (assuming there are no unknown inhibitor effects) the enzyme is scored as “present.” If nothing inhibits the reaction, though, there potentially remains something else, undetected, that may contribute to the stain. Therefore, although most of the neuronal Type I response appears to be attributable to nNOS, perhaps some other enzyme, thus far undetected, is contributing to the total staining.
Antibody experiments have other possible pitfalls. A major problem is the possible failure of the antibodies to penetrate into a compartment where the target antigen is located, resulting in false-negatives. This was minimized by including a detergent, 0.1% NP40, throughout the procedure. Unless a target antigen was located within multiply membraned organelles, e.g., in the matrix of the mitochondria, it is likely that permeabilization was not a major problem because two different antibodies, those to nNOS and eNOS, specifically bound to target antigens.
Another potential source of false-negatives is the slight differences between the immunogen (human nNOS and eNOS and mouse macNOS) and the endogenous antigen, such that the endogenous target may not be recognized by the antibody. An attempt was made to minimize this possibility by the use of polyclonal antibodies, which included antibodies raised against a variety of immunogenic sites. This strategy was not entirely successful. Although the polyclonal anti-nNOS worked and the monoclonal anti-nNOS did not, the polyclonal anti-eNOS did not work but the monoclonal anti-eNOS did.
Yet another source of potential false-negatives is if the antigen is present in tissue at levels below the detectability of the secondary system. A commercial ABC kit was used to visualize the primary antibodies because this struck a balance between high sensitivity and ease of use. It remains possible, however, that some signal went undetected because of insufficient amplification by the secondary antibody.
A potential source of false-positive responses is the endogenous cellular peroxidases. This possibility was minimized by quenching the peroxidases by pretreating with excess H2O2.
A further potential source of a false-positive response is the presence in the tissue of an immunoreactive substance that is recognized by the antibody but that is not NOS. This possibility exists with any antibody and cannot be escaped. For this reason, all positive responses to NOS antibodies presented in this work are more precisely termed “NOS-like immunoreactivity.”
There Are at Least Three NADPH Diaphorase Activities in the Insular Cortex of the Hamster
The results lead to the conclusion that there are at least three different NADPH diaphorase activities in the insular cortex of the hamster. The neuronal Type I response was co-localized in neurons with immunoreactivity to nNOS, could use either α- or β-NADPH (but showed a slight response decrement with α-NADPH), and was not inhibited by any of the histochemical tests (except for a slight decrement with dicoumarol). This response pattern is consistent with the activity reported for what was subsequently identified as nNOS in tissue fixed with 4% formaldehyde (Hope and Vincent 1989; Hope et al. 1991). Although Spessert et al. (1994) reported that nNOS-containing short axon neurons of the olfactory bulb could not use α-NADPH, they used PLP fixative rather than just 4% formaldehyde. Given the apparent sensitivity of NOS to fixation conditions, as discussed above, it appears best to compare the present results with those seen by others who used the same fixative (4% formaldehyde), i.e., Hope and Vincent (1989). This co-localization of nNOS and the Type I NADPH diaphorase response by both histochemical and immunohistochemical methods strongly suggests that the NADPH diaphorase staining in Type I cells was attributable to nNOS. An alternative possibility is that the diaphorase staining was due to an enzyme that was obligately co-localized with nNOS, but no evidence for such an enzyme has been seen in any of the NOS purification studies (Bredt 1995).
The neuronal Type I response showed a slight diminution of the intensity of the response when either dicoumarol or α-NADPH was used. This can be interpreted in at least two ways: (a) nNOS has a sensitivity to dicoumarol and a slight preference for β-NADPH, at least in the hamster, or (b) the total staining in Type I neurons also contains a component of staining contributed by non-NOS diaphorases that are sensitive to dicoumarol and show a preference for β-NADPH (e.g., such as the neuronal Type II response). The second interpretation appears more likely because (a) Hope and Vincent (1989) demonstrated that the NADPH diaphorase activity of nNOS-containing neurons of the striatum (similar in their histochemistry to the present neuronal Type I cells; unpublished observations) was unaffected by 10-4 M dicoumarol, and (b) dicoumarol-sensitive diaphorases are widely distributed in many types of cells and tissues (Stoward et al. 1991b).
A third interpretation is that Type I neurons differ from Type II neurons only in having a greater concentration of non-NOS diaphorases. This interpretation would then hold that the dicoumarol has the same attenuating effect on neuronal Type I and II activities but that there is such a great concentration of enzyme in the Type I neuron that reaction product can accumulate and be visible. This interpretation appears unlikely given our demonstrated co-localization of neuronal Type I NADPH diaphorase activity with nNOS-like immunoreactivity [which has a very vigorous NADPH diaphorase activity (Dawson et al. 1991; and see our Results)] and the failure to inhibit neuronal Type I NADPH diaphorase activity even with a concentration of 10-4 M dicoumarol, a tenfold excess over the concentration shown to inhibit non-NOS NADPH diaphorase activity in fixed tissues (Hope and Vincent 1989) and unfixed cell lysates (Murphy et al. 1991).
A second NADPH diaphorase activity was co-localized in endothelial cells with immunoreactivity to eNOS. The typical 1.5-hr incubation was occasionally but not usually long enough to see this activity using the NADPH diaphorase reaction, so its histochemical characteristics were not systematically determined. However, this endothelial cell diaphorase activity was usually visible if the reaction was allowed to proceed longer (Figure 1a).
A third NADPH diaphorase activity was found in the Type II neurons, the diffuse blue band, and in much of the cortical fiber meshwork. This third activity did not co-localize with any NOS-like immunoreactivity (see Results), had a strong preference for β-NADPH relative to α-NAPDH, and was greatly attenuated by ≥ = 10-5 M dicoumarol. The strong preference for β- versus α-NADPH identified the enzyme as a dehydrogenase (Dixon 1979), and the dicoumarol sensitivity identified the enzyme as either DT diaphorase (E.C. 1.6.99.2) or NADPH dehydrogenase (quinone) (E.C. 1.6.99.6) or a very similar enzyme (see below). This finding was unexpected, and potentially conflicts with that of Bredt et al. (1990), who found a band of NOS-like activity similar to the diffuse blue band with both immunoreactivity and in situ hybridization in the insular cortex of rats. It is possible that an accumulation of low levels of NOS exists in Layers II and III of dysgranular and agranular cortex, below the threshold of detectability for our methods. However, the dicoumarol sensitivity of the staining in the diffuse blue band indicates that the source of the blue staining in the NADPH diaphorase reaction is not NOS.
Modification of NADPH Diaphorase Reaction for NOS
Matsumoto et al. (1993) demonstrated that in cell-free extracts a unique association between NADPH diaphorase activity and NOS depended on prolonged fixation with 4% formaldehyde, so as to presumably inactivate non-NOS diaphorases. In this work we show that non-NOS diaphorase activities persist in tissue sections despite prolonged fixation in 4% formaldehyde.
The fixation protocol for NADPH diaphorase used 4% formaldehyde for a minimum of 45 min during transcardial perfusion, followed by an additional 1-4 hr of postfixation in 4% formaldehyde. In accordance with the results of Matsumoto et al. (1993), this should have inactivated non-NOS diaphorases, but the inhibition of enzymatic activity by 10-5 M dicoumarol demonstrated the persistent activity of some other non-NOS diaphorase. Therefore, to use the NADPH diaphorase method to exclusively reveal the presence of NOS, it is necessary to run the reaction in the presence of inhibitors or to use stereoisomers of the co-factor.
In the present work dicoumarol permitted easy discrimination between the diaphorase activities due primarily to nNOS and those due primarily to other enzymes. For other tissues, which may contain other enzymes, either a cocktail of inhibitors for the most likely enzymes in that tissue should be added (e.g., a mixture of miconazole, dicoumarol, sodium azide and levamisole) or a series of control experiments with individual inhibitors must be carried out. Alternatively, the presence of NOS-containing cells could be confirmed with antibodies directed against NOS. This last method may produce false-negatives, however, if the antibody is ineffective in the particular tissue preparation. When there is NADPH diaphorase staining but no labeling by anti-NOS antibody (e.g., as with the diffuse blue band, in that no antibody binding in that region was detected) and to avoid false-negatives, it is necessary to test a number of inhibitors and/or stereoisomers of the co-factor to see if the staining is attenuated and therefore is due to something other than NOS. Ideally, a specific inhibitor of the diaphorase activity of NOS could be used to test for the specificity of the NOS diaphorase response, but no such inhibitor exists.
Dicoumarol-sensitive, NADPH-dependent Enzymes
The work reported here shows that a dicoumarol-sensitive dehydrogenase was likely responsible for the bulk of the staining of the Type II neurons, the diffuse blue band, and the meshwork of cortical fibers, as well as some of the staining seen in Type I neurons. There are three enzymes that are known to be inhibited by dicoumarol (Bairoch 1996): “DT-diaphorase” [NAD(P)H:quinone reductase; EC 1.6.99.2], NADPH dehydrogenase (quinone) (EC 1.6.99.6), and NADPH: quinone reductase (EC 1.6.5.5).
“DT diaphorase” was named for its ability to use both DPNH (reduced diphosphopyridine nucleotide, now called NADH) and TPNH (reduced triphosphopyridine nucleotide, now called NADPH) (Ernster et al. 1962). It is a widely distributed, FAD-containing enzyme that catalyzes nicotinamide nucleotide-dependent reductions of quinones, quinoeimine, azo dyes, and nitro groups (Li et al. 1995). DT diaphorase shows sensitivity to dicoumarol in the range of 10-8 10-10 M in cell-free extracts (Lind et al. 1990) but in the range of 10-5 M in tissue culture (Murphy et al. 1991). This difference in effective concentration is believed to reflect a number of factors, including the nonspecific adsorption of the dicoumarol by tissue proteins (Murphy et al. 1991). Note that 10-5 M is the same concentration that abolished the NADPH diaphorase staining of Type II neurons, the diffuse blue band, and the meshwork of cortical fibers, and also slightly diminished the staining of Type I neurons; 10-6 M had no effect.
Schultzberg et al. (1988), however, found no correlation in fixed rat brain slices between neuronal staining for NADPH diaphorase and neurons labeled with an antibody to DT diaphorase. They used an antibody raised against purified soluble DT diaphorase from rat liver and further concluded that a different brain isozyme did not appear likely because antibodies to soluble DT diaphorase from liver equally inhibited the enzymatic activity of soluble DT diaphorase isolated from rat cerebellum, striatum, and liver. In the rat, however, soluble DT diaphorase is responsible for 95% of diaphorase activity in the liver but for only 65-80% of diaphorase activity, depending on the region examined, in brain (Schultzberg et al. 1988). Therefore, it is possible that a membrane-bound or otherwise insoluble isozyme of DT diaphorase exists in brain and that this isozyme was missed by the antibody to soluble DT diaphorase. Such an isozyme(s) may be responsible for the observed dicoumarol-sensitive staining.
NADPH dehydrogenase (quinone) (EC 1.6.99.6) is a flavoprotein, but other than the original purification and characterization report by Koli et al. in 1969, nothing else is known about this enzyme. It is not as sensitive to dicoumarol as DT diaphorase. Inhibition in cell-free extracts occurs in the range 10-5 M (Koli et al. 1969). This is the same concentration range that was shown to effectively inhibit the neuronal Type II response in tissue sections. Given that to inhibit DT diaphorase present in tissue sections requires 1000 times the concentration of dicoumarol necessary for inhibition in a cell-free extract, 1.6.99.6 may not be the enzyme responsible for the neuronal Type II response. Alternatively, the fixed enzyme in hamster brain may show greater sensitivity to dicoumarol than the unfixed enzyme isolated from hog liver.
NADPH:quinone reductase (EC 1.6.5.5) has substrate specificity for certain quinones, and therefore is not likely to be responsible for the observed NADPH diaphorase activity.
Alternatively, the neuronal Type II response could be produced by a novel or incompletely characterized dehydrogenase with high sensitivity to dicoumarol, or by a group of electron transport enzymes, one of which has sensitivity to dicoumarol. The latter possibility appears unlikely, given the failure of sodium azide (which blocks the last step of the electron transport chain) to affect NADPH diaphorase staining. Given the uncertainty regarding the identity of the enzyme, it will be referred to here as “dicoumarol-sensitive NADPH dehydrogenase.” This enzyme was found along almost the entire length of the rhinal fissure (unpublished observations). If extensive spatial distribution is a criterion of functional importance, it is likely to be an important enzyme for the brain. More work is needed to determine the precise identity and role(s) of the dicoumarol-sensitive NADPH dehydrogenase.
Footnotes
Acknowledgements
Supported by a grant (5P50DC00168) and by a training grant (5T33DC00025) from the National Institutes of Deafness and Communication Disorders.
We thank Sandra Hill and Richard Weinberg for helpful suggestions on the techniques and Lawrence Savoy for excellent technical assistance. We thank Michael Barry, Thomas Hettinger, Michael Huerta, Konrad Talbot, and William Shoemaker for helpful comments on the manuscript.