
Abstract
We have studied the replication of virus in tissues and development of lesions associated with infectious salmon anemia virus (ISAV) infection in Atlantic salmon using in situ hybridization (ISH) with a riboprobe targeting ISAV RNA segment 7 messenger RNA. Fish were infected with three ISAV isolates (U55751, RPC-01-0593-1, Norway 810/9/99) and then euthanatized sequentially at 3, 6, 10, and 13 days postinoculation (dpi) and thereafter once a week for 8 weeks. Severe histopathologic lesions were observed in tissues from all groups beginning at the onset of mortality. The severe histopathologic lesions correlated with maximum intensity and frequency of ISH signals (P < 0.001). There was a strong association between the hybridization signals and severity of lesions in the liver, kidney, and heart (R = 0.81, 0.70, and 0.78, respectively; P < 0.001). The distribution of ISH signals indicated the presence of a viremia because signals were observed predominantly in individual blood cells and endothelial cells, and possibly hematopoietic cells of head kidney, but not in the necrotic hepatocytes and renal epithelium. Of the organs sampled, the heart was the first and last to show ISH signals, possibly because of increased activity of the endocardial endothelial cells and the underlining macrophages, which continuously trap and remove circulating virus, and therefore represents the best tissue sample for screening of suspected infected fish. On the basis of mortality, severity of lesions, and intensity and frequency of ISH signals, ISAV isolate Norway 810/9/99 was the most virulent and U5575-1 the least virulent isolate studied.
Keywords
Infectious salmon anemia (ISA) is a highly fatal disease of marine-farmed Atlantic salmon (Salmo salar L.) caused by ISA virus (ISAV), which belongs to the virus family Orthomyxoviridae 15, 19, 33, 43 in the genus Isavirus. 2 Clinical disease is characterized by exophthalmia, pale gills, ascites, congestion of gut, enlargement of liver and spleen, petechial hemorrhages in the visceral organs, severe anemia, and variable mortality. 16, 45 Histopathologic changes can include hepatic necrosis, vasculitis and sinusoidal congestion—peliosis, renal interstitial congestion, hemorrhage and tubular necrosis, congestion of branchial lamellar and filamental vessels, congestion and necrosis of the intestine and pyloric caeca, and increased erythrophagia in the spleen and kidney. 8, 16, 35, 45 The disease, now a major threat to Atlantic salmon farming worldwide, was first recognized in Norway in 1984, 45 Canada in 1996, 6, 30, 35 Scotland in 1998, 7, 41 Faeroes Island, Denmark, in 2000, 1 and USA in 2001. 5 The virus has also been recovered from tissues of diseased farmed Coho salmon (Onchorynchus kisutch) in Chile. 25 The diagnosis of ISA has been based on clinical signs, histopathology, 45 virus isolation using different fish cell lines, 6, 11, 12, 46 antigen detection using immunoflourescent antibody technique (IFAT) 17, 18 and enzyme-linked immunosorbent assay, 29 and detection of viral genetic material by reverse transcriptase-polymerase chain reaction (RT-PCR). 4, 28, 33 Recently, in situ hybridization (ISH) has been used to detect the virus in the endothelial cells and leucocytes of Atlantic salmon dying from ISA. 22, 34 Differences have been reported in the pathology associated with different isolates of ISAV, 8, 24, 25, 35 but efforts to reproduce some or all the lesions associated with the virus have proved difficult. 24 Previous studies on the pathogenesis of ISA showed that histopathologic lesions appeared at about 12–18 days postinoculation (dpi) in experimentally infected fish, coinciding with onset of mortality. 10, 44 These studies, however, did not relate the presence of the virus in these organs with either the lesions or mortality in infected fish. ISAV genetic material is increasingly being detected by RT-PCR in wild Atlantic salmon that do not show signs of the disease, and in apparently healthy fish on some farms with clinical ISA disease, whereas the virus from such samples cannot be isolated in cell culture, 32 indicating that the pathogenesis of this virus is not fully understood. Moreover, no sequential studies have been performed on the relationship, if any, between the virus replication in tissues and the type and severity of lesions present. In this study, we determined the tissue distribution of ISAV RNA segment 7 messenger RNA (mRNA) (as an indication of virus replication) of three ISAV isolates belonging to the North American and European hemagglutinin-esterase genotypes in experimentally infected fish and correlated the pattern to the lesions observed. We also identified the site with the most in situ virus replication and therefore the best tissue to sample during virus screening of suspected infected fish.
Materials and Methods
Virus strains and cell cultures
Three ISAV isolates, U5575-1, RPC-01-0593-1, and Norway 810/9/99, were used to experimentally infect fish. Viruses U5575-1 and RPC-01-0593-1 were originally isolated from disease outbreaks in Nova Scotia and New Brunswick, Canada, respectively, whereas Norway 810/9/99 was from Norway.
26
The viruses were grown in TO cell line as described previously.
26
In brief, the cells were grown at room temperature (22° C) in Eagle's minimum essential medium (BioWhittaker Inc., Walkersville, MD, USA) containing Hanks' salt and sodium bicarbonate (2.2 g/liter), supplemented with 292 mM
Preparation of riboprobe complementary DNA
Total mRNA was extracted from 300 μl of ISAV-infected cell culture lysate with 700 μl Trizol Reagent (Invitrogen Life Technologies, Carlsbad, CA, USA), according to the manufacturer's protocol. The PCR primers consisted of segment 7 forward primer 5′-ATG TCT GGA TTT AAC TCG AGG-3′ (nucleotides 1–22) and segment 7 reverse primer 5′-CAT AAC AAG TTTTCA ACC AAT C-3′ (nucleotides 770–791). One-step RT-PCR was carried out as described previously, 27 using Titan-one tube RT-PCR kit (Roche Molecular Biochemicals, Penzburg, Germany). The RT-PCR product was purified from low-melting agarose gel using standard procedures, 42 and was subcloned in the pCR®II-TOPO® Vector (Invitrogen Life Technologies) following the manufacturer's protocols. The recombinant plasmids were transformed in Escherichia coli TOP10F competent cells, and transformants were screened by EcoR1 digestion to observe the size of insert DNA. To produce a template for preparation of the riboprobe, the DNA insert was subcloned into pGEM-3Z vector (Promega Corporation, Madison, WI, USA) using the Rapid DNA Ligation Kit (Roche Molecular Biochemicals), according to the manufacturer's protocols as described previously. 34
Riboprobe synthesis
The pGEM-3Z recombinant plasmids in both correct and reverse orientation, with regard to the SP6 promoter, were isolated from E. coli using the standard alkaline lysis method. 3 The orientation of the DNA inserts in the plasmid was determined by restriction enzyme analysis so that the anti-sense riboprobe to segment 7, approximately 405 bases long, could be generated off the T7 promoter. 34 To generate the template needed for preparation of the riboprobe, the plasmid DNA was digested with XbaI. The digested DNA was purified by phenol/chloroform extraction and ethanol precipitation in high salt. The in vitro transcription reactions were carried out in the presence of digoxigenin-11-deoxyuridine triphosphate (Digoxgenin-11-UTP, Roche Molecular Biochemicals) using a Riboprobe Combination System-SP6/T7 kit (Promega), following the manufacturer's protocol. In brief, the RNA synthesis reaction components, T7 polymerase, and nucleotide triphosphates were added to the linearized DNA templates with ribonuclease (RNAse) inhibitor (Roche Molecular Biochemicals) and incubated at 37° C for 2 hours. RNAse-free RQ1 deoxyribonuclease (Promega) was used to remove the DNA template. The digoxigenin-labeled RNA transcripts were purified by ethanol precipitation in high salt and were stored at −70° C until use. The specificity and sensitivity of the transcripts were determined by northern blot hybridization as described previously. 34
Experimental infection of fish with ISAV and tissue sampling
A total of 235 Atlantic salmon certified as specific pathogen-free were obtained from the Atlantic Sea Smolts, Souris, PEI, Canada. The mean weight and length of fish at the start of the experiment were approximately 15–20 g and 10 cm, respectively. Three fish from the population were screened for ISAV by virus isolation attempts on the TO cell line and by RT-PCR to establish the ISAV-negative status of the stock before virus challenge. The fish were maintained in the Aquatic Animal Facility of the Atlantic Veterinary College in 1-m-diameter fiberglass-reinforced plastic tanks using a fresh water flow through system at a temperature of approximately 11° C. The fish were acclimatized for 2 weeks before use. The experimental procedures were performed in accordance with the guidelines of the Canadian Council of Animal Care. 37 The fish were removed from stock holding tanks and anesthetized by immersion in an aerated solution of tricaine methane sulfonate (TMS-222) (100 mg/liter), and 70 fish (total 210) were serially assigned to each of the three experimental groups in tanks 1, 2, and 3. Each fish was challenged by an intraperitoneal injection of ISAV, isolate U5575-1 for fish in tank No. 1, RPC-01-0593-1 in tank No. 2, and Norway 810/9/99 in tank No. 3, at a virus dose of 106 TCID50/0.2 ml/fish and returned to their individual tanks. Twenty uninfected fish were kept in the control tank and used as negative control. All fish were observed twice daily, and mortalities were recorded and removed. Three fish per tank from the infected group were sampled at 3, 6, 10, and 13 dpi and thereafter every week until 8 weeks after inoculation, whereas three fish from the uninfected control tank were sampled at days 3, 13, and 27 and after 8 weeks post-infection. Duplicate samples of the heart, liver, and kidney (head and trunk together) were collected aseptically, and efforts were made to sample the same area of the tissue in every fish. One set of tissues was fixed in 10% buffered formalin for 24 hours and then processed in an automatic tissue processor and embedded in paraffin wax. The other set of tissues was pooled in a sterile bag and stored at −80° C until use for viral analysis by RT-PCR.
Histology and ISH
Serial 5-μm-thick paraffin sections of formalin-fixed tissues were stained with hematoxylin and eosin for light microscopy or were generated for ISH (or both). The following grading, which is a modification of that used by Jones and Groman, 23 was adopted for assessment of the histopathologic lesions in the different tissues: for the liver, 1 = mild to moderate, local or diffuse sinusoidal congestion often distributed randomly, vasculitis or perivascular cuffing (or both) characterized by infiltration of mixed leucocytes population in the large and small blood vessel walls; 2 = above, plus marked hemorrhages, hepatocellular degeneration or necrosis (or both). For the kidney, 1 = mild to moderate sinusoidal congestion, interstitial hemorrhages, intravascular hemolysis and increased erythrophagia (or both); 2 = above, plus diffuse interstitial hemorrhages, and necrosis of the interstitial cells and tubular necrosis. In the heart, 1 = mild to moderate, swelling and hyperplasia of the endothelial cells, and increased activated/marginating macrophages; 2 = hydropic degeneration of myocytes. In all tissues, a score of zero meant that no microscopic changes were detected. The maximum lesion score per fish sampling time was 18 and was based on three fish, three organs (liver, kidney, and heart), and maximum lesion grade of 2. For ISH assays, the paraffin tissue sections were mounted on glass slides pretreated with (3-aminopropyl) triethoxysilane (Sigma-Aldrich) and were deparaffinized in xylene and rehydrated in decreasing concentrations of ethanol to a final wash in diethyl pyrocarbonate–treated water. The tissues were permeabilized and then hybridized with ISAV-specific, digoxigenin-labeled segment 7 probes, as described previously, 34 using approximately 25 ng of segment 7 riboprobe in hybridization buffer per section. Hybridization signals were observed using light microscopy and images captured digitally. Digital images were analyzed using Adobe Photoshop 5.5 (Adobe Systems Inc., San Jose, CA, USA). The frequency of the hybridization signals was graded subjectively at 16× objective using a minimum of 10 fields as follows; 0, no signals, 1+, for presence of signals in less than four fields, 2+, for presence of signals in four to seven fields, 3+, for presence of signals in 8–10 fields, indicating that almost all the endothelial cells and some individual blood cells showed strong signals. The maximum hybridization signal score was 27 per fish sampling time.
Statistical analysis
The strength of the association between scores for lesions and ISH signals in tissues from infected fish was assessed by nonparametric Spearman correlation coefficient. A non-parametric Kruskall-Wallis test was used to test the differences in scores for ISH signals and lesions between groups infected with different ISAV isolates on a daily basis; P values were adjusted for multiple day testing by Bonferroni method (dividing the significance level by the number of tests carried out). The mortality in the groups was estimated by Kaplan-Meier survival curves 14 and compared between the groups by a nonparametric log-rank test.
Results
Riboprobe synthesis and specificity
The RT-PCR using ISAV and segment 7 primers yielded a 791-bp product. The product was cloned using TOPO-TA cloning kit (Invitrogen Life Technologies), and the insert DNA was subcloned into the pGEM-3Z vector (Promega). The segment 7 antisense riboprobe of 405 bases was prepared by in vitro transcription from the DNA construct linearized with XbaI and was verified by electrophoresis on a 2% agarose RNA gel (Fig. 1). The integrity, polarity, and specificity of the riboprobe were checked as described previously. 34
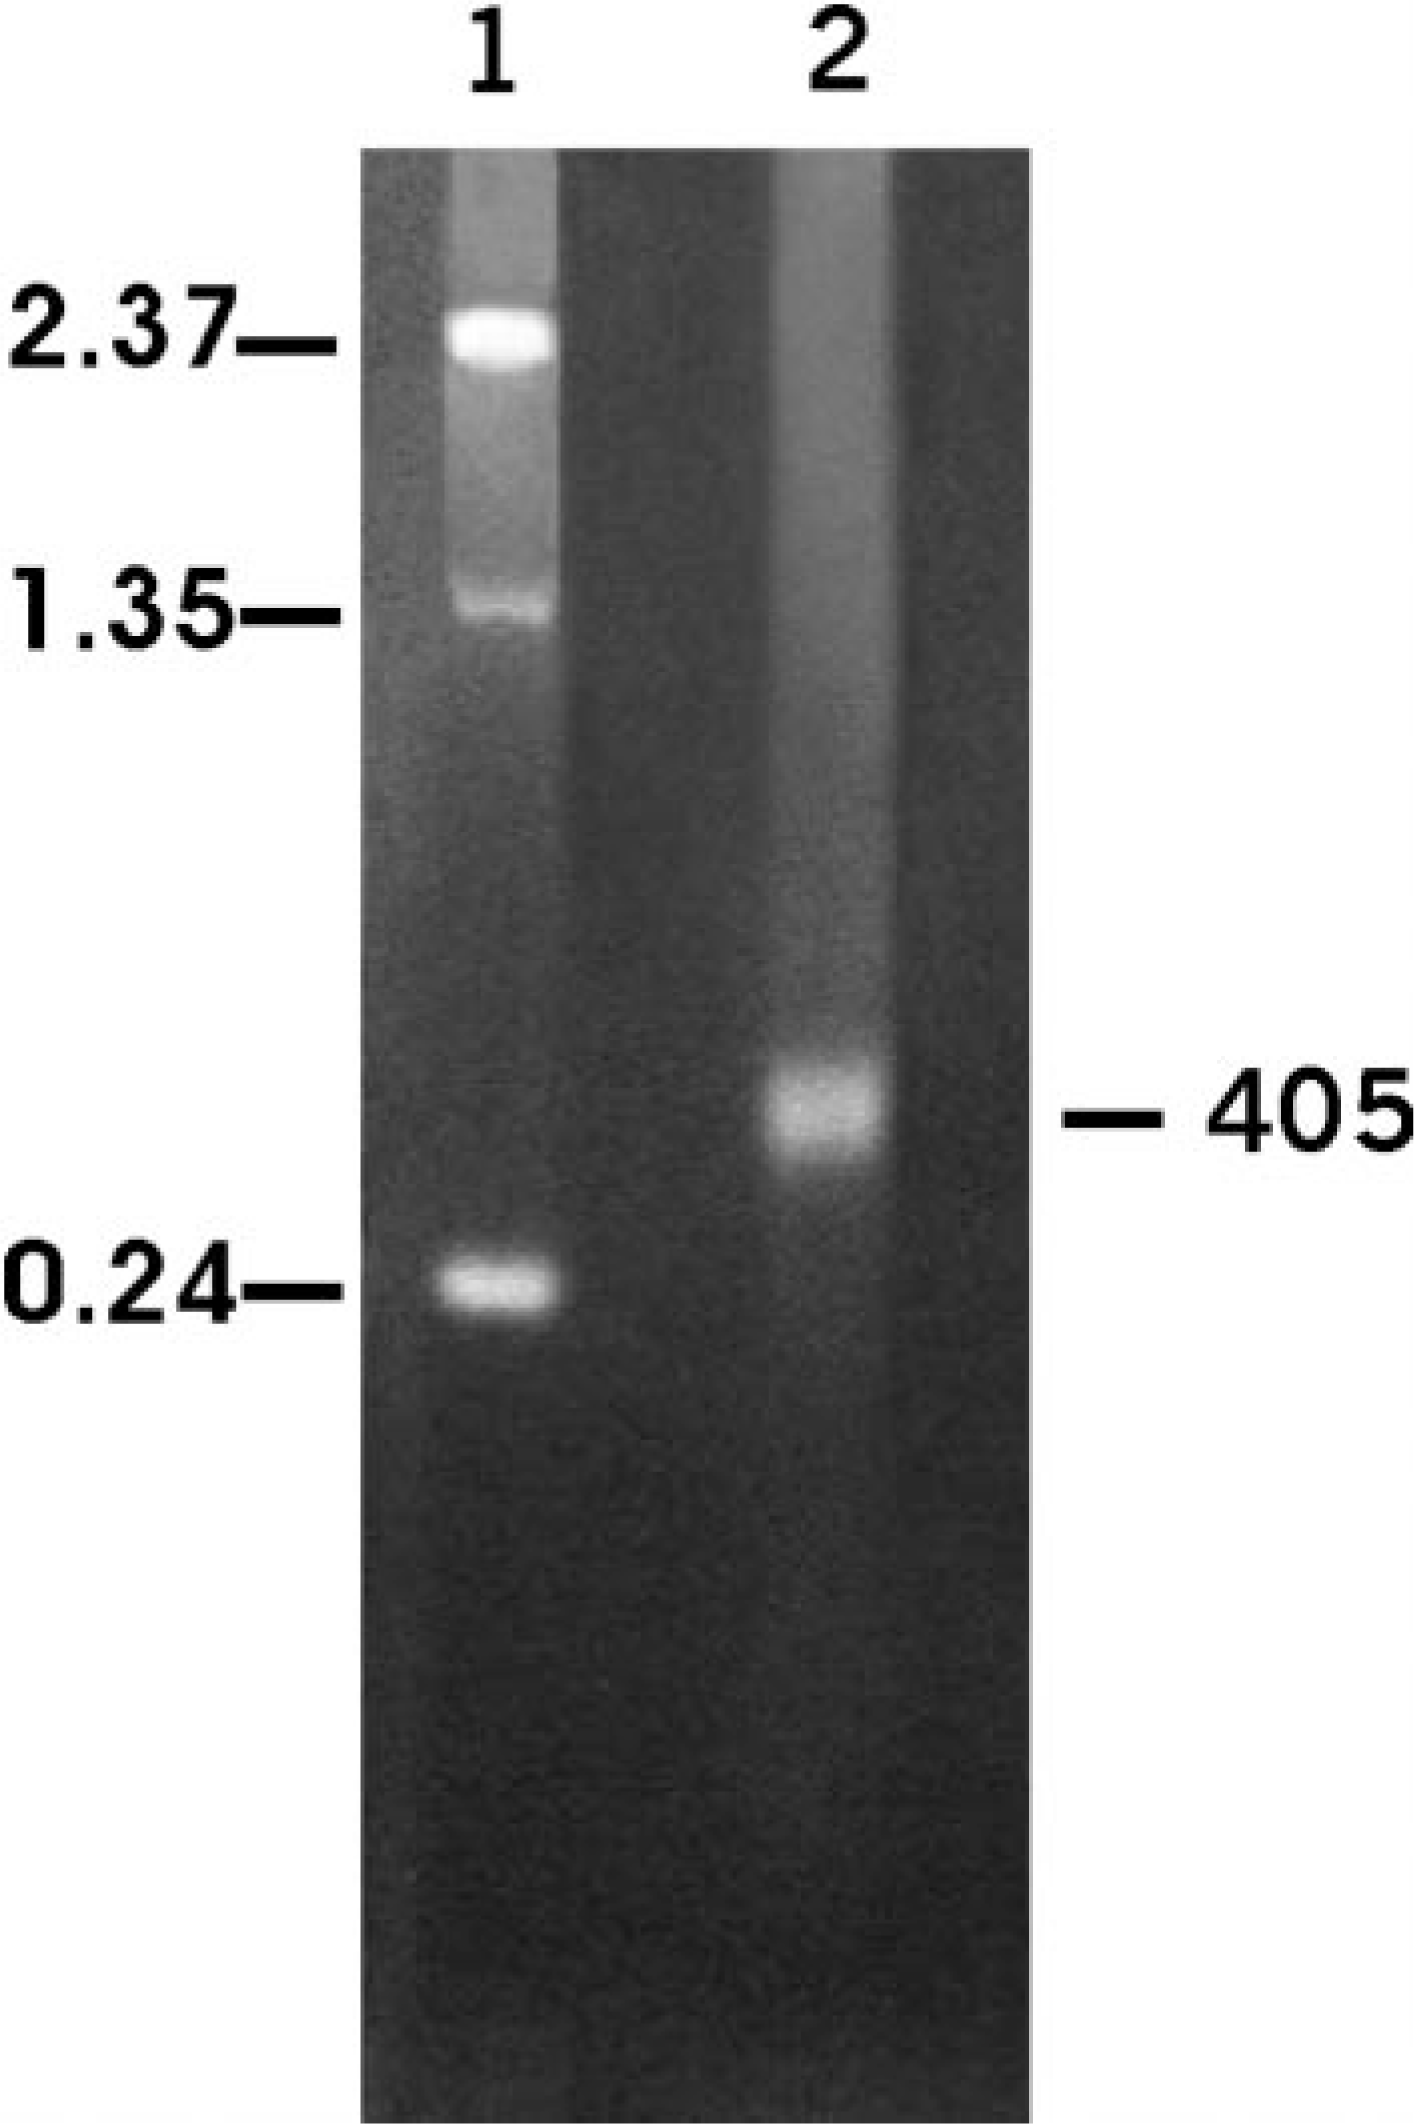
In vitro transcription of segment 7 antisense riboprobe using pGEM-3z vector and labeled with digoxigenin. Lane 1, RNA ladder; lane 2, 405 bases segment 7 digoxigeninlabeled antisense riboprobe.
Relationship between the development of lesions and mortality
The mortality patterns from the three infected groups are summarized in Table 1. The percent mortality could have been higher or lower than indicated because three fish were sequentially removed from each tank per sampling time. The first mortality occurred at 10 dpi and the last at 28 dpi in the group infected with the Norway 810/9/99 isolate, resulting in a total mortality of 53 (75%) fish. For the RPC-01-0593-1–infected group, the mortality started at 13 dpi and lasted until 28 dpi, producing a total mortality of 46 (66%) fish. In the U5575-1 group, mortality started at 17 dpi and continued to 38 dpi, with a total mortality of 38 (54%) fish. As expected, the onset of mortalities in all the isolates coincided with the presence of severe gross pathology. Some or all the typical ISA gross pathology lesions 16 including exophthalmia, petechia hemorrhages in the visceral fats, pale gills, congested liver and spleen, hemorrhages in the pyloric caeca, and hemorrhagic ascites were observed in fish infected with Norway 810/9/99 and RPC-01-0593-1 isolates beginning from 10 dpi and in all mortalities (Fig. 2). In contrast, in the U5575-1–infected group, only exophthalmia and straw-colored ascites were observed in fish sampled at 20 dpi and most mortalities of this group (Fig. 3). By 27 dpi, there were two fish remaining in the group infected with Norway 810/9/99, and these were sampled out. For the RPC-01-0593-1 group, sampling continued until 41 dpi when the last two fish were sampled. Sampling continued in the U5575-1–infected group to the last sampling time of 8 weeks after inoculation. Neither mortality nor pathology was observed in the control group during the experiment. Grading of the histopathologic findings in the kidney, liver, and heart of fish sampled at different times after infection for the three groups are summarized in Table 2. For the U5575-1 group, mild changes were first noted in the kidney at 3 dpi in one fish and in one or two organs from the three sampled fish by 6 dpi onward. By 20 dpi, all three organs from each fish per sampling time showed moderate to severe lesions, coinciding with the period of peak mortality. Mortality and lesions observed in sampled fish were few or absent after 27 dpi. In the RPC-01-0593-1–infected group, mild histopathologic changes were seen in the heart and kidney of one fish at 3 dpi, and from 6 dpi, either mild or severe lesions (or both) were seen in one or more organs of the three fish sampled. However, by 13 dpi, all three organs in the fish sampled showed severe lesions, again coinciding with the start of mortality. The mortality increased and peaked a few days later, and by 20 dpi the severity of lesions in tissues started to decrease as did the mortality. In the Norway 810/9/99–infected group, one organ in all the sampled fish showed mild histopathologic lesions from 3 dpi. Beginning at 10 dpi when mortality started, all three organs from all the three fish showed severe lesions. By 20 dpi, severe lesions were still present in two or three organs of each fish at which point the mortality started to decrease. Lesions were few or absent in tissues/organs by 27 dpi in fish infected with either RPC-01-0593-01 or Norway 810/9/99. Lesions interpreted as hepatic regeneration were observed in some fish from 27 dpi in all infected groups.
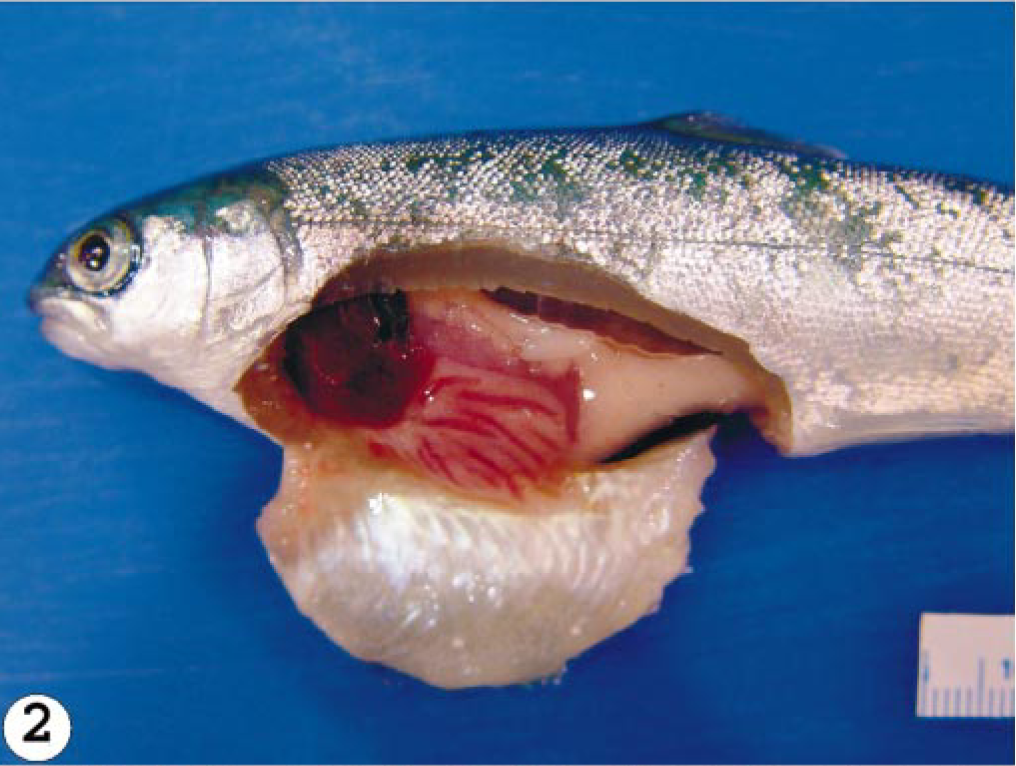
Abdominal cavity; Atlantic salmon showing dark, congested liver, congestion and hemorrhages in the abdominal cavity, hemorrhagic ascites, experimentally infected with RPC-01-0593-1 isolate of ISAV euthanatized at 13 dpi.
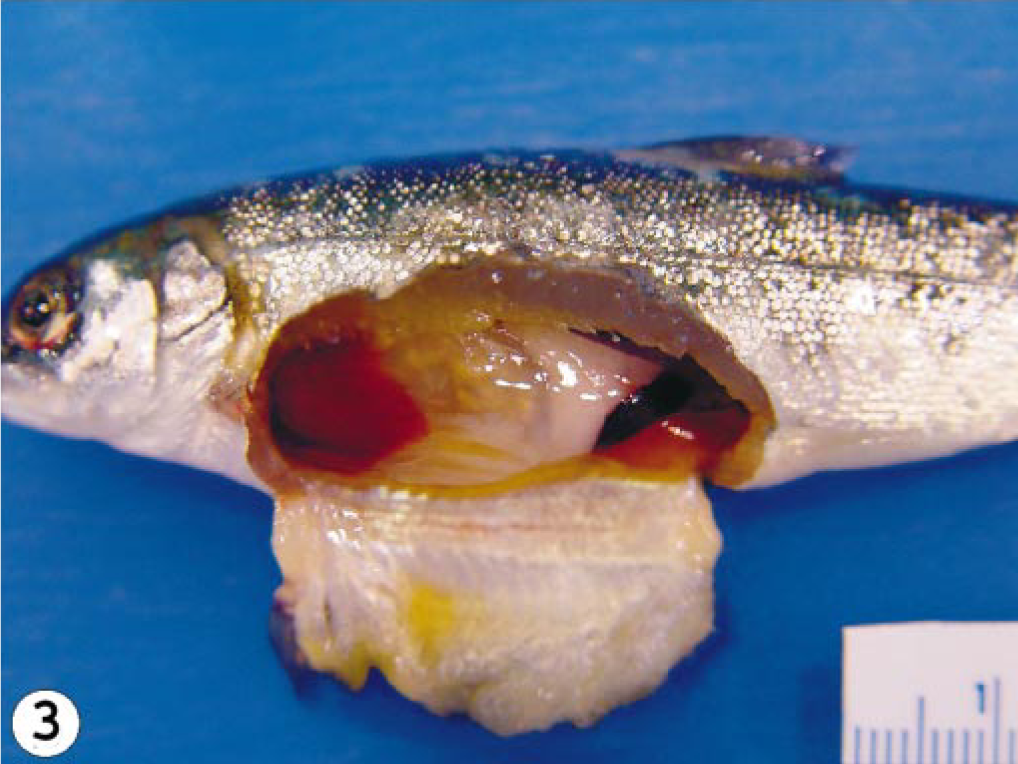
Abdominal cavity; Atlantic salmon showing exopthalmia, straw colored ascites, and absence of hemorrhages in the abdominal cavity, experimentally infected with U5575-1 isolate of ISAV euthanatized at 20 dpi.
Mortality records of fish infected with different isolates of infectious salmon anemia virus (live fish sequentially removed for sampling not included in mortality).
Total lesions score of infectious salmon anemia virus (ISAV)-infected fish at different days postinfection.∗
∗ Based on three fish, three organs (heart, liver, kidney) per fish and maximum lesion grade of 2 (mild = 1, severe = 2), and a maximum score of 18.
† Indicates days with statistically significant difference between infected groups (P < 0.05).
‡ Indicates days with statistically significant difference between infected groups after adjustments for multiple day testing (P < 0.05, P < 0.08).
§ Denotes not done (ND) because surviving fish were sampled out.
Relationship between in situ detection of ISAV mRNA and histopathologic lesions in tissues from fish infected with different virus isolates
The ISAV segment 7 antisense riboprobe was used for this study because preliminary investigations showed it to give more intense signals when compared with the segment 8 antisense riboprobe, 34 even when the frequencies of ISH signals were the same. The ISH signals recorded were purple-bluish in color and indicated the presence of viral mRNA and the intensity of the signals assessed qualitatively, providing a good indication of the amount of virus mRNA. The frequency of ISH signals indicates the number of cells expressing ISAV RNA segment 7 mRNA in the infected tissue or organ. The frequencies of signals are summarized in Table 3. Hybridization signals were seen in endothelial and blood cells in the three organs sampled. Signals were also observed in macrophage-like cells underlining the endocardial endothelial cells (Fig. 4). Some unidentified cells, possibly hematopoietic cells, in head kidney also contained hybridization signals (Fig. 5). For the U5575-1 group, ISH signals were first seen in the organs of sampled fish at 10 dpi (Fig. 6) but were of weak intensity and low frequency. At 20 dpi, the ISH signals were of stronger intensity and were more frequent and also appeared in some blood cells in blood vessels, indicating the peak viremia period. By 27 dpi, hybridization was seen mostly in the heart, and after that ISH signals were not seen in any tissue. Hybridization was seen at 3 dpi in the heart of fish infected with the Norway 810/9/99 isolate. By 6 dpi, all three organs showed an increased frequency of and more intense ISH signals, which increased by 10 dpi (Fig. 7) until 20 dpi, after which the signal started to decline in all the tissues. By 27 dpi, less frequency and low-intensity signals were only observed in the heart. The RPC-01-0593-1–infected group showed the same intensity and frequency of ISH signals as the Norway 810/9/99–infected group, except that the first signals were observed later in the heart at 6 dpi. By 34 dpi, no hybridization was observed in any of the organs. In the Norway 810/9/99–and RPC-01-0593–1 infected groups, intense ISH was seen in most blood cells in blood vessels (Fig. 8) of all the organs sampled during the peak viremia period of 10–20 dpi. As the infection progressed, higher frequency and stronger ISH signals were seen with more severe histopathologic lesions (Fig. 9) in all the organs sampled. In areas of maximum intensity and frequency of signals, virtually all the endothelial cells were positive (Fig. 10), except where the intima (or lining) was depleted of endothelial cells (Fig. 11). Degeneration and necrosis of hepatocytes and renal tubular epithelium were observed in all the mortalities sampled. However, no viral mRNA was detected within these cells, unlike the endothelial or blood cells. Hybridization was not observed in any of the uninfected control fish.
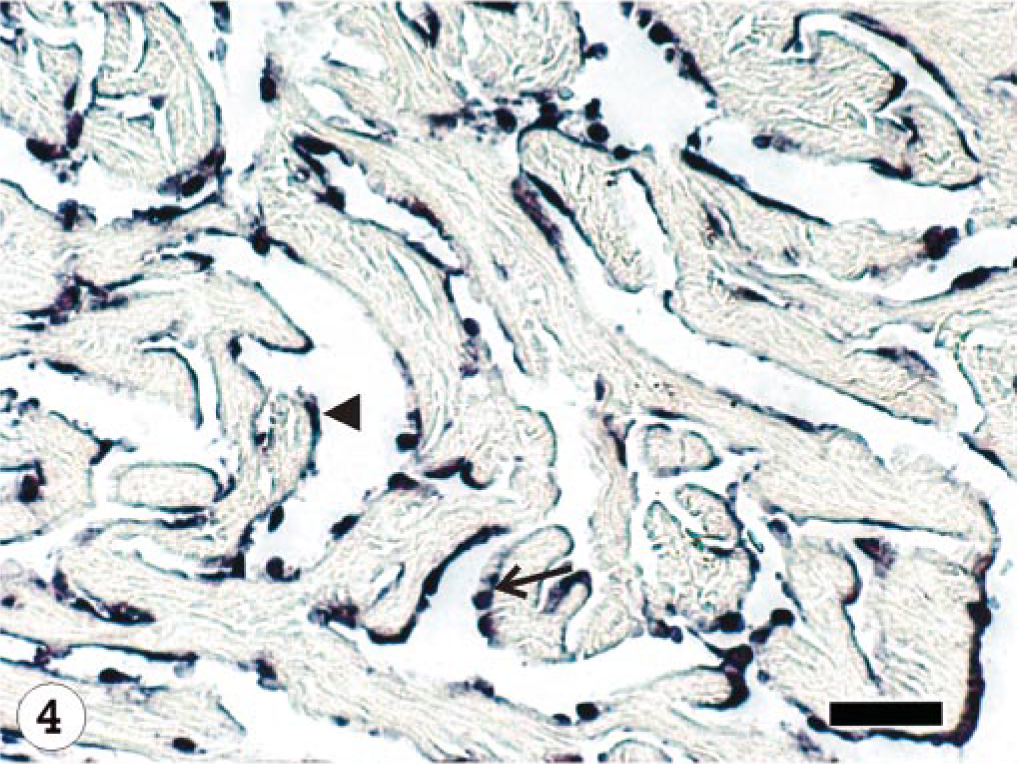
Heart; Atlantic salmon, 13 dpi with ISAV isolate Norway 810/9/99; ISH with segment 7 riboprobe. Hybridization signals present in the endocardial endothelial cells (arrow head) and macrophage-like cells (arrow). Bar = 40 μm.
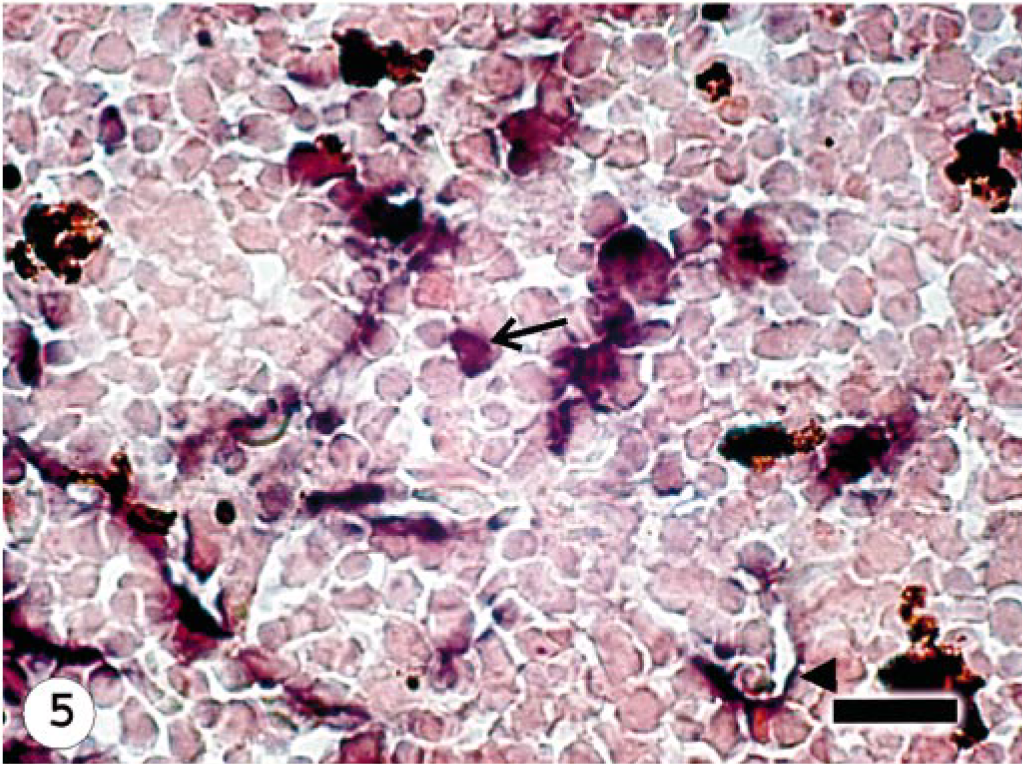
Head Kidney; Atlantic salmon, 13 dpi with ISAV isolate Norway 810/9/99; ISH with ISAV segment 7 riboprobe. Hybridization signals present in the endothelial cells (arrow head) and hematopoietic cells (arrow). Bar = 20 μm.
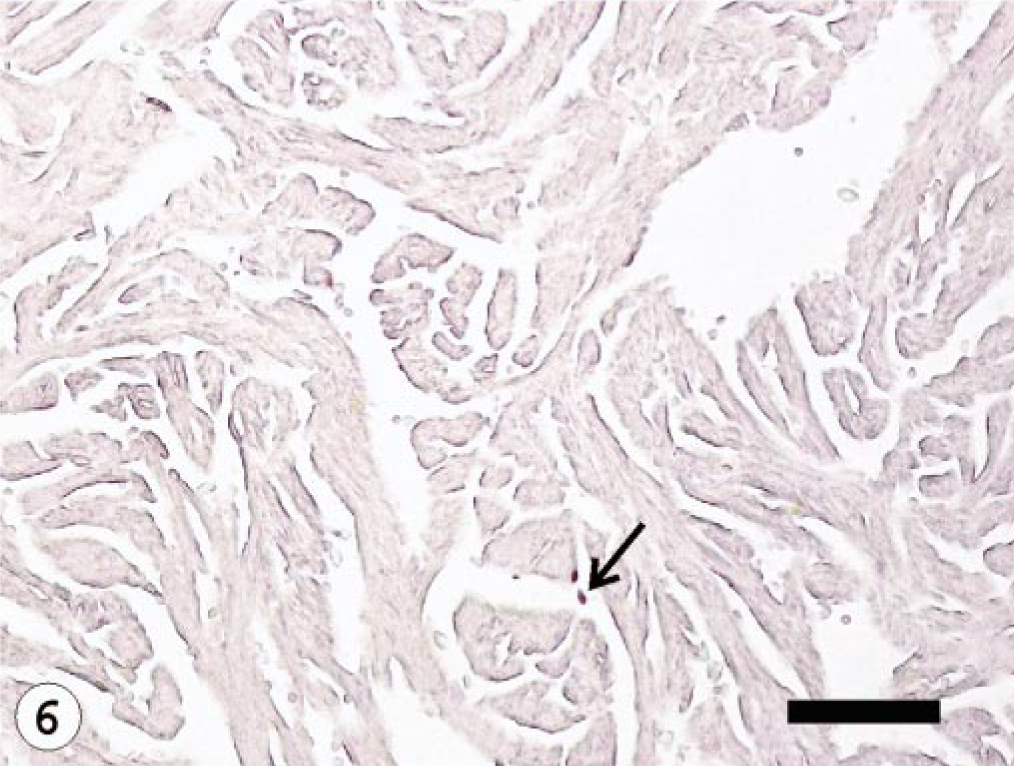
Heart; Atlantic salmon, 10 dpi with ISAV isolate U5575-1; ISH with ISAV segment 7 riboprobe. Few hybridization signals (arrow) observed in the endothelial cells. Bar = 100 μm.
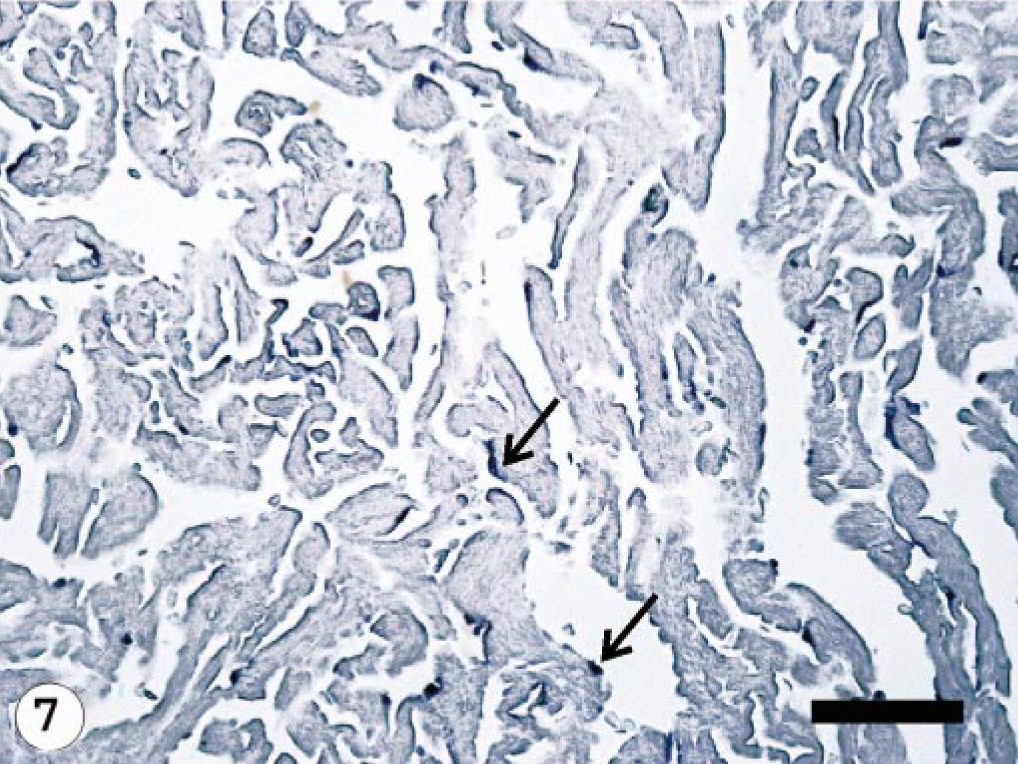
Heart; Atlantic salmon, 10 dpi with ISAV isolate RPC-01-0593-1; ISH with segment 7 riboprobe. Hybridization signals are intense and diffuse (higher frequency) (arrows) in the endothelial cells. Bar = 100 μm.
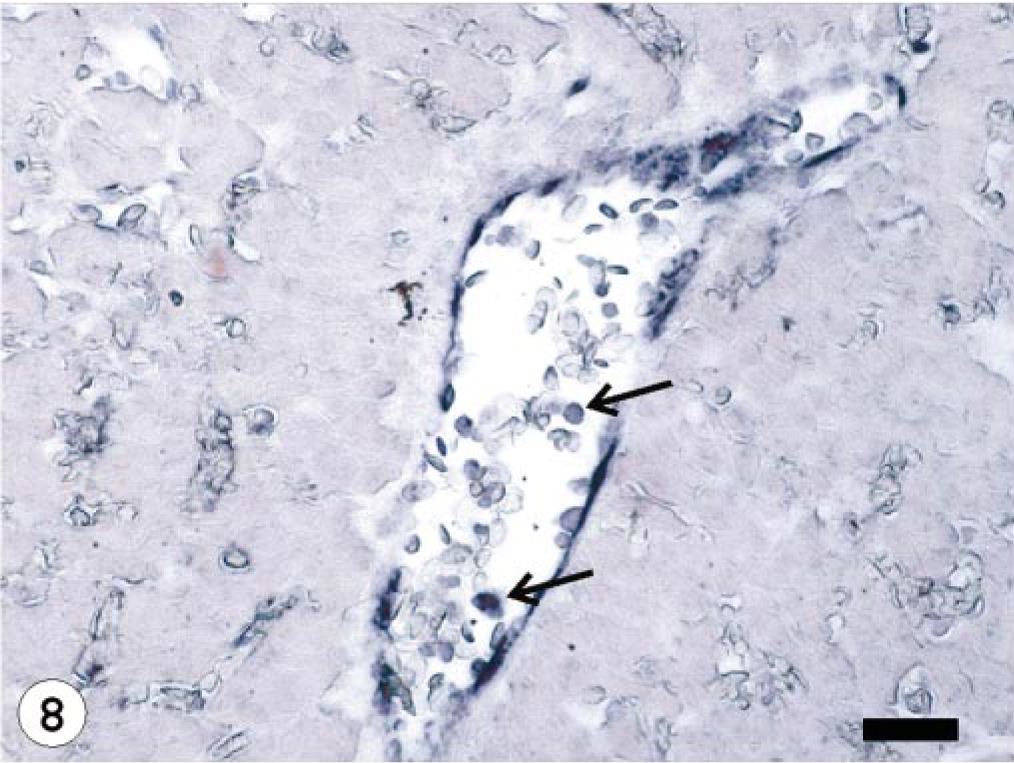
Liver; Atlantic salmon, 13 dpi with ISAV isolate Norway 810/9/99; ISH with ISAV segment 7 riboprobe. Presence of hybridization signals in the endothelial and blood cells (arrows) in blood vessel. Bar = 40 μm.
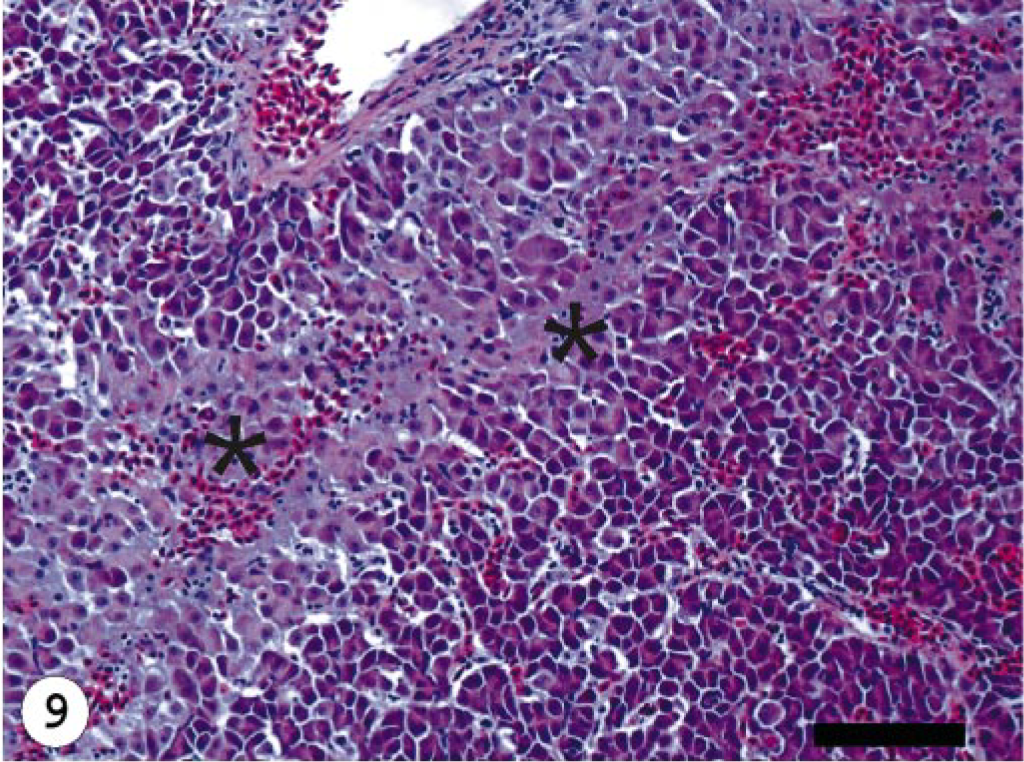
Liver; Atlantic salmon, 13 dpi with isolate Norway 810/9/99; HE stain. Congestion and necrosis (∗) of hepatocytes. Bar = 100 μm.
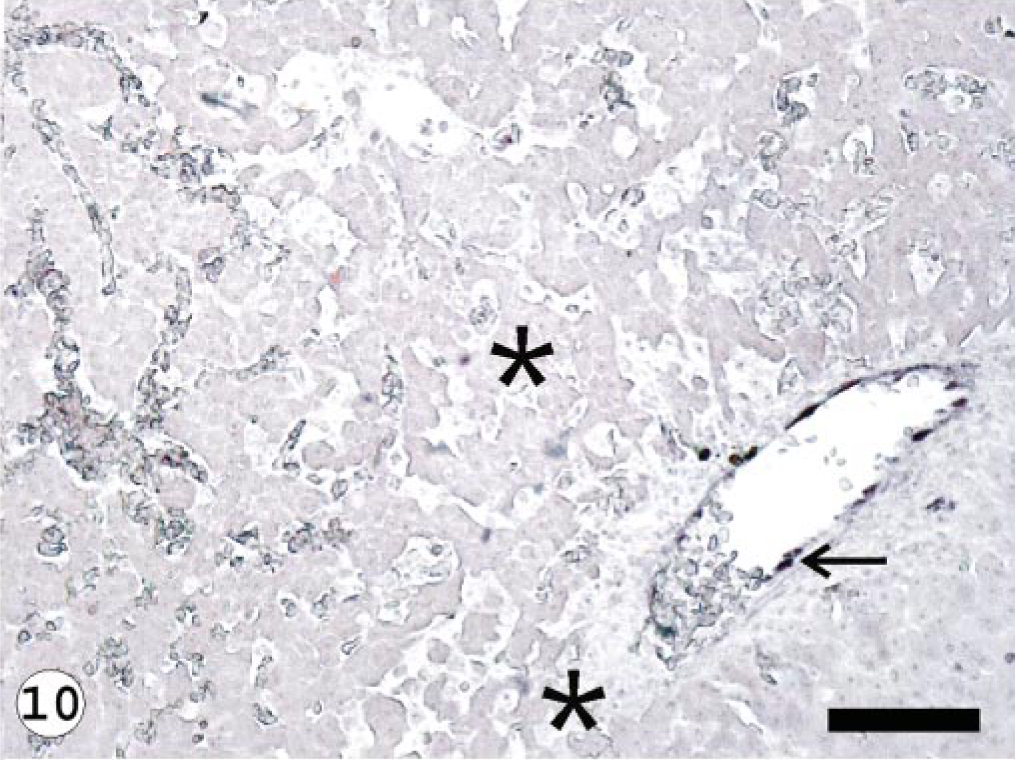
Liver; Atlantic salmon, 13 dpi with isolate Norway 810/9/99; ISH with ISAV segment 7 riboprobe. Presence of hybridization signals in the endothelial lining of major blood vessel (arrows) and not in the necrotic area (∗). Bar = 100 μm.
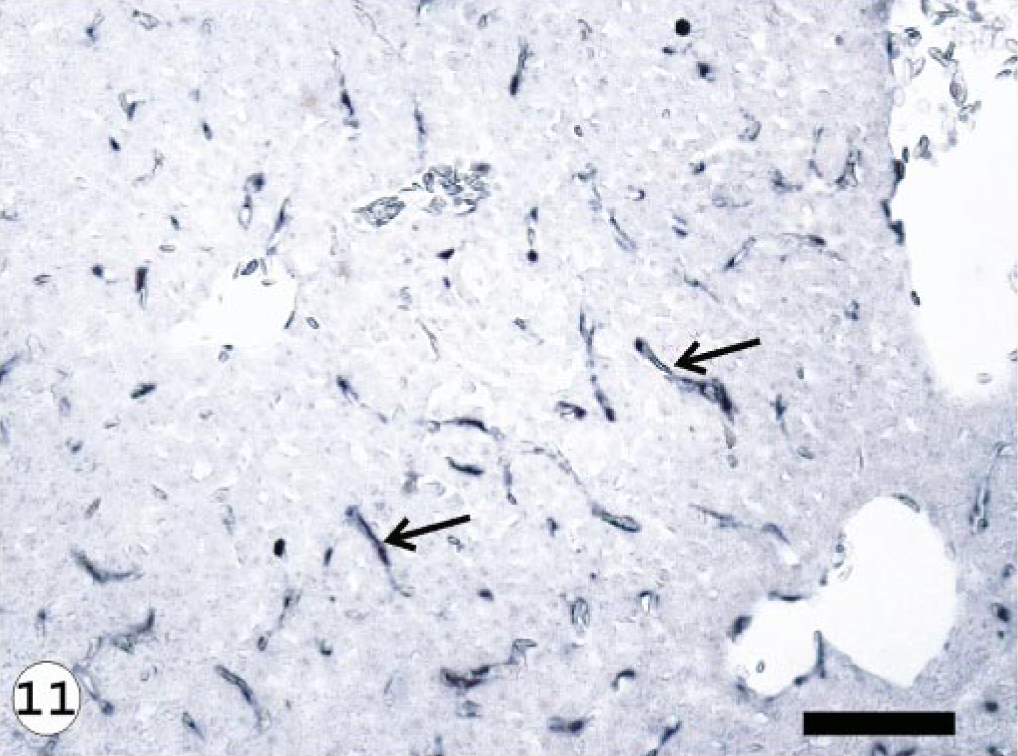
Liver; Atlantic salmon, 13 dpi with isolate RPC-01-0593-1; ISH with ISAV segment 7 riboprobe. Presence of hybridization signals in most sinusoidal endothelial lining and major blood vessels (arrow) at peak viremia.
Score of hybridization signals in fish organs (liver, kidney, and heart) infected with different infectious salmon anemia virus (ISAV) isolates at different days postinfection.∗
∗ Hybridization signals were graded at 16 × objective using a minimum of 10 fields as follows: 0, no signals; 1 +, presence of signals in <4 fields; 2+, presence of signals in 4–7 fields; 3+, presence of signals in 8–10 fields. The maximum ISH score = 27.
† Indicates days with statistically significant difference between infected groups (P < 0.05).
‡ Same as in Table 2 but P < 0.05, P < 0.06.
§ Denotes not done (ND) because surviving fish were sampled out.
In situ detection of ISAV mRNA as an indicator of viral replication and relationship between viremia and histopathologic lesions in infected fish
The relationship between the frequency of ISH signals and histopathologic lesions observed as the infection progressed in fish infected with the different ISAV isolates is summarized in Fig. 12. In the early stages of virus infection, few tissues had lesions, which correlated with the low frequency and weak intensity of ISH signals observed. As the infection progressed, higher frequency and stronger ISH signals were seen with more severe histopathologic lesions (Fig. 9) in all the organs sampled. There was a statistically significant relationship between the severity of lesions observed and the level of virus mRNA, as depicted by the ISH signals in the three isolates used (R = 0.69, 0.72, 0.78, P < 0.001). This is corroborated by data in the Norway 810/9/99– and RPC-01-0593–01 infected groups that showed the strongest intensity and highest frequency of ISH signals to correlate with the severest lesions in all tissues by 10 and 13 dpi (Tables 2, 3). The U5575-1–infected group also showed the strongest intensity and highest frequency of ISH signals by 20 dpi when the severest lesions were present in all tissues (P < 0.001). There were strong associations between the intensity or frequency of hybridization signals (or both) and the lesions observed in the liver, kidney, and heart (R = 0.81, 0.70, and 0.78, respectively; P < 0.001) from infected fish sampled. Mortality started at the peak lesions, when ISH signals were strongest and most frequent in all fish tissues infected by the different isolates. During this period, ISH signals were observed in blood cells in the blood vessels, indicating a strong correlation between peak viremia, severity of lesion, and onset of mortality. As the ISH signals decreased so also did the severity of lesions and the mortality. By 34 dpi when mortality stopped in infected groups, ISH signals and lesions were absent in most, if not all, tissues of infected fish.
The total lesion and ISH scores of fish infected with: (
Comparison of total mortality, histopathologic lesions, and ISH signals among different ISAV isolates
When the intensity and frequency of ISH signals and the lesions observed among the three ISAV isolates used were compared on a daily basis, isolate Norway 810/9/99 and RPC-01-0593-1 showed stronger and most frequent ISH signals compared with U5575-1 (uncorrected for 6, 10, and 13 dpi, P ≤ 0.001). There was no significant difference in the daily intensity and frequency signals and lesions between the Norway 810/9/99 and RPC-01-0593-1 isolates, although the Norway 810/9/99 showed more signals and lesions (Fig. 12). We could also observe a significant difference in the mortality and survival rates of fish groups infected with the different isolates, with the U5575-1 showing clearly the highest survival and lowest mortality rate, whereas the Norway 810/9/99–infected group has the lowest survival rate and highest mortality (P < 0.001) (Fig. 13). There was a slightly significant difference in the mortality and survival rates of the Norway 810/9/99– and RPC-01-0593-1–infected groups, with Norway 810/9/99–infected groups showing more mortality and less survival rates (P = 0.029). These findings suggest that ISAV isolate Norway 810/9/99 was the most pathogenic and U5575-1 the least pathogenic of the three isolates studied.
Analysis of the time to death (survival) of fish infected with the different isolates of ISAV. The U5575-1–infected group (solid line) has more probability of survival and therefore least time to mortality, followed by the RPC 01-0593-1–infected group (dashed line) and the Norway 810/9/99–infected group (dotted line) showing the least survival time and highest time to mortality amongst the whole groups (Kaplan-Meier survival analysis and log-rank test).
Discussion
The development of an ISH protocol for the detection of ISAV in fish tissues 22, 34 has provided a major tool to further study the pathogenesis of ISA. Other laboratory techniques such as RT-PCR and IFAT have been used to study the pathogenesis of this virus. However, these methods have shown limitations even when an association could be established between the virus and the disease, and no direct relationship has ever been established with the histopathologic lesions observed. The ISH technique is unique because it allows for the detection of the viral gene expression directly within infected tissues, making it possible for the observed lesions to be compared directly with the presence of the viral mRNA in situ.
The onset, duration, and total mortality recorded for the different ISAV isolates used in this study varied, with the first mortality recorded on day 10 dpi in the Norway 810/9/99–infected group and 17 dpi in the U5575-1–infected group. Some studies have shown that there is a relationship between the onset of mortality and the dose of ISAV inoculum used to infect the fish, in that fish that received a higher viral dose started dying earlier than those given lower doses of the same virus. 38 In this study, an equal virus dose was used to infect the fish with three different isolates, allowing us to speculate that differences in the mortality patterns can also be a result of differences in the virulence of the different isolates used.
The histopathologic findings observed at the initial stages of the infection, including mild congestion in the heart and kidney of fish infected with the three isolates, were not pathognomonic for ISAV infection. Although these lesions have been described as part of the early signs of the disease, they might also be a result of pooling of blood in these organs during euthanatization of the fish because these organs are well vascularized. Previous reports have suggested changes in the function of leucocytes and macrophages in the head kidney of infected fish early in the infection 20 but not congestion as observed in this study. In this study, no histopathologic changes were seen in the liver early in the infection, which supports an earlier report that lesions in the liver developed gradually with time. 16 However, early changes have been observed by electron microscopy in the perivascular macrophages of the liver of infected fish by 4 dpi. 44 In this study, as the infection progressed, moderate to severe lesions were observed in other organs including the liver, with congestion and hemorrhages in most organs and the endothelial cells undergoing degeneration. The degeneration of the endothelial cells was most severe in the liver sinusoids where mild hepatocellular necrosis was also noted. These trends were observed toward the onset of mortality and remained through the peak mortality for all three isolates. We speculate that severity of liver lesions alone can be used as an indicator of the onset of mortality. This observation supports other reports stating that degenerative changes in the sinusoidal endothelium from 14 dpi and in the hepatocytes, by 18 dpi in ISAV-infected fish coincided with the onset of mortality. 44 Severe microscopic changes were also reported previously in the liver of ISAV-infected fish as the infection progressed and hematocrit value decreased. 16 Those studies were based on moribund or dead fish. To the best of our knowledge, this is the first sequential study to follow the progression of lesions in the different organs of fish infected with different isolates of ISAV.
The overall lesions observed in the heart were mild to moderate even at peak mortality. However, a recent report has shown evidence of cardiac dysfunction in ISAV-infected fish from 15 to 16 dpi, even in the absence of histopathologic lesions, which coincided with the onset of severe ISA clinical signs in infected fish. 21 The appearance of ISH signals early and first in the heart of fish sampled from all the three groups in this study was unexpected because the kidney and liver have previously been reported to be sites of early virus replication in infected fish. 13, 40, 44 Our observations support other findings that used RT-PCR to show that the virus might be present and replicate in the heart earlier than in other organs. 31 We previously reported that the heart shows the most ISH signals when compared with other tissues in fish mortalities due to experimental ISAV infection. 34 This study confirms those observations and further shows that the virus mRNA in the heart increases as the infection progresses, as evidenced by the intense ISH signals until the peak viremia period followed by a decline. Moreover, the fact that the heart was the last organ to show ISH signals in surviving infected fish makes it an interesting organ to focus on regarding pathogenesis and persistence of the virus. Although we cannot hypothesize as to the exact reason why the heart contains the most viral mRNA during early, peak, and at the decline of the infection, our suggestion is that it might be attributed to increased activity of the endocardial endothelial cells and the presence of underlining activated macrophages, which continuously trap and remove circulating virus. The ISH signals were observed later in the kidney and liver, but as the infection progressed, both the intensity and frequency of ISH signals increased significantly, indicating increased replication of the virus in these organs. Our data show that the ISH signals peaked in all three organs at the onset of mortality and declined in fish sampled after the peak mortality. This indicates that the virus has only a single peak viremic period, and that fish that survive this period survive the infection. However, some authors 31 reported a second peak viremic period that resulted in 100% mortality within the same infected group. A bimodal peak of mortality is also believed by some authors 31 to be the result of a second round of infection from the high levels of virus shed by fish that were initially infected. This is more frequently seen with waterborne or cohabitation challenges. The difference in these two observations might be attributed either to virus isolates used 32 or to differences in method of challenging the fish—cohabitation versus intraperitoneal inoculation with the virus. Another difference might be related to the techniques used to detect virus; studies detecting infectious virus (e.g., culture) or viral genomic RNA (e.g., RT-PCR with only a sense primer in the initial reaction) may not be directly comparable with this study, which measured virus mRNA expression. Moreover, although the RT-PCR method used by others 31 is very sensitive, quantifying the virus load without using real-time RT-PCR might be inaccurate. 36 In this study, the ISH technique allowed the detection of undiluted amounts of viral mRNA present in the tissue and there was no possibility of cross-contamination as might occur with RT-PCR. Besides, other researchers 31 acknowledged that there might be variations in the pathogenesis of different ISAV isolates as shown from recent studies. 32
Previous studies have shown an association between ISAV and the disease, but there has been no report on the relationship between level of virus replication, severity of lesions, and mortality. Most studies have reported a relationship or an association (or both) between decrease in the hematocrit value, onsets of anemia, liver lesions, and mortality in ISAV-infected fish, 16, 20 but not with virus replication. In this study, we observed that both the frequency and intensity of ISH signals increased in all tissues sampled from all the groups infected with the different ISAV isolates as the infection progressed, and at the same time, the lesions observed in these organs/tissues became more severe, indicating that as infection progressed, virus replication and reinfection of cells increased, leading to degeneration and necrosis of the cells. An interesting observation was that, at peak ISH signals in most of the tissues, the signals were observed in some individual blood cells in the blood vessels indicating peak viremia. At this time, most tissues showed severe histopathologic lesions and the onset of mortality. We also observed that the ISH signals remained high coupled with severe lesions in most tissues during the peak mortality period before declining in tissues of surviving fish. This finding shows that there is a strong correlation between peak viremia, peak lesion development, and onset of mortality in all three isolates. This finding is further supported by our observations when different isolates were used, in which the Norway 810/9/99–infected group showed ISH at 3 dpi in the heart, and the signal peaked at 10 dpi with severe lesions in most tissues, which coincided with the onset of mortality, whereas the RPC-01-0593-01 showed signals at 6 dpi, peaked from 10 dpi, and mortality started from 12 dpi; and U5575-1 showed ISH signals on 10 dpi, peaking on 21 dpi, with mortality starting from 17 dpi.
This study demonstrates that the most severe lesions are observed at peak viremia in infected fish and suggests that the liver and kidney tubular lesions seen in ISA are a result of the direct destruction of the endothelial cells by virus leading secondarily to ischemic necrosis of hepatocytes and tubular epithelium. We were not able to determine the maximum ISH signals at which it could be comfortably determined that mortality is inevitable, this is because the intensity and frequency of the ISH signals varied slightly amongst groups infected with RPC-01-0593-1 and Norway 810/9/99 isolates and varied even more with the U5575-1 isolate. Moreover, the ISH signals as an indicator of the amount of viral RNA in the tissues cannot be quantified numerically. However, it seems from this study that the amount of virus replication in infected tissue/cells plays an important role in the pathogenesis of the disease. In cell culture studies, no clear correlation between replication properties in SHK-1 cells and the development of CPE was observed, 32 however, the isolates that replicated well showed CPE either early or later in the infection. It is believed that other factors also contribute to the pathology associated with ISAV in fish because the development of disease is a complex process involving viral, host, and environmental factors. This interpretation is supported by other studies that used ISH technique to show a significant correlation between the index of liver lesion and percentage of hepatocytes positive for the replicative intermediate RNA of hepatitis C virus RNAs in infected tissues. 9
The higher mortality, intensity, and more frequent ISH signals observed in the Norway 810/9/99–infected group (European genotype) and RPC-01-0593-1–infected group (North American genotype), compared with the U5575-1–infected group (European genotype) (Fig. 12), indicates that the difference in the ISH signals and the virulence of the virus might depend on the particular isolate used rather than on its hemagglutinin-esterase genotype or the geographic origin of the isolate. Other researchers 32 also reported differences in the rate of virus replication in the SHK-1 cell line and onset of CPE with different isolates of ISAV, even when the various isolates were closely related to each other at the nucleotide sequence level of the hemagglutinin-esterase gene.
In conclusion, this study demonstrates for the first time a direct relationship or association (or both) between viral replication (as in intensity and frequency of ISH signals) and severity of the pathology in situ in ISAV-infected fish. There was a strong correlation and association between peak viremia, severe histopathologic lesions, and the onset to peak mortality periods in ISAV-infected fish. The findings in this study also indicate that the severity of pathology associated with ISA (i.e., virus virulence) is based on the particular ISAV isolate causing the infection and not on the hemagglutinin-esterase genotype or the geographic origin of the virus.
Footnotes
Acknowledgements
This work was funded by the Natural Sciences and Engineering Research Council (NSERC) of Canada Strategic Grants and an NSERC Discovery Grant to F. S. B. Kibenge and by AVC Departmental Laboratory supplies to B. O. Ikede. We are grateful to Patricia McKenna, Greg Dobbin, and Dr. Dave Sims for technical assistance. We thank the Animal welfare staff of Aquatic Animal facility of AVC, UPEI, for excellent care of the experimental fish.