
Abstract
Twenty-four canine cutaneous nodules, diagnosed as mast cell tumors by fine-needle aspiration biopsy and confirmed by histopathologic analysis by staining with hematoxylin and eosin (HE) and toluidine blue, were analyzed by computerized nuclear morphometry on panoptic- and HE-stained cytopathology slides. Two hundred nuclei per lesion were examined. The morphometric parameters investigated were nuclear area, mean diameter, perimeter, regularity factor, and ellipticity factor. Lesions were graded as I (well differentiated), II (intermediate differentiation), or III (poorly differentiated) according to the following morphologic features: invasiveness, cellularity and cellular morphology, mitotic index, and stromal reaction. Nuclear morphometric results were then compared with histopathologic grades. Values of nuclear area, mean diameter, and perimeter increased with increase in histopathologic grade, but statistical analysis revealed significant differences only between grades II and III and between grades I and III when HE was used (P, 0.01) and between grades I and III with panoptic stain (P, 0.05). The ellipticity factor and regularity factor did not reveal significant differences between histopathologic grades. The results indicate that nuclear morphometric analysis, in combination with the rapid and inexpensive cytopathology technique, can help in mast cell tumor grading, thus contributing to the establishment of a more precise prognosis and treatment.
Keywords
Mast cell tumors are potentially malignant neoplastic processes belonging to the group of round cell tumors, which correspond to 7–21% of the skin neoplasias affecting dogs, with no sexual predisposition. 26 , 31 The breeds considered to be most susceptible are Boxer, Boston and Bull terriers, and Labrador Retriever, and the mean age of affected dogs is 8.5 years. 2 , 14 , 21 , 24 , 26
Several histopathologic classifications have been proposed to identify the degree of differentiation of canine mast cell tumors. 2 , 14 , 24 Among them, the classification proposed by Patnaik et al. 24 is considered to be the most complete and is the one most frequently used. 11 , 16 , 18 , 21 , 23 , 26 , 28 , 30 However, histopathologic grading is based on the use of subjective parameters such as invasiveness, cellularity and cellular morphology, and mitotic index and often proves to be inconsistent for the evaluation of borderline cases. 26 , 30 , 32 Although histopathologic grading is considered to be a good method for the prediction of long-term tumor behavior, reproducibility problems lead to as much as 50–60% discordance between experienced pathologists. 1 , 11 , 17 , 22 , 29 , 30
In addition to mast cell tumor classification by traditional histopathologic criteria, other methods have been tested as potential prognostic markers in an attempt to improve the prediction of the behavior of this neoplasia in terms of recurrence, metastasis, and animal survival, including cell proliferation markers (AgNORs, PCNA, and Ki-67) and markers of the expression of tumor suppressor genes such as p53. 1 , 3 , 11 , 16 , 18 , 30
One of the solutions found over the last few decades to minimize subjective interobserver variations and consequently aid diagnostic decisions was the development of computerized morphometric techniques. 5 , 7 , 8 , 12 , 15 , 17 , 22 An additional relevant method is cytopathologic examination, which is an efficient, practical, and rapid technique for the diagnosis of mast cell tumors. 6 , 7 , 13 , 19 Using cytopathology is also advantageous in that the cell is spread on the slide so that its image is a complete projection of its cytoplasm, thereby eliminating the tridimensional problems of the various sections of the same cell encountered in histopathology. 10
The objective of the present study was to determine whether mast cell tumors of different histopathologic grades show different nuclear morphometric patterns by combining the precision of computerized morphometric analysis with the rapidity and practicality of cytopathologic examination.
Materials and Methods
Tumors
The study was conducted on 24 skin mast cell tumors from 14 dogs obtained from the Department of Surgery, Faculdade de Medicina Veterinária e Zootecnia, Universidade de São Paulo (FMVZ-USP), from February 1999 to October 2000. The diagnosis was made by fine-needle aspiration biopsy (FNAB) and was confirmed by histopathologic analysis. Seven dogs were males (50%) and seven were females (50%). The most frequent breed was Boxer (35.7%, 5/14), followed by Schnauzer and mongrel dogs, with the numbers of both being the same (14.2%, 2/14). The remaining dogs were a Pinscher, a Poodle, a Brazilian Fila, a Dachshund, and a Doberman Pinscher. Age was determined for 13 dogs, with the mean age being 8.5 years (range, 4–13 years). Six dogs (42.8%) had more than one mast cell tumor, and the remaining dogs had a single lesion (57.2%, 8/14) each.
Cytologic and histopathologic processing
Two cytopathologic slides obtained by FNAB were air-dried and stained by the panoptic method (HEMATOCOR®, Biolog®, Biológica Comercial Ltda., São Paulo, SP, Brazil), and two additional slides obtained by scraping the cut surface of the surgical piece were fixed in absolute alcohol for 24 hours and stained with hematoxylin and eosin (HE). The material to be used for histopathology was fixed in 10% formaldehyde and was routinely processed. Two 5-μm sections were obtained from each tumor and were stained with HE and toluidine blue, respectively. 25
Histopathologic grading
The 24 tumors were classified as grades I to III according to the level of cellular differentiation on the basis of the histopathologic grading criteria of Patnaik et al. 24 Three observers, who were experienced anatomic pathologists and had no preliminary clinical information about the tumors, performed this grading independently. The histopathologic grade established by the consensus of two or more observers was considered to be the final diagnosis.
Nuclear morphometric analysis
The material obtained by cytopathologic processing was analyzed with an Olympus® BX 50 Trinocular microscope (Melville, NY) coupled to a video camera system (SONY®, CCD-IRIS model, San Jose, CA) and to a computer equipped with the Image ProPlus® analysis system (Media Cybernetics, Silver Spring, MD, version 3.0.01.00 for Windows 95/NT). The computer used was equipped with a 550-MHz Pentium III® Intel® processor with 128 Megabytes of RAM and a 17-in. monitor. The images created by the computer system were formatted as tif files. The measurements were calibrated with the aid of a micrometer ruler (Olympus®) and a 100× magnification oil-immersion objective.
For each tumor, 200 nuclei (100 stained by the panoptic method and 100 with HE) of cells presenting sharp nuclear and cytoplasmic limits that did not overlap were contoured by tracing their margins with the aid of a mouse. Because of the quality of slides or number of slides available (or both), of the 24 tumors, 23 tumors stained with HE (tumor Nos. 1–22 and 24) and 16 tumors stained by the panoptic method (tumor Nos. 1, 4, 5, 7, 10–12, 14–16, 18–20, and 22–24) were available for nuclear morphometric analysis on cytopathology slides. For the tumors stained with HE, we used 700 cells from grade I lesions, 1,000 from grade II lesions, and 600 from grade III lesions (7, 10, and 6 tumors, respectively); for the tumors stained by the panoptic method, we used 500 cells from grade I lesions, 600 from grade II lesions, and 500 from grade III lesions (5, 6, and 5 tumors, respectively).
The parameters available in the tools offered by the Image ProPlus® software and used in the present study were as follows: Area, equivalent to the area of the object; ellipticity factor, equivalent to the major/minor axis ratio of an ellipse referring to the object; average diameter, equivalent to the mean measurement of the diameters measured at 5° intervals around the center of the object; perimeter, equivalent to the measurement of the perimeter of the object; and regularity factor, representing the regularity of the contour of the object according to the formula (perimeter 2 )/(4 × π × area).
Statistical analysis
The results obtained by computerized cytomorphometry were compared and correlated with the grades obtained by histopathologic examination. Data were analyzed for normality by the Kolmogorov-Smirnov test using the GraphPad InStat® software (version 3.01 for Windows 95, GraphPad Software, San Diego, CA, www.graphpad.com), with the level of significance set at P < 0.05. Because the data did not show normal distribution, comparison of histologic grades was performed by one-way analysis of variance (ANOVA) followed by the Tukey-Kramer multiple comparisons test.
Results
Histopathologic grading
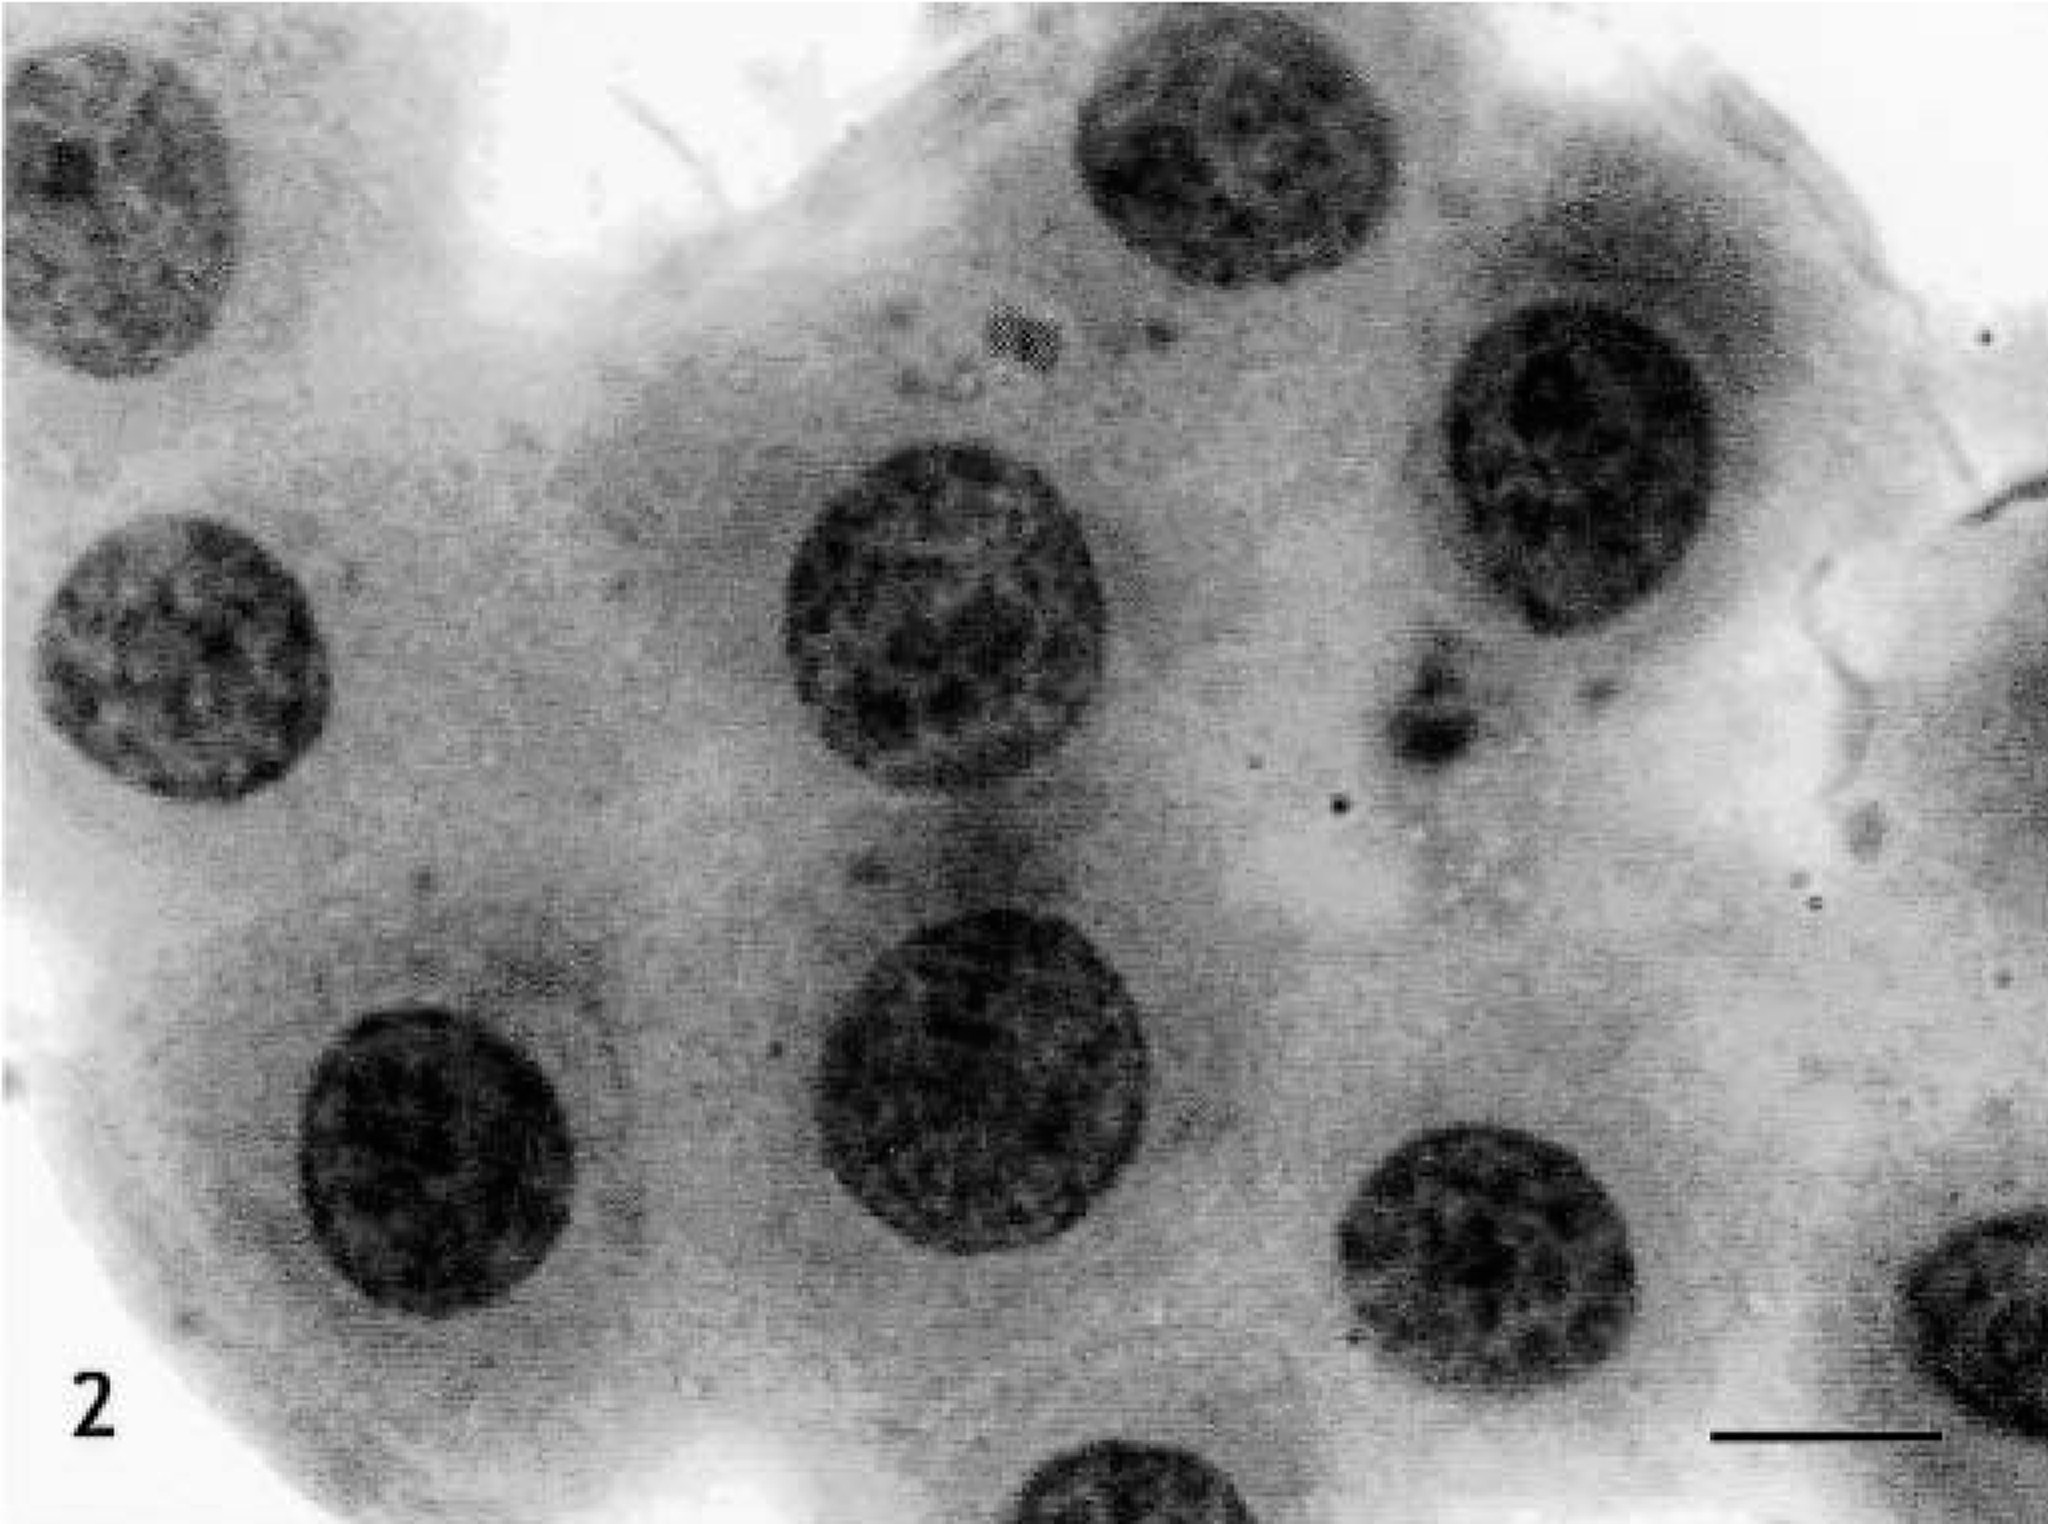
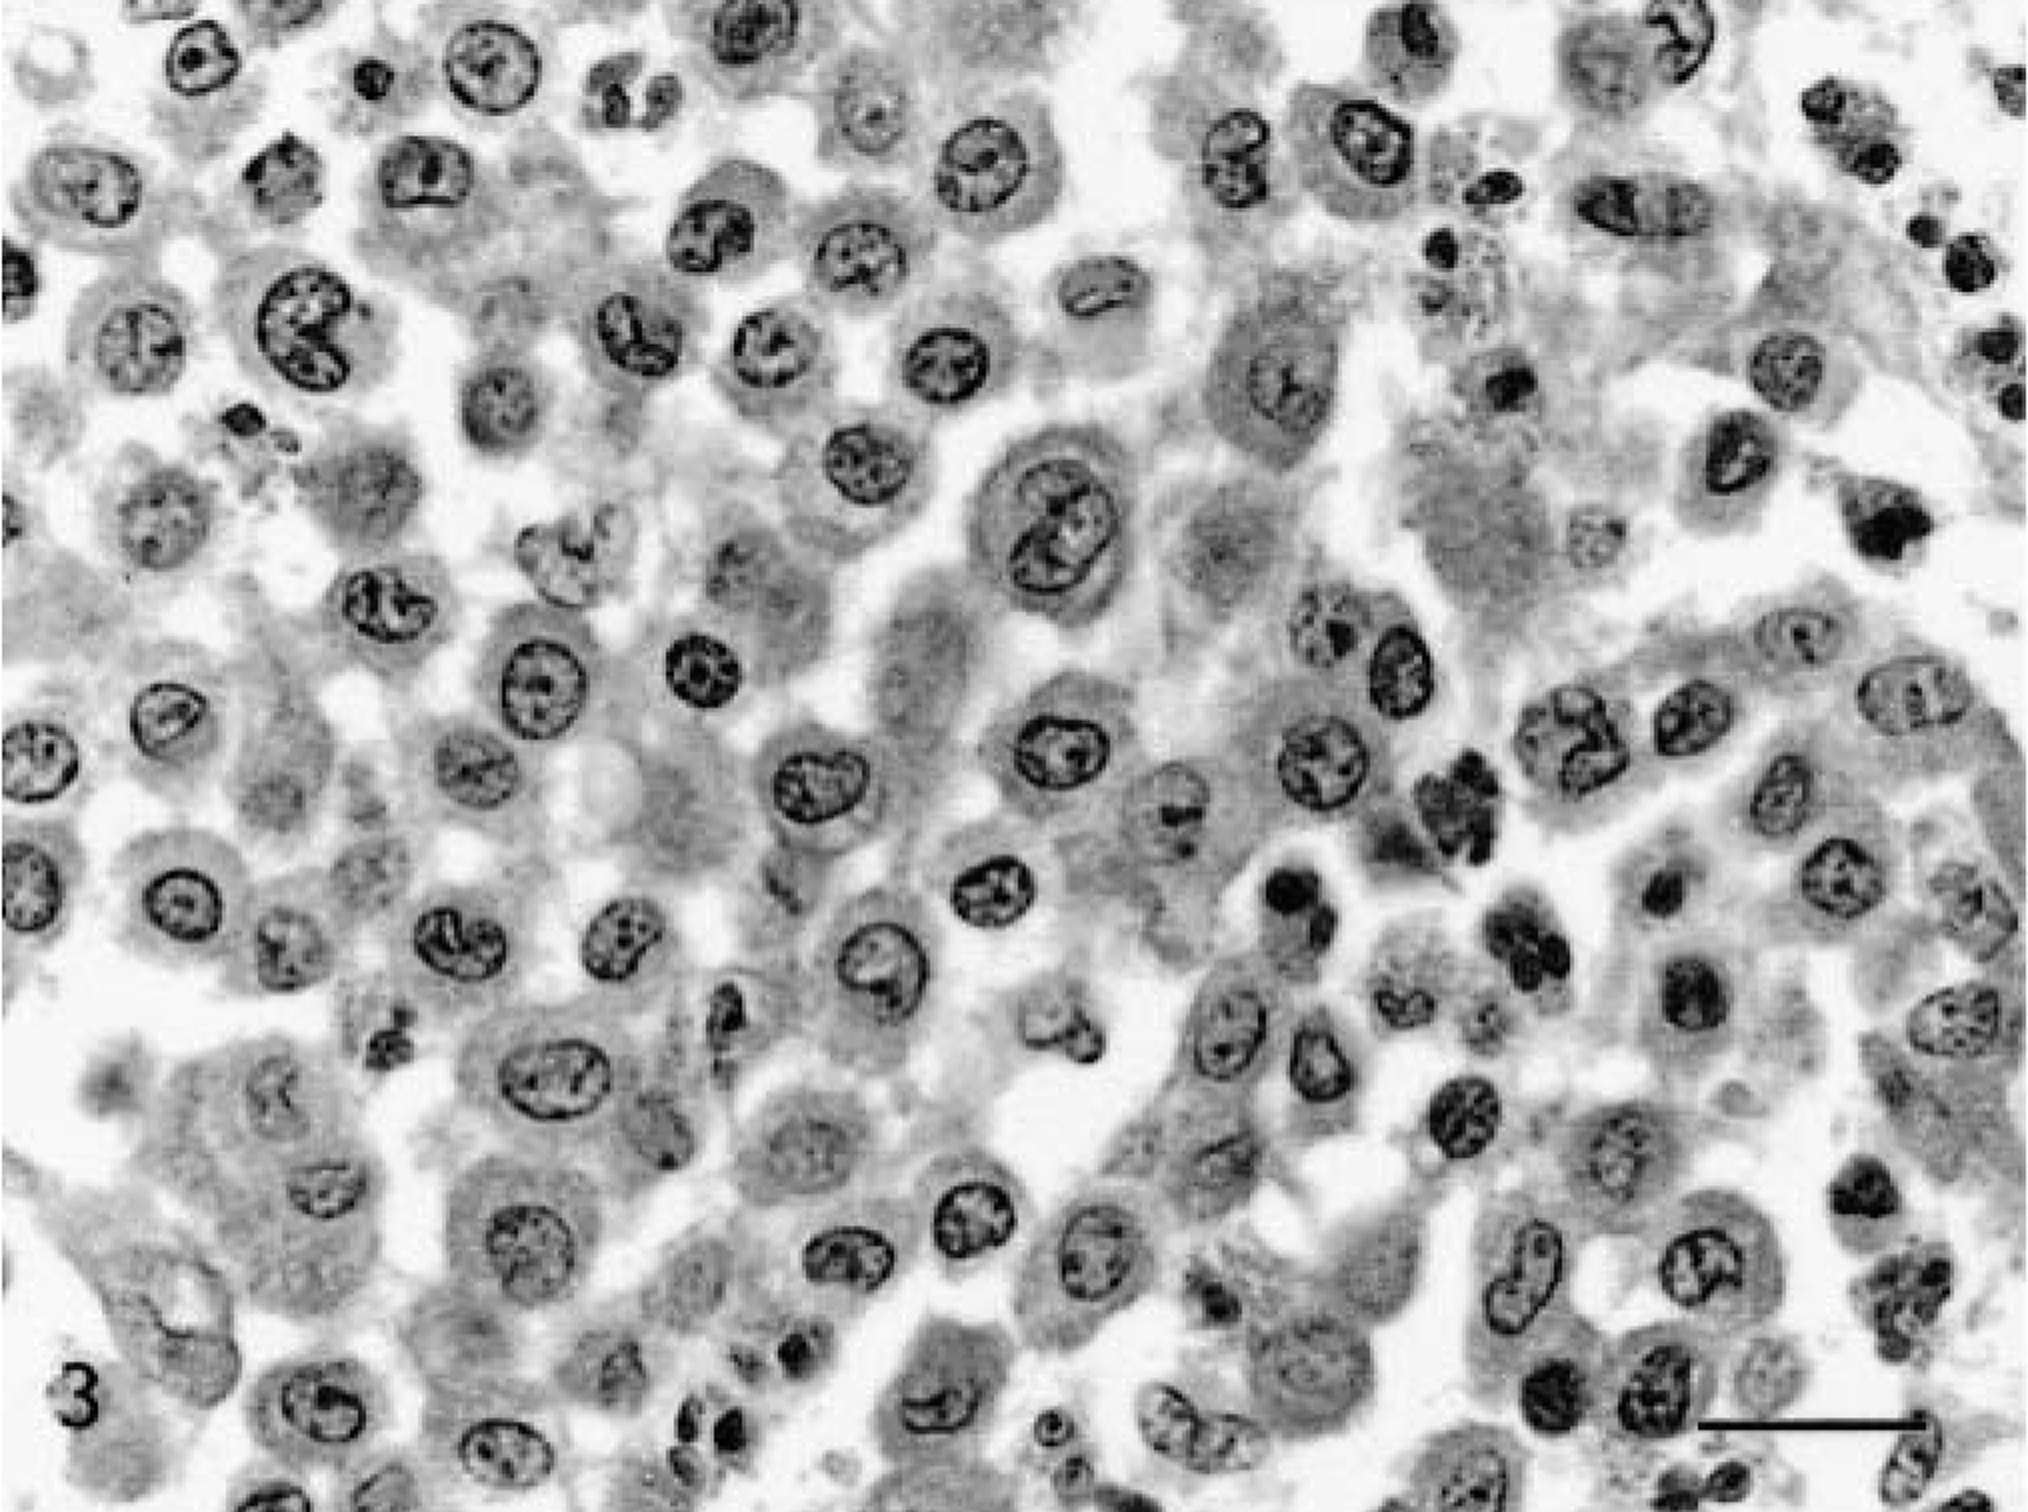
The histopathologic grades for each tumor, distributed according to the observer, are listed in Table 1. Seven tumors (29.2%) confined to the dermis and interfollicular spaces, which contained well-differentiated mast cells, arranged in rows or small groups, and showed no mitotic figures, were classified as grade I (Fig. 1); 11 tumors (45.8%) that were moderately to highly cellular and infiltrated the dermis and subcutaneous tissue, were formed by moderately differentiated mast cells with intracytoplasmic granules of variable morphology, and showed rare mitotic figures were classified as grade II (Fig. 3); 6 neoplasms (25%), which replaced the dermis and subcutaneous tissue and extended to adjacent tissues, had pleomorphic cells with indistinct cytoplasms arranged in packed sheets, and showed mitotic figures more commonly, were classified as grade III (Fig. 5). The number of eosinophils was different between tumors of the same histopathologic grade. There was agreement between the diagnoses made by the three pathologists on 12 occasions (50%), with at least two observers grading the tumor similarly in all cases.
Distribution of the mast cell tumors analyzed according to the classification proposed by Patnaik et al.24 as a function of the observers consulted (São Paulo, 1999–2000).
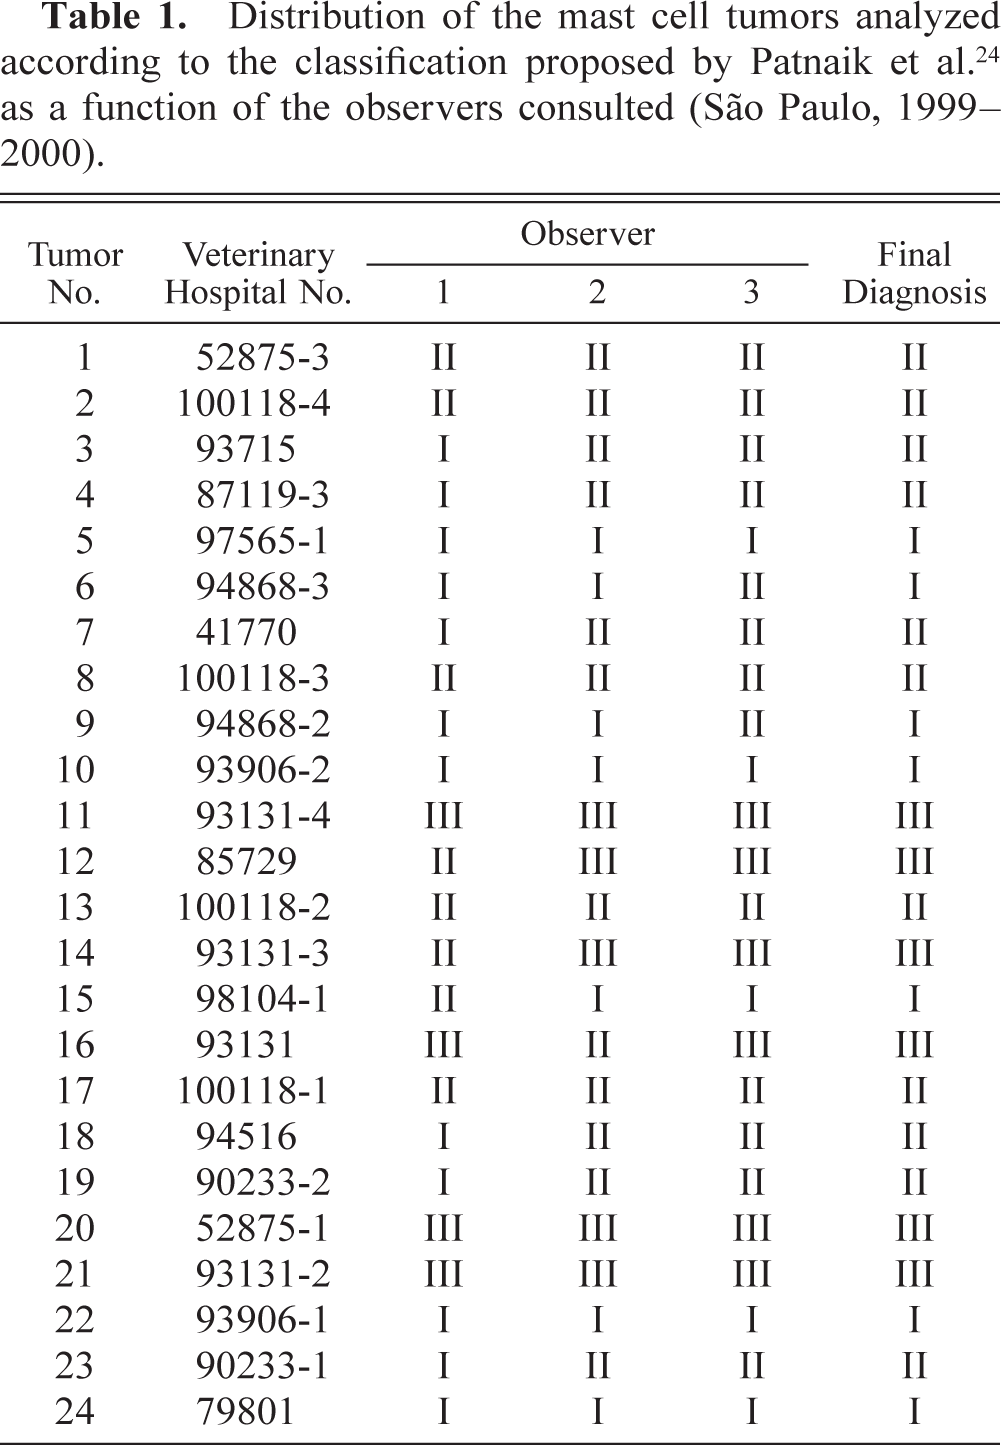
Skin, Brazilian Fila, tumor No. 24. Grade I mast cell tumor. Well-differentiated mast cells, with distinct and granular cytoplasm (arrowhead), arranged in rows. Uniform and condensed chromatin, with no mitotic cells. HE. Bar = 15 μm.
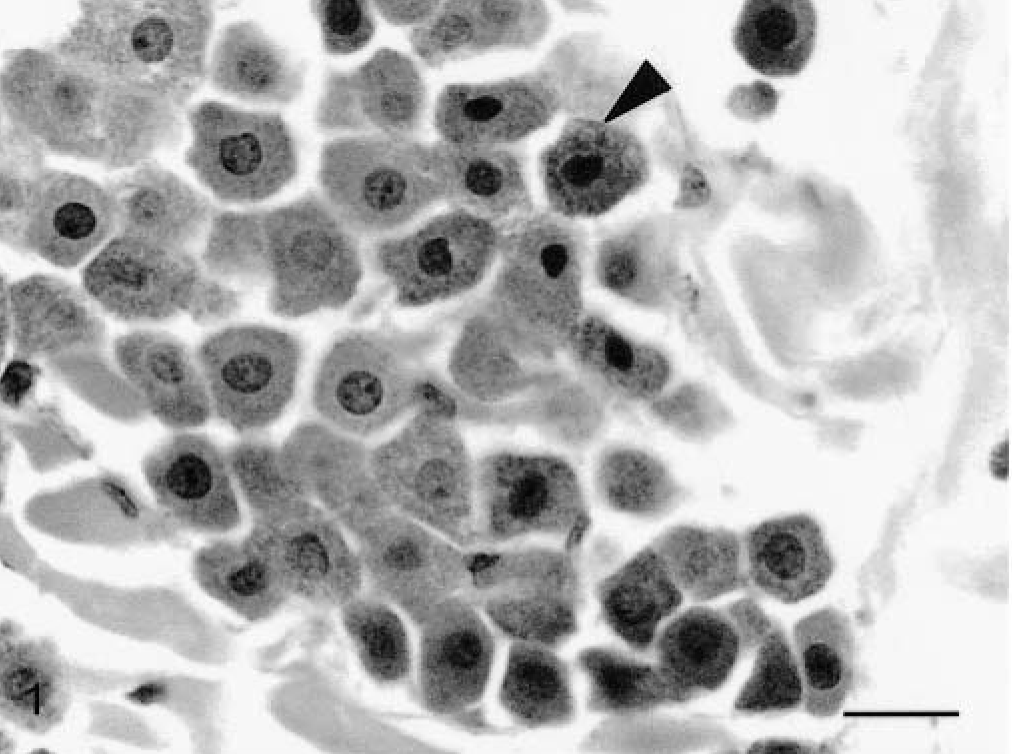
Skin, Boxer, tumor No. 10. Grade I mast cell tumor. Note the well-defined and uniform nuclei and cytoplasm of well-differentiated mast cells. HE. Bar = 5.5 μm.
Skin, Boxer, tumor No. 19. Grade II mast cell tumor. Moderately pleomorphic cells, most with distinct cytoplasm, arranged in groups. Round to oval nuclei, with scattered chromatin and single nucleoli. HE. Bar = 15 μm.
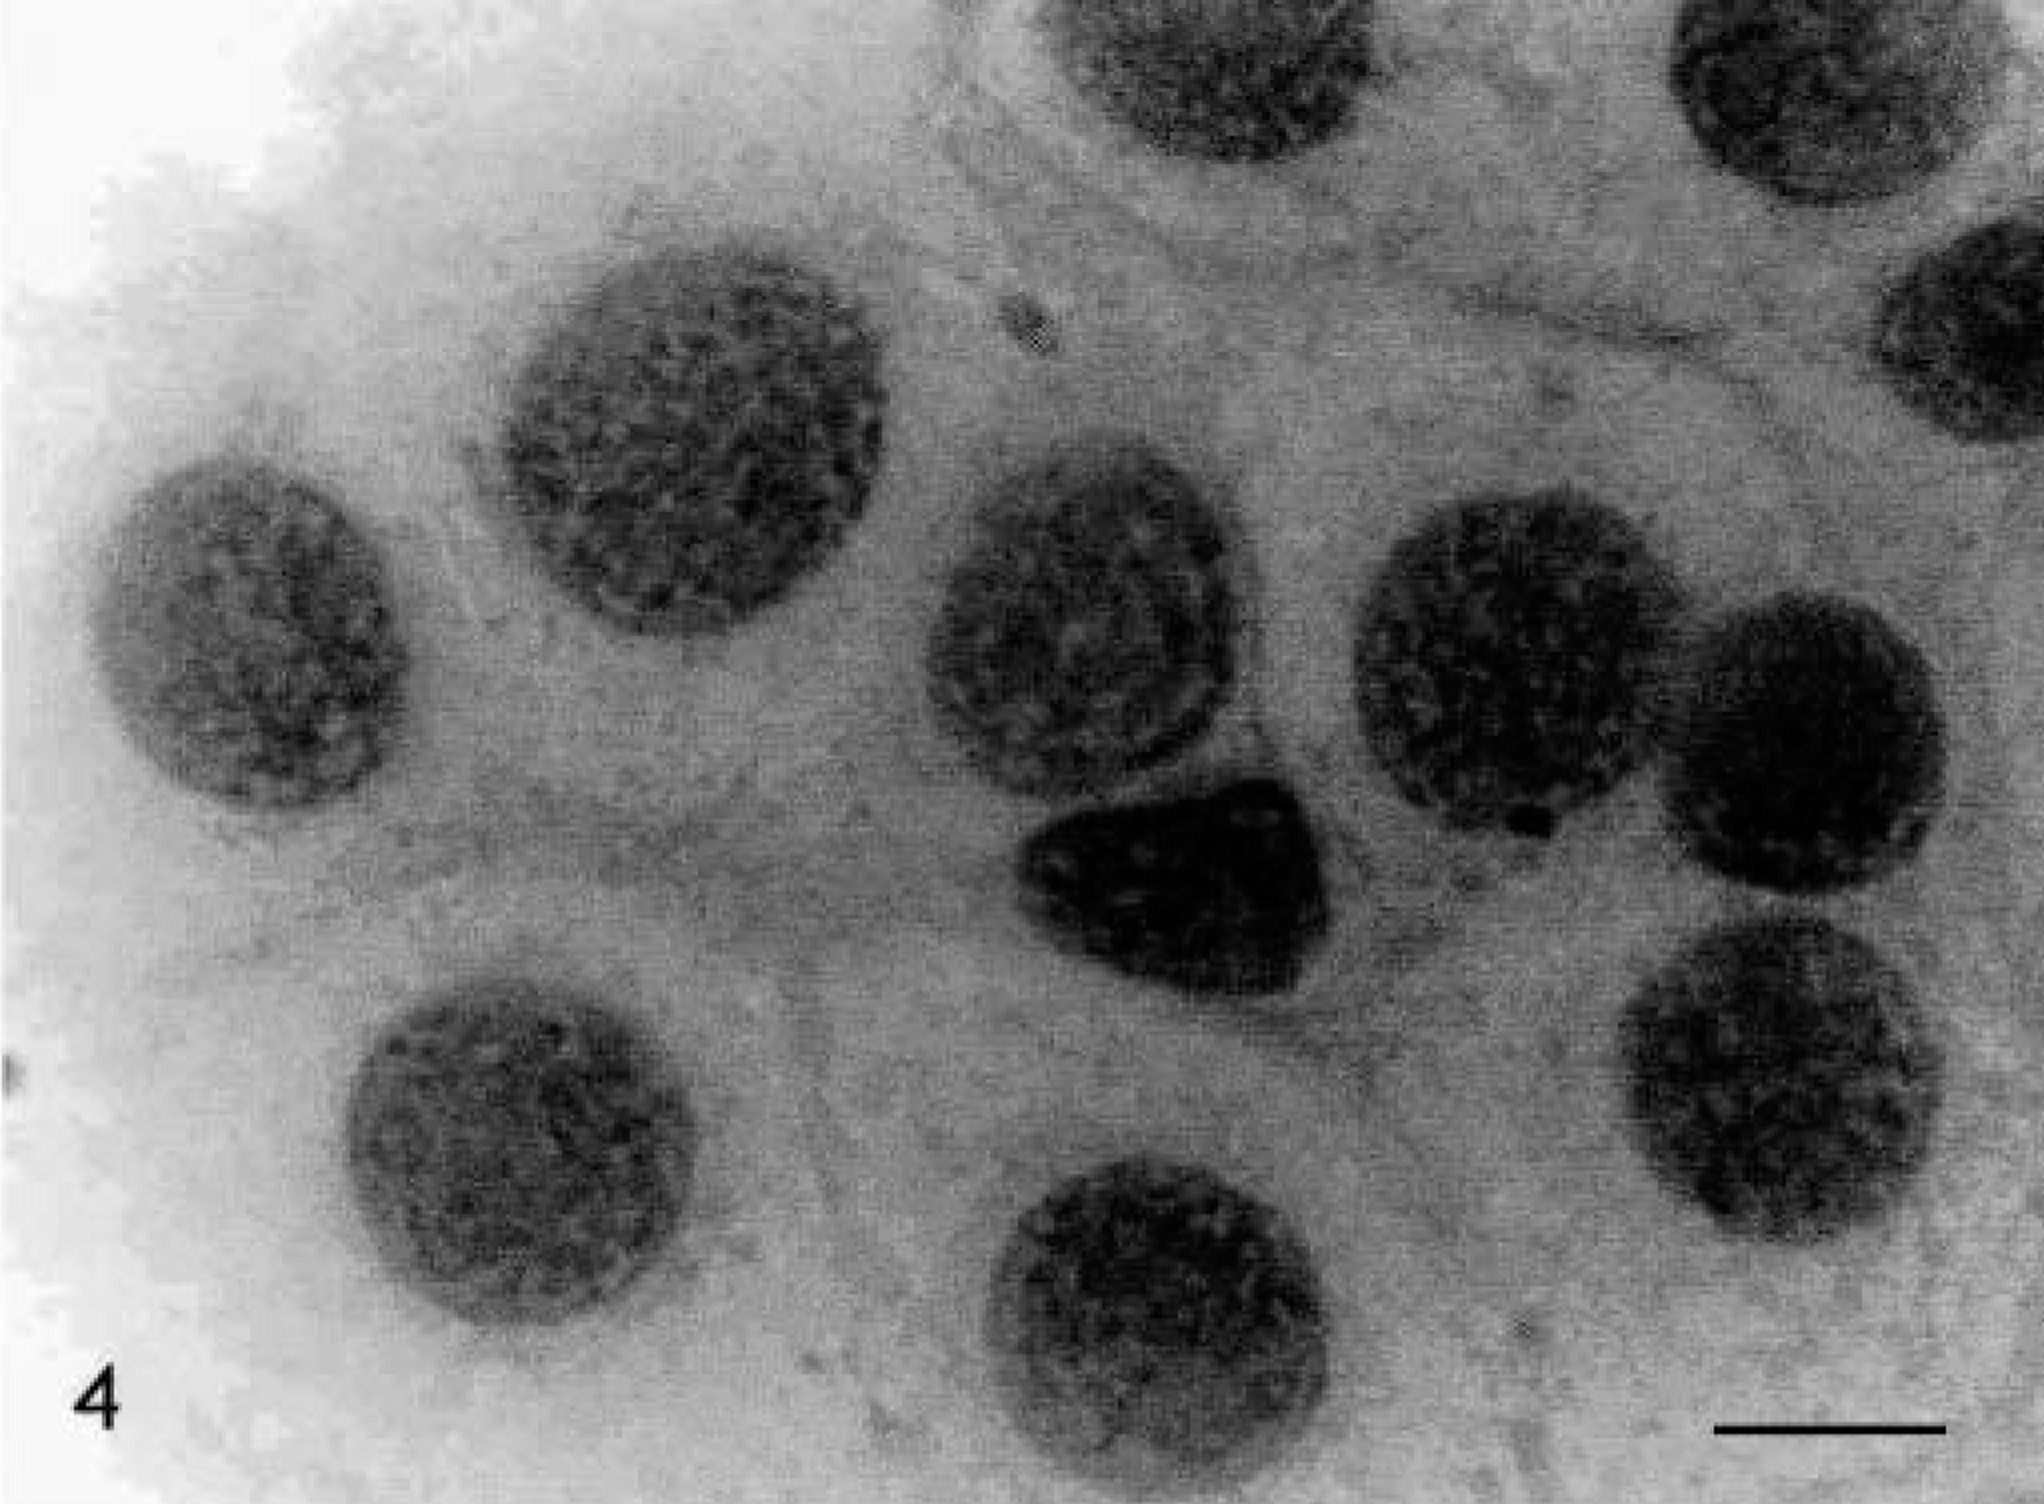
Skin, Boxer, tumor No. 1. Grade II mast cell tumor. Moderately pleomorphic cells with scattered chromatin. HE. Bar = 5.5 μm.
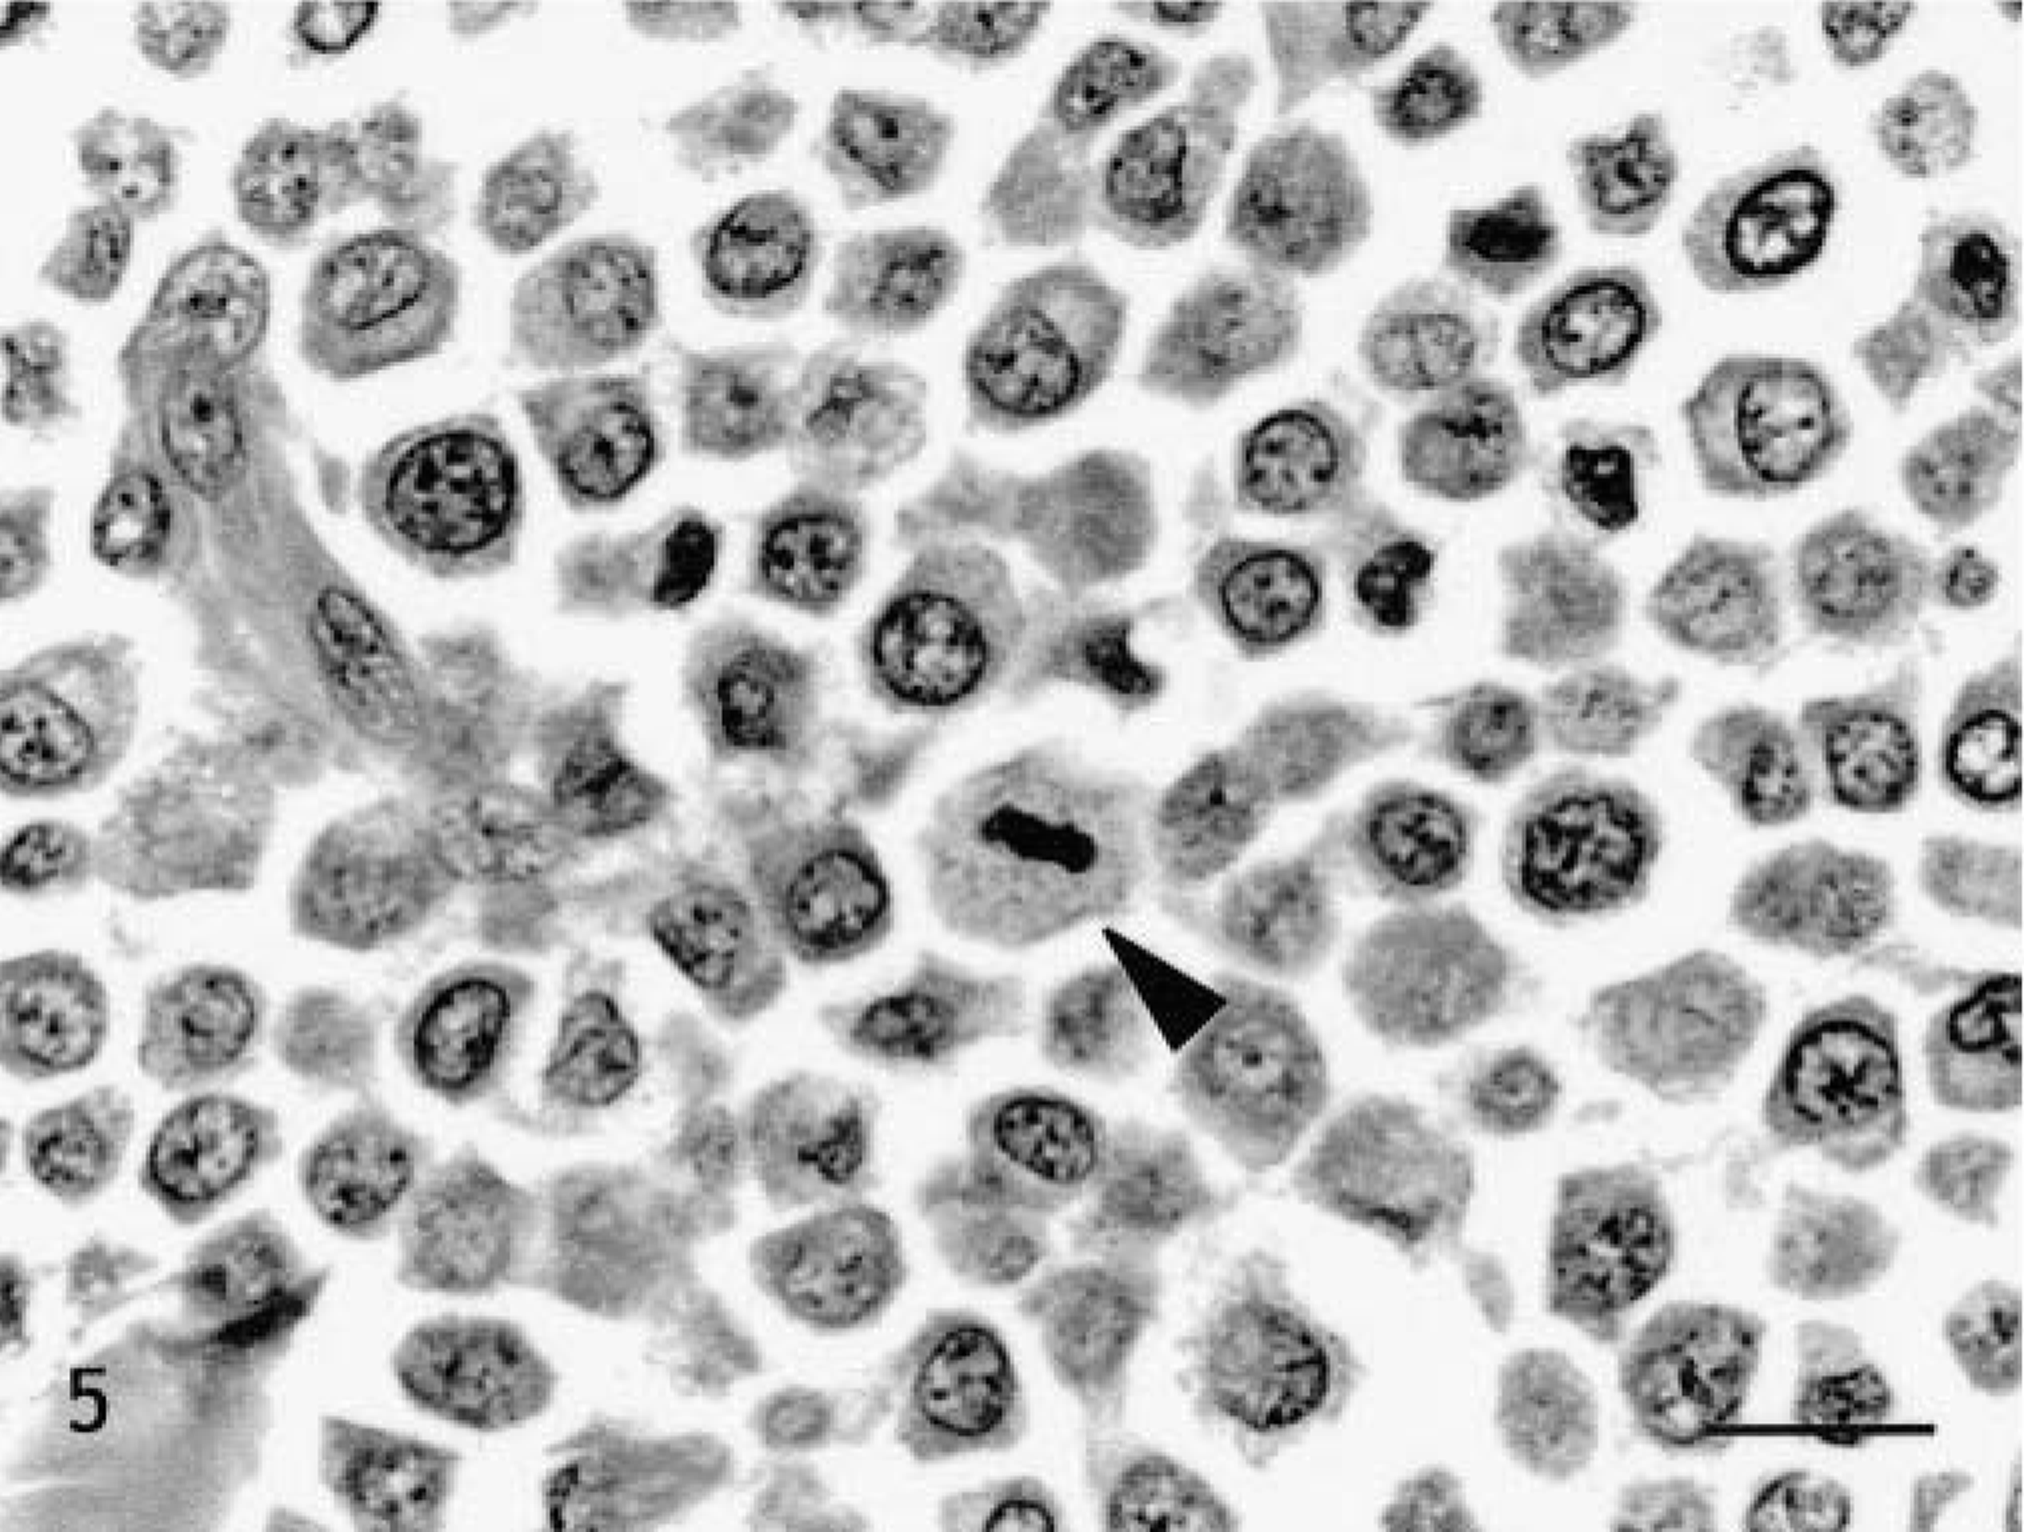
Skin, Doberman Pinscher, tumor No. 11. Grade III mast cell tumor. Highly pleomorphic mast cells with indented irregular nuclei in dense sheets. Some cells show multiple nucleoli and mitotic figures (arrowhead). HE. Bar = 15 μm.
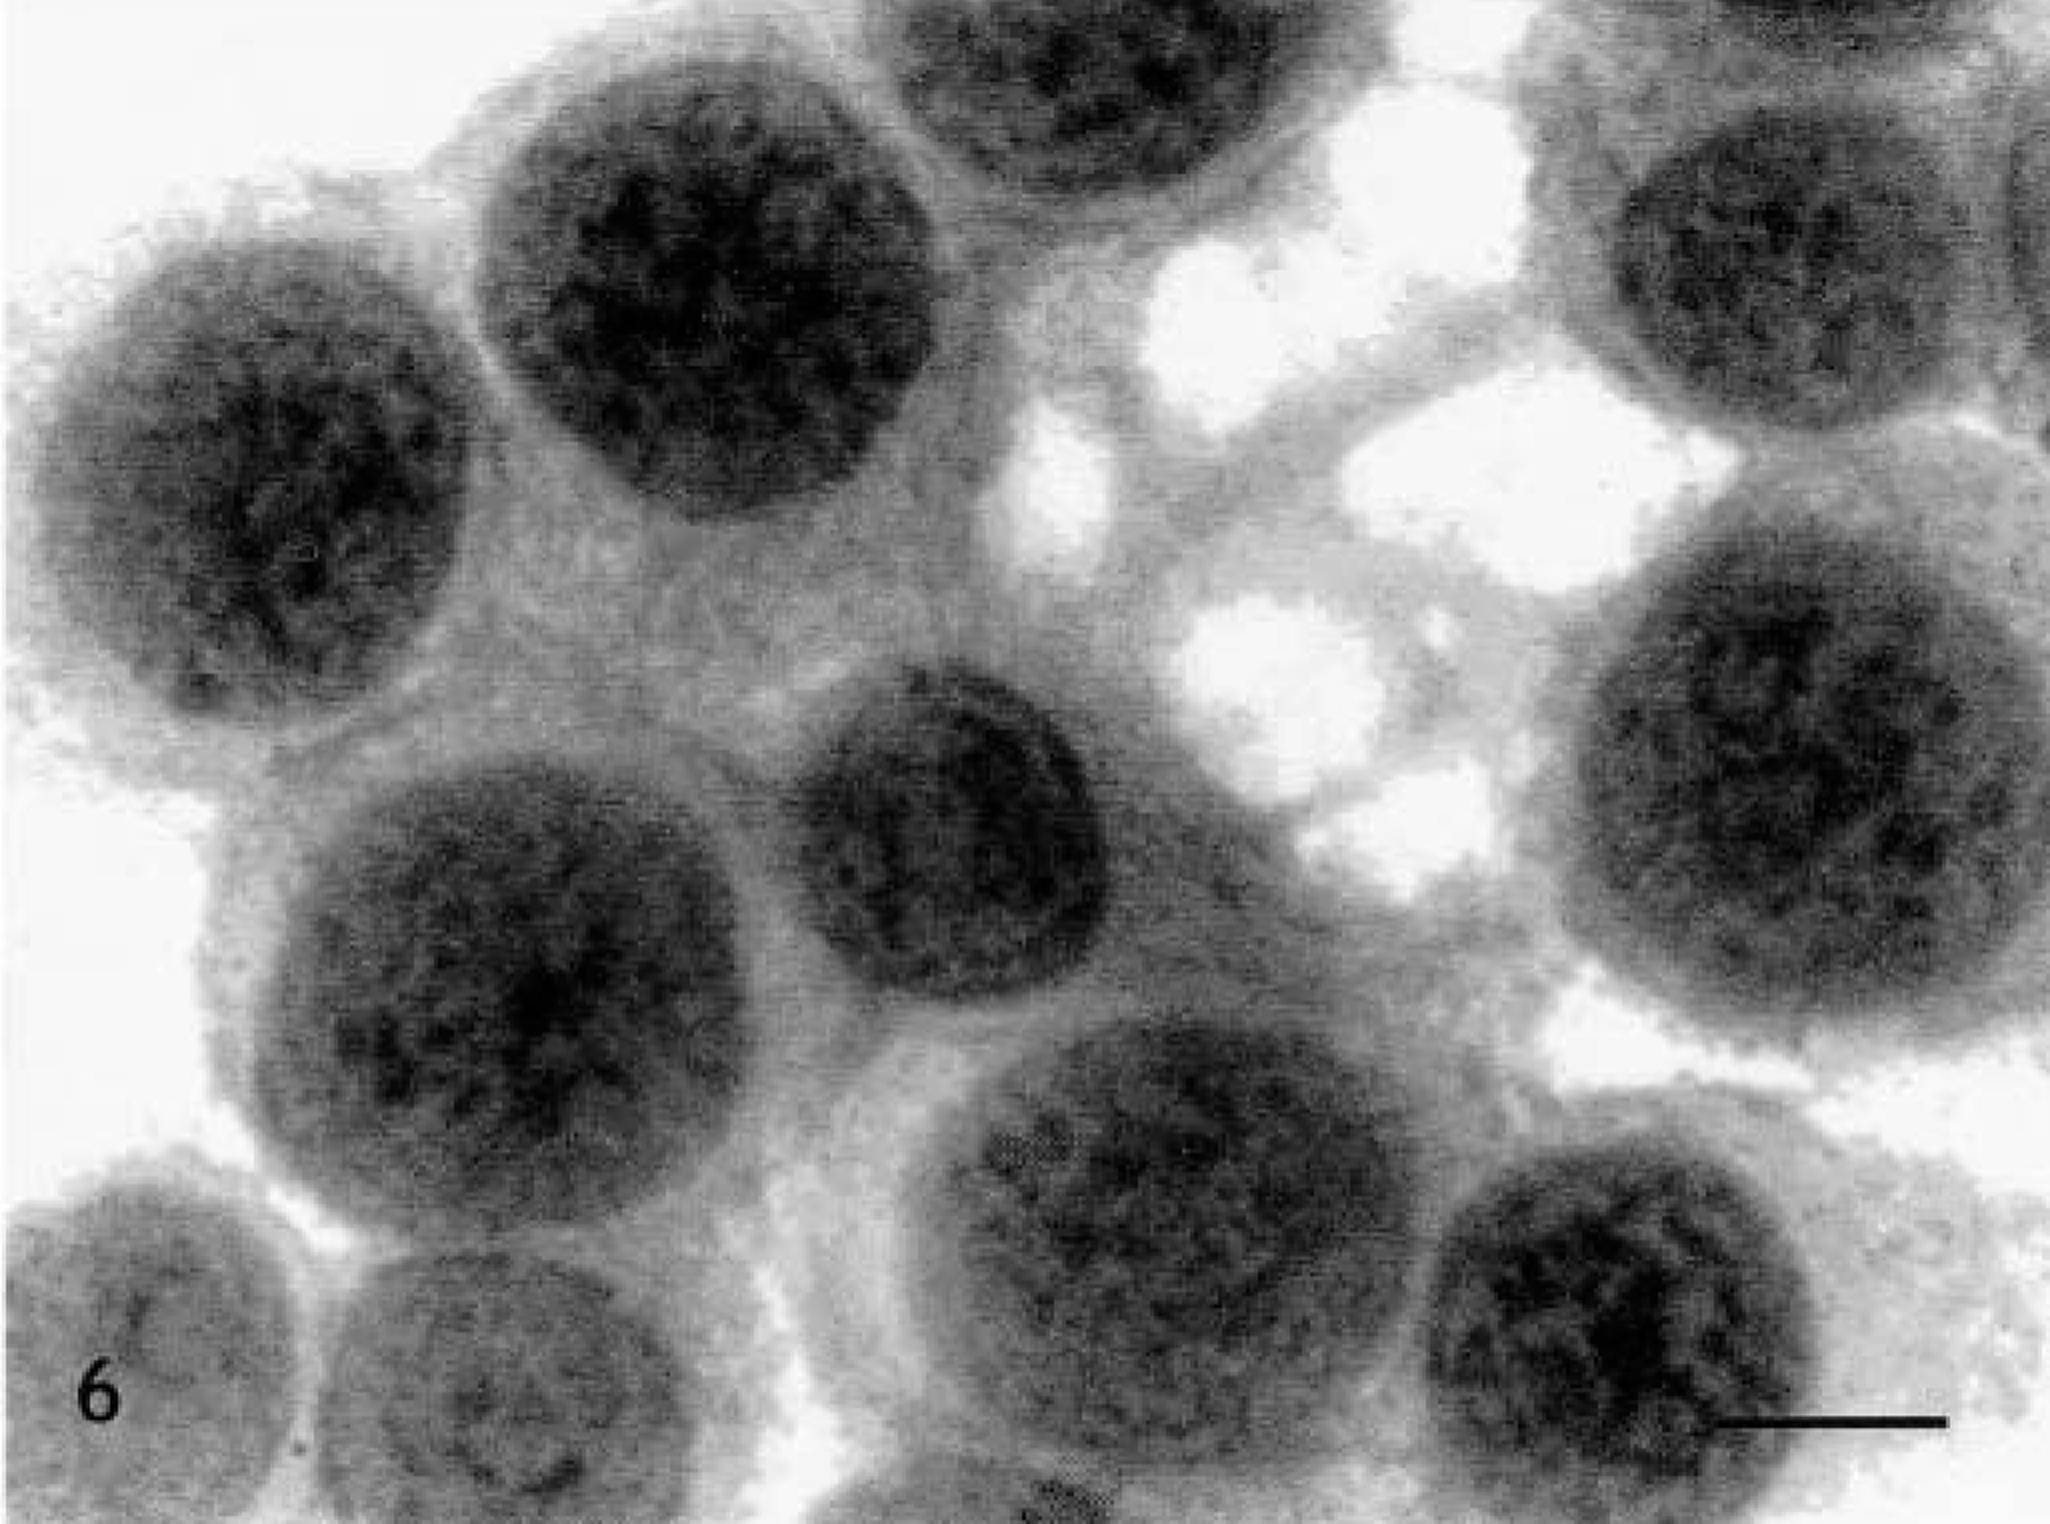
Skin, Doberman Pinscher, tumor No. 16. Grade III mast cell tumor. Highly pleomorphic mast cells. HE. Bar = 5.5 μm.
Nuclear morphometric analysis
Nuclear morphometric results were then compared with histopathologic grades. Values of nuclear area, mean diameter, and perimeter increased with increase in histopathologic grade, but statistical analysis showed significant differences only between grades II and III and between grades I and III with HE (P < 0.01) and between grades I and III when the panoptic stain was used (P < 0.05). The ellipticity and regularity factors did not reveal statistically significant differences between histopathologic grades. Tables 2 and 3 present the karyocytometric data for the parameters analyzed as a function of histopathologic grading using HE and panoptic staining, respectively. Figures 1–6 display the major morphologic features observed for the various grades.
Distribution of mean, standard deviations, and range of the data concerning the nuclear morphometric parameters obtained for cytopathologic material stained with HE, as a function of histopathologic grading (São Paulo, 1999–2000).

∗ n = Number of tumors analyzed.
† Statistically significant difference (P, 0.01) in relation to grade III—one-way ANOVA/Tukey-Kramer test.
Distribution of mean, standard deviations, and range of the data concerning the nuclear morphometric parameters obtained for cytopathologic material stained with panoptic stain, as a function of histopathologic grading (São Paulo, 1999–2000).
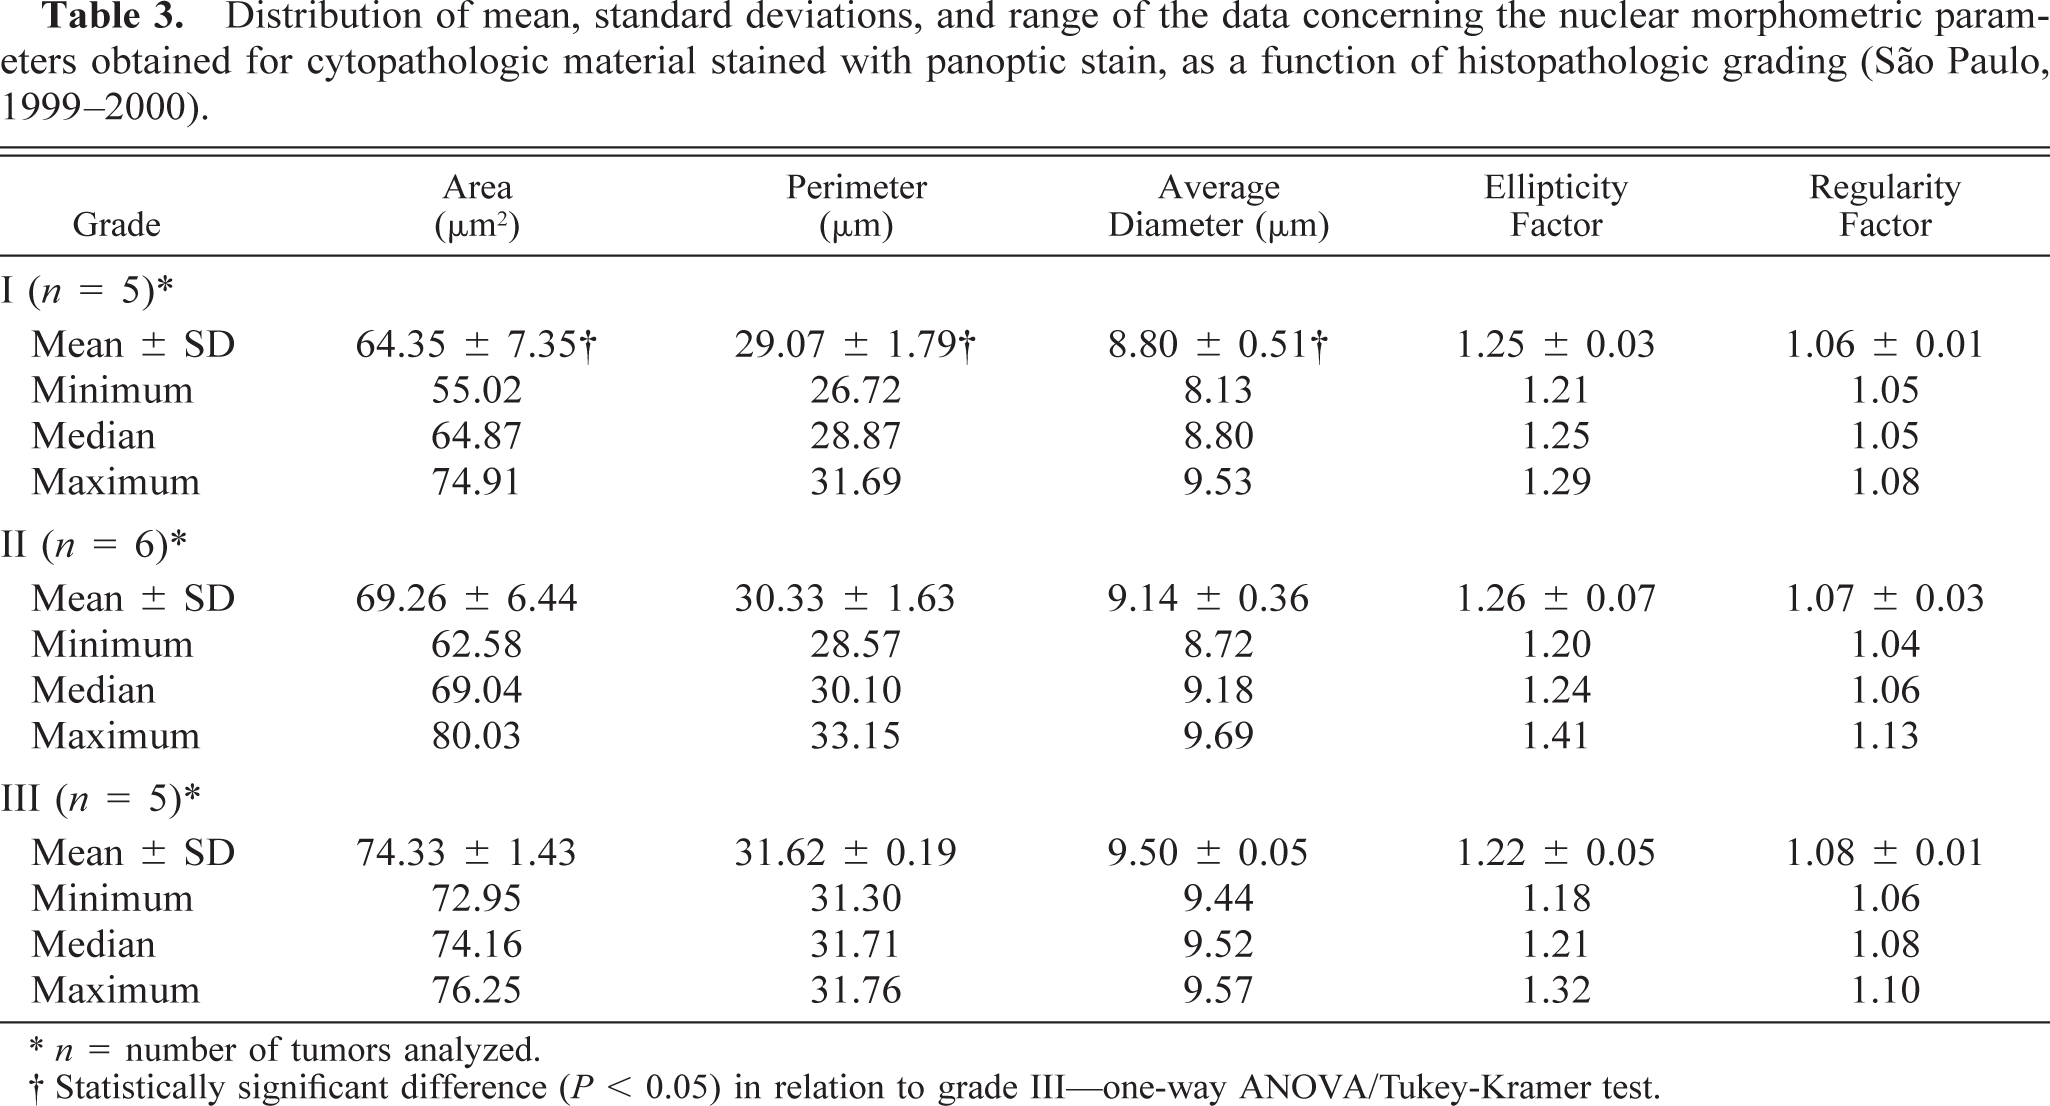
∗ n = number of tumors analyzed.
† Statistically significant difference (P, 0.05) in relation to grade III—one-way ANOVA/Tukey-Kramer test.
Discussion
The clinical data obtained in the present study confirm literature reports about a higher incidence of mast cell tumors in the Boxer race and a mean age of involvement of 8.5 years. 1 , 2 , 11 , 14 , 16 , 21 , 23 , 24 , 32 Multiple tumors were detected in six dogs (42.8%), in contrast to the 3–14% rate reported in the literature. 21 , 23 , 30
Histopathologic grading
Considering the proposal that multiple mast cell tumors should be classified according to the lesion of highest grade, 16 the distribution of histopathologic grading among the 14 animals studied was as follows: 35.7% (5/14) tumors of grade I, 42.9% (6/14) of grade II, and 21.4% (3/14) of grade III. The results appear to be similar to those obtained by Patnaik et al. 24
Although widely adopted, the histopathologic grading proposed by Patnaik et al. 24 presents some difficulties, including counts of mitotic figures per 40× magnification field. In the present study, some highly cellular tumors presented extremely anaplastic cells with few granules that invaded adjacent tissue, where areas of necrosis were also observed. These tumors were classified as grade III, even though they did not have three to six mitoses per field, as proposed by Patnaik et al. 24 Some investigators have stated that mitotic counts require greater standardization and therefore lose reproducibility because of factors such as the short duration of the M phase, presence of pyknotic nuclei, and even differences in field area in objectives from different manufacturers. 1 , 9 , 27 Thus, we believe that, although reported with fixed values, the evaluation of mitotic index may not be a determinant for grading but should be considered only as an additional parameter of anaplasia, and the presence of mitosis counts to a greater or lesser extent should be taken into account in each case.
Another factor to be considered for a tumor classification system is interobserver variability. 1 , 11 , 21 , 23 , 26 , 30 , 32 In the present study, we decided to treat this problem by submitting the material for histopathologic grading to three experienced anatomic pathologists who worked independently, without any previous clinical information. The results obtained showed interobserver variations in 50% of the tumors (Table 1). Even considering that the basis for grading was the same, we may propose that this discrepancy in the results obtained was because of different observer experience or training. The other possibility could be the difficulty in evaluating borderline cases between two grades because of conflicting criteria such as large and pleomorphic nuclei, characteristic of grade II or III tumors, and small number of mitoses per field, characteristic of grade I or II tumors. The problems of interobserver reproducibility found by us support the observations reported by others, i.e., 50–60% discordance between experienced pathologists, and emphasize the importance of the definition of more precise criteria for the classification of this neoplasia. 17 , 22
Morphometric analysis
In the histopathologic descriptions used to differentiate mast cell tumors in terms of degree of malignancy, mast cell dimensions and shapes were mentioned. Quantitative measurements such as cell and nuclear diameters were reported by Hottendorf and Nielsen, 14 whereas Bostock 2 preferred using the nucleus/cytoplasm ratio for characterizing cells of different grades. Nevertheless, the methods by which these results were obtained were not described in detail, and the values were imprecise, which prevented speculations about the morphometric approach used. In the classification used in the study by Patnaik et al., 24 the descriptive text did not contain any objective/quantitative result in an attempt to establish cytomorphometric parameters, with the consequent subjectivity of traditional histopathology classifications.
The present results demonstrate that the area, mean diameter, and perimeter of the nucleus are the most appropriate nuclear morphometric parameters for differentiating between the histopathologic grades of canine skin mast cell tumors. These parameters revealed significant differences between grades II and III and between grades I and III with HE (P < 0.01). With the panoptic stain, we obtained less expressive results, showing significant differences only between grades I and III (P < 0.05). The increase observed in mean area, perimeter, and diameter confirmed the increase in mast cell nuclear size previously observed by others. 2 , 14 , 24 On the other hand, the higher values for area, perimeter, and mean diameter obtained by the panoptic method can be explained by the fixation process for the cytopathology slides. For panoptic staining, the smears are air-dried, which aids cell spreading, whereas for HE staining, fixation is performed by immersion in absolute alcohol for 24 hours, with a greater cell retraction resulting from the dehydrating action of the fixative. 20
In contrast, among the parameters concerning nuclear shape, the ellipticity factor and the regularity factor revealed no significant differences between grades for either stain. The mean value of the ellipticity factor decreased with increasing histopathologic grade, i.e., the cells had less elliptic nuclei in the more undifferentiated mast cell tumors. The idea of ellipticity, the major/minor axis ratio, is not present in the various descriptions used to classify the degree of malignancy. Thus, when we read “round” in most descriptions, we understand that what is being expressed is the characteristic of regularity of the contour and the presence or absence of indentations and not the extent of ellipticity of the nucleus.
The irregularity of the nuclear contour is better expressed morphometrically by the regularity factor. The grading reports available in the literature show that less differentiated tumors tend to show indentation, lobulations, or nuclear irregularities. 2 , 14 , 24 Regardless of the staining method used for measurement (HE or the panoptic method), the regularity factor did not correlate with tumor grade. Descriptions reported in the literature, based on observations on histologic sections, favor the results obtained with panoptic staining in which the values of the regularity factor increase with tumor differentiation.
The differences in nuclear shape between cytopathology and histopathology, despite using the same staining method (HE), may be explained by the characteristics of fixation and processing of the material. 4 In histopathology, the tissue undergoes countless chemical reactions capable of deforming both the nuclear and cytoplasmic morphology, and cell overlap also occurs. In contrast, the cell density is lower and the chemical influences are fewer in cytopathology.
Therefore, the results obtained in our study regarding the regularity and ellipticity factors corroborated the data obtained by Marchevsky and Erler, 22 who stated that although these parameters do indicate significant irregularities/differences in shape parameters, they are not good indicators when there are small deviations from circularity, a fact that was observed for mast cells.
We did not determine the nucleus/cytoplasm ratio or cytoplasmic measurements because of the difficulty in delimiting the cellular margins with both cytopathology stains. When stained with HE, the cells presented ill-defined contours in contrast to the image background, and rapid panoptic staining caused the stained cytoplasmic granules to be a great obstacle in the delimitation of the cytoplasmic margin. We believe that the manual contour of these cells depends a lot on the ability of the operator, a fact that may increase the variability among users of image analysis programs, which makes the procedure more subjective and, therefore, goes against one of the major objectives of the study.
In conclusion, expressive results were obtained for the different histopathologic grades in terms of parameters such as area, perimeter, and mean diameter. Because grading affects prognosis and the need for ancillary therapy (such as surgery alone or the use of chemotherapy or radiation therapy 23 ), the necessary therapeutic measures could be taken in a more effective manner by using cytopathology and morphometric analysis. However, when comparing the values obtained for each group for the parameters considered, we still observe overlap between them, a fact that may not be an obstacle after the compilation of more complete data.
Considered separately, the results do not permit, as of now, a precise classification of mast cell tumors in terms of prognosis because the data concerning the evolution of each tumor have not yet been analyzed. Further studies are under way in our laboratory to assess morphometry as a prognostic method. We trust that, after the conclusion of these studies, the morphometric differences between grades may permit us to establish “fixed” minimum and maximum values for each parameter investigated in order to classify mast cell tumors in a rapid and precise manner in terms of degree of differentiation, which makes this a method of great interest to the clinician/surgeon and to the animal's owner.
Footnotes
Acknowledgements
We thank Dr. Júlia Maria Matera, Departamento de Cirurgia, FMVZ-USP, for submitting surgical specimens; Dr. Omar Miguel for his assistance with the statistical analysis; and Fundação de Amparo à Pesquisa do Estado de São Paulo for financial support (grants nos. 97/09459-7 and 96/4903-8).
This work is part of the MSc dissertation presented by Ricardo De Francisco Strefezzi to the Departamento de Patologia, Faculdade de Medicina Veterinária e Zootecnia, Universidade de São Paulo.