
Abstract
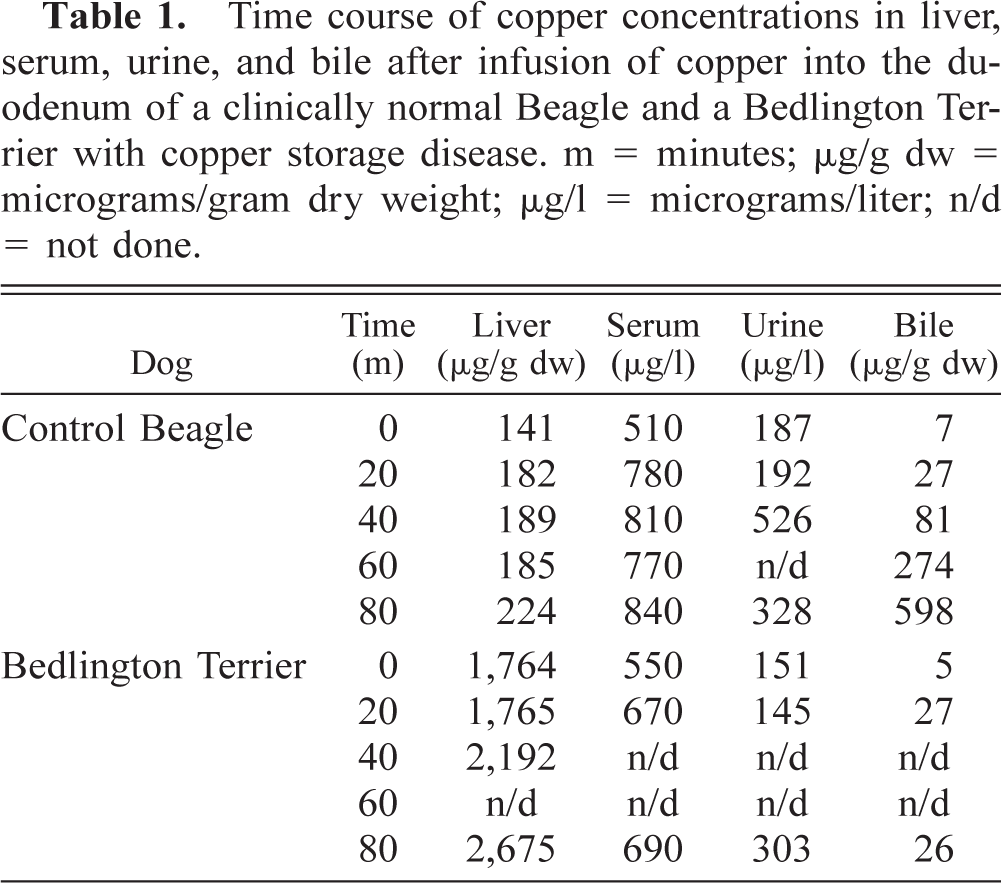
The objectives of this study were to determine the time course of copper (Cu) absorption in the Bedlington Terrier (BT) dog after duodenal infusion of Cu and to determine the onset of Cu accumulation in BT puppies. At 80 minutes after infusion, Cu was present in the bile and liver at 26.1 and 2675 μg/g dry weight (dw), as compared with 598 and 224 μg/g dw, respectively, in the control. In the puppies, the mean liver Cu concentrations were 443 ± 216 μg/g dw as compared with 54 ± 34 μg/g dw in their controls. The BT puppies had large numbers of Cu granules in their hepatic lysosomes, with very few in the bile canaliculi. In contrast, the controls had few granules in their lysosomes and large numbers in their canaliculi. These results suggest that hepatic Cu accumulation occurs rapidly and in utero in the BT.
The pathogenesis of inherited copper storage disease (CSD) in the Bedlington Terrier (BT) dog is localized in the hepatic excretory pathway for copper (Cu),6 and liver failure in these dogs is attributed to the accumulation of Cu. Although this failure to excrete Cu is the underlying mechanism of liver injury in the BT,8 the mechanism of its inheritance, of its excretory failure, or of the storage of Cu remains unknown. A microsatellite marker, CO4107, has been identified9 and used to detect carriers and affected dogs,3,5 but direct examination of liver tissue remains a useful indicator of hepatic Cu storage.2 Liver Cu analysis with light microscopic and electronmicrographic identification of Cu in liver tissue continues to be used. The present study was undertaken to determine the time course of Cu accumulation and excretion after duodenal Cu infusion and to determine liver Cu concentrations at birth using chemical, and light and electron microscopic methods.
Clinically healthy adult Beagle dogs were used as controls for the Cu absorption studies. Under isoflurane anesthesia, a laparotomy was performed and a liver biopsy taken as well as blood, urine, and bile samples for values at time zero. Then 5 ml of a 0.5% cupric acetate solution was injected into the duodenum through a balloon catheter. Samples were then taken at 20-minute intervals for 80 minutes. Cu was visualized in the biopsied specimens by light and electron microscopy and quantified by atomic absorption spectrophotometry (AAS).7 Serum, bile, and urine Cu were also measured by AAS. For the puppy studies, two BT with CSD were mated and their puppies delivered by Cesarean section on their estimated delivery dates. Similarly, two healthy Beagles were mated and their puppies were delivered, which were used as controls. All dogs, except the adult BT, were judged to be free of clinical disease by physical examinations, complete blood counts, biochemical screens, and urinalyses that were performed by standard methods. All dogs were fed a dry, maintenance diet, which contained between 15.2 and 26.1 mg Cu/kg dry matter (Hills-Colgate Palmve, St. Louis, MO, USA).
Biopsy specimens were 1.2 mm in diameter and 10 mm in length. Semi-thin (2–5 μm) sections were cut for light microscopic studies, processed by routine methods, and stained with hematoxylin and eosin (HE). For histochemical detection of Cu, the sections were stained with rhodanine and with Uzman's stain. Ultrathin sections (100 nm) were cut and examined for Cu with and without staining using a modified Timm's method4 and a transmission electron microscope (JEOL JEM-2000-FX, JEOL, Tokyo, Japan).
The time course of Cu concentrations in the liver, serum, urine, and bile of the BT and control Beagle after Cu infusion is given in Table 1. Distribution of Cu in the hepatocytes and in their organelles is given in Table 2. Under light microscopy with HE staining, no liver abnormalities were noted in the Beagle during the experimental period. Under rhodanine and Uzman staining, no Cu granules were detected in the liver sections. Cu concentrations in the liver, serum, and urine increased by approximately 50–100% during this time. The Cu concentration in the bile of the Beagle, however, increased almost 10-fold. Cu was observed almost exclusively in the cytoplasm of the hepatocytes and in the bile canaliculi under electron microscopy (Table 2, Figs. 1, 2).
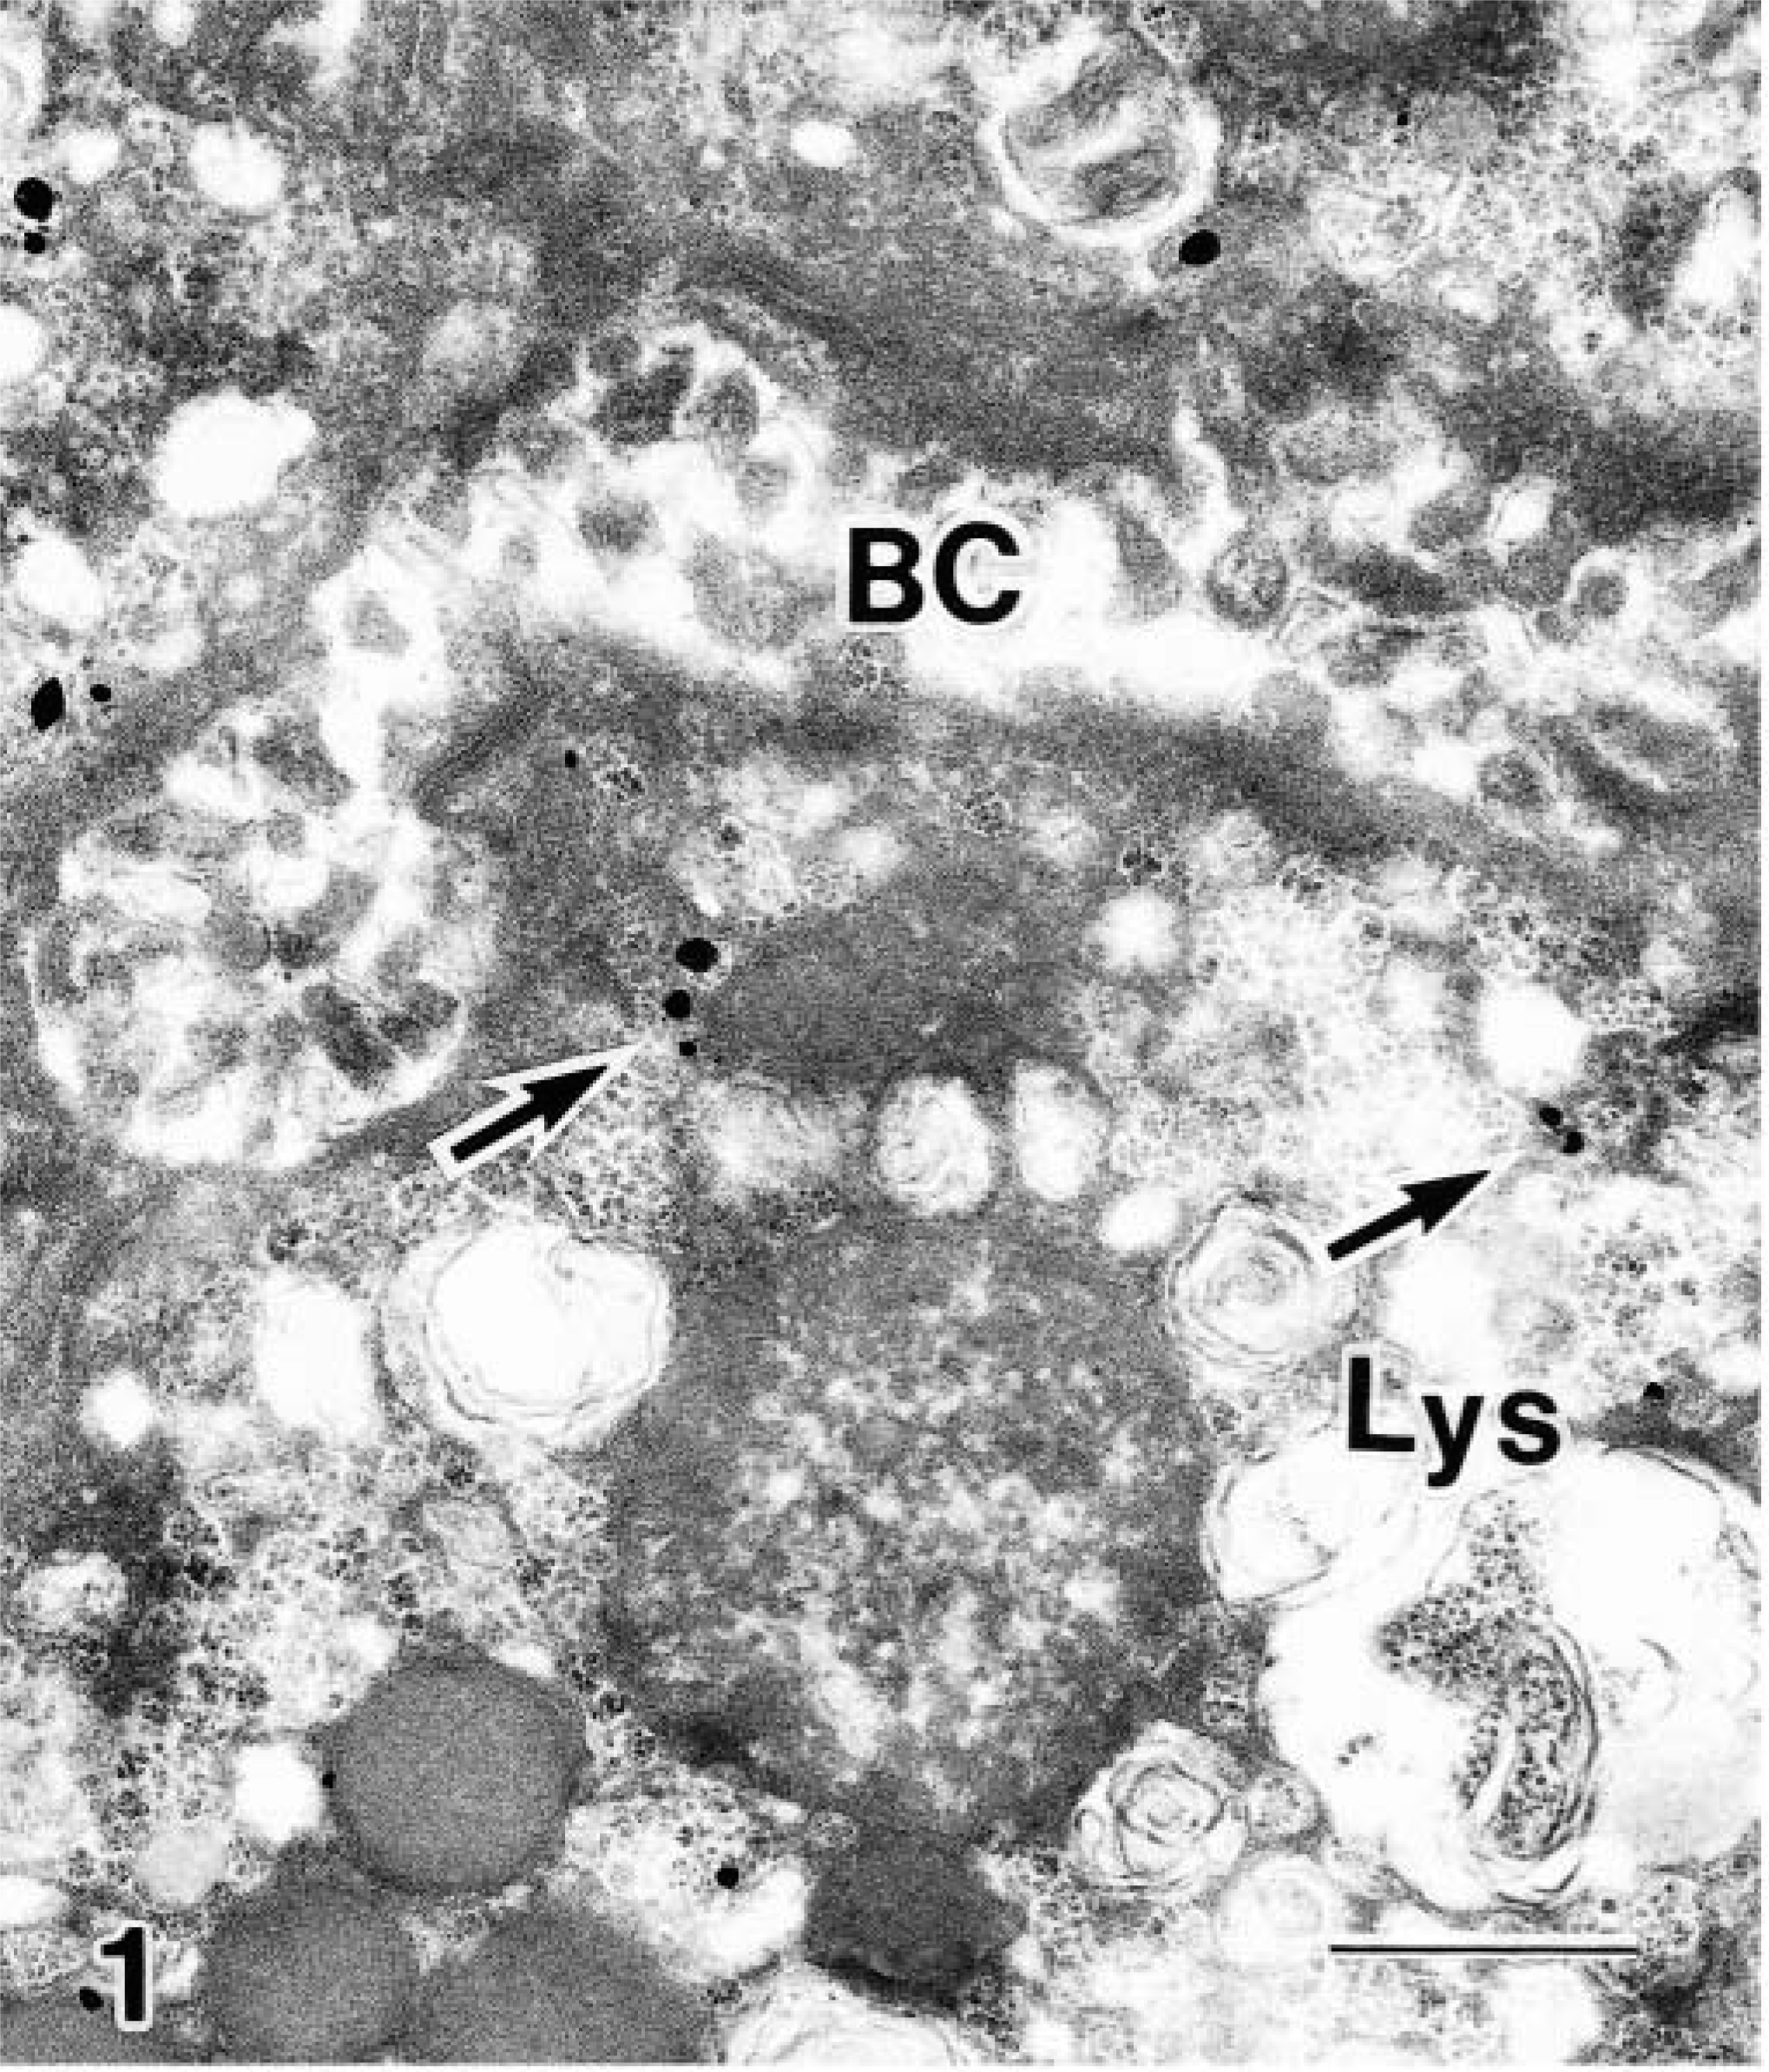
Transmission electron micrograph. Liver; control Beagle. Cu localization before Cu infusion into the duodenum. Small numbers of Cu granules are in the cytoplasm (arrows). Modified Timm's staining in all micrographs. Bar = 0.5 μm. Abbreviations in all figures are BC = bile canaliculus, Lys = lysosome, End = endosome.
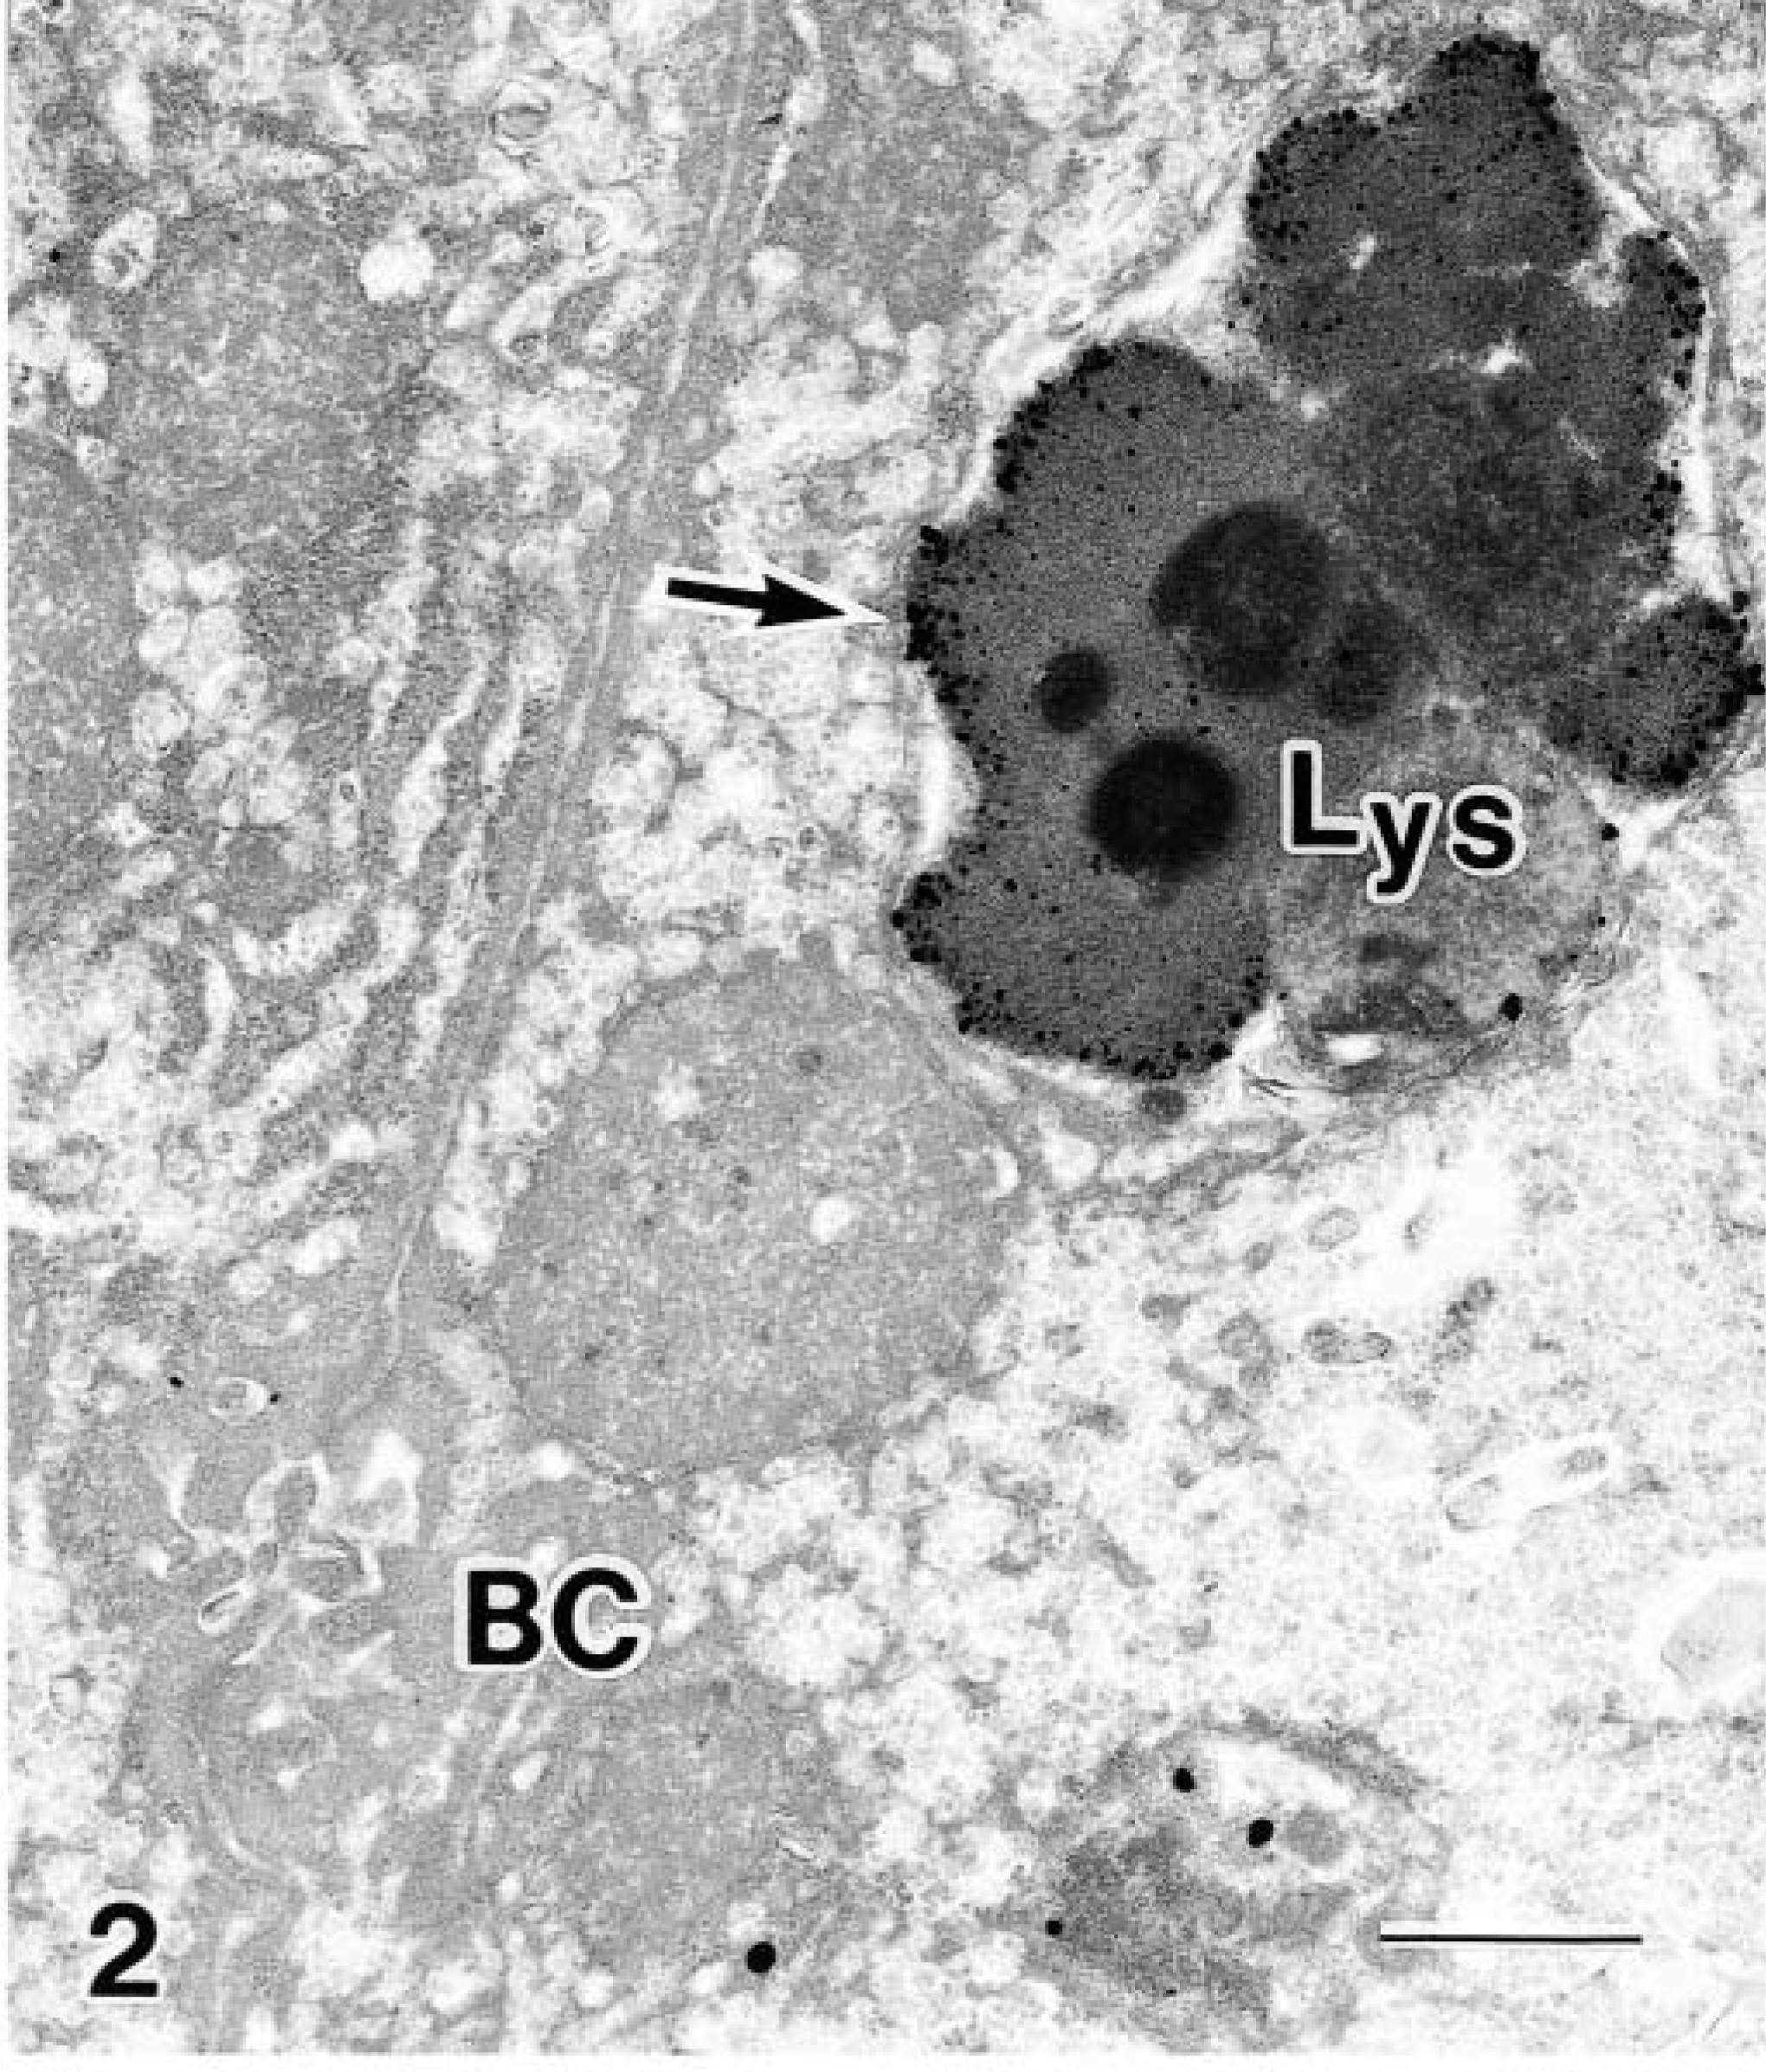
Transmission electron micrograph. Liver; BT. Cu localization before Cu infusion into the duodenum. Dense aggregates of Cu granules are in the lysosomes only (arrow). Bar = 0.5 μm.
Time course of copper concentrations in liver, serum, urine, and bile after infusion of copper into the duodenum of a clinically normal Beagle and a Bedlington Terrier with copper storage disease. m = minutes; μg/g dw = micrograms/gram dry weight; μg/l = micrograms/liter; n/d = not done.
Time course of electronmicrographically evaluated hepatocellular copper distributions after infusion of copper into the duodenum of a clinically normal Beagle and a Bedlington Terrier with copper storage disease. m = minutes; Nuc = nucleus; cyt = cytoplasm; Lys = lysosome; Mit = mitochondria; GA = Golgi apparatus; ER = endoplasmic reticulum; BC = bile canaliculus; DS = space of Disse. – = no evidence of copper granules seen; +, ++, +++ = small, medium, and large number of copper granules seen.
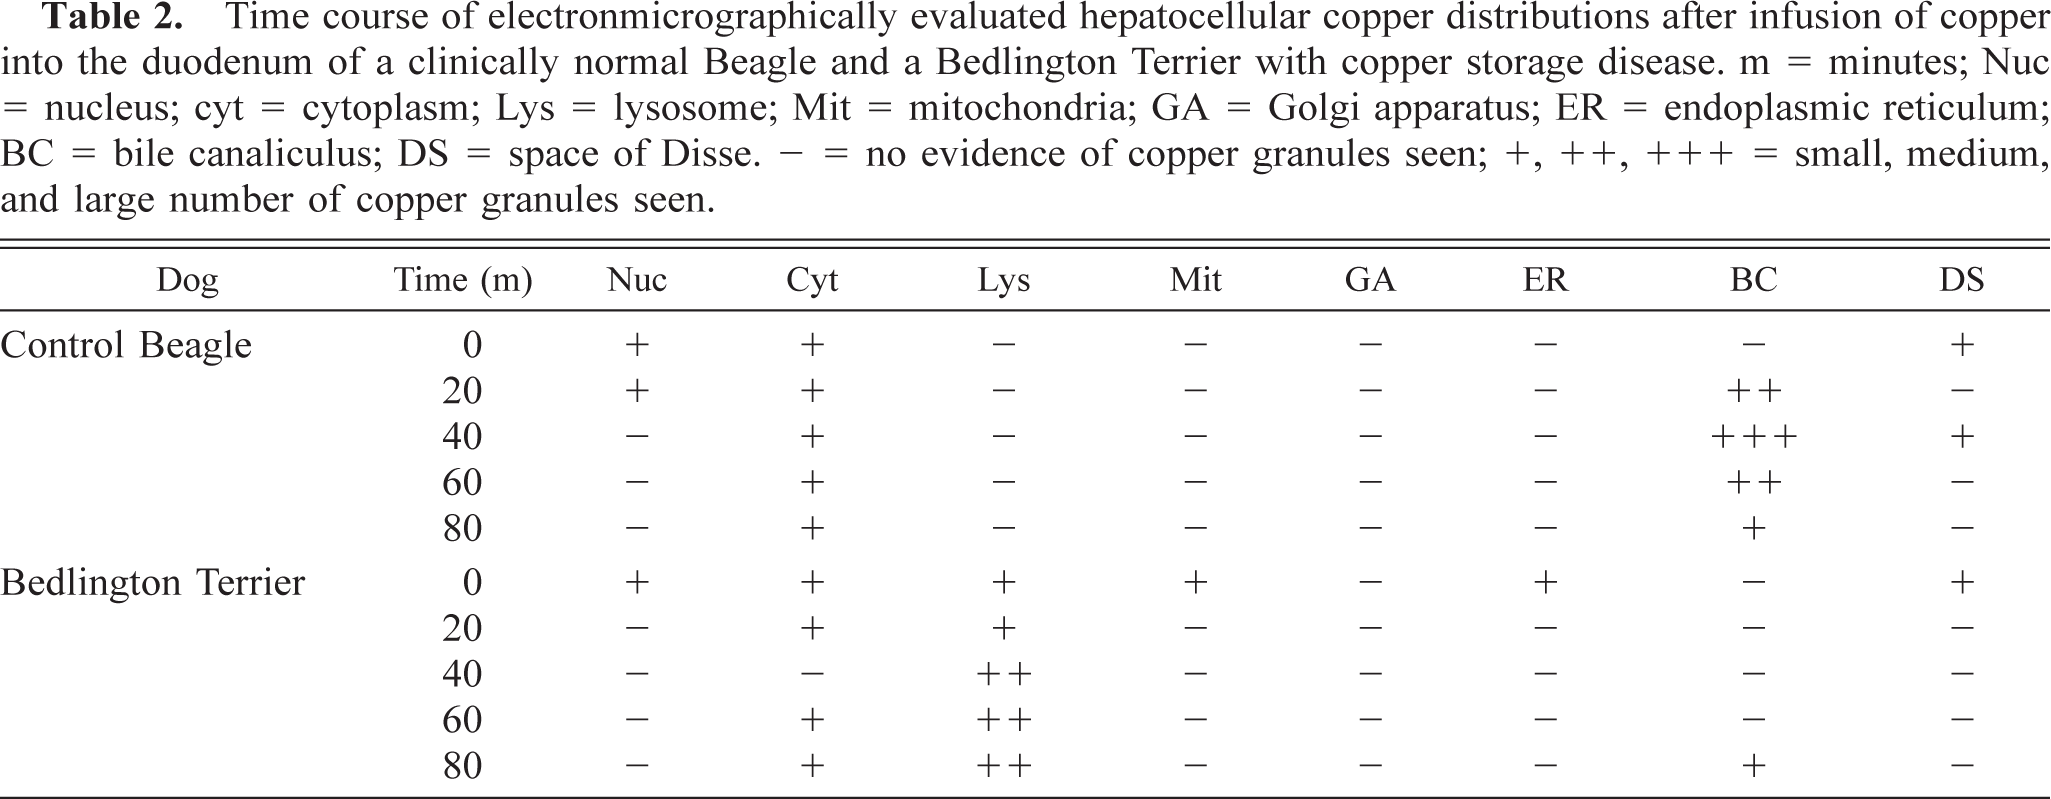
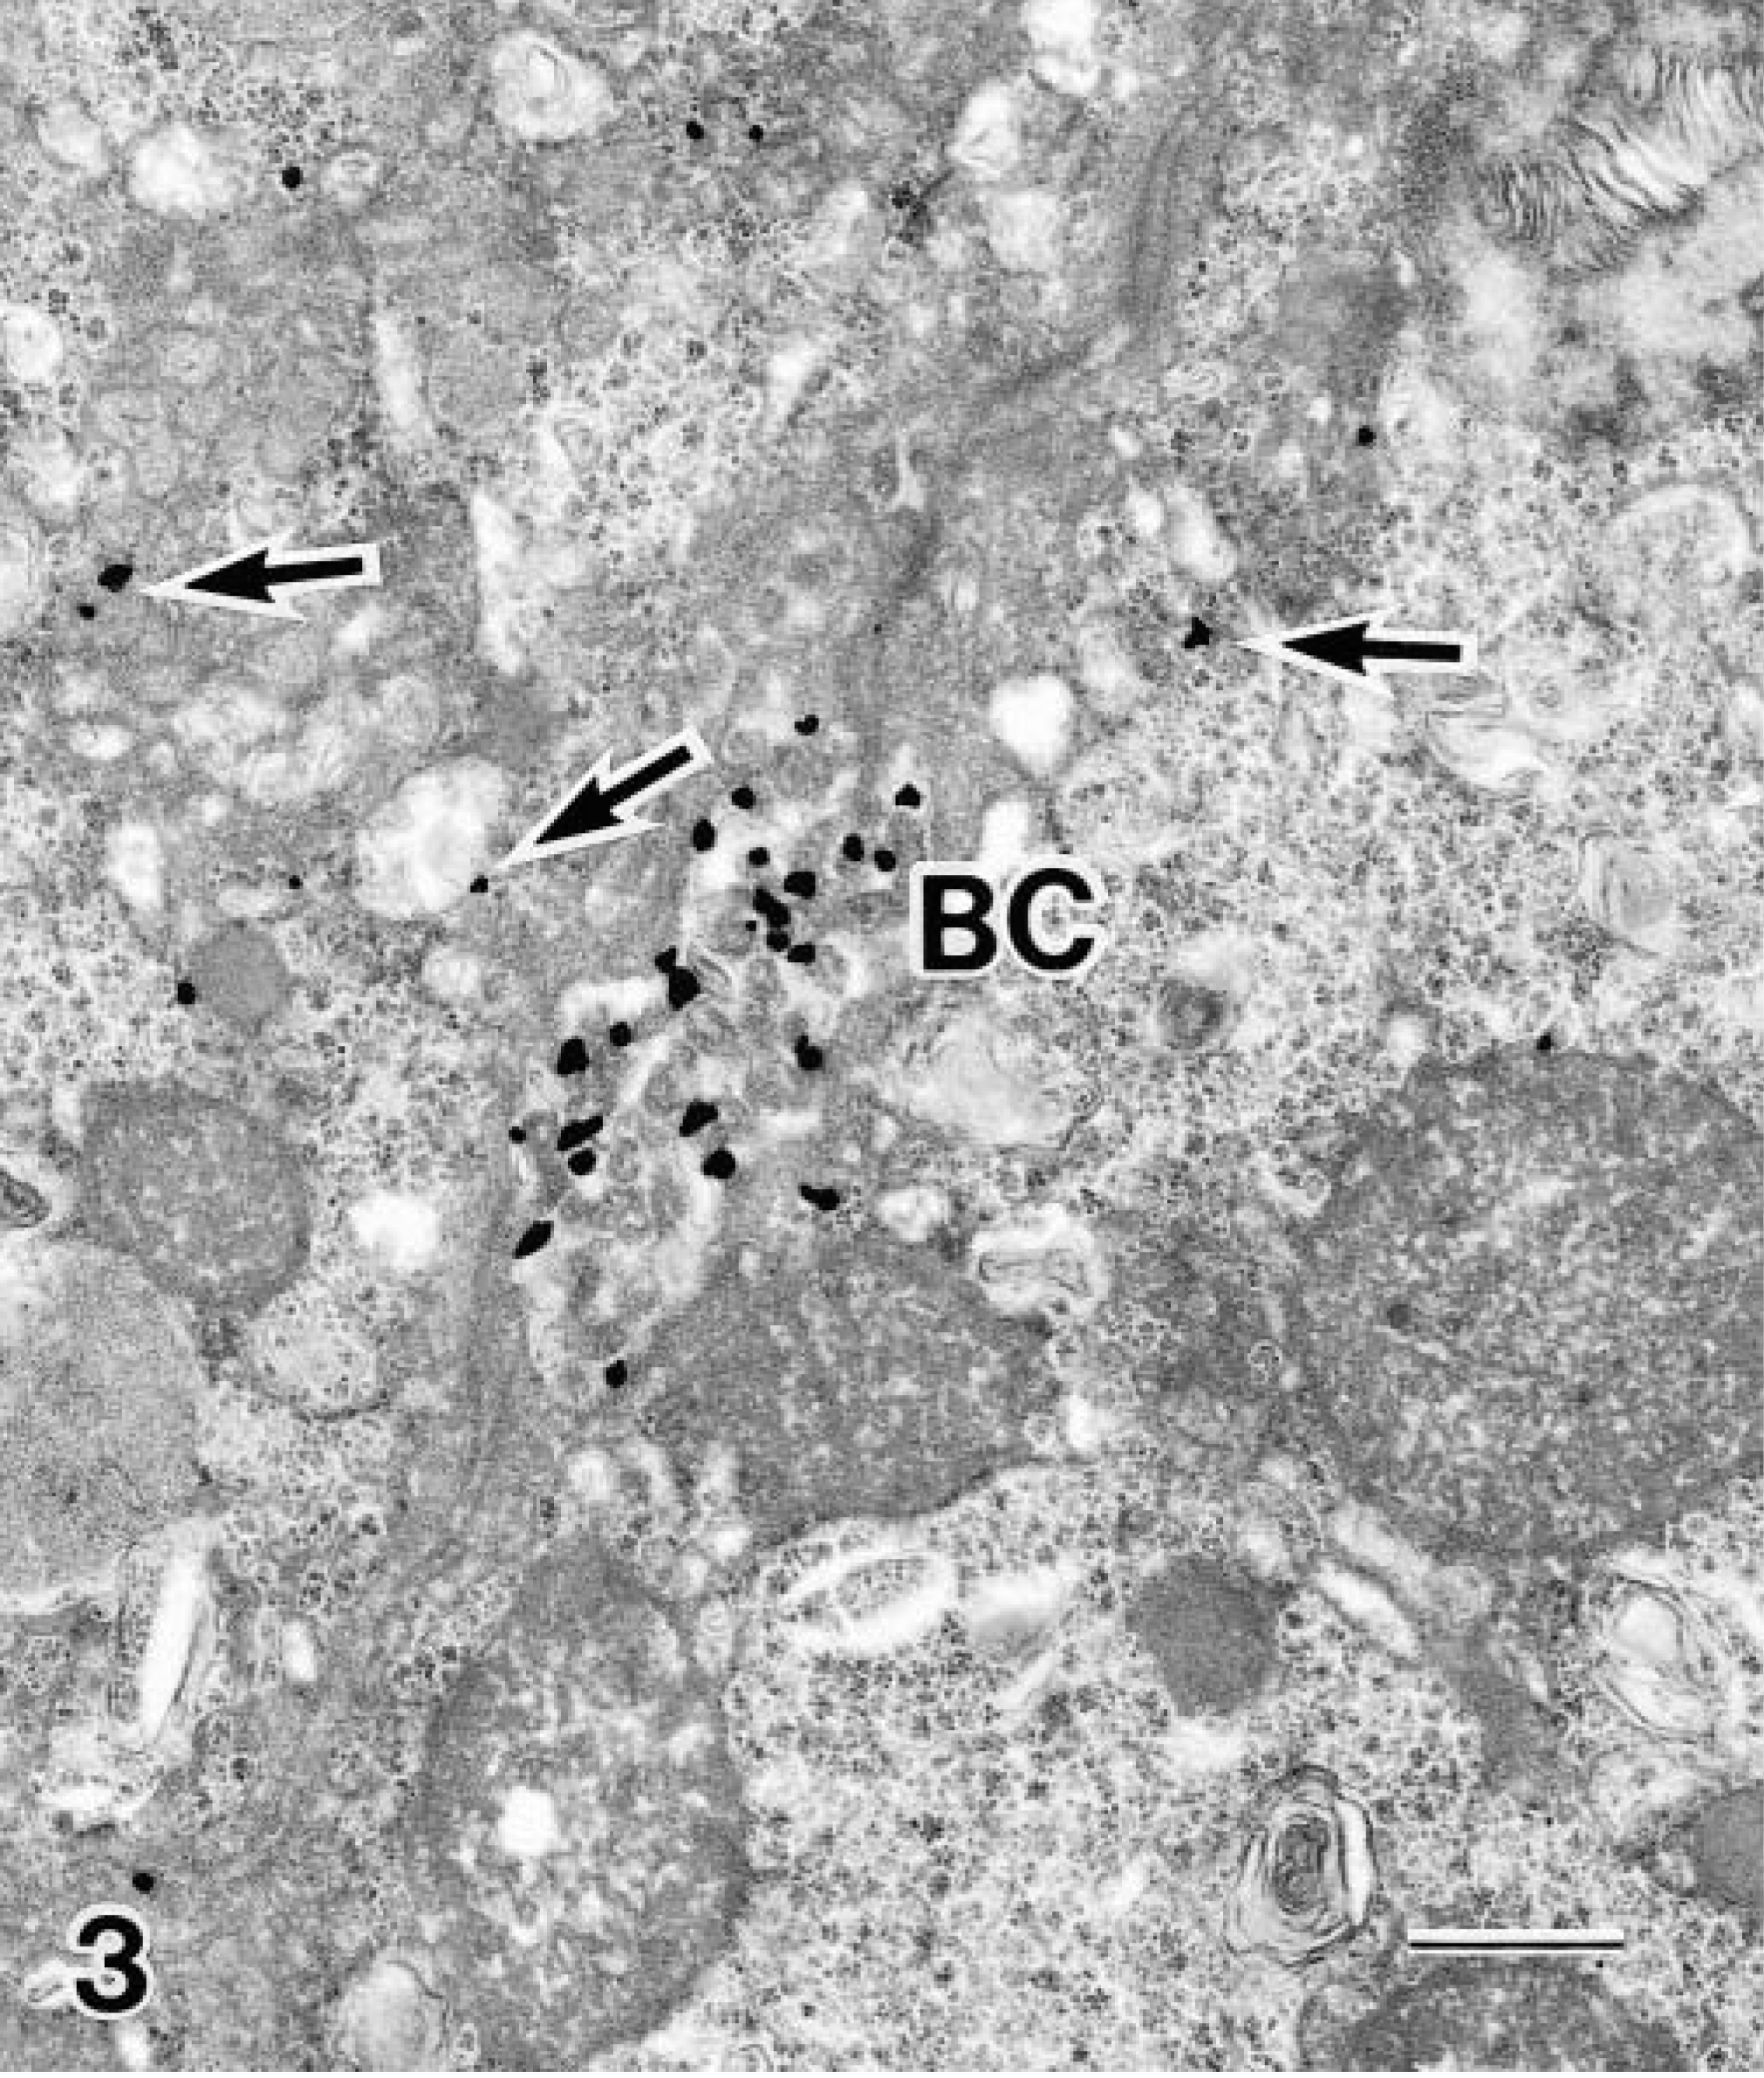
Under light microscopy with HE staining, each liver sample of the BT had focal necrosis with lymphocytic, plasmacytic, and macrophage infiltration. Under rhodanine and Uzman staining, Cu granules were detected in each section (Figs. 3, 4). Whereas the initial serum and urine Cu of the BT approximated those of the Beagle, the initial liver Cu of the BT was 10-fold greater than in the control. The proportional increase in liver Cu at 80 minutes was approximately the same as in the control, i.e., a 50% increase (Table 1). There was a marked increase in bile Cu in the Beagle as compared with the very small increase in bile Cu in the BT. Under electron microscopy, Cu was observed primarily in the hepatocellular lysosomes of the BT at 80 minutes (Table 2, Figs. 3, 4). These diametrically opposed findings in the liver and bile between the BT and the control provide evidence of a rapid uptake and excretion of infused Cu by the control and a failure to excrete and excessive storage of Cu by the BT. The precise mechanism of this excretory failure and the trapping of Cu in the lysosomes remain unknown. A possible mechanism for the excretory failure may be that as in Wilson's disease or in the toxic milk mouse model, there is an absence of the transmembrane Cu transport protein, ATPase 7B,1 although a similar transporter defect has not been identified in the BT.
Transmission electron micrograph. Liver; control Beagle. Cu localization at 80 minutes after Cu infusion into the duodenum. Large numbers of Cu granules are in the BC, with few in the cytoplasm (arrows). Bar = 0.5 μm.
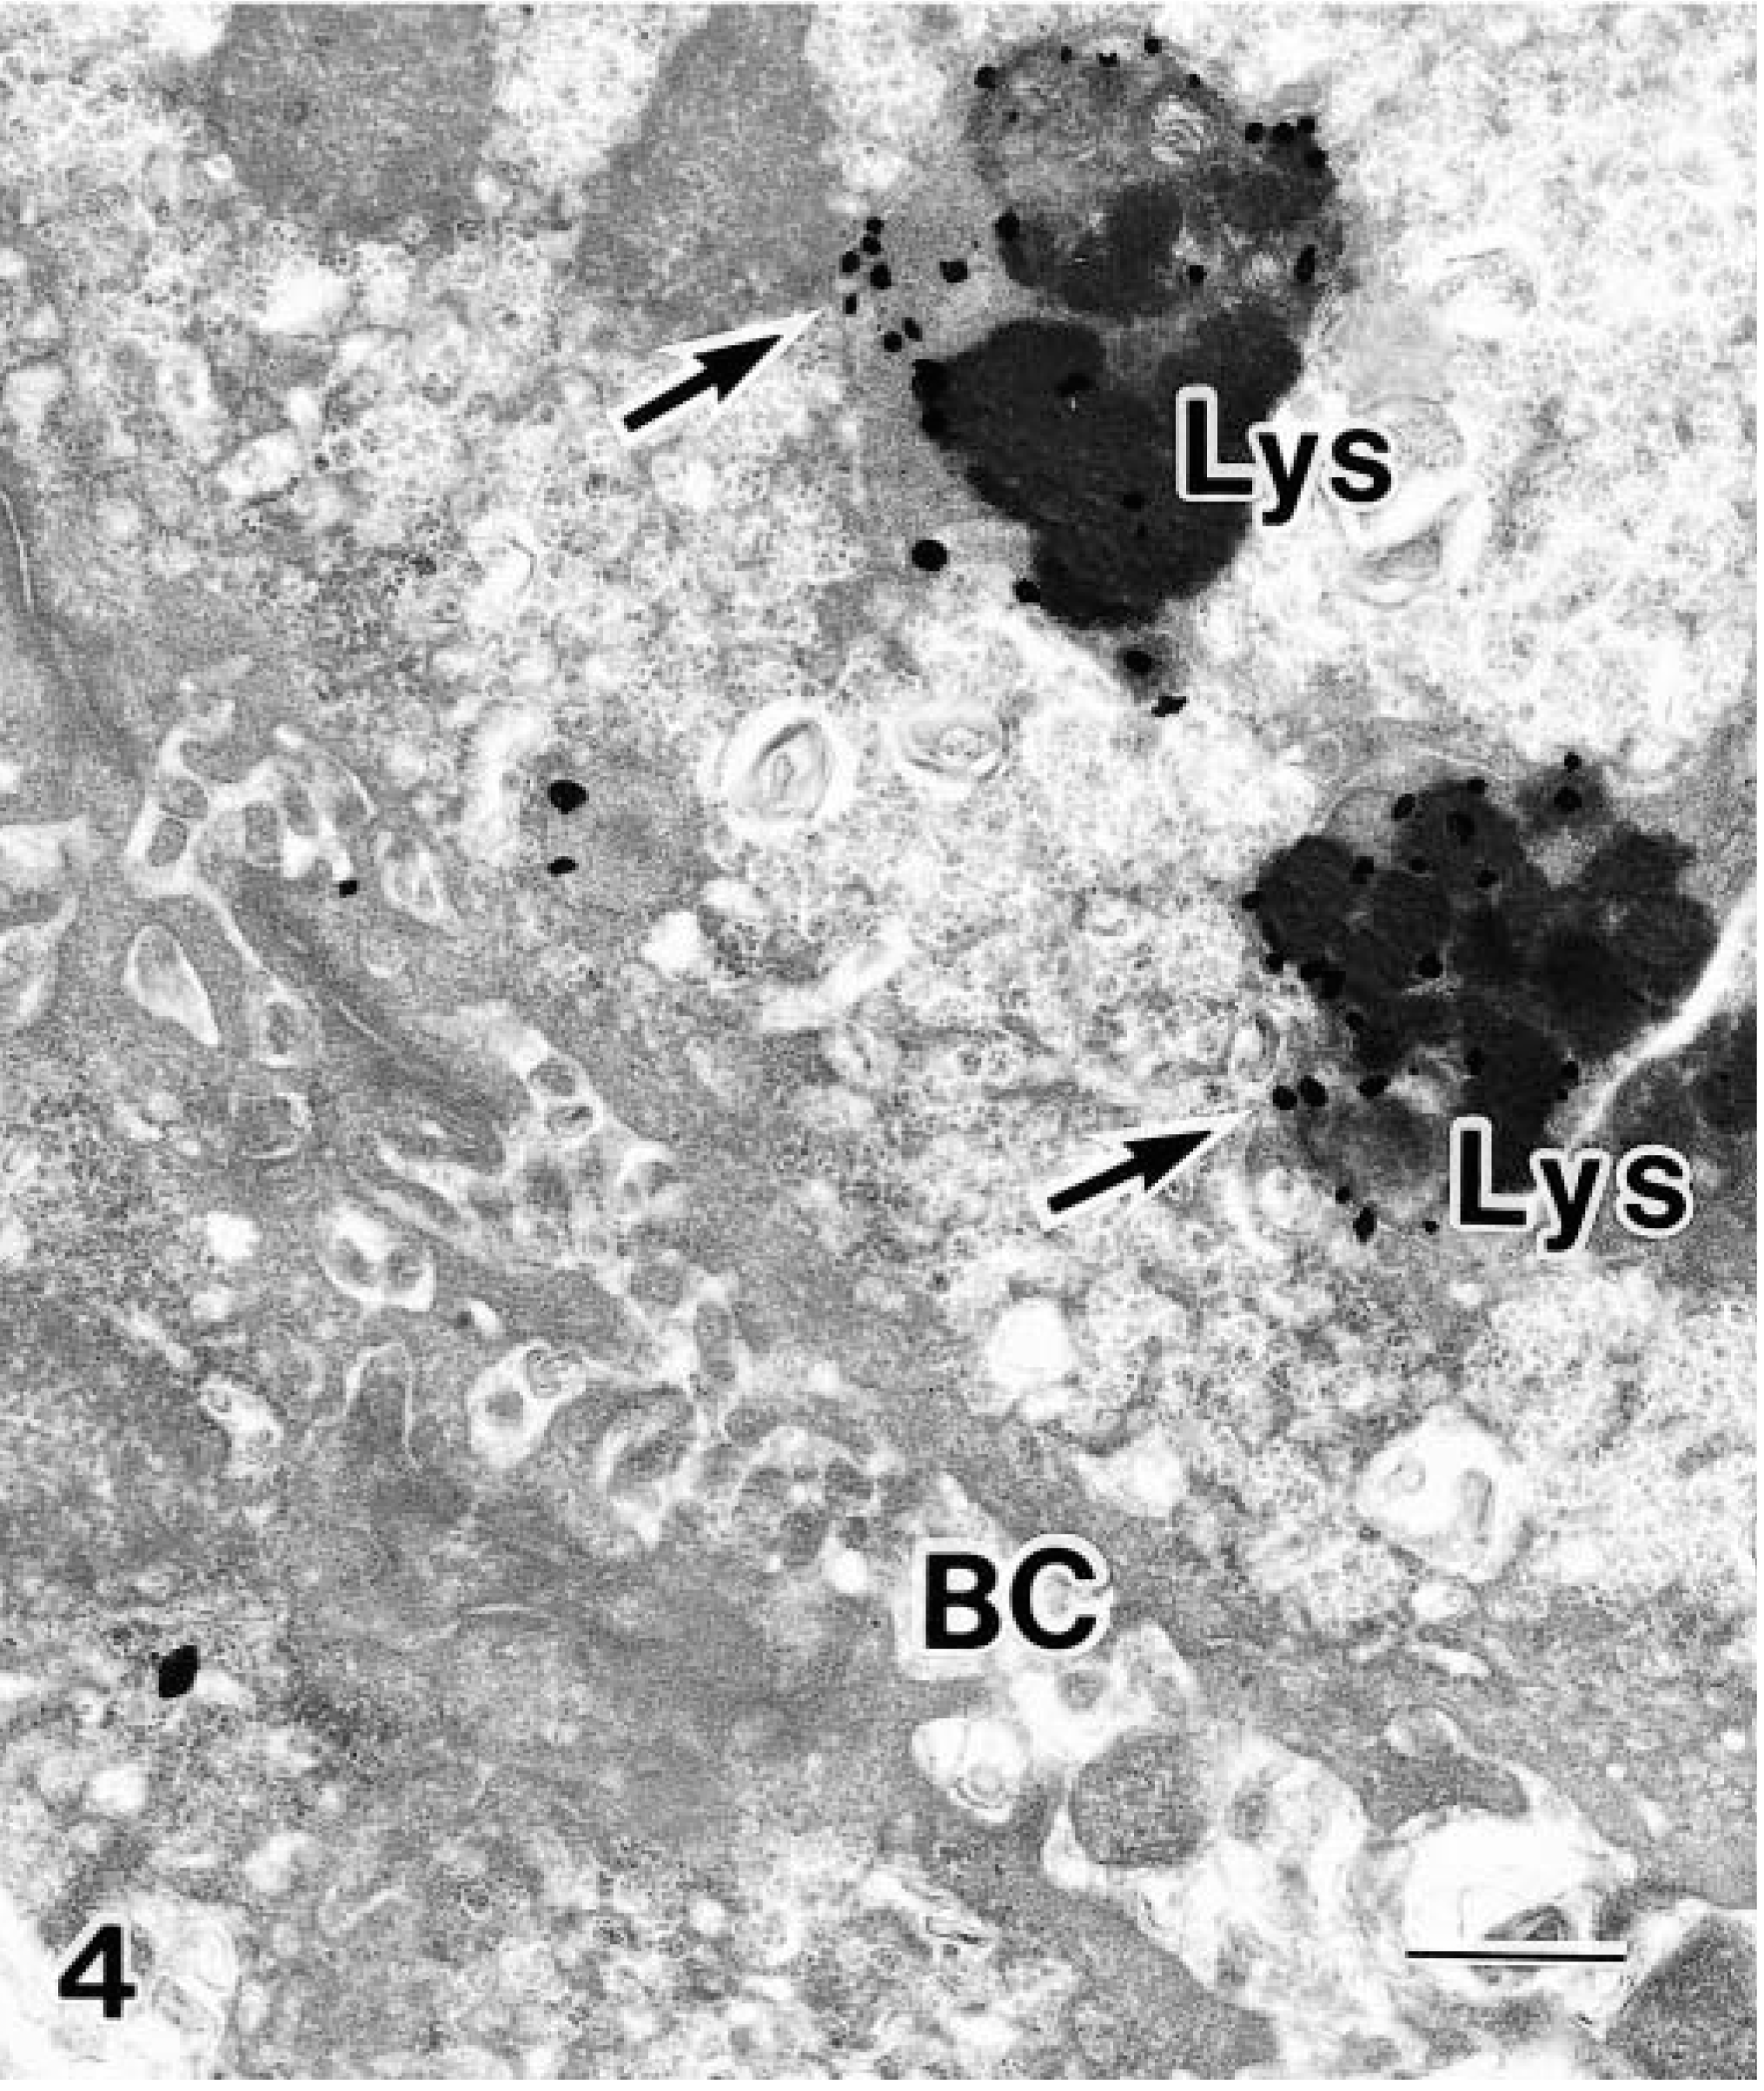
Transmission electron micrograph. Liver; BT. Cu localization at 80 minutes after Cu infusion into the duodenum. Large numbers of Cu granules are in the Lys (arrows), with none in the BC. Bar = 0.5 μm.
For the Cu onset studies, the results of liver Cu in each of the dams, the BT sire, and in their 3 puppies at delivery are given in Table 3. In the BT puppies, the mean liver Cu concentration was 443 ± 216 µg/g dry weight (dw), which was significantly (P ≤ 0.05) higher than the 54 ± 34 µg/g dw in their controls. Under electron microscopy, Cu granules were localized primarily in the hepatocellular lysosomes (Fig. 6) of the BT puppies in contrast to the controls (Fig. 5). These results indicate that excessive accumulation of Cu in the lysosomes of the BT is evident at birth even though a number of studies imply that the disease is undetectable until later in life. These results further suggest that the onset of liver Cu accumulation in the affected BT begins in utero.
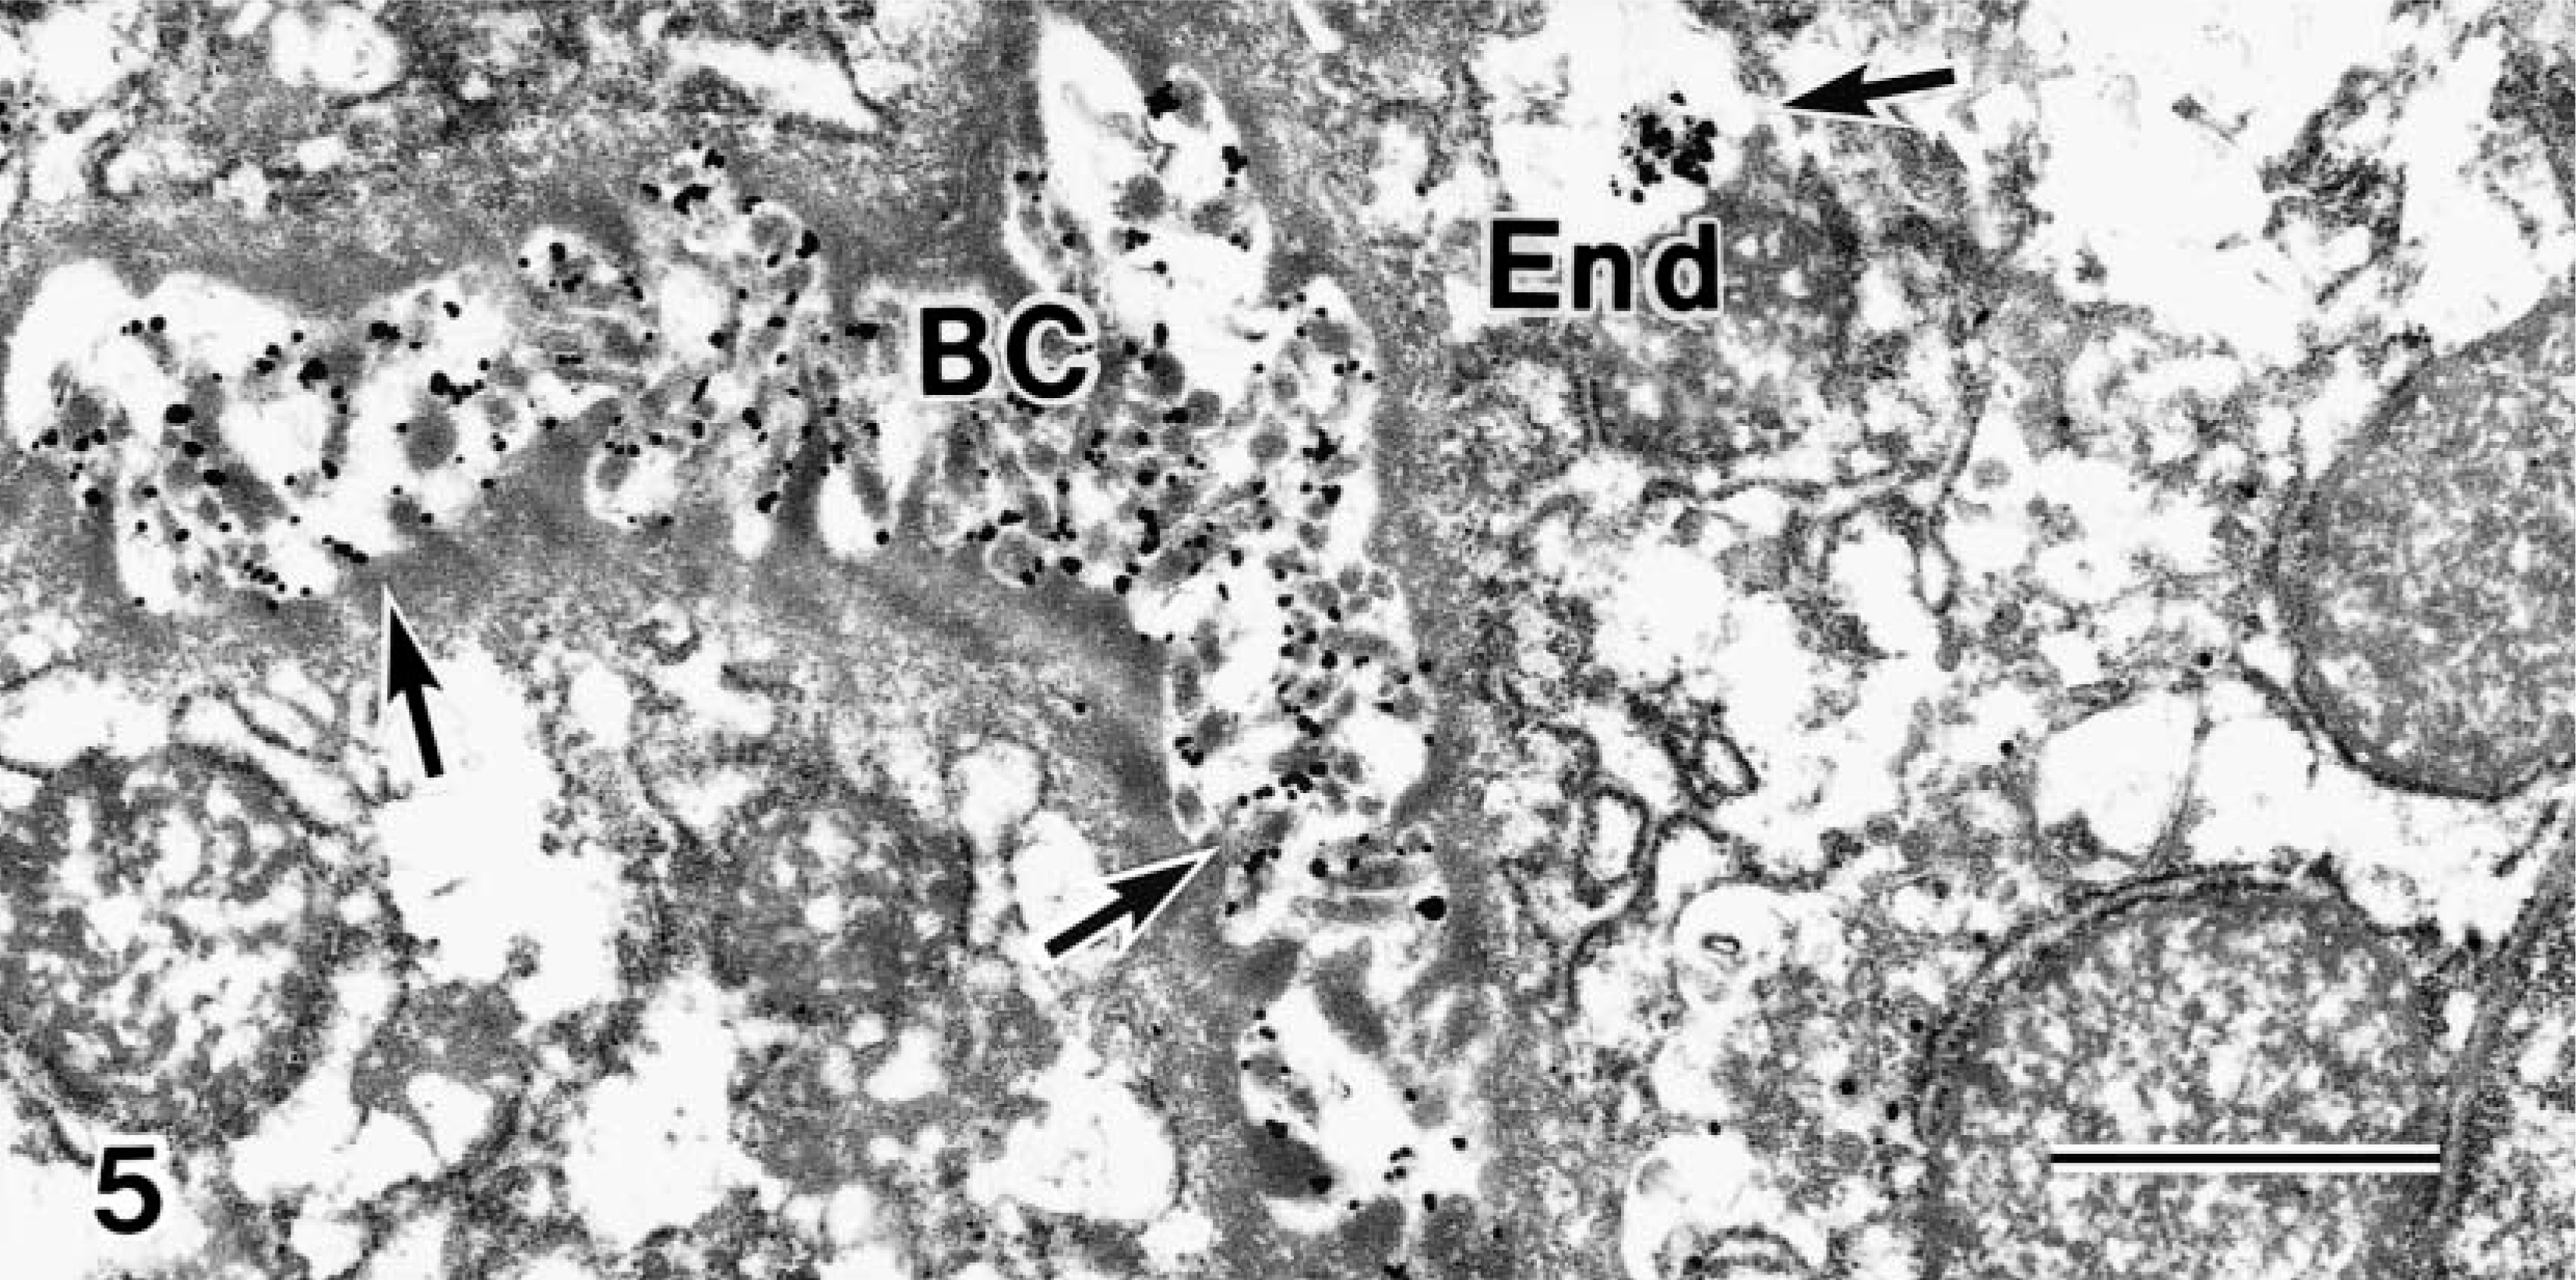
Transmission electron micrograph. Liver; Beagle puppy at delivery. Very few Cu granules are in the End (arrows). Large numbers of Cu granules are in the BC, and very few granules are in the cytoplasm. Bar = 1 μm.
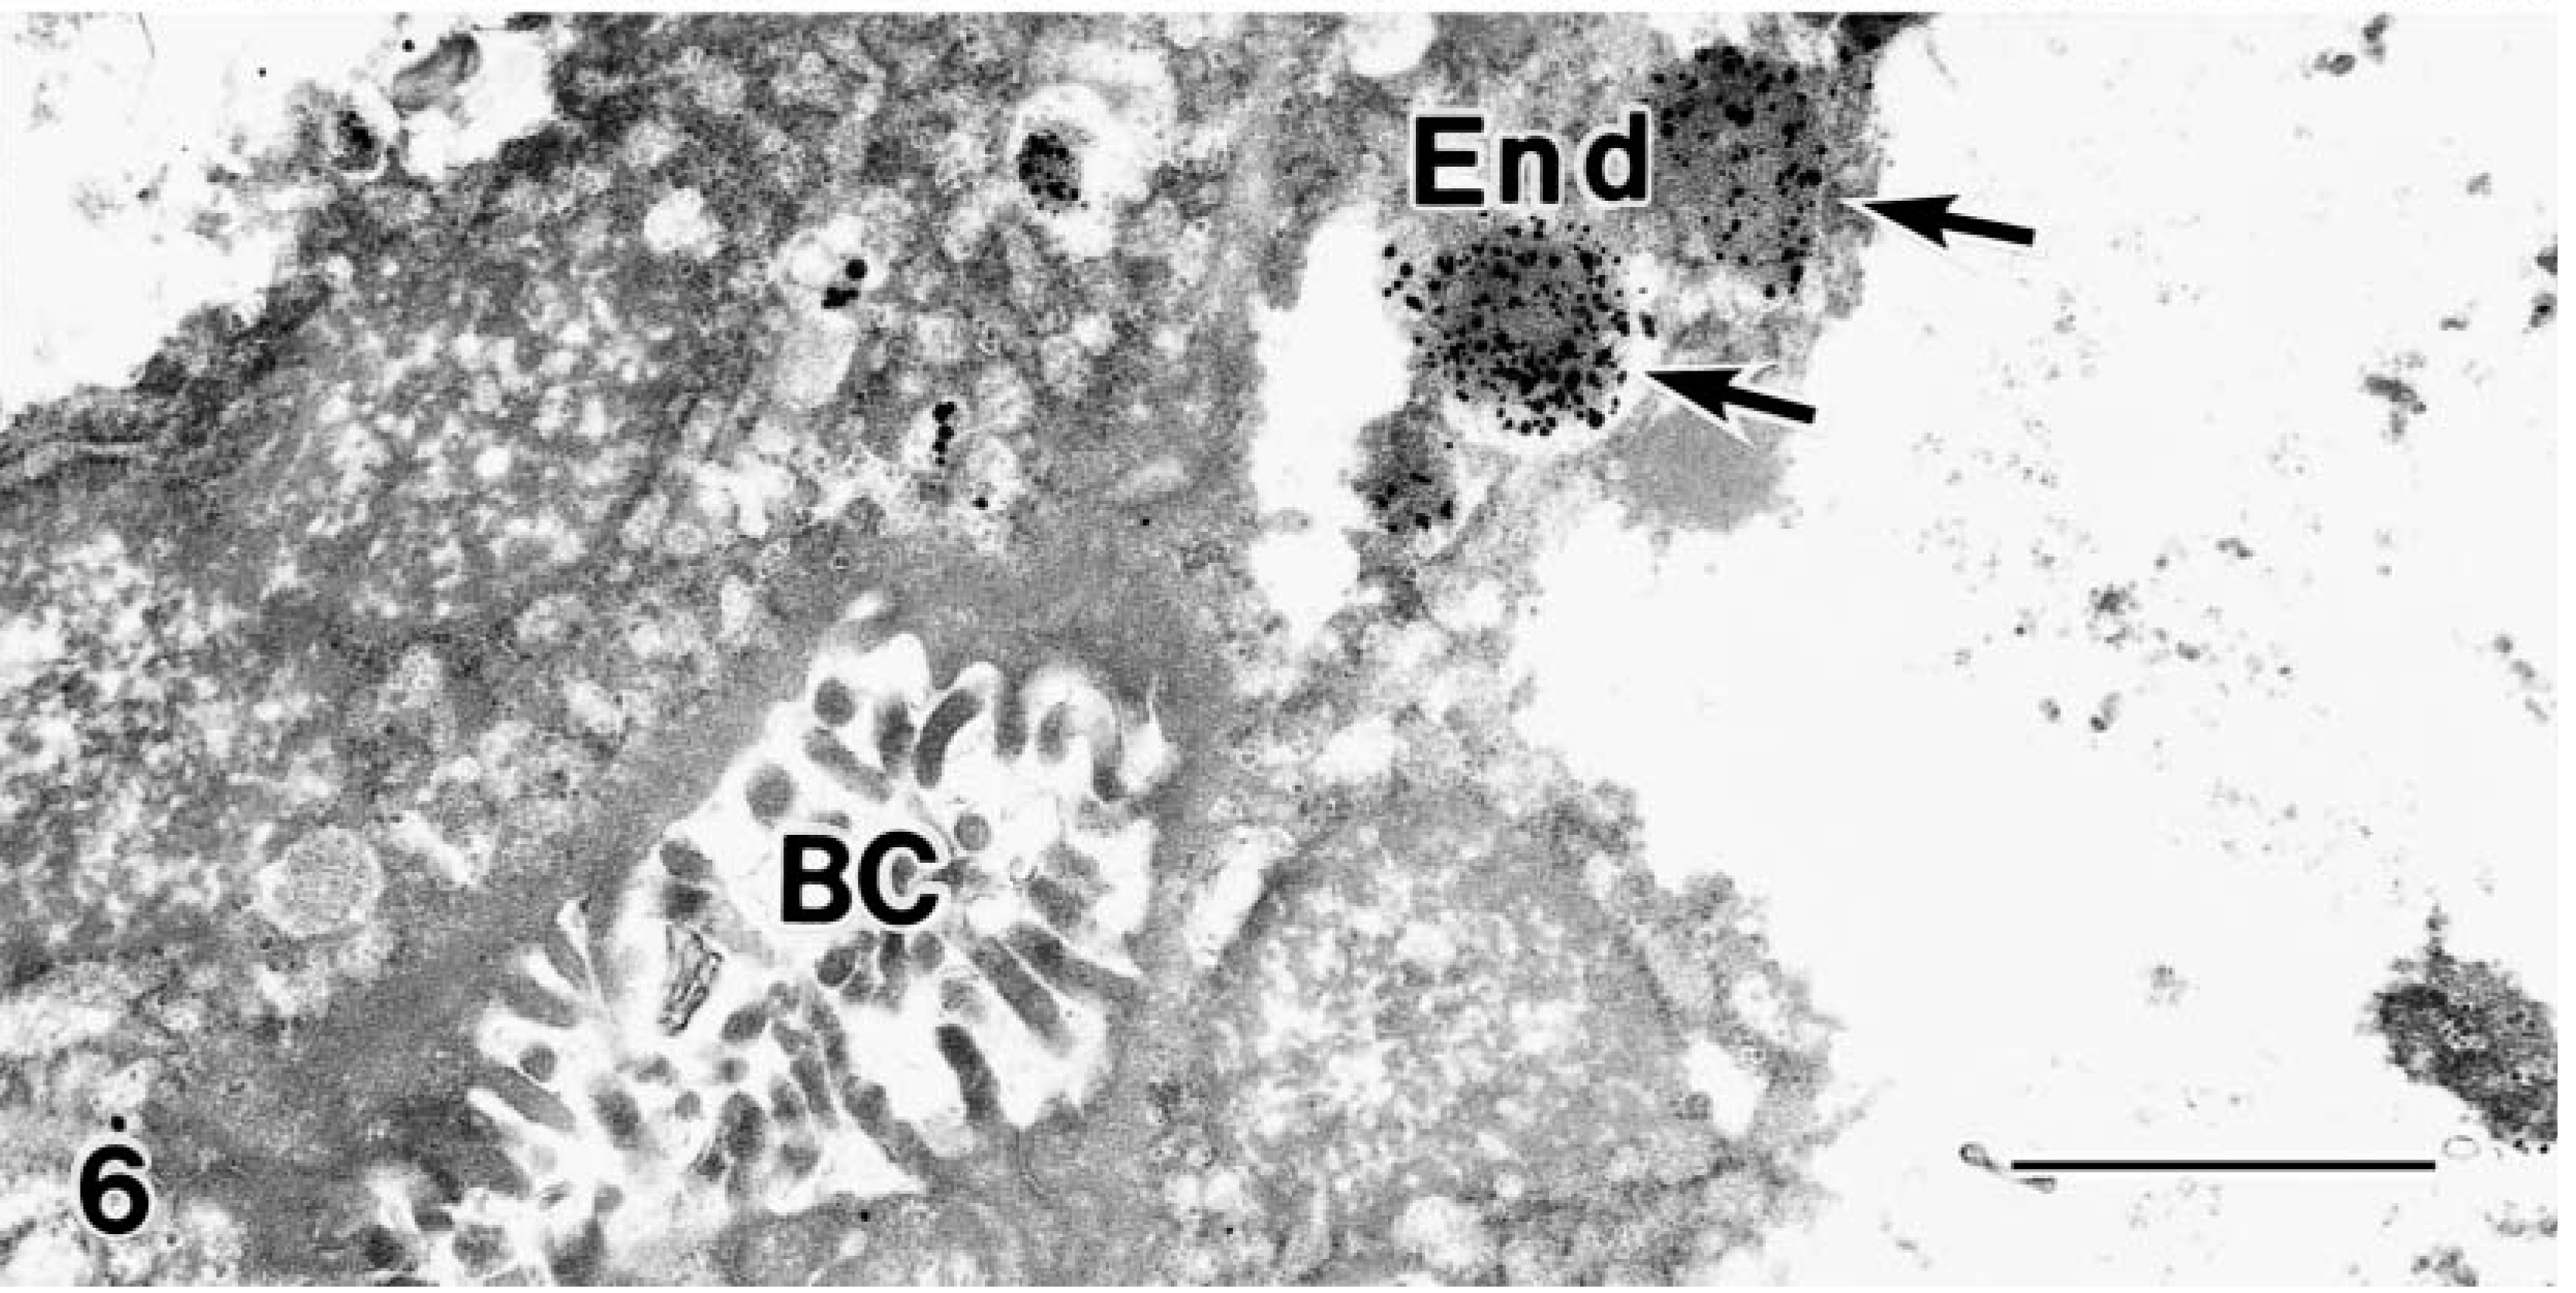
Transmission electron micrograph. Liver; BT puppy at delivery. Large numbers of Cu granules are in the End (arrows), and very few granules are in the cytoplasm and BC. Bar = 1 μm.
Liver copper concentrations of a control Beagle pair and a Bedlington Terrier pair and their puppies at term in μg/g dw (micrograms/grams dry weight).
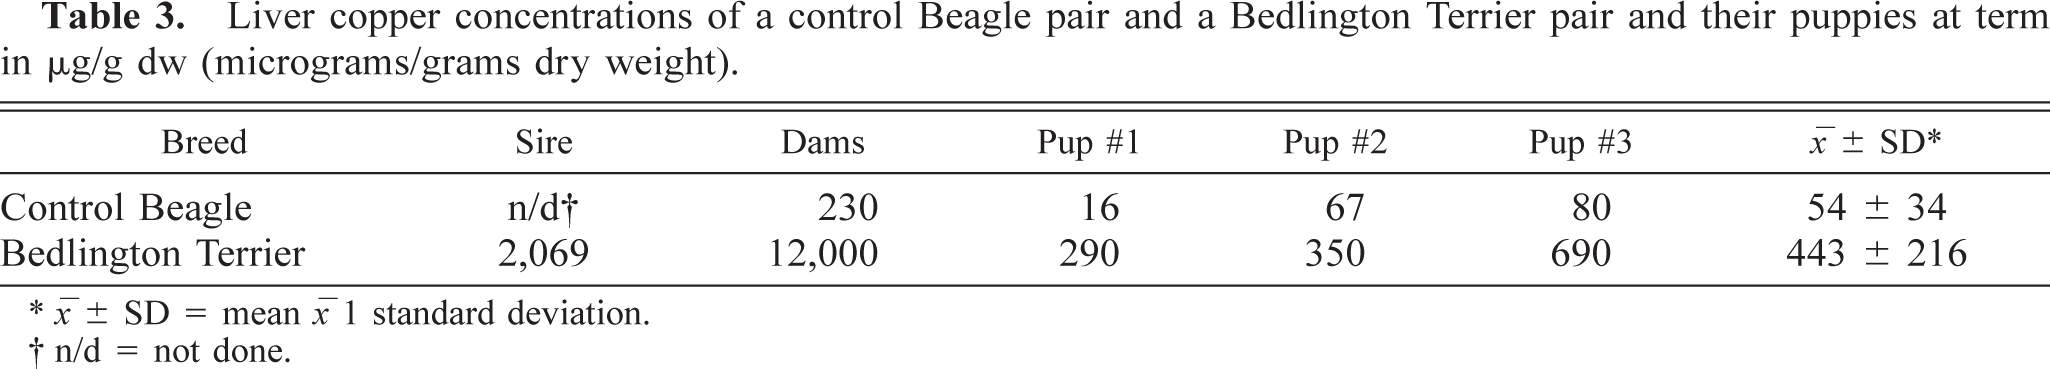
∗ x ± SD = mean x 1 standard deviation.
† n/d = not done.
Footnotes
Acknowledgements
We thank Ms. Hiromi Ohashi and Ms. Hiromi Yodo for their excellent technical assistance. We also thank the Ibaraki Environmental Research Center, Ibaraki, Japan, for the AAS analysis of copper.