
Abstract
Polymerase chain reaction (PCR)-based denaturation gradient gel electrophoresis (DGGE) is currently being used for characterizing the composition of the gut microbiota (GM) of mice in order to better control the study variation arising from the GM. At present, faeces are commonly sampled from live animals, while caecum is most commonly sampled from terminated animals. However, there is no knowledge whether the composition at the one site is representative for the other. In this study C57BL/6 mice were observed from the age of four weeks until the age of 10 weeks. Faeces were sampled weekly. Caecum was sampled surgically under anaesthesia and with subsequent ampicillin treatment at the age of six weeks and again after euthanasia at the age of 10 weeks. Faecal and caecal microbiota profiles were determined using DGGE and subjected to subsequent cluster analysis. The mice subjected to surgical caecal sampling clustered separately for two weeks after termination of antibiotics after which they again clustered with the non-surgically sampled mice. Faecal and caecal profiles clustered separately at the age of six weeks, but not at the age of 10 weeks. There were no correlations between faecal or caecal profiles at six or 10 weeks of age, respectively. It is concluded that faecal and caecal microbiota profiles are not representative of each other in mice. Therefore, it is recommendable in studies to sample from several sites specifically decided in relation to the specific model of a study.
To achieve a low degree of uncontrolled variation and thereby minimize group sizes in animal experiments a high inter-individual similarity of the animals may be crucial. The composition of the gut microbiota (GM) is known to have essential impact on rodent models for various metabolic and inflammatory diseases. 1,2 It is therefore of interest to monitor the inter-individual similarity of the GM of rodents in studies of inflammatory and metabolic diseases. Only 10–20% of the bacterial species can be cultivated by classical techniques; 3–6 hence PCR followed by denaturation gradient gel electrophoresis (DGGE), for example, is one of the methods applied nowadays for this purpose. 7–10
An essential question is which part of the gut to sample for monitoring, and when to do it. Faecal samples are easily accessible, but it is well known that the GM changes as the gut content migrates through the gut. 11 Lymphoid tissue is mostly present in the small intestine, so for diseases under influence from the stimulation of microbial associated molecular patterns on Toll-like receptors, for example, the small intestine microbiota is most relevant, while for other diseases such as colitis, for example, the large intestine microbiota seems more relevant. Low-grade systemic inflammation relevant for example type 2 diabetes and atherosclerosis may be due to uptake of bacterial lipopolysaccharides (LPS), 12,13 which can take place through the entire gut and the entire life, 14 while for some diseases, such as type 1 diabetes, the events leading to disease take place early in life and are primarily related to the lymphoid tissues in the small intestine. 15 Caecal samples have routinely been preferred postmortem, because the microbial diversity, the number of bacteria and the content volume are all high, 16,17 which for practical reasons is essential in a mouse.
In case GM characterization is to be used to monitor and decrease inter-individual variation in mouse studies it is necessary to know whether the easily accessible faecal sample is actually representative of the GM composition in the more proximal caecum. 18 It is not realistic that anything other than faeces will find its place for current GM monitoring of live mice in experiments, and therefore caecal samples are only optional at study termination, which also makes them inapplicable for animal selection and stratification prior to a study.
The aim of this study was therefore to elucidate the correlation between DGGE based faceal and caecal GM profiles.
Materials and methods
The study was approved by the Animal Experimentation Committee under the Danish Ministry of Justice according to the principles of the EU directive EU 86/609.
Twenty-four female C57/BL6BomTac mice (Taconic, Ll. Skensved, Denmark) (∼4 weeks of age) were, after one week of acclimatization, randomly assigned to one of two groups of 12, housed with four animals per cage (Makrolon type 3, Tecniplast/Scanbur Ltd, Karlslunde, Denmark) and weighed weekly. Bedding was aspen (Tapvei, Kortteinen, Finland) and nesting materials included a cardboard house, Enviro-dri, chewing block and filt pillow (all items from Brogaarden, Lynge, Denmark). Lighting interval was from 06:00 until 18:00, room temperature 21 ± 2°C, relative humidity of 55–65% and 10–12 air changes per hour. Mice were fed with Altromin 1324 diet (Brogaarden), and received tap water in bottles, both ad libitum.
Faecal samples were obtained from each of the 24 mice weekly from weeks 4 to 10 directly into sterile 1.5 mL Eppendorf tubes and stored within 30 min at −80°C. One group was subjected to surgical sampling of caecum at the age of six weeks under anaesthesia with Hypnorm (VetaPharma, Leeds, UK) and Dormicum (Roche A/S, Hvidovre, Denmark) dosed subcutaneously with 0.5 mL/100 g of body weight as a 1:1:2 aqueous solution. Analgesic (Rimadyl®, subcutaneously, 5 mg/kg) and antibiotic (Ampicillin [Ampivet™]; Boehringer Ingelheim, Copenhagen, Denmark, subcutaneously, 100 mg/kg) were given post anaesthesia but approximately 10–15 min before surgery. Oxygen was supplied via a face mask. The surgical field was shaved and disinfected with iodine and alcohol swabs, and a disposable surgical drape was placed on top of the animal. An approximately 0.8 cm incision was made on the midline of the abdomen, and then the muscle layers and the peritoneum were cut through and an incision of approximately 0.5 cm was made. The caecum was located and gently pulled out of the abdomen and placed on the surgical drape. A ligation was made approximately 0.5 cm proximal to its blind end. A pair of scissors, burned on a flame, was used to cut off the blind end of the caecum 2–3 mm proximal to the ligation site. The cut surface was further cauterized using a surgical blade burned on a flame. One drop of a 1:4 saline dilution of sulphadiazin/trimethoprim (Tribrissen Vet 48%™, Intervet/Schering-Plough, Ballerup, Denmark) was placed on the cut surface before gently putting it back into the abdomen. The peritoneum and muscle were then sutured followed by suturing of the skin (Vicryl 4-0, Johnson and Johnson, New Brunswick, NJ, USA). A measure of 0.3 mL of saline was given subcutaneously. Ampicillin water (1.2 mL of Ampivet™ [Boehringer-Ingelheim, Copenhagen, Denmark] in 300 mL water) was provided for seven days starting from the day of surgery.
Caecum samples were collected from all mice after euthanasia (cervical dislocation) at the age of 10 weeks. All caecal and faecal samples were stored at −80°C within one hour of collection until further analysis.
DNA was extracted from the faecal and caecal samples using the QIAamp DNA Stool Mini Kit (Qiagen, Hilden, Germany) according to the manufacturer's instructions and stored at −80°C until further analysis. The V3 region of the 16S rRNA gene was amplified by PCR using the following universal prokaryotic primer set: PRBA338f (5′-C GCC CGC CGC GCG CGG CGG GCG GGG CGG GGG CAC GGG GGG ACT CCT ACG GGA GGC AGC AG-3′) and PRUN518r (5′-ATT ACC GCG GCT GCT GG-3′) (Eurofins MWG Operon, Ebersberg, Germany). All reactions were carried out in a 50 μL volume containing 1.25 U HotMaster Taq DNA Polymerase (5′, Hamburg, Germany), 5 μL 10× Hotmaster Taq Buffer with 2.5 mmol/L MgCl2 (5′, Hamburg, Germany), 50 ng DNA, 10 pmol of each primer, 0.3 mmol/L of each dNTP (DNA Technology A/S, Risskov, Denmark) and 1 μg bovine serum albumin (Sigma-Aldrich, Brøndby, Denmark). PCRs were performed with an initial denaturation at 95°C for 5 min, and 30 cycles of amplification each included denaturation at 95°C for 30 s, annealing at 53°C for 30 s and extension at 72°C for 40 s, followed by a final elongation step at 72°C for 10 min. A final PCR product of approximately 230 bp was checked by electrophoresis on a 2% agarose gel at 100 V for 20 min, stained with ethidium bromide (Bio-Rad, Hercules, CA, USA) and then visualized. PCR amplicons were analysed by DGGE using the INGENYphorU-2 system according to the manufacturer's instructions (INGENY, Goes, The Netherlands). The acrylamide concentration in the gel was 9% and the linear denaturation gradient was 30–65% (100% denaturant gel corresponds to 7 mmol/L urea and to 40% deionized formamide). Before loading, 45 μL of PCR products was mixed with 7.5 μL of 6× loading dye (Fermentas, Copenhagen, Denmark). In addition to the samples analysed, an in-house standard PCR product was used on the DGGE gels, making it possible to normalize gel lanes within and between gels. Electrophoresis was performed in 0.5 × TAE (1 × TAE contains 40 mmol/L Tris-acetate, 1 mmol/L EDTA, pH 8.0), at 60°C for 16 h at 120 V. Staining was performed with a 1:10,000 SYBR Gold staining solution (Invitrogen, Carlsbad, CA, USA) in 1× TAE for one hour and photographed with a UV transillumination (302 nm) using a Kodak EDAS 290 system (Eastman Kodak, Rochester, NY, USA). The samples were randomized using online software (
Cluster analysis on the 16S rRNA gene amplicon-based DGGE profiles was performed using BioNumerics version 4.5 (Applied Maths, Sint-Martens-Latem, Belgium). Mice were ranked non-parametrically according to the similarities in both faecal and caecal profiles at both six and 10 weeks of age using the two mice with the highest similarity as baseline and ranking all other mice according to their similarity with these mice. Ranks of caecal profiles were compared with ranks of faecal profiles by linear regression. The number of faecal and caecal samples in visually definable clusters were compared by Chi-square test.
Weight data were tested for normality using the Anderson–Darling test, and compared weekly by analysis of variance.
Results
Five mice were euthanized shortly after surgery, as they did not seem to recover acceptably. Nineteen samples were repeated and the reproducibility was 83% ± 8.3%.
Before surgical sampling there was no clustering according to treatment groups (Figure 1). After surgery and antibiotic treatment at the age of six weeks the profiles of surgically sampled mice clustered in the two following weeks (Figure 1). At the age of nine and 10 weeks the surgically sampled mice no longer clustered (Figure 1).
Cluster analyses of faecal samples from C57BL/6 mice from four weeks until 10 weeks of age. The mice labelled with ▪ were anaesthetized and had a piece of caecum surgically removed at the age of six weeks and was treated with antibiotics in the subsequent week. At the age of seven weeks the lower cluster contains seven out of seven samples from mice subjected to surgery, and at the age of eight weeks it contains six out of seven samples from mice subjected to surgery. Both these clusterings are significant in Chi-square test (P = 0.000). At other time points there is no visual clustering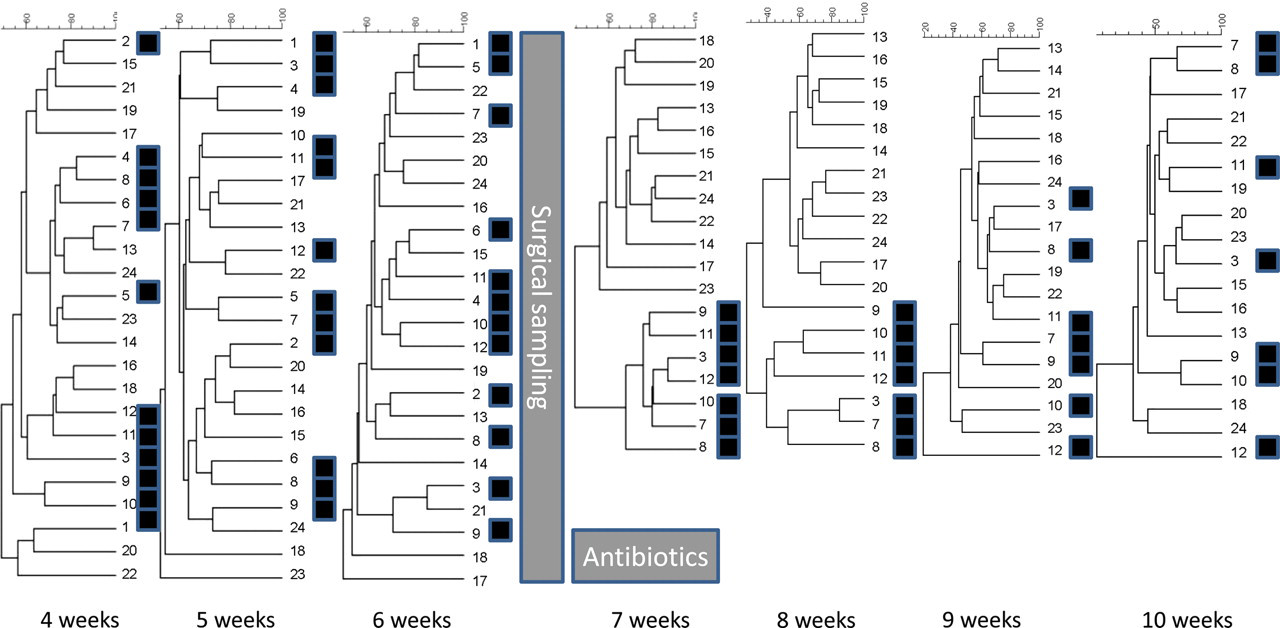
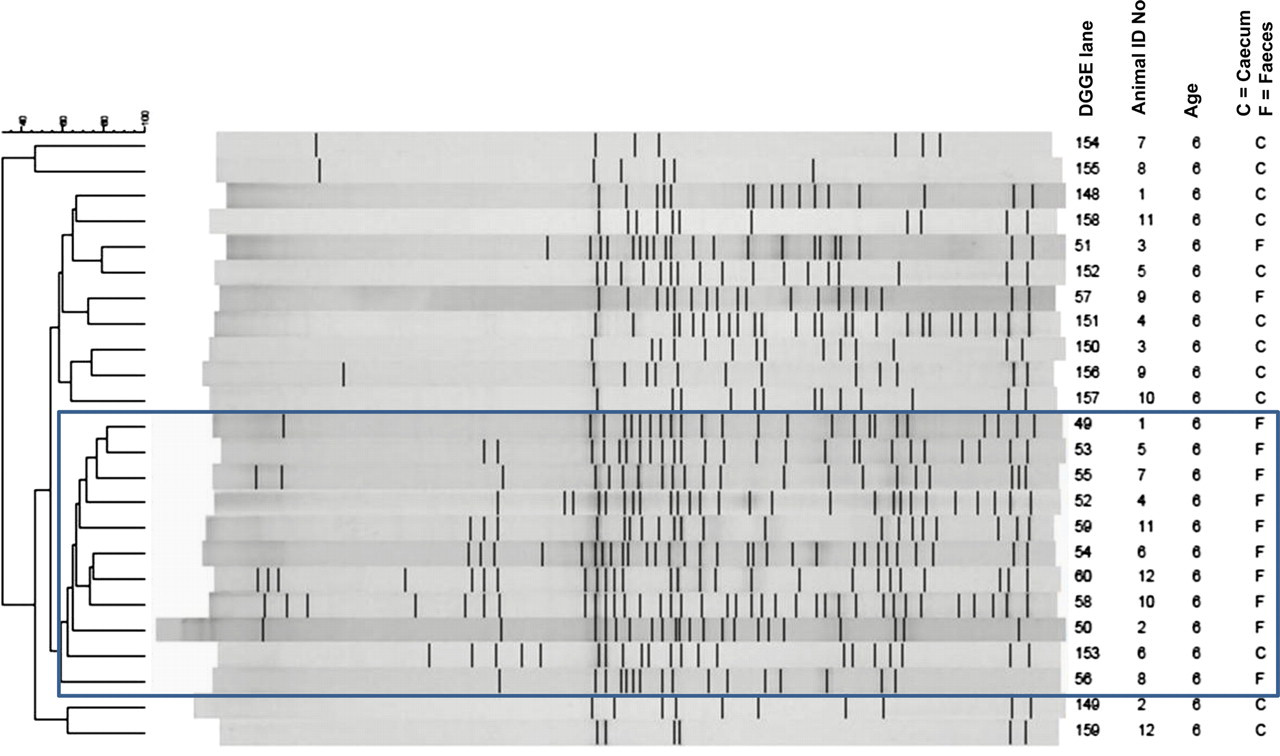
At six weeks of age the overall similarity of all faecal samples was 51%, while it was only 32% of the caecal samples. There was no correlation between the profiles in faecal and caecal samples (Figure 2). When faecal and caecal samples were cluster-analysed together the overall similarity was 32%, and a clear cluster with an overall similarity of 57% containing 10 out of 12 faecal and only one out of 12 caecal samples was observed, while the remaining samples containing two out of 12 faecal and 11 out of 12 caecal samples had a similarity of only 30% (Figure 3) (P < 0.001).
Cluster analyses of faecal and caecal samples from C57BL/6 mice at six and 10 weeks of age. Visual clusters are indicated by Roman numerals (caecum at 6 weeks), small letters (faeces at 6 weeks) and capital letters (caecum at 10 weeks). As can be seen there is little correlation between faecal and caecal samples at the same age, and faecal–faecal or caecal–caecal samples at different ages, and regression of ranked similarities does not reveal any significant correlations Common cluster analysis of faecal and caecal samples from C57BL/6 mice at six weeks of age. The framed cluster contains 10 out of 12 faecal and only one out of 12 caecal samples, which is significant in Chi-square test (P < 0.001)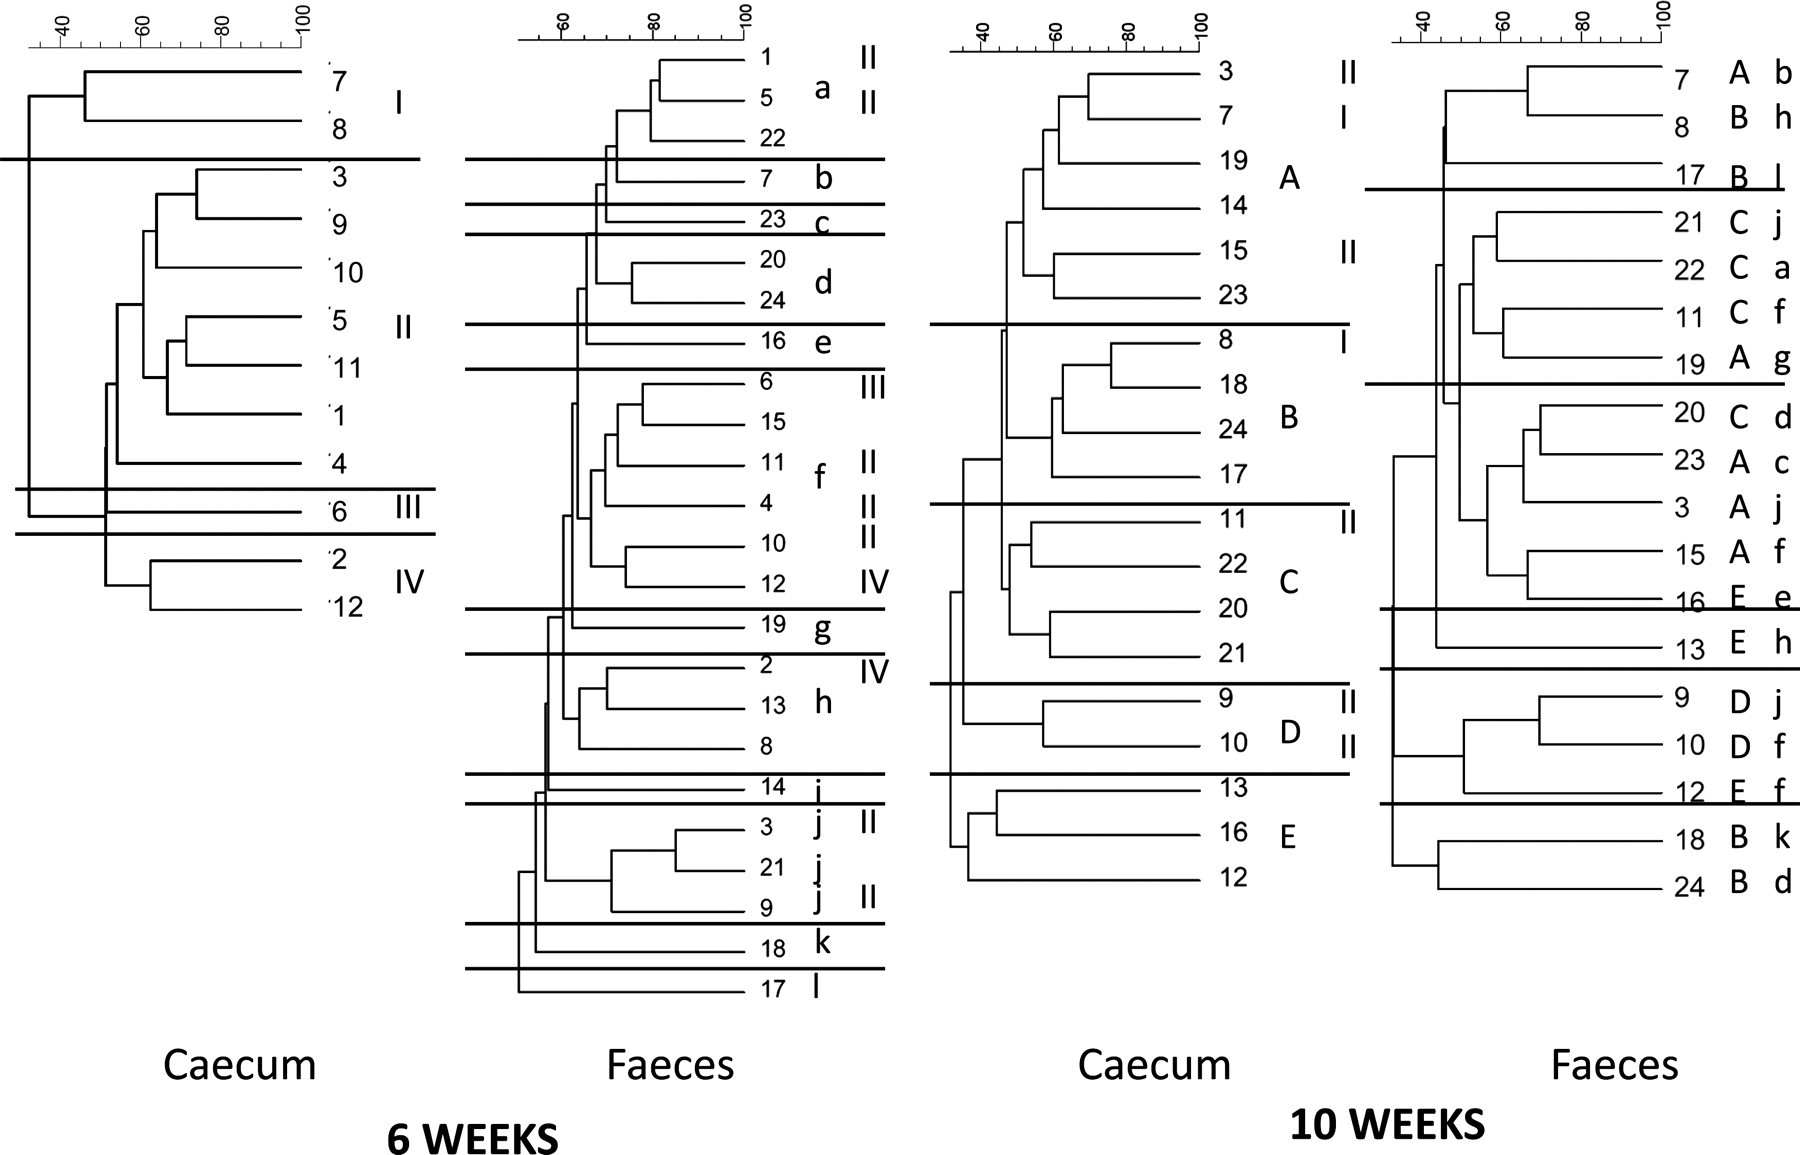
At 10 weeks of age the overall similarity of all faecal samples was 33%. The similarity was 32% among the caecal samples. There was no correlation between animal grouping based on caecal and faecal profiles (Figure 2). When faecal and caecal samples were cluster-analysed together the overall similarity was 29%. At 10 weeks of age no clear clusters were distinguished between faecal and caecal samples, when these were clustered together.
All weight data were normally distributed. Growth seemed to be reduced by the surgical sampling in the first week after, but this was in no way statistically significant (Figure 4), and here after there were no differences between the growth of the groups.
Growth curves of C57BL/6 mice subjected to surgical sampling from the caecum at the age of six weeks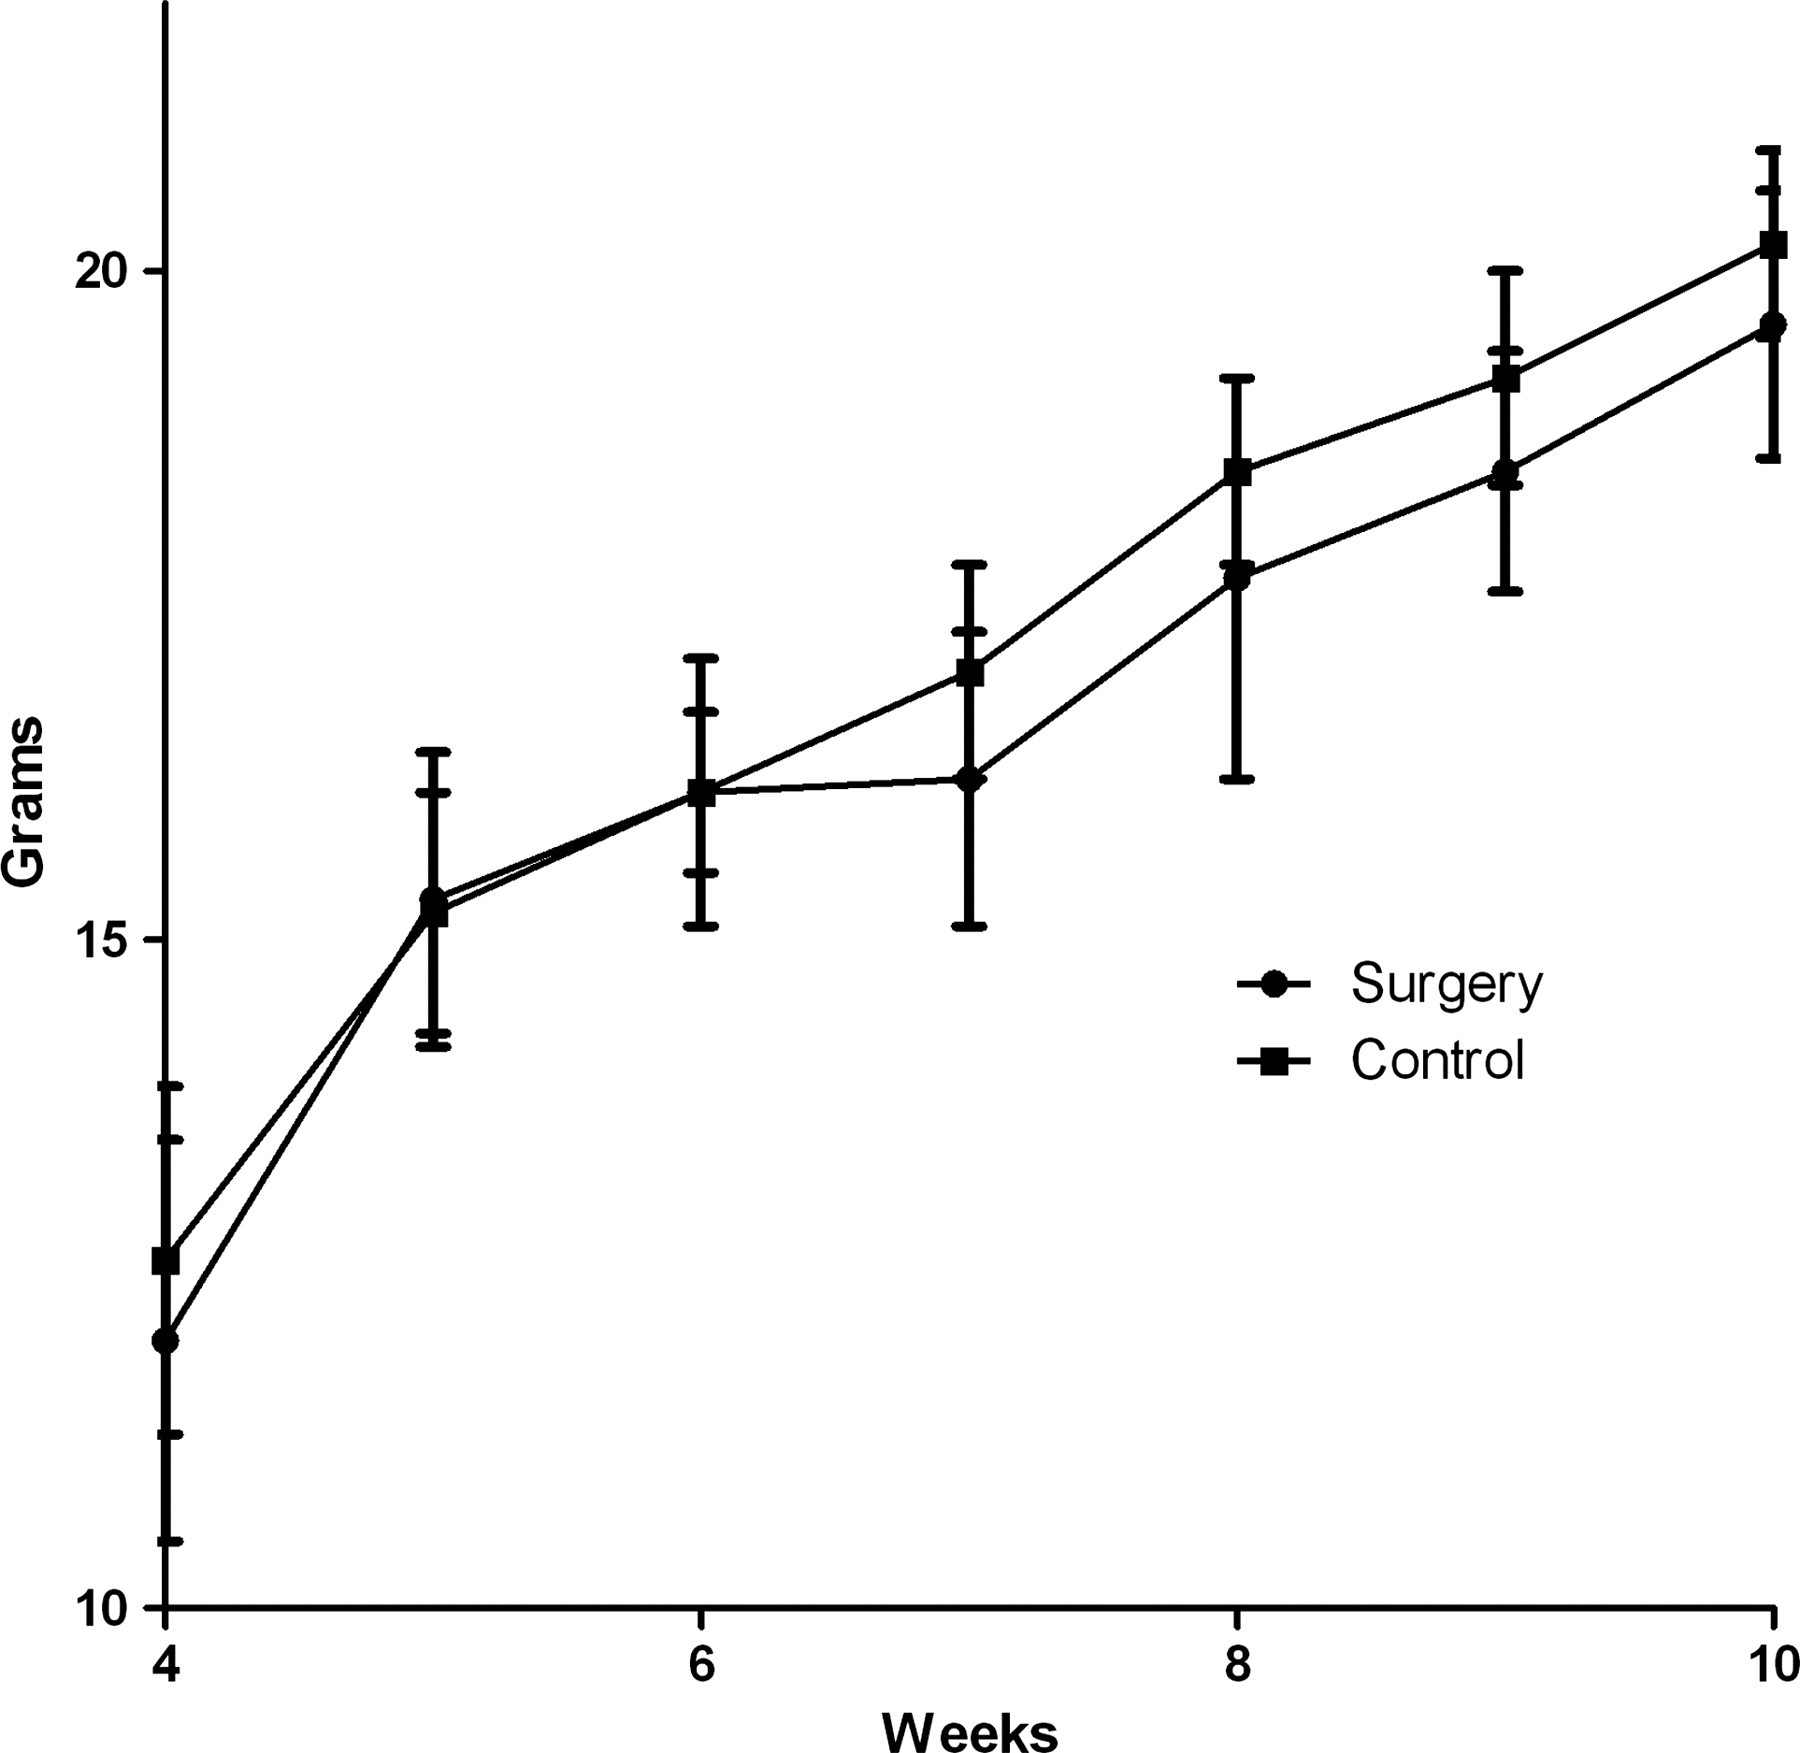
Discussion
The important outcome of this study is that although the similarity percentages found do not differ dramatically between caecal and faecal sampling, only a few of the mice cluster with the same partners in both types of samples. This is important because different types of diseases are under impact from the GM by different mechanisms. The GM is an important part of development of oral tolerance which takes part in early life. 19,20 The presence or absence of regulatory T-cells has an important impact on development of type 1 diabetes in non-obese diabetic (NOD) mice, 21 in which insulitis already appears at the age of three weeks. 22 The influence of the early life GM on disease development in this model is increasingly documented. 6,15 Therefore, for NOD mice the composition of the GM in the immunologically active small intestine is probably more relevant than the faecal composition, and it is probably mostly relevant in early life. In contrast to this, acute dyslipidaemia may be achieved in C57BL/6 mice after inoculation of GM from leptin-deficient obese mice, 23 and glucose tolerance may be essentially improved by antibiotic treatment. 24 Serum LPS concentration is correlated to glucose intolerance in this model, 12,13 and this may also be transferred to serum from the colon, 14 and therefore microbiota composition in the large intestine and in faeces may also be of interest. In models of inflammatory bowel disease the GM is an important trigger of inflammation and mucosal destruction, 25 and disease symptoms are minimized in germ-free animals, 26 and therefore the composition of the GM in the colon at the time of disease must be of crucial importance. In this way, it can be argued that at which site and time point the GM composition is of interest is specific for a specific animal model.
DGGE only shows the similarities and the clustering and due to its ease, low costs and rapidity it is widely applied for this purpose. However, the identities of the microorganisms remain unknown. One of the main reasons for the differences in clustering between caecal and faecal profiles may be that the compositions of the GM changes essentially along the gut. In sequencing studies the caecal Firmicutes fraction is around 80%. Lactobacillaecae and Erysipilotricheae of this fraction, which are the most dominant in the ileum, drop to below 10% each. Clostridiaceae vary much in the caecal microbiota, and may be from less than 10% up to 50%, 27–29 while Lachnospiraceae is the most dominant caecal bacteria accounting for more than 40% and up to 70%. 28–30 The Bacteriodetes fraction is around 25%, which can be divided into smaller fractions of Bacteriodales, Bacteriodetes, Porphyromonadaceae and Bacteriodaceae. 27–30 Another large fraction of the caecal microbiota is Ruminococcaceae, which comprise up to 25%. 28–30 In faeces, the fraction of Firmicutes decreases to as low as 5–10%, 31 although sometimes it is reported to be much higher, 32,33 while the Bacteriodetes fraction increases. 27,31,32 Verrucomicrobia may be from 0% to 10%. 33 A small fraction of Actinobacteria and Proteobacteria may be present in the caecum and faeces. 30,31,34
Neither do the mice cluster in the same way over time, which is in accordance with previous studies, in which it was shown by gas liquid chromatography that the composition of the GM changes essentially with age of the mouse. 35
In principle, the mice were only affected by the postsurgical antibiotic treatment up to two weeks after treatment termination. This is in accordance with studies of Vaahtovuo et al., 36 who observed by gas liquid chromatography that after antibiotic treatment mice quickly returned to the microbiota profile they had prior to treatment. So, in principle it would not invalidate a study if mice had caecal samples taken during the study. However, it is not very realistic from a practical point of view, and not all of the mice in this study seemed to cope very well with the sampling, so the method would need improvement.
Mice differ significantly in their GM composition in relation to genetics 7,35,36 and housing 8,10 and these differences have easily been observed by both faecal and caecal sampling and subsequent DGGE. However, these differences are probably much more dramatic than those observed in this study between inbred mice of the same strain housed in the same unit at the same time.
GM characterization of laboratory rodents may basically be applied in two ways. One way would be to use it for selecting animals with a more specific microbiota with less variation. In this case the commercial vendors would demonstrate a high similarity and specificity of the microbiota by random sampling in the colony using the results as an expression for the study animals, which would not need to be tested themselves; similarly to what is being done in routine health monitoring today. Another way would be to characterize the GM of each study animal and incorporate the results in a multifactorial or variate analysis thereby accounting for the variation caused by the GM. In such cases, current screening probably have to be limited to faecal sampling, and more extensive sampling be done at study termination. However, for both applications the results of the present study makes it recommendable that samplings performed on euthanized animals include several and not only single sites of the gut.
Footnotes
ACKNOWLEDGEMENTS
Wanyong Pang was financed by a grant from the Villum Foundation. Helene Farlov and Mette Nelander are kindly acknowledged for helping with the animal procedures and Bashir Aideh is kindly acknowledged for helping with the laboratory procedures.