
Abstract
The gut microbiota (GM) may influence disease expression in several animal models for inflammatory diseases. It may therefore seem reasonable to pursue reduction in the number of animals used for individual studies by reducing the variation in the GM. Previous studies have shown that the composition of the GM is related to genetics to a certain extent. We hypothesized that the GM similarity in a group of mice born by mothers not being sisters would be lower than that in a group born by mothers being sisters. The lower similarity could lead to clustering of the GM of mice born by non-sisters according to their mothers, while such clustering would not be visible if the mothers were sisters. We used 16S rRNA gene (V3 region) polymerase chain reaction-derived amplicon profiling by denaturing gradient gel electrophoresis (DGGE) to study the GM composition in caecum samples of 33 eight-week-old C57BL/6Sca mice from a breeding set-up with dam breeders that were sisters, as well as caecum samples of 35 eight-week-old C57BL/6Sca mice from a breeding set-up with dam breeders that were not sisters. Principal component analysis revealed a significant difference between the litters from the breeding set-up with dam breeders that were not sisters, whereas no significant difference between the litters based on the breeding set-up with dam breeders that were sisters was observed. The results obtained indicate that the systematic variation in the GM of inbred mice can be reduced by increasing the family relatedness of the breeding pairs.
Inflammatory diseases are among the most commonly modelled diseases in laboratory animals. For several animal models for inflammatory diseases, the composition of the gut microbiota (GM) influences disease expression. 1–10 Most previous studies are based on rather dramatic changes in the GM, such as making the mice germ free 8 or inoculating the flora of mice with different phenotype on germ-free mice. 9 However, today polymerase chain reaction (PCR)-based techniques, such as denaturing gradient gel electrophoresis (DGGE), 11–13 as well as pyrosequencing, 14 has made it possible to monitor smaller inter-individual dissimilarities in the GM of laboratory animals, and, for instance, have been used to show that the mutation itself is responsible for up to 12% of the GM variation observed in ApoA-I knockout mice compared with wild-type C57BL/6 mice, and that in these knockout mice impaired glucose tolerance is significantly correlated to differences in the GM composition. 14 It is, therefore, reasonable to assume that a higher variation in the GM might entail a higher variation in disease expression, consequently necessitating larger group sizes for disease modelling. Reduction, together with refinement and replacement, forms one of the strongest principles of in vivo scientific experimentation. Selecting animals with a high similarity in the GM could therefore be a valuable tool to reduce the number of animals in studies using animal models influenced by the GM.
Outbred mice have a lower similarity in the GM than inbred mice. 13 The GM between mouse strains varies significantly, 14–16 and GM of the same inbred strain differs between colonies from different vendors. 2,13 When decontaminated with antibiotics, inbred mice will afterwards return to a flora, which is related to their genetic origin and not to their environment. 2 In general, a positive correlation between the similarity of the GM and the genetic relatedness of a host has been observed. 17–20 Mice with a high similarity in the GM for an experiment could obviously be produced simply by screening the GM and subsequent deselection of outliers with a deviating GM. However, screening in live animals can in practice only be performed on faecal samples, and it is unclear to what extent selection based on faecal sample analysis might lead to a wrong approximation, as the qualitative and quantitative distribution of the bacterial community throughout the intestinal tract is found to differ considerably. 16,21–24 Similarity indices between samples from adjacent regions appeared to be higher than similarity indices between samples from more distant regions. 16,25
An alternative to selecting mice based on faecal analysis might be a breeding scheme aiming at a low inter-individual variation in the GM, which seems to be a reasonable strategy for outbred mice, while it is less clear whether this is actually feasible for inbred mice. Literature on the actual inbreeding coefficient monitored as the percentage of loci expressing homozygosity is rather sparse and dates some years back. Comprehensive studies of microsatellite variation are available for less than 10% of inbred strains, and little additional information is available in the literature on other DNA polymorphisms, such as single-nucleotide polymorphisms (SNPs) or randomly amplified polymorphic DNA markers. 26 In the early 1990s, one of the more detailed studies in inbred diabetes-prone BB rats showed, by the application of simple protein markers, that these did indeed carry some heterozygotic traits, 27 and some years later DNA fingerprinting also showed genetic heterogeneity in inbred BALB/c mice. 28 Furthermore, it is well known that separation of rodent strains into separated subcolonies gives rise to phenotypic variation even though skin grafting between the subcolonies still does not lead to rejections. 29 Therefore, it cannot be excluded that inbred mice carry heterozygotic traits, which can be eliminated to increase the inbreeding coefficient further, and even if these higher similarities may still be achieved by breeding, as epigenetics, e.g. imprinting by suppressing gene expression by the addition of methyl groups to the DNA, mostly at CpG sites, is not an issue commonly addressed in the production of inbred mice. However, inter-individual differences between inbred mice may be inherited through generations and some of these may be explained by imprinting, while others may not. 30–32 One of the main reasons for not looking for DNA polymorphisms or epigenetic differences in large-scale genetic monitoring in inbred mice is that it is still rather expensive and laborious, and so far the benefits has not been judged to outweigh the costs. On the other hand, a lower variation in inbred mice, e.g. if variation in GM could be lowered by a selective breeding programme, may argue in favour of such examinations. Therefore, it would be of value to know to what extent the composition of the GM is inheritable in inbred mice, and therefore the aim of this study was to examine if related mothers produced offspring with a more similar GM than unrelated mothers. For this purpose, we used a culture-independent approach based on 16S rRNA gene PCR-derived amplicon profiling by DGGE to determine the variation in the composition of the caecum microbiota related to the family relations of the breeding females. We hypothesized that the GM similarity in a group of mice born by mothers not being sisters would be lower than that in a group born by mothers being sisters, and that the lower similarity could be related to clustering of the GM of mice born by non-sisters according to their mothers, while such clustering would not be visible if the mothers were sisters.
Materials and methods
Mice
Inbred C57BL/6Sca mice were used. The mice were raised and maintained in a closed system as specific pathogen-free animals in accordance with the Federation of European Laboratory Animal Science Associations 33 at Scanbur AB during the study (Scanbur AB, Sollentuna, Sweden). C57BL/6Sca mice were housed in individual ventilated cages (IVC), Blue line type II (Tecniplast, Varese, Italy), with autoclaved aspen bedding (Scanbur AB), free access to water and autoclaved RM 3 diet (SDS, Witham, UK). All housing and maintenance principles were in accordance with the Council of Europe Convention ETS 123. 34 The breeding scheme was one female and one male in each IVC cage (Tecniplast). The females used were either sisters from the same litter or females randomly sampled from the production, ensuring that they were not sisters. The male was removed from the cage just prior to the female giving birth. The offspring were weaned at the age of three weeks and maintained unseparated.
From the breeding set-up with dam breeders related as sisters, five cages were used with three to eight offspring in each cage. From the breeding set-up with dam breeders that were not sisters, five cages with five to nine offspring in each cage were used.
Caecum sample collection
At the age of eight weeks, C57BL/6Sca offspring were euthanized by cervical dislocation and caecum samples were collected aseptically. The samples were immediately frozen at −80°C until use. DNA was extracted from the samples using the QIAamp DNA Stool Mini Kit (Qiagen, Hilden, Germany) according to the manufacturer's instructions and stored at −40°C until analysis.
PCR amplification
The V3 region of the 16S rRNA gene was amplified by PCR using the following universal primer set PRBA338f and PRUN518r (5′-CGCCCGCCGCGCGCGGCGGGCGGGGCGGGGGCACGGGGGGACTCCTACGGGAGGCAGCAG-3′ and 5′-ATTACCGCGGCTGCTGG-3′) 35 (Eurofins MWG Operon, Ebersberg, Germany). All reactions were carried out in a 50 μL volume containing 1.25 U HotMaster Taq DNA Polymerase (5 Prime, Hamburg, Germany), 5 μL 10× HotMaster Taq Buffer with 2.5 mmol/L MgCl2 (5 Prime), 100 ng DNA, 10 pmol of each primer, 0.3 mmol/L dNTP (Bioline, Luckenwalde, Germany) and 1 µg bovine serum albumin (Sigma-Aldrich, Brøndby, Denmark). The PCR reaction was performed on a Robocycler Thermoblock (Stratagene, Aarhus, Denmark). Initial denaturation was carried out at 95°C for 5 min, amplification was carried out using 30 cycles each including denaturation at 95°C for 30 s, annealing at 60°C for 30 s and extension at 72°C for 40 s, followed by a final elongation step at 72°C for 10 min. A final product length of approximately 230 bp was checked by electrophoresis on a 2% agarose gel, stained with ethidium bromide (Bio-Rad, Hercules, CA, USA).
Denaturing gradient gel electrophoresis
PCR amplicons were analysed by DGGE using the INGENYphorU-2 system according to the manufacturer's instructions (INGENY, Goes, The Netherlands). The acrylamide concentration in the gel was 9% and the linear denaturation gradient was 30–65% (100% denaturant corresponds to 7 mmol/L urea and 40% deinoized formamide). Before loading 35 μL PCR product was mixed with 6 μL 6× loading dye. In addition to the samples analysed, an in-house standard PCR product was loaded, allowing accurate alignment of lanes and bands within and between gels. Electrophoresis was performed in 0.5×TAE (1×TAE correspond to 40 mmol/L Tris-acetate, 1 mmol/L EDTA, pH 8.0), at 60°C for 16 h at 120 V. Staining was performed with a 1:10,000 SYBR Gold staining solution (Invitrogen, Eugene, OR, USA) in 1× TAE for one hour and photographed with UV transillumination (302 nm) using a Kodak EDAS 290 system (Eastman Kodak).
Data analysis
The 16S rRNA gene amplicon-based profiles obtained by DGGE were analysed using BioNumerics version 4.5 (Applied Maths, Sint-Martens-Latem, Belgium). Comparison was performed using the Dice similarity coefficient with a position tolerance setting of 1% optimization and 1% position tolerance for band composition. The unweighted pair group method with arithmetic averages clustering algorithm (UPGMA) was used and dendrogram patterns derived from the similarity of the DGGE profiles were constructed. Three-dimensional principal component analysis (3D-PCA) based on DGGE data were carried out (Applied Maths). One-way analysis of variance (Minitab version 14, Minitab Inc, State College, PA, USA) was used to compare litters based on X, Y and Z values from the PCA plot. The level of significance was set at P < 0.05.
P values from the comparison between litters based on X, Y and Z values
The different litters are named with different colours as used in the PCA plot illustration
*Significant difference between litters. PCA: principal component analysis
Results
Cluster analysis and PCA based on DGGE data from the breeding set-up with dam breeders related as sisters
DGGE profiles based on caecum samples from 33 eight-week-old C57BL/6Sca mice were constructed. Cluster analysis (Figure 1) of the profiles revealed an overall similarity index of 77 ± 4.8%. The composition of the GM between the offspring did not differ to such an extent that a clear clustering reflecting the litters could be visualized. A 3D-PCA plot based on DGGE data is shown in Figure 2a. The first, second and third PCA component (X-, Y- and Z-axis) could not identify a variation in the GM to such an extent that a clear separation between the samples could be seen. X, Y and Z values for the different litters based on the PCA plot are shown in Figure 2b. Variance analysis based on X and Y values revealed no significant difference between the litters (P > 0.05). Reaching the third component (Z-axis), a significant difference between the litters could be observed in half of the comparisons (Table 1).
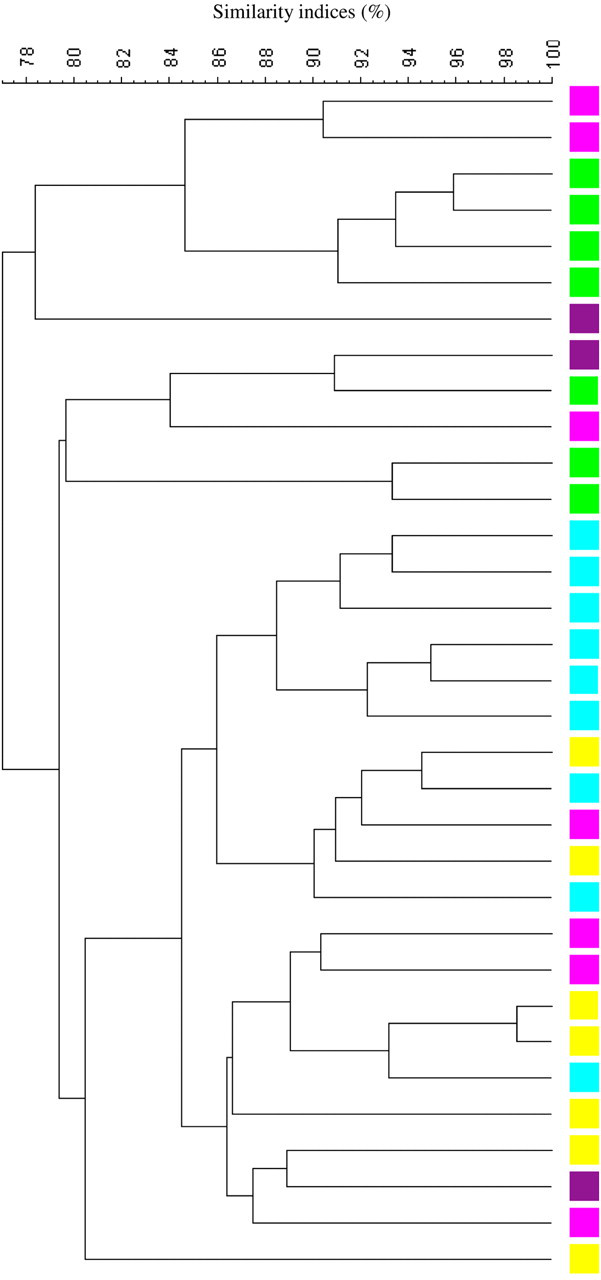
Dendrogram (Dice's similarity coefficient and UPGMA) based on DGGE profiles representing 16S rRNA gene PCR-derived amplicons of caecum samples collected from eight-week-old C57BL/6Sca mice. The mice come from a breeding set-up with dam breeders that are sisters. Offspring from the same litter are marked with the same colour. The scale bar represents the similarity index in percent (100 indicates complete similarity and 0 complete dissimilarity). The overall similarity index is 77 ± 4.8%. UPGMA: unweighted pair group method with arithmetic averages clustering algorithm; DGGE: denaturing gradient gel electrophoresis; PCR: polymerase chain reaction
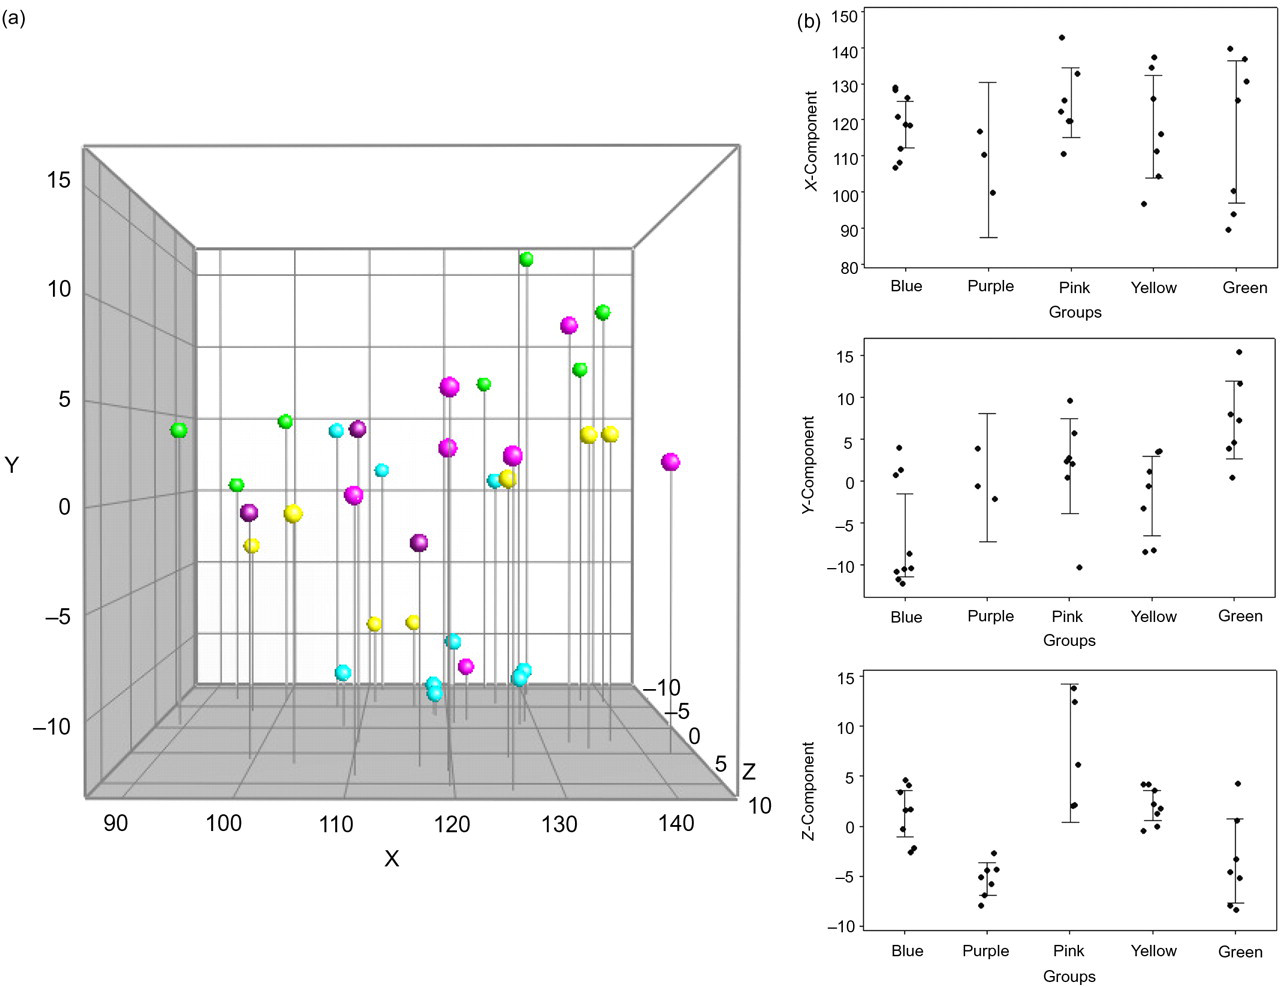
(a) PCA based on DGGE profiles of 16S rRNA gene PCR-derived amplicons of caecum samples collected from eight-week-old C57BL/6Sca mice. The mice are from a breeding set-up with dam breeders that are sisters. Offspring from the same litter are marked with the same colour. (b) Diagrams representing PCA values for every offspring from the breeding set-up with dam breeders that are sisters. X-axis: the different litters signed with a different colour; Y-axis: either X, Y or Z values from the PCA plot. PCA: principal component analysis; DGGE: denaturing gradient gel electrophoresis; PCR: polymerase chain reaction
Cluster analysis and PCA based on DGGE data from the breeding set-up with dam breeders that are not sisters
DGGE profiles based on caecum samples from 35 eight-week-old C57BL/6Sca mice were analysed. Cluster analysis (Figure 3) revealed an overall similarity index of 73.6 ± 5.4%. The composition of the GM between the offspring varied to such an extent that a clustering reflecting which litter the mice came from could be observed in the dendrogram. A 3D-PCA plot based on the DGGE data is shown in Figure 4a. A clear separation between the samples could be visualized in the PCA plot. X, Y and Z values for the different litters based on the PCA plot are shown in Figure 4b. Variance analyses based on X, Y and Z values show a significant difference between the litters (P < 0.05), with some exceptions (Table 1). The same picture was seen in a parallel set-up with only three cages available (data not shown).
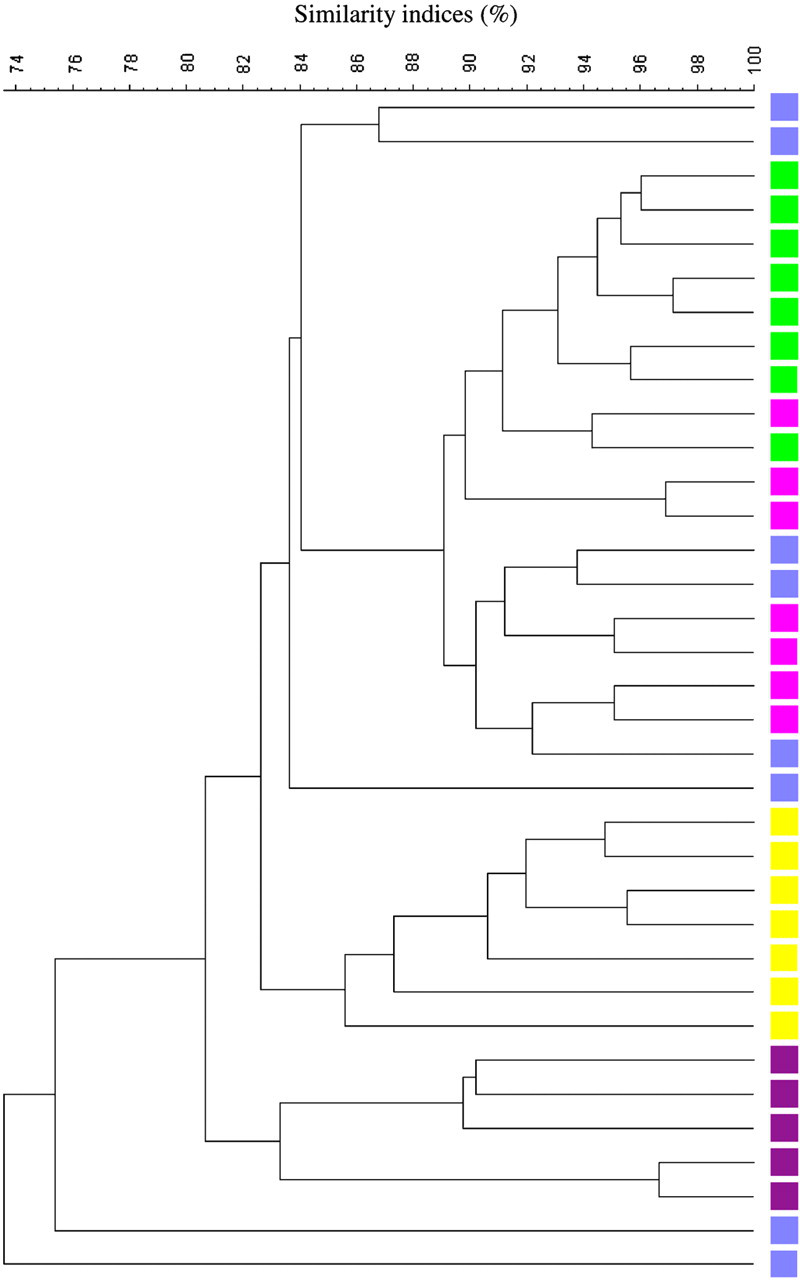
Dendrogram (Dice's similarity coefficient and UPGMA) based on DGGE profiles representing 16S rRNA gene PCR-derived amplicons of caecum samples collected from eight-week-old C57BL/6Sca mice. The mice are from a breeding set-up with dam breeders that are not sisters. Offspring from the same litter are marked with the same colour. The scale bar represents the similarity index in percent (100 indicates complete similarity and 0 complete dissimilarity). The overall similarity index is 73.6 ± 5.4%. UPGMA: unweighted pair group method with arithmetic averages clustering algorithm; DGGE: denaturing gradient gel electrophoresis; PCR: polymerase chain reaction
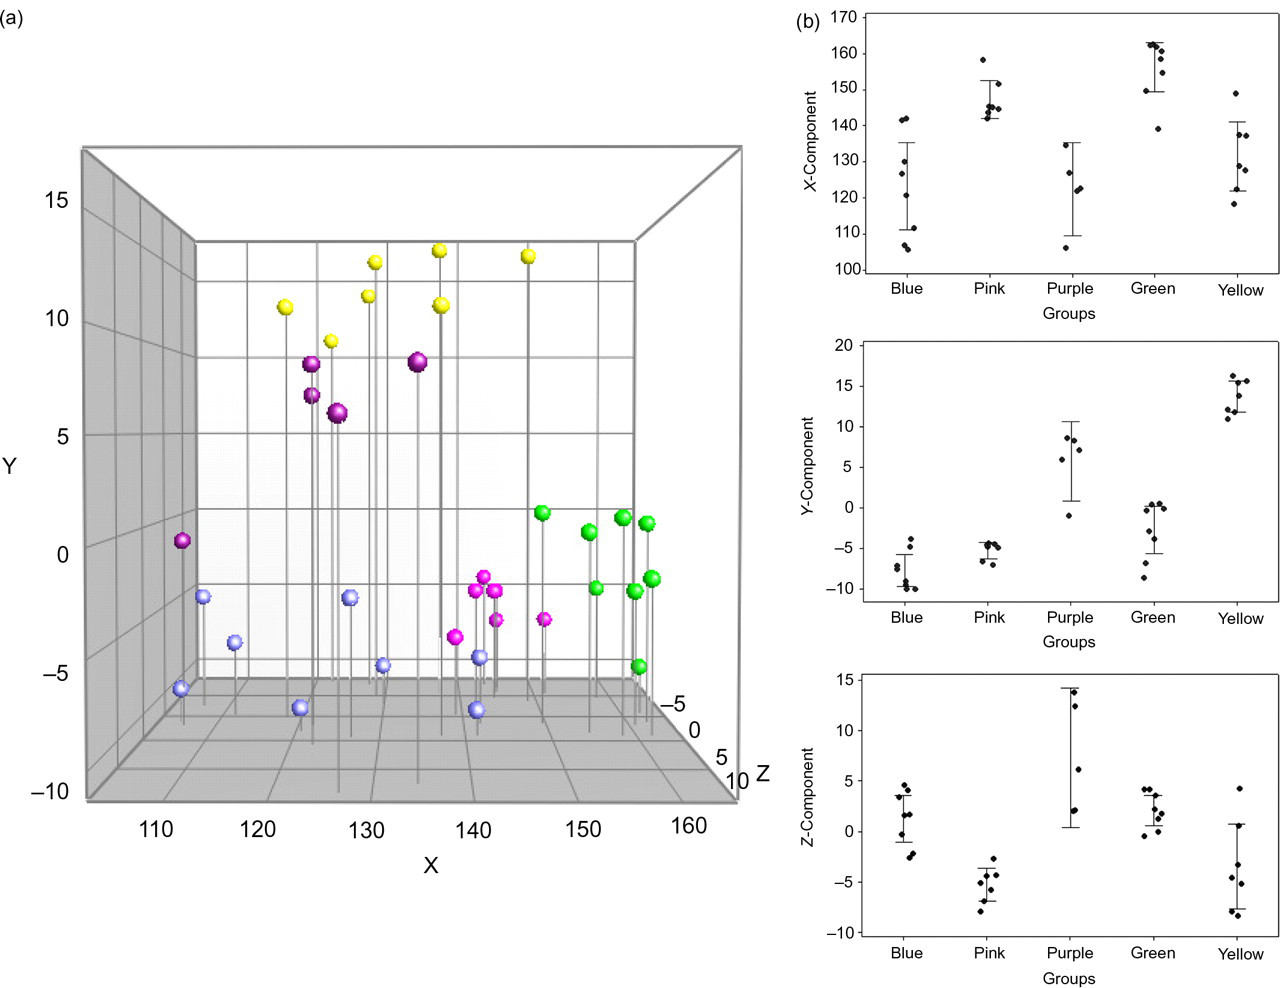
(a) PCA based on DGGE profiles of 16S rRNA gene PCR-derived amplicons of caecum samples collected from eight-week-old C57BL/6Sca mice. The mice are from a breeding set-up with dam breeders that are not sisters. Offspring from the same litter are marked with the same colour. (b) Diagrams representing PCA values for every offspring from the breeding set-up with dam breeders that are not sisters. X-axis: the different litters signed with a different colour; Y-axis: either X, Y or Z values from the PCA plot. PCA: principal component analysis; DGGE: denaturing gradient gel electrophoresis; PCR: polymerase chain reaction
Discussion
The similarity index between offspring based on dam breeders that were sisters was 77% compared with the similarity index between offspring based on dam breeders that were not sisters, which was 73.6%. The PCA plot demonstrated that more PCA components were necessary to identify a variation in the GM in offspring based on dam breeders related as sisters. This is confirmed by variance analysis based on X, Y and Z values. Basically, no significant difference between litters from the breeding set-up with dam breeders related as sisters was observed, whereas a significant difference between litters from the breeding set-up with dam breeders that were not sisters was seen. As such, we achieved a reduction in the systematic inter-individual variation in the composition of the GM by increasing the relationship within the breeding pairs.
It is not possible from this study to conclude on the background for this increase in similarity. From other studies, it is known that similarity indices within the GM increase with increased genetic relatedness, 36,37 and human as well as animal studies show that the genotype has a strong influence on the gastrointestinal community. 2,15,38–40
Our breeding experiment is based on an inbred mouse strain, C57BL/6Sca, and as such we are operating within small improvements aiming for a reduced variation in the GM, and, previously, we have shown that the caecal community of C57BL/6Sca mice has a high and rather fixed similarity index. 13 Reduction, refinement and replacement of laboratory animal models are very important and inevitable aspects within laboratory animal science. Reduction in the individual studies as originally described by Russell and Burch 41 is achieved by pursuing a reduced inter-individual variation. However, even in inbred mice housed in very standardized facilities variation is still observed, e.g. in their GM as shown in this as well as in a previous study. 13 Assuming that a variation in disease expression within inflammatory disease models is partly due to a variation in the composition of the GM, a higher similarity in the GM could be a valuable tool to reduce the number of laboratory animals used. The major proportion of laboratory animals used in biomedical research are mice, and around seven million mice are used on a yearly basis in the EU. 42 Power analysis can be used to show that a decrease in variation of 7% can halve the group size, so a reduced variation is an essential road towards reduction.
Selecting mice based on the similarity indices in their faecal microbiota would be labour-intensive and expensive. A breeding scheme aiming for a higher similarity in the GM might in the long run be more pragmatic. Our study indicates that it is worth the efforts to do further studies to relate GM characterization by DGGE or other PCR-based methods with genome characterization, e.g. by SNP chips to elucidate whether heterozygotic traits could be responsible for GM dissimilarities. Also, Solexa sequencing could be applied to study the impact that imprinting may have. A more simple approach might be to perform selective breeding for a higher similarity over some generations. Obviously, it is also very important but also far more complex to clarify to what extent a reduced variation on this level in the GM actually correlates to a reduced variation in disease expression in various animal models.
Footnotes
Acknowledgements
The work performed was financed by Scanbur A/S, Denmark, the University of Copenhagen, Denmark as well as by a grant from the Ministry of Science, Technology and Innovation, Denmark.