
Abstract
The aim of the study was to develop and validate a feline urinary collection system for accurate 24 h urine output measurement and glomerular filtration rate (GFR) evaluation. We hypothesized that precise identification of urination time improves the accuracy of the collection system. In a group of nine cats, urinary volume and micturition times were repeatedly recorded for up to 48 h using purpose-built collection trays containing a temperature data logger. Collection time was determined both with and without using the data loggers on 22 occasions and agreement between estimated 24 h urine outputs obtained with the two calculation methods was evaluated. GFR was repeatedly measured by endogenous urinary creatinine clearance on three occasions. Twenty-four-hour urine output was measured in 98.5% of the attempted collections (300 cat-sampling days). Sensitivity and specificity of the detection system were 97.8% and 100%, respectively. Mean 24 h urine output was 12.4 ± 4.94 mL/kg/day and mean intra-cat between-days coefficient of variation (CV) was 16.6 ± 5.6% when data loggers were used. The absolute relative volume error between the two calculation methods ranged from 0% to 131%. Median absolute relative [interquartile range] error was 9.1% [3.25–19.8]. Bias was −1.3% and lower and upper limits of agreement were −39.7% and 35.2%, respectively. Mean estimated GFR was lower than previously reported with comparable urinary clearance methods (1.92 ± 0.37 mL/min/kg) and mean within-cat CV was 12 ± 6.9%. The system was simple in design, readily affordable, allowed normal micturition behaviour and reduced intra-animal variability in 24 h feline urine collection.
Urine collection for analysis is essential for investigating renal function in companion animals, including the laboratory cat. Accurate quantitative urine collection facilitates evaluation of metabolic pathways and nutritional requirements, detection of endocrine abnormalities and urinary excretion of xenobiotics or biomarkers. 1 Physiological adaptation to an experimental stimulus can also be studied by quantitative urinalysis. The ideal urine collection procedure would be continuous and without direct intervention. In order to avoid contamination, urine should be separated from litter and faeces. The collection should also be efficient, affordable, not labour intensive and voided samples should be cooled to 4°C.
Although several techniques of urine collection have been described in the cat, none is ideal, the deficiencies relating to welfare and/or technical issues. Metabolic cages have been used for continuous urine collection in nutritional sciences. 2 Their flooring comprises wire mesh, precluding the normal feline elimination behaviour of digging and burial of faeces. The latter, together with long restraint in a caged environment, may be deleterious to the cats’ wellbeing. Russo et al. 3 showed that several cats placed in these collection conditions retained urine for more than 24 h. Urinary bladder catheterization requires general anaesthesia to secure the catheter in place. 4 The catheter is subsequently uncomfortable and the risk of catheter-related urinary infection is considerable with repeated catheterization. 5 Moreover, the aim of complete collection becomes invalid if urine leaks around the catheter or if the catheter dislodges. Cystocentesis does not allow complete bladder emptying and potentially creates bladder injury if repeated. 1 The required operator experience and skills and the necessity of restraint are additional limitations of cystocentesis.
Pastoor et al. 6 developed an alternative method for collecting urine from cats which separates urine from faeces. Urine was collected downstream on a polycarbonate plate placed almost horizontally but with a slight incline in a litter box. Non-absorbing polyethylene beads were used as litter substitutes to allow faeces burial. 6,7 Acceptance of the system by cats was good but without precise identification of time of micturition, error in estimating daily urinary volumes increases. Indeed, cats may urinate immediately before or after a collection period potentially increasing within- and between-day variability.
Measurement of urinary clearance of endogenous creatinine provides an estimate of glomerular filtration rate (GFR). 3 To ensure accuracy, bladder catheterization is considered necessary to ensure that the bladder is empty at the start and end of the collection interval. 4 By observing micturition over longer collection periods (up to 96 h), Hoskins et al. 8 were able to record micturition time and measure endogenous urinary creatinine clearance (UrECC) without using urinary catheters. Therefore, automated determination of micturition time may allow estimation of endogenous creatinine clearance without urinary catheterization, provided that bladder residual volume remains similar for the same cat with each urination. Purpose-built electronic systems able to record urination time have been described. 9,10 However, they were not easily accessible, difficult to use and only permitted simultaneous collection in a limited number of cats.
Some of the problems encountered with feline urinary collection may be overcome through better husbandry in order to reduce stress and abnormal urinary behaviour and through precise identification of urination time. This may improve the reproducibility and therefore the quality of urinary data collected while limiting the number of animals used in research. 1 The aim of the study was to develop and validate an accurate feline urine collection system equipped for 24 h urine collection and non-invasive GFR estimation. We hypothesized that reproducibility and accuracy of urinary collection and the quality of urinary data would be increased by using a purpose-built collection tray together with data loggers for precise identification of urination times, with minimal labour.
Materials and methods
Animals
Nine young sterilized cats (domestic short hair, 1 year old, 4 males, 5 females, weighing 3.9 ± 0.44 kg) were included in the study and re-homed thereafter. The cats were fed the same quantity of a commercial diet (Royal Canin FR23, Aimargues, France) twice a day. Water was available ad libitum. The room was lit from 07:00 to 19:00. The study was undertaken under the Animals (Scientific Procedures) Act 1986 regulated by a Home Office Project licence and approved by the RVC Ethics and Welfare Committee. The cats were collectively housed with plastic litter trays filled with corncob cat litter, except during the collections when the cats were individually housed in two-floored metal cages (2 m × 1 m × 1 m) equipped with urinary collection systems (vide infra).
Urinary collection system
A patented system of two stackable trays was used (Smart Cat Box®, Providence House Mfg Inc, Seal Rock, OR, USA) (Figure 1). The top tray (470 × 360 × 120 mm) had a slotted floor (8 × 30 slots each measuring 2 × 48 mm) and a 3° gradient from the horizontal to improve drainage of urine into the bottom tray. Non-absorbent polypropylene pellets (3–4 mm diameter) were used in the top tray as litter granule substitutes (Katkor®; Rein Vet Products, Utrecht, The Netherlands). The floor of the bottom tray (475 × 365 mm) had a 5° slope converging towards a drain hole. Urine flowing down the hole was collected in a covered reservoir (202 × 180 × 33 mm) housed in the bottom tray. The hole in the reservoir lid was aligned with the drain hole. A smaller reservoir (150 mL, Reagent reservoir; Excel Scientific Texan, Victorville, CA, USA) was modified to fit inside the collection reservoir under the hole in the lid. It was wedged in place by a refrigerant gel pack (Gel Pack, 89 × 165 × 19 mm; VWR, Lutterworth, UK). A temperature data logger (SL51T®; Signatrol, Tewkesbury, UK) was wrapped in two concentric, thin, self-sealing layers of paraffin film (Parafilm®; Pechiney Plastic Packaging Company, Chicago, IL, USA). The working temperature range of the data logger was −40 to +85°C in increments of 0.5°C and an accuracy of ±1°C (from −30 to +70°C). The data logger was placed in the smaller reservoir to record changes of temperature when warm urine accumulated.
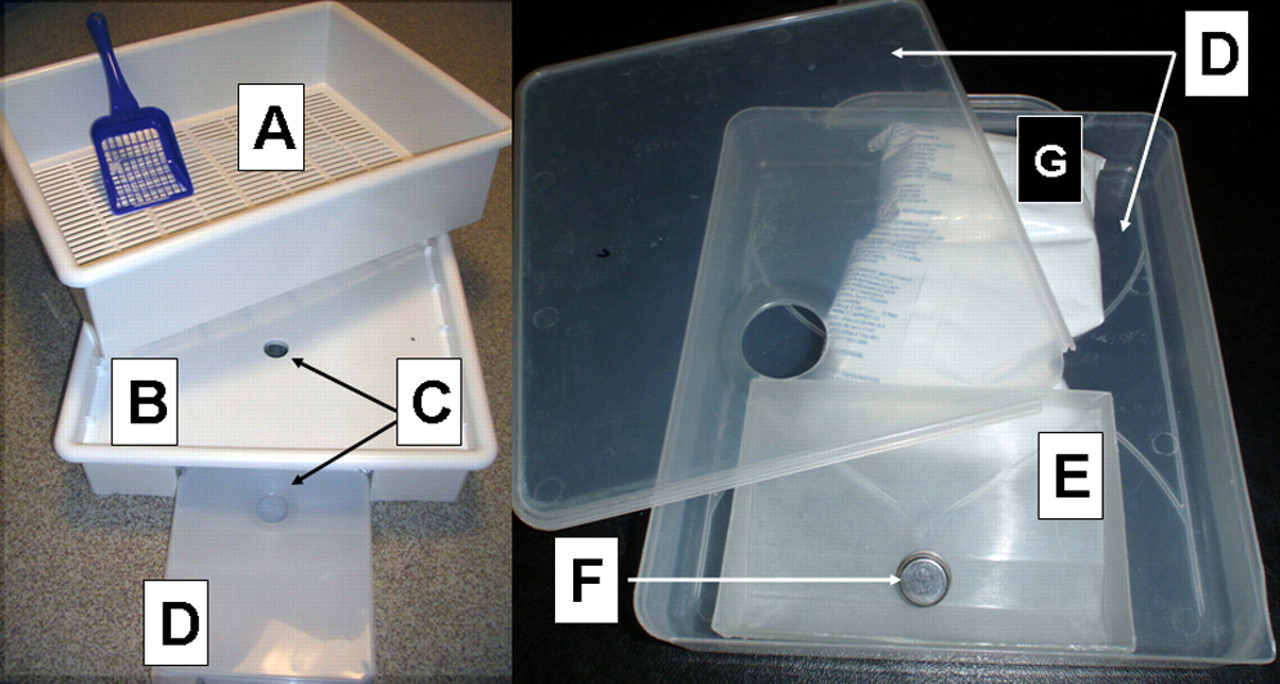
Feline urine collection system with data logger device (A: top tray; B: bottom tray; C: drain hole; D: collection reservoir; E: small reservoir, F: temperature data logger, G: refrigerant gel pack)
The data loggers were programmed to take continuous temperature readings at one-minute intervals for 12 h. Every 12 h, reservoirs and logger were collected and replaced. The urine volume collected was measured and urine stored at −80°C for later analysis. The data logger memories were uploaded and reset before reuse. Raw data were processed by data analysis software (TempIT Lite, version 4.0.48, Signatrol) and stored electronically. A recording sequence was defined as a single time–temperature log recorded for 12 h. An example of a recording sequence is shown in Figure 2. An occasion was defined as a full measurement of 24 h urine output, which encompasses the results of 3–4 consecutive sequences. Two weeks acclimatization allowed the cats to become accustomed to the new litter pellets and collection tray.
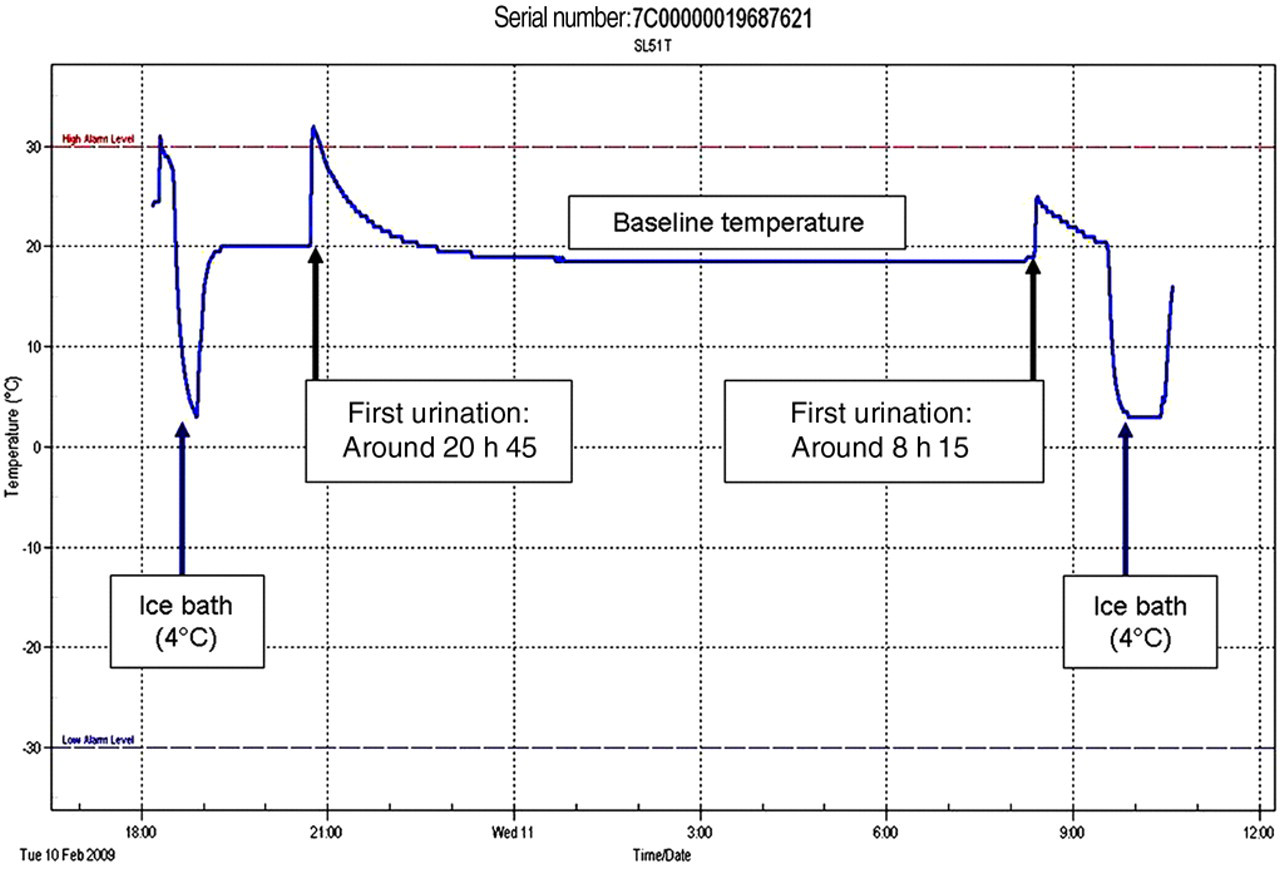
Typical trace of a temperature–time recording sequence. The cat urinated twice during the recording period around 20:45 and 08:15. Baseline room temperature was approximately 20°C. The data loggers were placed on ice (4°C) before placement in the collection tray and after the end of the collection period
Validation studies
Recovery study
The proportion of urine retained by the litter tray or litter granules was investigated by pouring 20 mL of urine on a standardized amount of polypropylene granules (200 g for 825 cm2) placed on each top tray. Urine was collected from the reservoir after one hour and the percentage recovery calculated. Recovery was measured for three urine specific gravities (1.001, 1.018 and >1.050) with 10 replicates for each. Urine evaporation, leading to reduced volume, was evaluated by weight difference from urine aliquots kept at 20°C for 12 h (relative humidity 24%, 10 replicates).
System detection accuracy
The time accuracy of temperature peak identification was evaluated by immersing data loggers in a 37°C water bath at random times (6 replicates). Time of immersion was recorded by videocamera and compared with time of temperature peak recorded by the data logger. A random sample of 270 recorded sequences was selected and classified by a single masked observer for two possible outcomes: no urination or at least one urination. Observer scoring was compared with the actual outcome (urine or no urine collected) to determine the in vivo sensitivity and specificity of the detection system.
Comparison of two methods to calculate 24 h urine output
Calculation methods
Cats were individually housed for urine collection on 22 different occasions during a 12-month period. The cats were maintained in a normal physiological state during 11 occasions. During the 11 other occasions, the cats received various treatments not described in this paper. Two methods were used to calculate the collection interval (Figure 3). Firstly the ‘standard method’ used the total time during which urine was collected. All urine collected in the tray was taken into account for the calculations. Secondly, the ‘data logger method’ collection interval started after the first urination recorded by the data logger and finished after the last micturition recorded by the data logger (Figure 3). Urine voided during the first micturition was discarded. The collection interval had to be longer than 24 h. For both methods, the total volume of urine collected was divided by the length of the collection interval (in hours) and multiplied by 24 h to yield the 24 h corrected urine output. A total of 201 pairs of daily urine outputs were recorded during the 22 occasions (physiological condition or after intervention). The Bland–Altman approach was used to measure bias and agreement between the two methods over the range of values. 11 The absolute relative error was calculated as the absolute value of the difference in measurement divided by the measurement obtained with the data logger method. Graphical plots of the relative difference in 24 h urine outputs (y-axis) versus the average 24 h urine output obtained by the two methods (x-axis) were made. The mean of all relative errors gave the bias and the interval between the lower and the upper limit of agreement contained 95% of the observed relative differences.
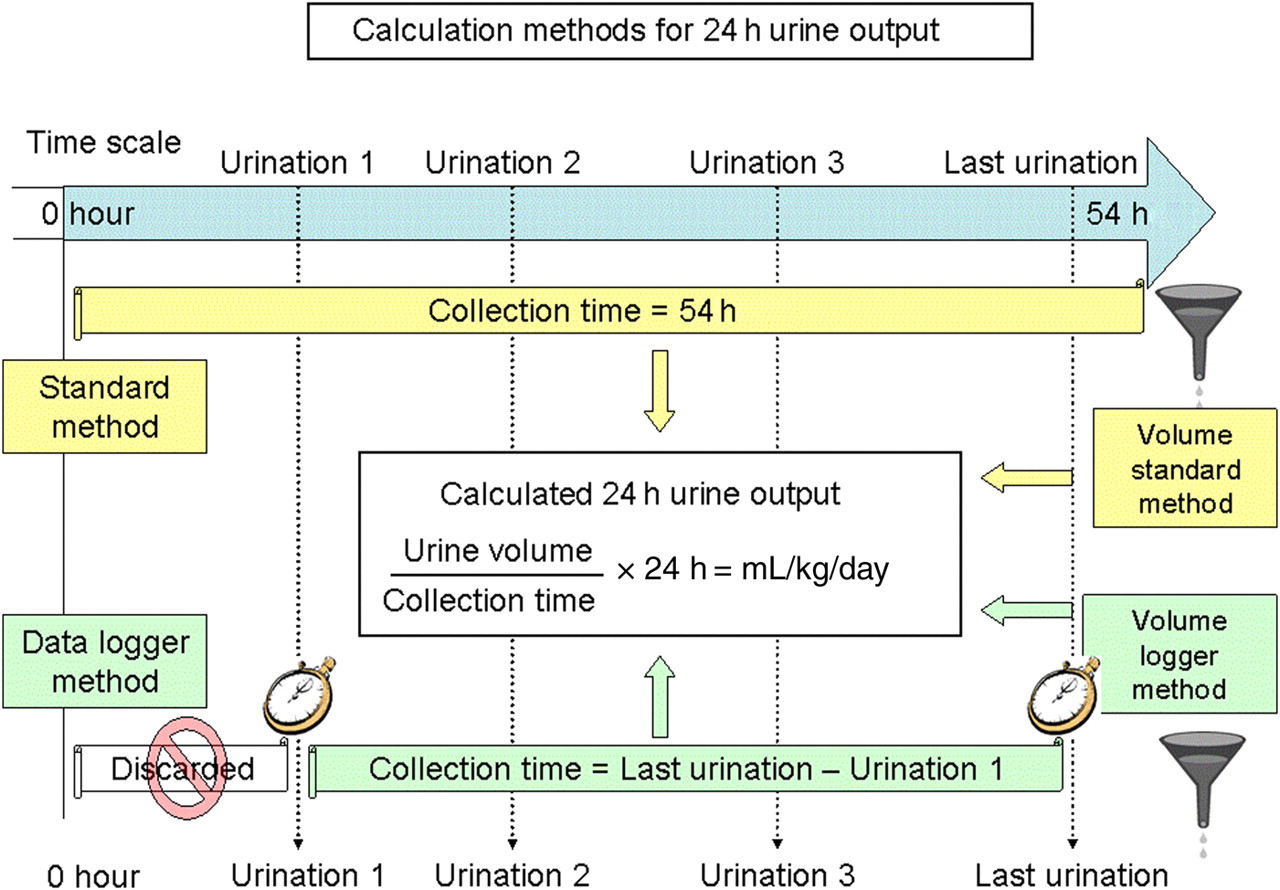
Calculation methods for 24 h urine output. The two methods used to calculate the length of the collection interval are illustrated, for example of a 54 h duration collection with four urinations. The ‘standard method’ uses the total time during which urine was collected and all urine collected in the tray for the calculations. The ‘data logger method’ collection time started after the first urination and finished after the last micturition recorded by the data logger (urine voided during first micturition was discarded)
Comparison of 24 h urine output measurement
Twenty-four-hour urine outputs (results from both methods), urinary specific gravity (USG) and time of urination were recorded in eight cats placed in normal physiological conditions on 11 occasions. Inter- and intra-cat between-day variability was expressed as the coefficient of variation (CV%) of the variable of interest. The mean intra-animal 24 h urine output CV% calculated with the two methods were compared with a Wilcoxon test performed with SPSS (SPSS, version 17; IBM, New York, USA). The number of micturitions per cat and per 24 h was calculated based upon the whole duration of the collection interval. Urine specific gravity was recorded for each sample obtained from recording periods with a single urination. Median USG and interquartile range were reported for each cat. Time of urination was reported and categorized as ‘day’ between 07:00 and 18:59 and as ‘night’ otherwise. The influence of time of urination on USG and volume was investigated with independent sample t-tests.
Measurement of GFR
GFR estimation was made by urinary endogenous creatinine clearances for nine cats on three occasions within a two-month interval. The cats’ weights were recorded during each collection interval. Blood samples were collected by cephalic venepuncture 24 h after beginning the urine collection. Plasma creatinine concentration was determined by an enzymatic method (Vet Test; Idexx, Chalfont St Peter, UK). Urinary creatinine concentration was measured by a colorimetric method using the Jaffe method (Olympus I600, Idexx). A pilot study indicated that urinary creatinine concentrations were significantly (P = 0.04) lower in urine frozen after previous storage for 24 h at room temperature and 48 h at 6°C (32333 ± 4388 µmol/L) compared with urine frozen immediately (33325 ± 4064 µmol/L). A 3% correction factor was therefore applied to measured urine creatinine concentrations. UrECC (mL/min/kg) was calculated using Equation (1):
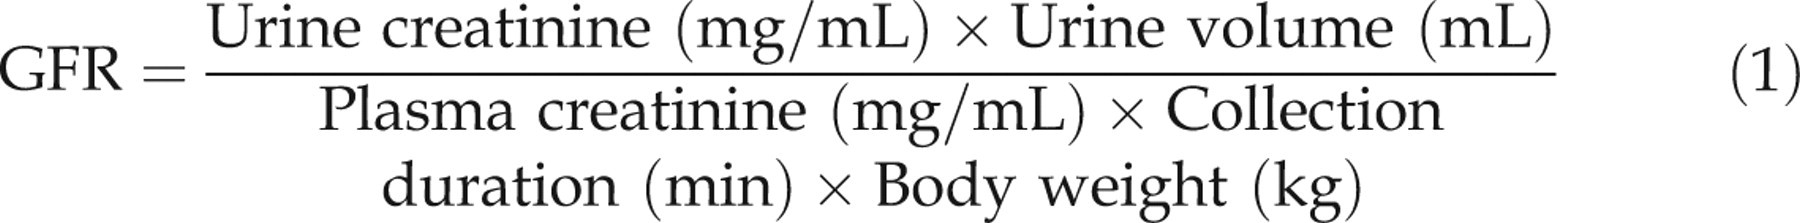
UrECC was reported as mean ± SD for each cat. Intra-cat variability was evaluated by calculating mean maximum difference, residual variance and CV% of the creatinine clearance estimation measured on three occasions for each of the nine cats.
Results
Validation of the collection system
Overall performance
A total of 898 recording sequences were uploaded and analysed. Thirty sequences could not be used for the following reasons, yielding a 96% success rate. Ten samples (1.1%) were contaminated with macroscopic or microscopic blood and 14 samples (1.6%) had faecal contamination. Contaminated samples were discarded and not used for analysis. Four samples (0.4%) were discarded because of human errors and two samples (0.2%) were not collected because two cats urinated (once) out of the tray.
Twenty-four-hour urine outputs could be measured on 203 of 206 occasions, yielding a 98.5% success rate. The three failures comprised two cats which had access to two litter trays because a cage door was inadvertently left open and one cat urinated out of the tray during the last urination of the collection period, precluding calculation of total volume voided. The mean length of collection (±SD) was 35 ± 11.1 h (data logger calculation method). Four collections intervals (2.0%) were shorter than 20 h (14, 14, 15 and 18 h) and 16 intervals (7.8% of total) were between 20 and 24 h. Two cats failed to urinate for 24 h after starting the study. Urine marking behaviour was never observed.
Recovery studies
Urine volume was recovered at rates of 87 ± 1.8%, 83 ± 1.3% and 85 ± 2.7% of total volume for USGs of 1.001, 1.018 and >1.050, respectively. In consequence, volume estimations were corrected to account for a 15% volume loss in the collection system, as feline USG was greater than 1.030. Minimal evaporation occurred as mean ± SD evaporation percentage at 20°C was 0.98 ± 0.04%.
Time accuracy, specificity and sensitivity of the detection system
Based upon video monitoring, the accuracy of temperature peak identification was 1.5 ± 1.0 min and both sensitivity and specificity of the data logger for detecting urination were 100%. The specificity evaluated in vivo was 100%. Indeed, no temperature peak was detected in the absence of urination. In vivo sensitivity was 97.8%, as six temperature peaks out of 270 single urination events recorded were not detected. Of these, two were due to cats urinating out of the tray and four to human error (data logger not inserted/reset).
Agreement between the two calculation methods
For 203 pairs of measurement, the absolute relative volume error between the two calculation methods ranged from 0% to 131%. Median absolute relative [interquartile range] error was 9.1% [3.25–19.8]. Bias was −1.3% and lower and upper limits of agreement were −39.7 and 35.2%, respectively (Figure 4).
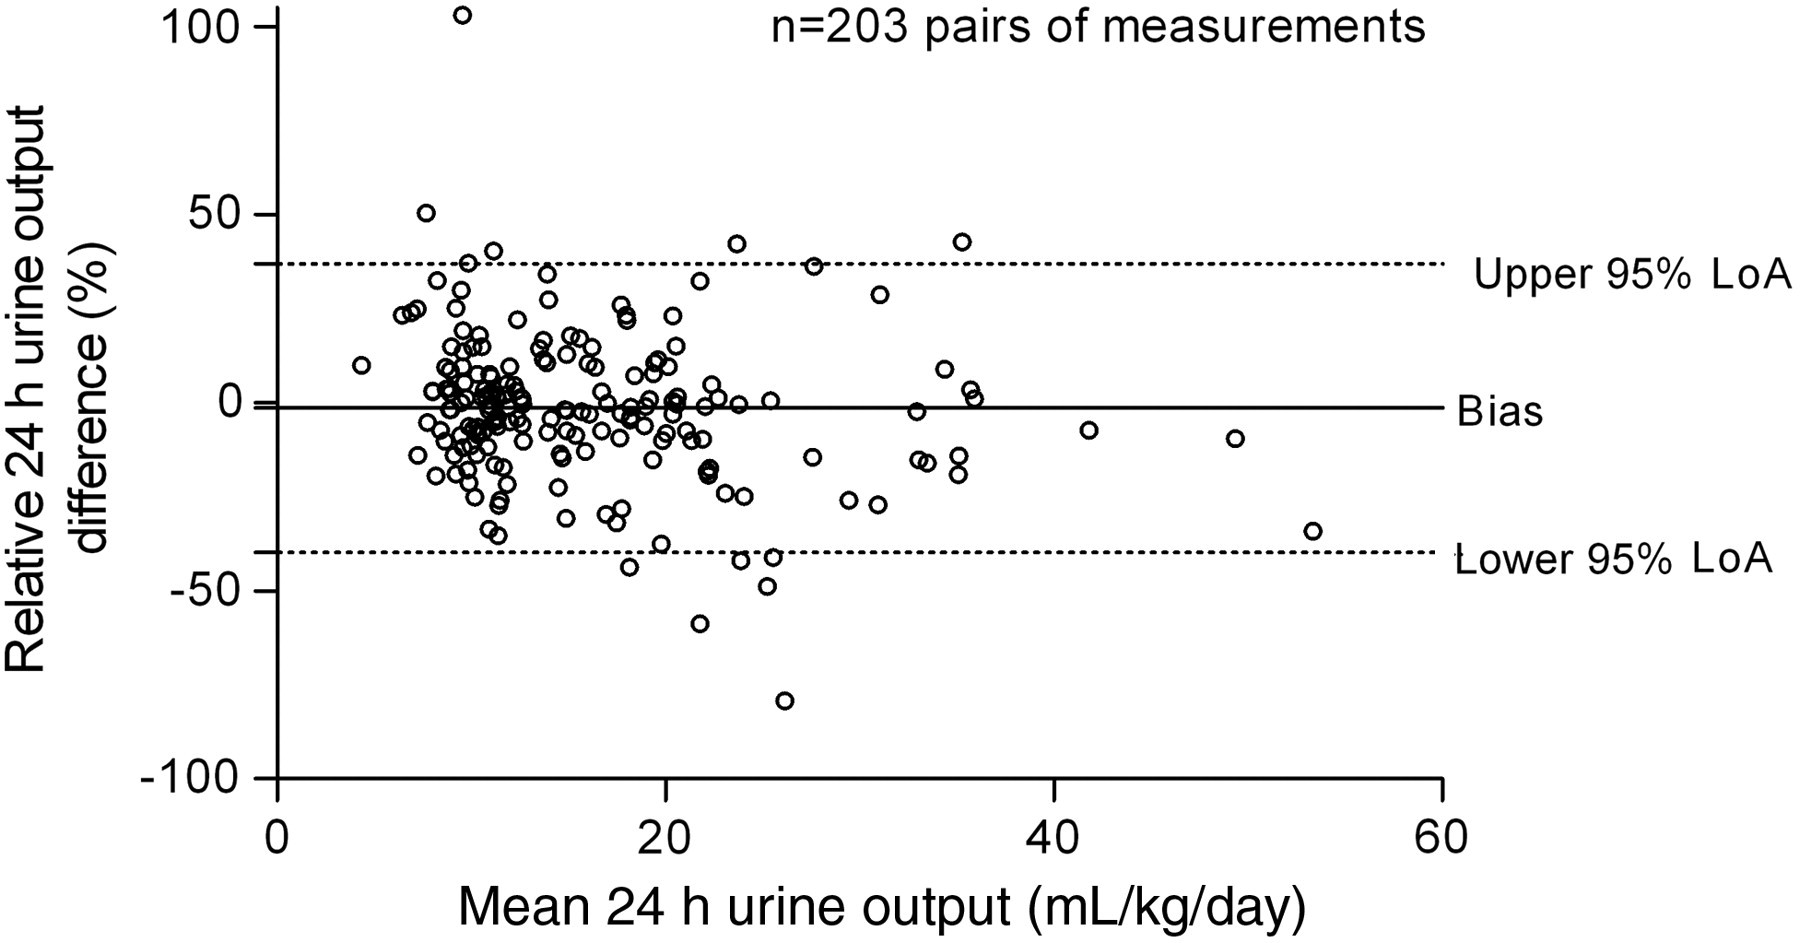
Bland–Altman plot. The figure shows the bias and limits of agreement (LoA) between the two calculations methods used to measure the time of collection (sample size = 203 pairs of measurements). Twenty-four-hour urine output was evaluated with standard method (Vol24h Stand.) and with data logger method (Vol24h Log). The mean of two measurements is plotted on the x-axis [Vol24h Log − Vol24h Stand.]/2. The relative measurement difference (%) is plotted on the y-axis ([Vol24h Log − Vol24h Stand.]/[Vol24h Log])
Information on physiology of urine excretion in the cat
Twenty-four-hour urine output intra- and inter-cat variability
Daily urine outputs were recorded under normal physiological conditions from nine cats on 11 occasions. Individual outputs were calculated with the two methods. For the data logger calculation, method, mean ± SD daily urine output was 12.4 ± 3.30 mL/kg/day (inter-cat CV of 23.6%). The mean intra-cat between-days CV was 16.6 ± 5.6%. For the standard calculation method, mean ±SD daily urine output was 12.3 ± 3.5 mL/kg/day (inter-cat CV of 26.4%). The mean intra-cat between-days CV was 22.2 ± 10.1%. The intra-cat between-days CVs were significantly lower with the data logger method (Wilcoxon signed rank test P = 0.039).
Frequency and distribution of urination over the day
Median [interquartile range] number of urinations per 24 h was 1.5 [1.1–1.9]. Based on single urination events, mean urine volume was 42 ± 24.2 mL, but volumes as large as 126 mL were recorded. Figure 5 illustrates the distribution of the urination times. Of 376 urinations recorded under physiological conditions, 290 (78%) occurred during the day (07:00 to 18:59). The distribution of urination times was bimodal and centred around 08:00 and 15:00.
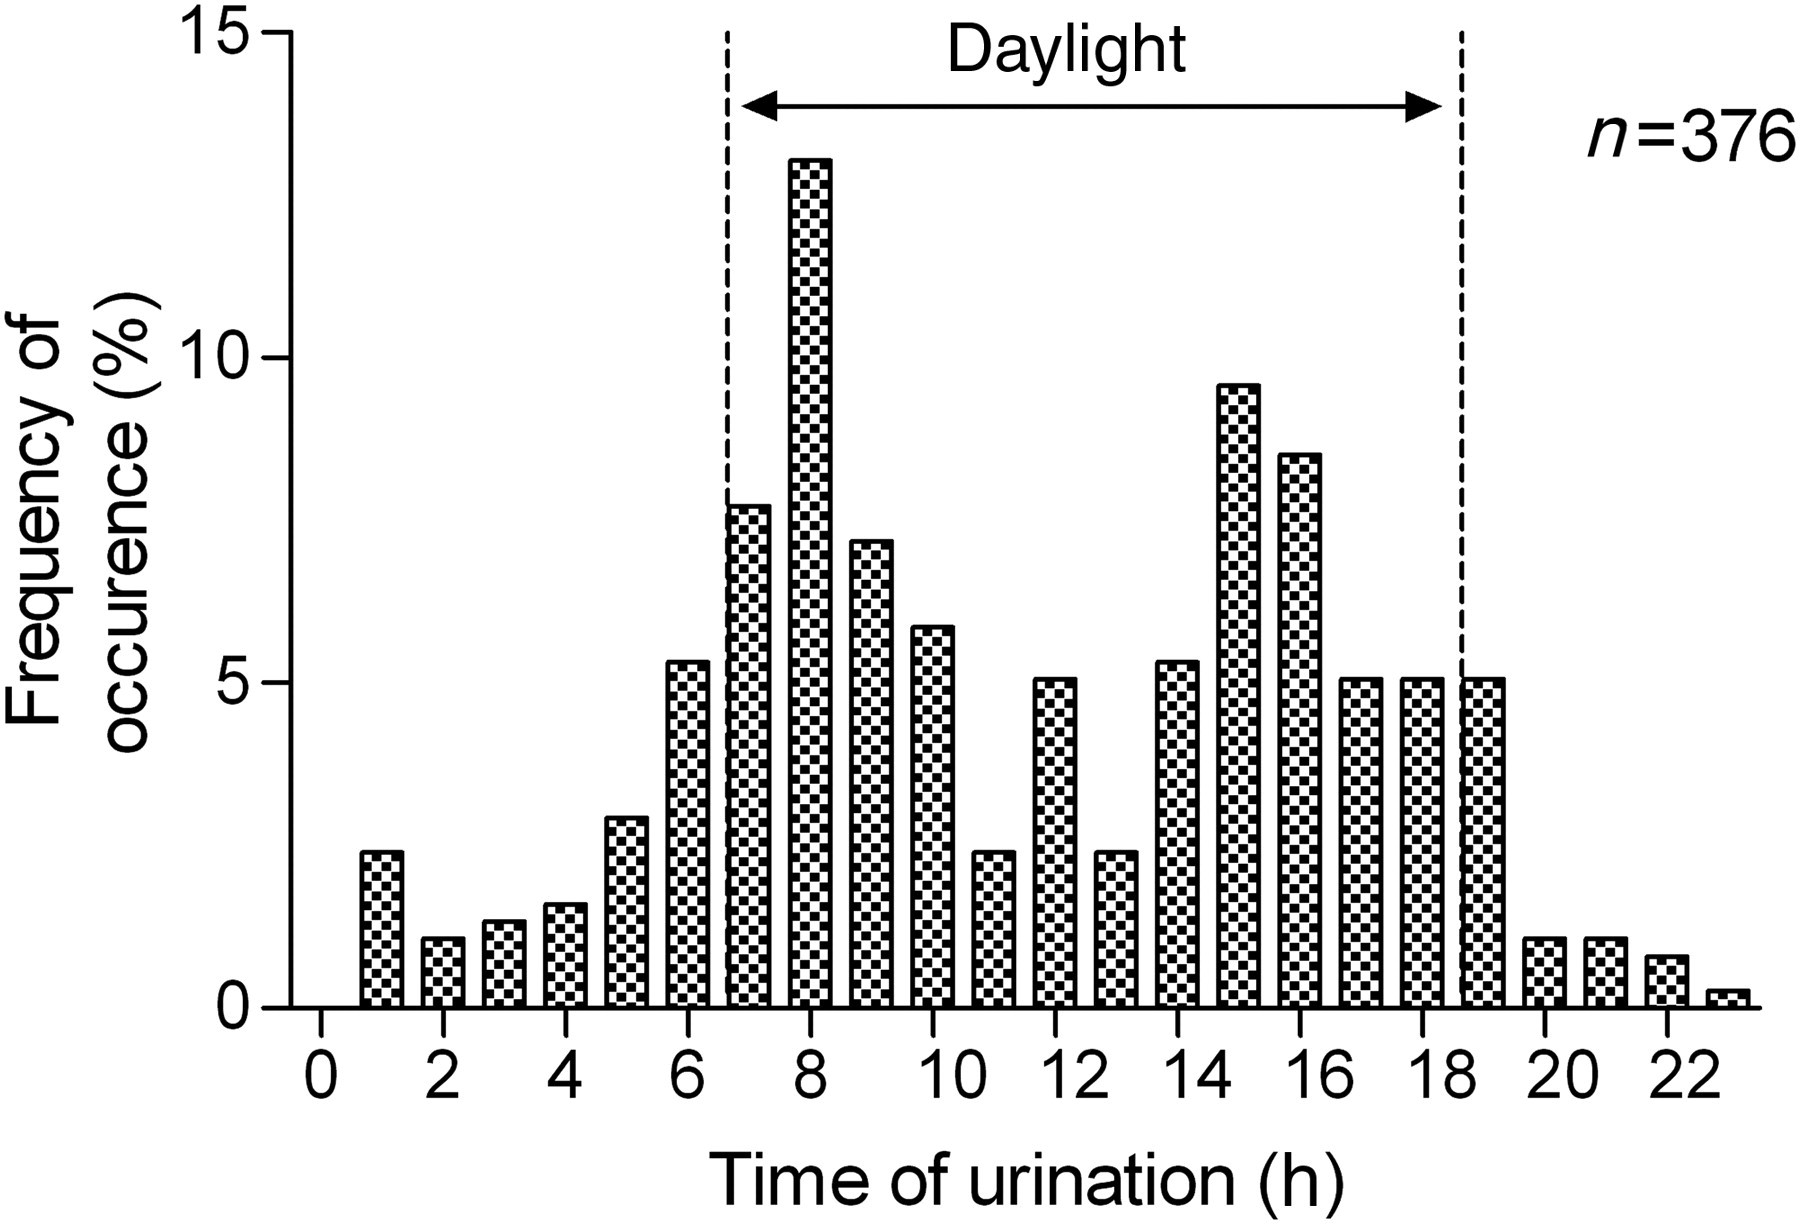
Histogram of the distribution of urination time. The histogram shows a bimodal distribution. The cats were fed twice a day, between 07:30 and 08:00 and between 15:00 and 15:30. A total of 376 urination times were recorded in nine cats
Urine specific gravity
Median USG and interquartile range are represented in Figure 6. Median individual USG ranged from 1.041 to 1.060. For single urination events, there was no significant difference in USG (independent sample t-test P = 0.59) and volume of urine (independent sample t-test, P = 0.69) between diurnal or nocturnal urination. The percentage of urine samples with USG less than 1.035 was 7.5%. Five of the nine cats had occasional values below 1.035 (10 times for cat no. 2, 6 times for cat no. 7 and twice for cat no. 4, 6 and 8). The lowest USG recorded was 1.012 in cat no. 2.
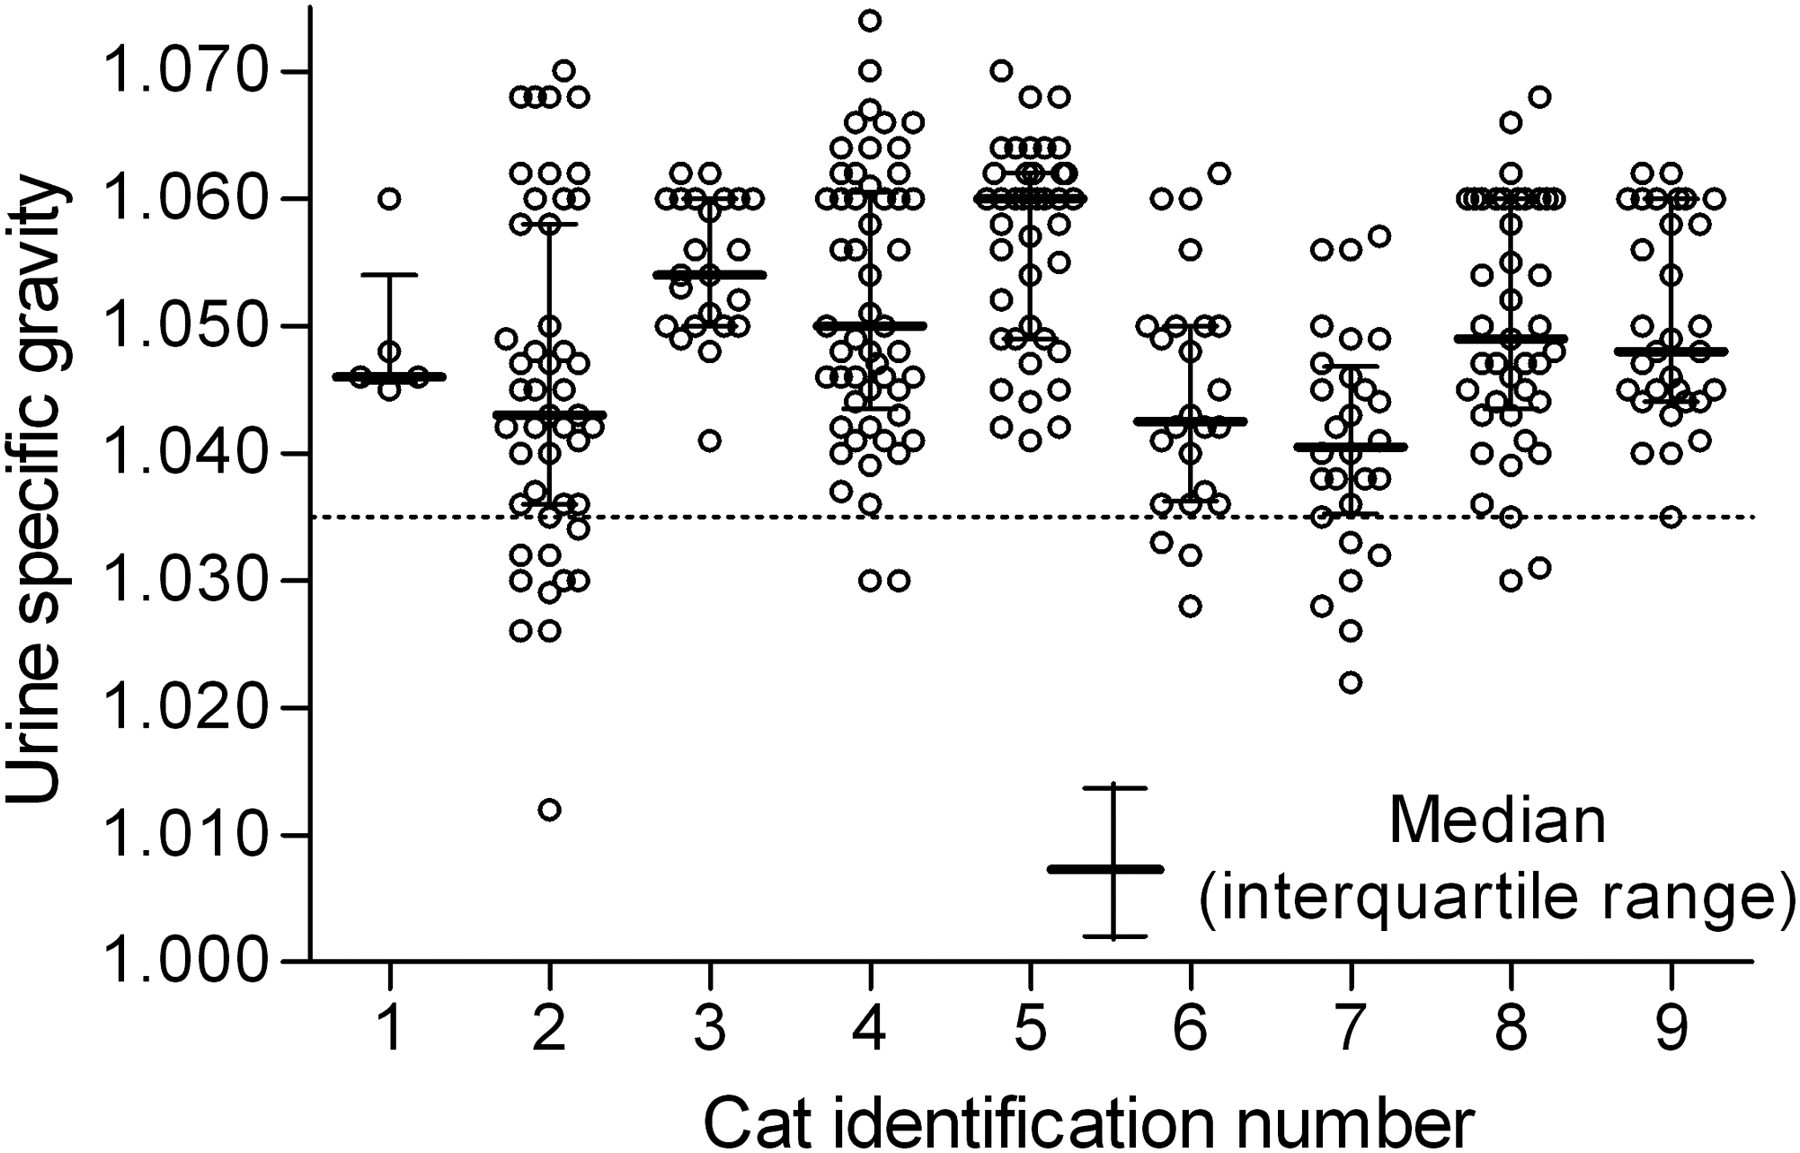
Individual urine specific gravity variation from nine cats under normal physiological conditions. Samples were obtained over nine months. Data are summarized as median and interquartile range. The cut-off point for diluted urine is 1.035 in the feline species (dotted line)
Endogenous urinary creatinine clearance and variability
Based upon data collected in nine normal, healthy cats on three occasions, endogenous creatinine clearance was 1.92 ± 0.37 mL/min/kg. The inter-cat CV was 19.5%. Intra-cat between-occasions CV was 12 ± 6.9%. There was no period effect. Mean variance for the three repeated measurements was 0.114 (range 0.0085–0.4348). The mean maximal inter-occasion difference in clearance within a cat was 0.55 mL/min/kg (range 0.16–1.31 mL/min/kg).
Discussion
The study objective was to develop and validate a feline urine collection system equipped with a time recording device for accurate urine collection and estimation of GFR in the cat. The urine collection system used in this study was well accepted and data logger use significantly reduced intra-animal variability.
A success rate of 96% during 300 cat-days was recorded. This result improves on the previously reported collection success rate of 82%. 12 The cat urinating outside the pan or not urinating at all accounted for 9% of their failures. 13 In the present study, only 0.2% of samples were lost by cats urinating out of the trays. We believe the system interfered minimally with feline micturition and did not affect the cat welfare. Cats are clean animals and readily learn to use a litter box. 12 Inappropriate eliminations can be caused by rejection of the tray or by the cat's aversion to digging and covering in the litter. Cats clearly demonstrate a preference for a specific kind of litter as kinesthetic feedback from the paw seems to play a major role in eliciting the digging–elimination–covering sequence. 12 Preliminary familiarization and training with progressive introduction of the components of the system was crucial to ensure acceptance of the system.
Contamination due to loose faeces spoiled only 1.6% of the samples. Matandos and Franz 13 reported faecal contamination in 6% of collections (3% due to loose faeces contaminating and another 3% due to faeces blocking the drain hole). Loose faeces were occasionally observed in our group of cats. Minimal stress related to individual housing of cats or, more likely, to the experimental protocol may have contributed to the occurrence faecal contamination. We observed occasional macro or microscopic haematuria in 1.1% of collections. This occurred in four cats once and was considered an incidental finding in the absence of other clinical signs. Nevertheless, one of the cats had cystitis associated with frequent emission of small urine volumes and this was responsible for low 24 h urine output estimates in this cat. Inevitably, a higher proportion of the urine volume is retained in the collection system in case of frequent emission of small volumes of urine making the system unreliable in this case. Similarly, Finco et al. 10 reported pollakiuria and haematuria of unknown cause in cats from which urine was collected three times each day. Dysuria may be common in the laboratory cat but often unnoticed and such a collection system would constitute a very sensitive way of detecting subclinical haematuria. 10
Temperature data loggers are used frequently at different stages of the food industry cold chain. They are small, affordable, and simple to use devices which do not require additional wires, recording charts or calibration before use. Their battery life is virtually unlimited when used for intermittent recording. The accuracy of the time detection as well as sensitivity and specificity of urination detection were excellent. A set of two data loggers per cat is required to ensure a smooth changeover at the end of each 12 h collection. The data loggers allowed precise automated identification of the urination time. The need for a technician constantly looking at a video monitoring system during day and night is no longer warranted, resulting in reduced out-of-hours workload and cost.
Several sources of variability may influence the accuracy of the data obtained in renal function studies. Interindividual variability is characteristic of the studied population of healthy cats and has to be quantified. Intraindividual variability due to variations in water intake or water loss during the day cannot be reduced, but efforts should be made towards limiting measurement error or fluctuation of baseline measurement as they contribute to unwanted variability nested within the intra-animal variability. The knowledge of precise micturition time increased the accuracy and precision of urine collection and significantly decreased the mean within-cat between-day measurement error. The relative standard deviation of the time error between the two measurement techniques was 19.6% (bias −1.3%, limits of agreement of −39.7% and 35.2%), whereas the average intra-animal between-days relative standard deviation was 16.6%. The error corrected by the use of the loggers was superior to the intra-animal variability. In other terms, the discriminative power (signal to noise ratio) was increased by a factor of two when loggers were used. For example, a genuine 50% increase in baseline value for a given cat would only be confidently detected if the baseline value increased by 100% and therefore a more intensive experimental stimulus would be required to detect an increase. High detection sensitivity is critical for the safety of the animal, if the slope of the relationship between probability of incidence of adverse effects versus stimulus intensity curve is steep. This is particularity true in case of a repeated measurement experimental design.
The present study has provided valuable physiological information, relevant to the monitoring of renal function in a colony of healthy cats. The data provide a physiological baseline for future investigation of renal function in response to therapeutic or dietary intervention. Mean (±SD) 24 h urine output was 12.4 ± 3.3 mL/kg measured with the data loggers. This compares well with the reported normal urine production of 10–20 mL/kg/24 h 14 in the cat. Similarly, Finco et al. 10 reported urine output of 51.1 mL/day/cat (body weight around 4.0 kg) in cats housed individually in stainless steel cages with periodical access to food.
The bimodal distribution of the urination times may be a consequence of stimulation to micturate related to peaks of human interaction in the morning (meal, training, sampling and change of litter trays) and in the afternoon (training and meal). Our reported number of urinations per 24 h was low, on average of 1.5 per day. Finco et al. 10 reported a median frequency of urination between two and three per 24 h for cats kept in comparable conditions.
Values of USG below 1.035 are considered minimally concentrated in the cat. 15 Low USG values were occasionally obtained in some cats but this was not attributable to pathological polyuria or polydypsia. In the dog, urine collected in the morning had higher USG than evening samples. 16 Based on our data, this was not the case for the cat. For some cats, increased water drinking was observed when they were isolated from others during urine collection but this was not quantified. This was followed by emission or large volumes of urine of low USG (between 1.012 and 1.020), whereas USG returned to normal in subsequently collection in the same cat. It seems possible, although never reported, that boredom induced psychogenic polydypsia occurred in these cases.
The mean urine endogenous creatinine clearance measured in nine cats on three occasions was 1.9 ± 0.37 mL/min/kg under the experimental conditions. This value was slightly lower than previously reported in kittens and young cats (2.3 ± 0.50 mL/min/kg) with UrECC. 3 Sequential 24 h endogenous creatinine clearance values in single cats sometimes differed, possibly due to biological variation. Although the reported 24 h urinary output in this study is consistent with values from the literature, UrECC reported in the present study was lower than in other investigations. 10,14 The mean urinary clearance of endogenous creatinine was 2.64 ± 0.22 mL/min/kg in normal cats when urinary catheters were used. 17 Incomplete urine collection may have occurred in our study for two reasons. 4 Average urine volume lost was calculated under standardized conditions but not for each urination. Although small, absorption of urine on the pellets may depend on the volume voided at once and the thickness of litter layer. Additionally, errors might have resulted from the assumption that, for a given cat, the percentage loss was proportional to the voided volume. The calculation of endogenous creatinine clearance relies on the assumption that cats completely emptied their bladder at each urination. This is acceptable if the residual volume after the first and last urinations are comparable, but we believe the relative error introduced by this assumption is minimized in longer collection intervals (3–4 recording sequences after first urination). It is difficult to verify this assumption, although mathematical recurrent models have been developed to calculate residual urine after urination. 18 An exogenous marker, such as para-amino benzoic acid, could be administered to cats and measured concomitantly with endogenous creatinine to verify the completeness of the urine collection and residual bladder volume. 18,19
Several techniques have been developed to measure GFR in the cat (Table 1). Plasma clearance methods are the most popular and rely on measurement of clearance of plasma inulin, iohexol or exogenous creatinine administered by the intravenous route. 20–22 These require serial blood sampling (ideally 3 or more) and are therefore invasive. GFR estimation by UrECC (1.92 ± 0.37 mL/min/kg) in this study yielded lower values than the plasma inulin clearance (2.72 ± 0.12 to 3.63 ± 0.67 mL/min/kg), urine exogenous creatinine clearance (2.74 ± 0.04 mL/min/kg) and plasma exogenous creatinine clearance (2.3 ± 0.66 mL/min/kg). 20,22 This might imply a contribution of non-renal routes of elimination to the plasma clearances of these substances or underestimation by our technique. Nevertheless, our mean value was higher than that provided by plasma iohexol clearance (1.70 ± 0.40 to 1.83 ± 0.56 mL/min/kg). 22 Reproducibility of GFR measurement with the UrECC used here was at least as good, if not better, than with plasma exogenous creatinine clearance, as residual variance, intra-cat CV and mean maximal difference were somewhat lower (Table 1). This may imply that the inaccuracies related to the assumptions previously made (correction factor for urine volume, loss of creatinine during freezing and volume after urine voiding) may not affect significantly reproducibility or that other more invasive GFR measurement methods like plasma exogenous creatinine clearance also have comparable inaccuracies. Finally, regardless that their absolute values were possibly lower than the ones obtained by other comparable urinary clearance techniques, the GFR estimations obtained with our system would have comparative value in a crossover designed study, where relative changes are monitored.
Reported GFR mean ± SD and reproducibility of GFR measurement by various plasma and urinary clearance methods in the cat with normal renal function (adapted from van Hoek et al. 22 )
GFR: glomerular filtration rate
Within animal interoccasion reproducibility = RV (residual variance); CV%, mean within-animal coefficient of variation (with CV% = SD × 100/mean); MMD: mean maximal difference (in mL/min/kg) within-cat between occasion
*Data from the present study
In conclusion, the collection system rendered possible the collection of uncontaminated urine, without direct intervention or invasion and minimal labour. Urine collection was made under non-stressful, physiologically relevant circumstances enabling us to measure 24 h urinary output in a species appropriate environment and with minimal consequences on the cats’ welfare. The collection system was convenient, simple in design, affordable and almost complete in terms of harvested volumes. It improved 24 h urine collection in the laboratory cat by significantly reducing intra-animal variability, allowing better statistical power for studies with a crossover design. The urine collection system described in this study will be useful in renal or nutritional research investigations in the feline species. It can also be used in studies involving the measurement of urinary biomarkers over 24 h periods. The method might be somewhat less practical to use under hospital conditions because of the familiarization required. Nevertheless, the system can be useful to facilitate urine collection for veterinary diagnosis at home, for example in patients with diabetes mellitus or kidney disease.
Footnotes
ACKNOWLEDGEMENTS
The authors gratefully acknowledge the technical assistance of Hester Taylor and Fran Baddeley. This study was supported by BBSRC and Novartis Animal Health by a CASE award to L Pelligand. Professor Lees and Professor Elliott have acted as consultants for several drug companies.