
Abstract
Non-invasive imaging methods like echocardiography and magnetic resonance imaging (MRI) are very valuable in longitudinal follow-up studies of cardiac function in small animals. To be able to compare results from studies using different methods, and explain possible differences, it is important to know the agreement between these methods. As both self-gated high-field MRI and high-frequency echocardiography (hf-echo) M-mode are potential methods for evaluation of left ventricular (LV) function in healthy mice, our aim was to assess the agreement between these two methods. Fifteen healthy female C57BL/6J mice underwent both self-gated MRI and hf-echo during the same session of light isoflurane anaesthesia. LV dimensions were estimated offline, and agreement between the methods and reproducibility for the two methods assessed using Bland–Altman methods. In summary, hf-echo M-mode had better inter-observer repeatability than self-gated MRI for all measured parameters. Compared with hf-echo, systolic posterior wall thicknesses were significantly higher when measured by MRI, while diastolic anterior wall thicknesses were found to be significantly smaller. MRI measurements of diastolic LV diameter were also higher using MRI, resulting in larger fractional shortening values compared with the values obtained by hf-echo. In conclusion, hf-echo M-mode is easy to apply, has high temporal and spatial resolution, and good reproducibility. Self-gated MRI might be advantageous in cases of abnormal LV geometry and heterogeneous regional myocardial function, especially with improvements in spatial resolution. The moderate agreement between the methods must be taken into account when comparing studies using the two modalities.
Non-invasive tools for precise functional and structural in vivo phenotyping of the left ventricle (LV) are essential when using small animals as models for human cardiovascular disease. 1 Specialized imaging systems are needed due to the small size and the high heart rates, and both magnetic resonance imaging (MRI) and echocardiography are currently potential tools. While conventional ultrasound imaging uses probes with centre frequencies up to 15 MHz, high-frequency transducers (30–60 MHz) have recently become available, and high-frequency echocardiography (hf-echo) has been shown to give accurate and reproducible measurements. 2,3 Echocardiography has the benefits of being rapid and flexible, and the cost is relatively low. However, image artefacts and/or restricted imaging windows are frequent challenges, and the observer dependency is substantial. Cardiac MRI can on the other hand give high-quality images of the beating heart in almost any orientation, but is more time-consuming and has a higher cost. As in human MRI, ECG triggering is necessary to acquire dynamic images, and ECG pads or needles can be used. Obtaining an adequate signal using pads can be challenging, while needles are undesirable, especially in immunodeficient animals or animals subjected to an exercise-training programme. To overcome this limitation, a sequence has been designed which allows retrospective self-gating for dynamic cine imaging. 4,5 The gating signals are acquired simultaneously with the image data, and by utilizing time-dependent changes in the MR signal, a trace representative of cardiac motion can be reconstructed, equivalent to the surface ECG. Respiratory motion can be accounted for in a similar manner, if necessary. 4,5
As both echocardiography and MRI are attractive tools for serial cardiac phenotyping in small animals, it is important to know the agreement between these methods to compare results from different studies. A previous study in rats concluded that one should be cautious when comparing functional two-dimensional (2D) measurements from MRI and 2D echo, 6 while a study in mice concluded that agreement between reconstructed 3D echocardiography and MRI was excellent. 7 In human studies, cardiac MRI has been reported to give larger end-diastolic volumes than transthoracic echocardiography, especially when intravenous contrast bubbles are not used. 8 The cause of the difference is multifactorial, but the intermodality difference in contour detection in the endocardial/trabecular zone is important. 9,10
Compared with 2D echocardiography, the 1D M-mode is a valuable tool due to its superior temporal and spatial resolution, and it is still the recommended way to quantify LV dimensions in various clinical settings, e.g. for timing of surgery in valvular heart disease. 11 The main drawbacks are the susceptibility to misalignment and the potential for errors in conditions with regional dysfunction. Although 1D measurements might seem like a step backwards compared with the presently available 3D methods, such measurements are truly important because they can illustrate the basic differences between methods, which would also affect measurements made in 2D or 3D. As both hf-echo M-mode and self-gated MRI might be suited for cardiac phenotyping in mice, the aim of our study was to evaluate the agreement between 1D measurements of LV dimension and function from these two methods. Our hypothesis was that the agreement between the methods would be good enough for results to be directly comparable across studies using the two methods.
Materials and methods
Animals
Sixteen conventional female C57BL/6JBom Tac mice (weight 24.1±1.5 g at 17 weeks of age; Møllegaards Breeding Centre, Lille Skensved, Denmark) were included. The animals were housed in an open standard cage system (5 mice/cage) in a temperature-controlled room (21.0±2.0°C), relative humidity 55.0±4.0% and 20 air shifts/hour, with a 12:12 h light–dark cycle. The mice were allowed free access to a pellet rodent diet (RM1 Scanbur, Oslo, Norway) and water, and supervised by animal caretakers every 24 h. Bedding and nesting material were changed every third day (Scanbur Bedding and Sizzle Nest, Scanbur, Oslo, Norway). The mice were sacrificed two weeks after the experiment by cervical dislocation in deep isoflurane anaesthesia. Hearts were examined postmortem by weight and histology to confirm normal LV status. The Norwegian Council for Animal Research approved the experimental protocol, which closely conforms to NIH guidelines (NIH publication No. 85–23, revised 1996). All experiments were performed during the animals' dark cycle to avoid disturbances in their diurnal rhythm. Prior to the experiments in the present study, the animals had participated in a randomized controlled exercise intervention study, with an eight-week exercise period starting at the age of nine weeks. Thus, they were 17 weeks old at the time of the present study. The experimental protocol for the present study was performed on three consecutive days, with each mouse participating only once.
Experimental protocol
The mice were anaesthetized with inhalation of 1.5–2.75% isoflurane (Forene, Abbott, Solna, Sweden) in oxygen, 800 mL/min for both imaging modalities. The anaesthetic level was adjusted to a stable respiration rate of 90–100 breaths per minute. MRI and hf-echo were performed during the same anaesthetic session, and the animals were randomly assigned to have either MRI or hf-echo first. A rectal probe registered core temperature, which was held stable at 37.0±0.5°C. Additional warming was provided by an air heating system for MRI (SA Instruments, Inc, Stony Brook, NY, USA), an electrical heating pad (Indus Instruments, Webster, TX, USA) and a heating lamp for hf-echo. Respiration during MRI was recorded by using a pressure-sensitive pillow under the abdomen (SA Instruments, Inc), while during hf-echo an integrated sensor in the heating pad provided this information. During hf-echo, the ECG signal was recorded by attaching the limbs to electrodes integrated in the heating pad, with addition of electrically conductive gel. For MRI the heart rate was determined from the temporal oscillating navigator signal that results from the retrospective gating procedure. 5 Animals were moved between the two modalities in less than 30 s to avoid waking them up. The total examination time for both modalities was less than one hour for the majority of animals. Anaesthetizing the animal and acquiring the parasternal M-mode was accomplished in 10 min in all animals, while the initial preparation (including scout images) and acquisition of a 2D cine image in MRI took approximately 15 min. As the animals were undergoing an exercise intervention, the rest of the examination time was used to make other relevant recordings. The physiological state during recording was monitored by temperature, respiration rate and heart frequency. After anaesthesia the animals were observed until they were moving freely in the cage.
Magnetic resonance imaging
MRI was performed on a 7 T horizontal magnet system (Biospec 70/20AS, Bruker Biospin MRI GmbH, Ettlingen, Germany) using a FLASH sequence with retrospective gating (Intragate). 5 Retrospective gating provides a steady-state condition, which enables full temporal coverage of the R–R interval. The animals were examined in the prone position on a surface heart coil (Rapid Biomedical GmbH, Rimpar, Germany). Anaesthesia was controlled with a rodent ventilator (model 683, Harvard Apparatus, Holliston, MA, USA). After an initial preparation of the scanner settings and acquisition of scout images, a midventricular short-axis cine movie (15 frames/beat) was acquired using the following settings: TE = 3 ms, TR = 6 ms, flip angle = 15°, FOV = 35 × 35 mm2, matrix size = 128 × 128, slice thickness = 1 mm, implying a voxel resolution of 273 × 273 × 1000 µm3. MRI images were analysed using ImageJ software (NIH, Bethesda, MD, USA), where LV diameter and thickness of the anterior and posterior walls were measured along the lines indicated in Figure 1. End-systole was defined as the timeframe with the smallest LV diameter.
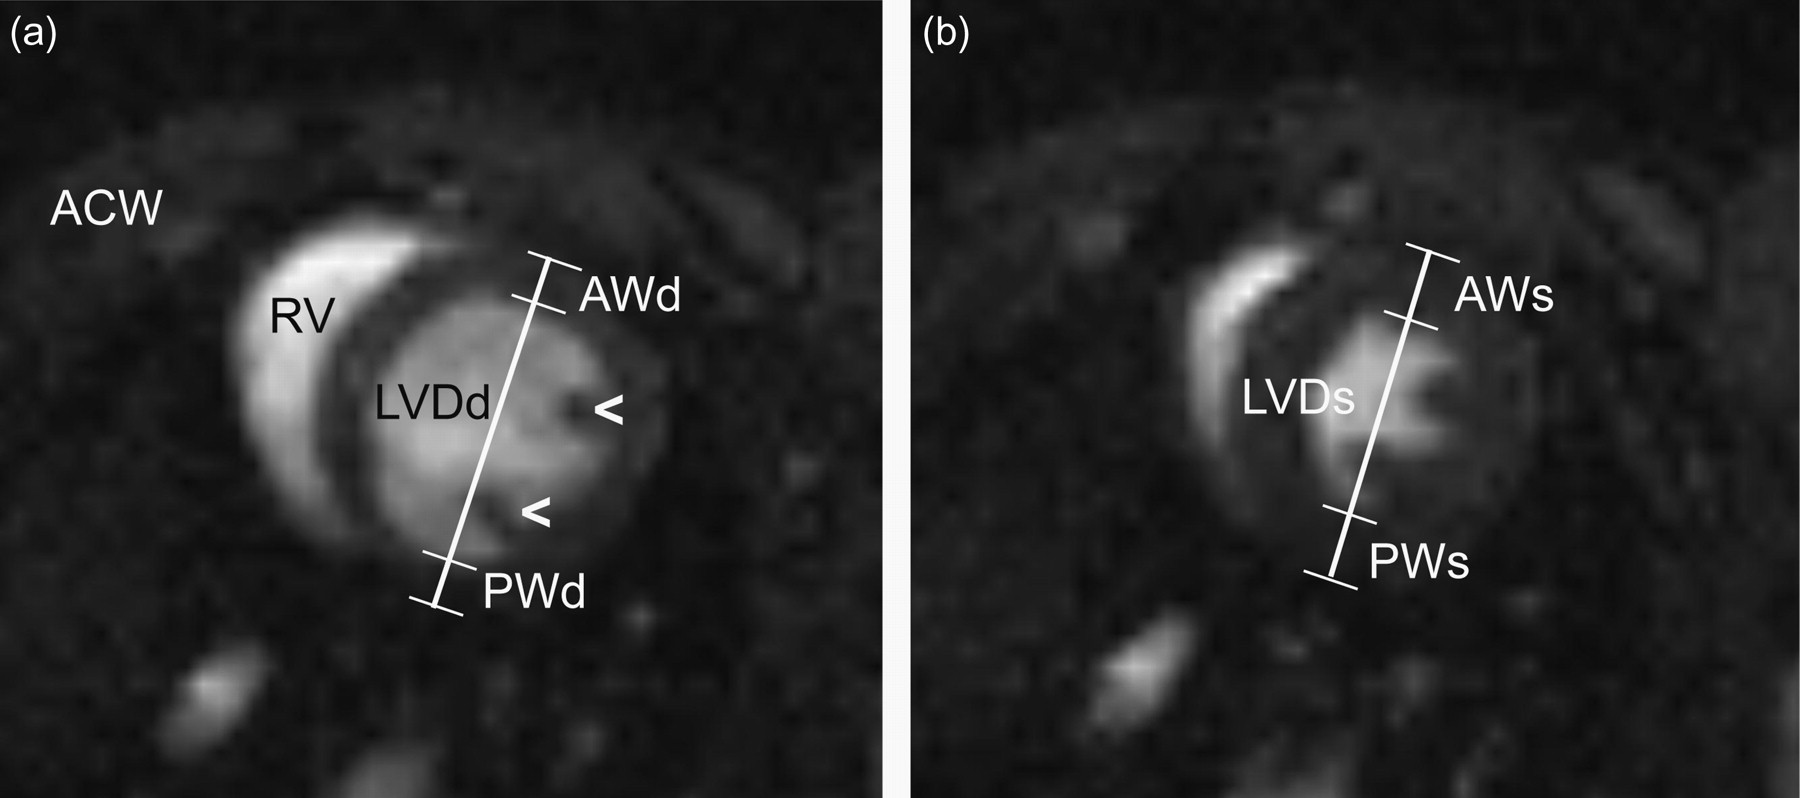
Representative high-field MR images of the heart in a short-axis view. The image is positioned in the middle of the left ventricle, as a cross-section, just above the insertion of the papillary muscles (arrowheads) into the left ventricular wall. The anterior chest wall (ACW) is in the uppermost part of the image. The left ventricle is circular, while the right ventricle (RV) is crescent-shaped. Anterior wall thickness (AW), posterior wall thickness (PW) and left ventricular internal diameter (LVD) were measured according to the position of the white callipers, in end-diastole (d) (a) and end-systole (s) (b). In magnetic resonance imaging (MRI), image contrast is created by the different density of hydrogen nuclei in different tissues, and for this specific MRI sequence (FLASH) the result is high signal intensity in the blood-filled ventricles, and low intensity in the surrounding myocardium
High-frequency echocardiography
The animals were examined in supine position after careful removal of chest fur using depilatory cream. Anaesthesia was controlled using a Visual Sonics Vevo compact anaesthesia system (Visual Sonics, Toronto, ON, Canada). Images were obtained using a Visualsonics Vevo 770 (Visual Sonics) with a mechanical circular transducer (RMV712) (centre frequency 35 MHz, focal length 9.0 mm, f-number 3.0, radial resolution 55 µm). LV dimensions were measured by an M-mode (temporal resolution 1000 lines/s) positioned at the largest diameter in a parasternal short-axis midventricular view, just above the uppermost insertion of the papillary muscles into the walls, similar to the slice position in MRI (Figure 2). The position of the M-mode line was carefully controlled in both long- and short-axis to avoid misalignment or inclusion of papillary muscles or the right ventricular free wall, and a circular appearance of the LV in short-axis was obtained before going from 2D B-mode to M-mode. All hf-echo data analyses and calculations were performed offline using the software Vevo 770 Version 2.3.0 (Visual Sonics). Measurements were performed as indicated in Figure 2. End-systolic measurements were performed at the time of the maximal anterior wall thickness, according to current guidelines. 5,11
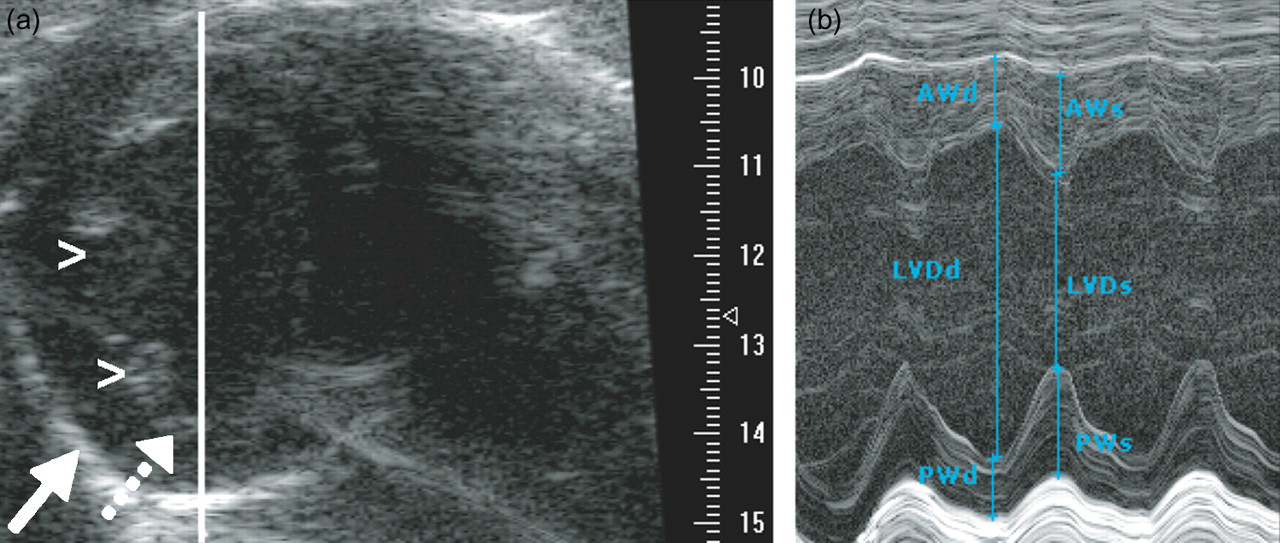
Representative high-frequency echocardiograms of the left ventricle. (a) A B-mode greyscale image is displayed, in a similar short-axis orientation as in Figure 1. Compared with Figure 1, the short-axis view is mirrored, with the two papillary muscles on the left (arrowheads). Image contrast is created by ultrasound reflected at the interfaces between tissues with different density, showing the endocardium as a narrow grey line (dotted arrow), and the pericardium as a brighter white structure (solid arrow). The right ventricle is not visible due to insufficient size of the acoustic window (rib or lung shadow). The solid white line shows the position in the left ventricle where the M-mode recording was acquired. The scale on the right-hand side shows image depth in mm. (b) In the M-mode, ultrasound is only sent out and received along a single line, and the motion of the reflecting structures along this line is displayed as a function of time on the horizontal axis. This gives superior temporal resolution, at the cost of achieving only one-dimensional measurements. Anterior wall thickness (AW), posterior wall thickness (PW) and left ventricular internal diameter (LVD) were measured in end-diastole (d) and end-systole (s)
Statistics
Values are reported as mean (SD). Agreement between the methods was evaluated using Bland–Altman plots and calculation of the 95% limits of agreement. 12 Inter-observer repeatability for each method was calculated as the coefficient of repeatability (COR: 2 SD of the differences between measurements made by two independent observers). Mean values were compared using a paired samples t-test (two-tailed), and a P < 0.05 was considered a marker of statistical significance. Regarding sample size, the animals were participating in a randomized controlled exercise intervention study, and the sample size was calculated to have satisfactory power to demonstrate a difference in maximal oxygen consumption between two groups exercising at different aerobic intensities.
Results
The agreement between hf-echo M-mode and self-gated MRI for all variables is shown in Table 1 and Figure 3. Hf-echo measured lower LV diameters in end-diastole, but not in end-systole, relative to MRI (Table 1). This resulted in a higher fractional shortening with MRI (P < 0.05). Correspondingly, hf-echo tended to measure larger end-diastolic wall thicknesses, both in the anterior and posterior walls (P < 0.05 only for the anterior wall). In end-systole, hf-echo measured lower wall thickness in the posterior wall, while there was no difference in the anterior wall.
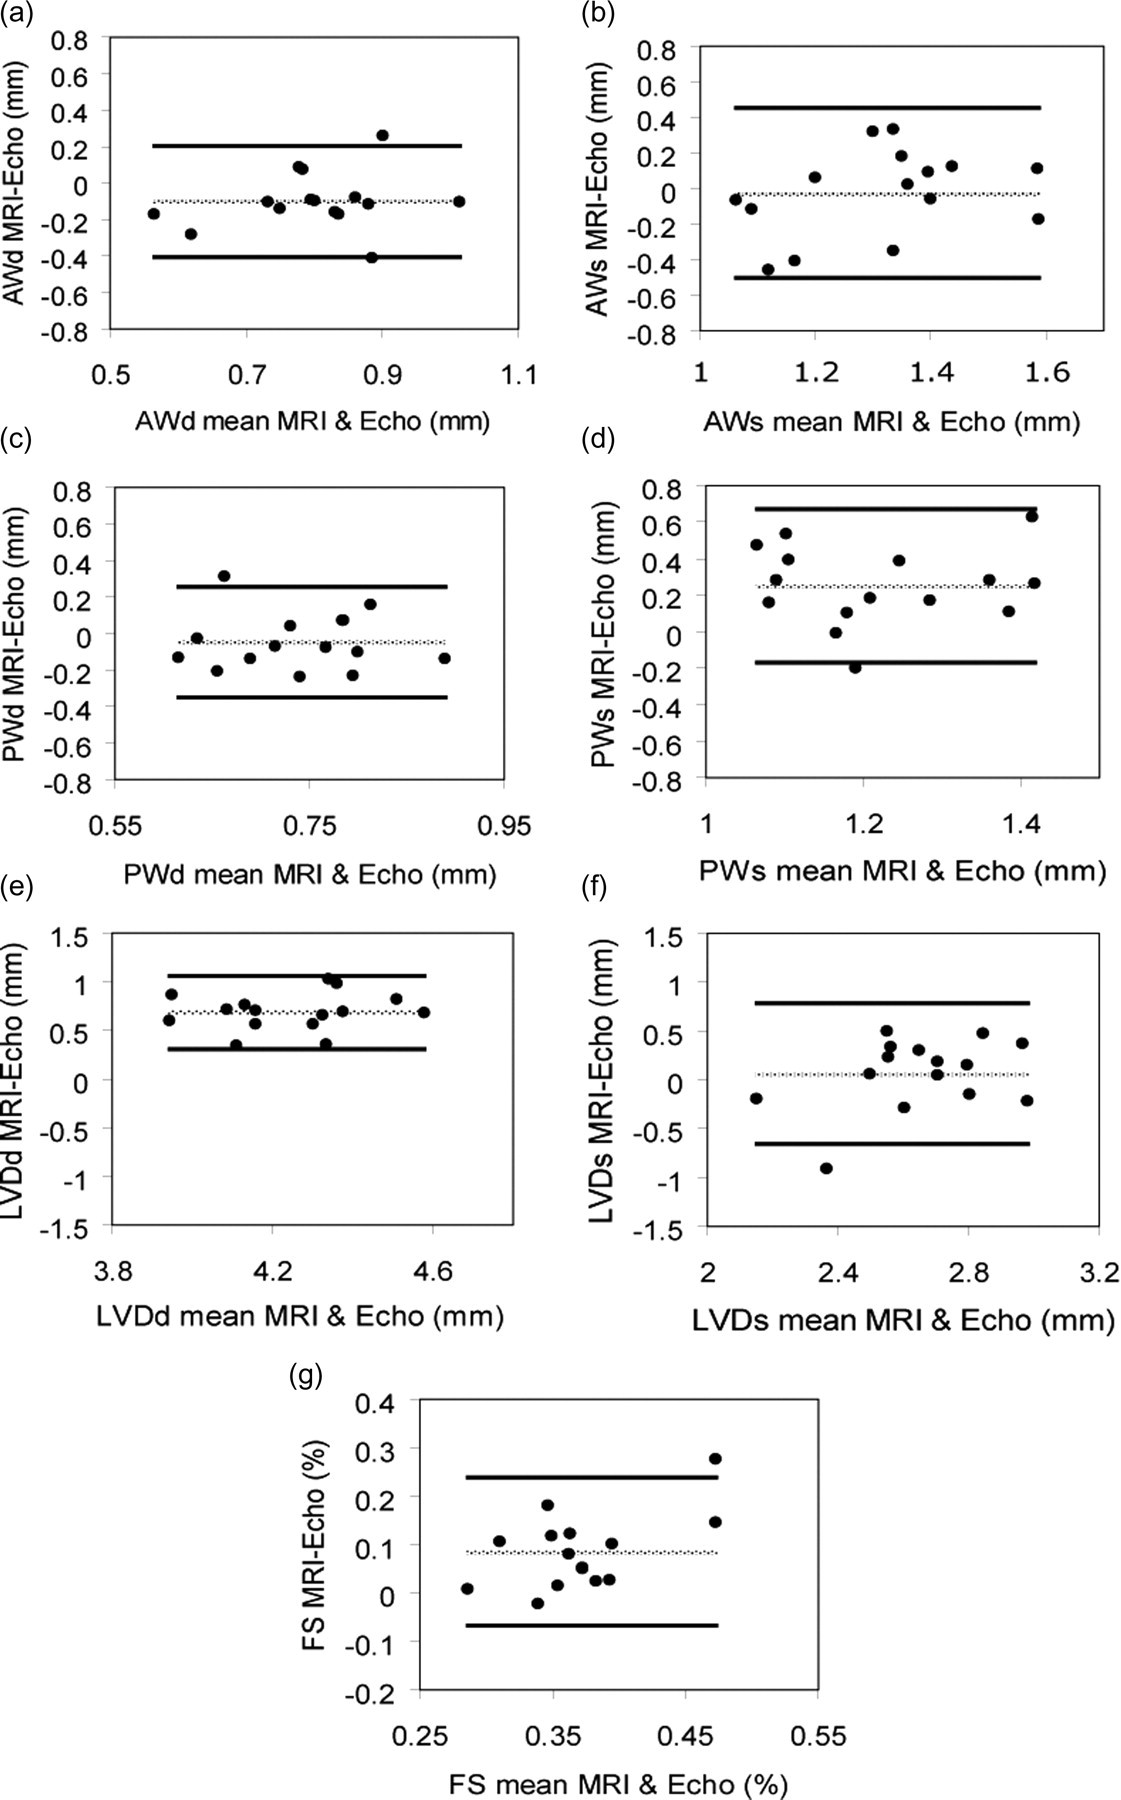
Bland–Altman plots illustrating the agreement between high-frequency echocardiography (hf-echo) and self-gated magnetic resonance imaging (MRI) for anterior wall thickness in end-diastole (AWd) (a), and end-systole (AWs) (b), posterior wall thickness in end-diastole (PWd) (c) and end-systole (PWs) (d), LV diameter in end-diastole (LVDd) (e) and end-systole (LVDs) (f) and fractional shortening of the LV (FS) (g). The dotted line indicates the mean difference, while solid lines indicate mean ± 1.96 SD of the differences
Left ventricular measurements by self-gated MRI and hf-echo M-mode
AW: anterior wall thickness; PW: posterior wall thickness; LVD: LV diameter; d: end-diastole; s: end-systole; hf-echo: high-frequency echocardiography; MRI: magnetic resonance imaging
Fractional shortening (FS) of the LV is given by FS = (LVDd–LVDs)/LVDd. Values are mean (SD). The two most right-hand columns show the inter-observer coefficient of repeatability (COR) for MRI and hf-echo. Measurements are obtained in all but one animal, n = 15
*P < 0.05 for comparison between MRI and hf-echo
Inter-observer COR was better for hf-echo compared with MRI for all variables (Table 1). When compared with the absolute average values, COR for end-diastolic LV diameter was better than for the wall thickness variables.
There was no significant difference in respiration rate during MRI and hf-echo (96 [14] versus 94 [15] minute−1). On the other hand, heart rate was significantly higher during MRI than during hf-echo (543 [46] versus 447 [46] minute−1, P < 0.01).
Discussion
The present study shows that there is moderate agreement between hf-echo and self-gated MRI for 1D quantification of LV function in mice. In accordance with earlier studies in humans, we found that end-diastolic, but not end-systolic, LV dimension was larger when measured by MRI than by hf-echo. 8 The reproducibility of measurements made on acquired images was better for hf-echo.
In the present study, we used self-gated MRI in single-slice 2D mode, but we only made measurements along one dimension (anteroposterior), thus omitting some of the information in the image. This approach was chosen such that we were able to compare the measurements directly with those obtained using hf-echo M-mode, which is a 1D method. Using a mechanical, single-element hf-echo transducer, as we did in the present study, gives a 2D (B-mode) image with relatively low spatial and temporal resolution, unless the image is acquired over several heart cycles by ECG gating. The 1D approach gives valid measurements for LV function in healthy animals, but would be inappropriate for animals with regional myocardial dysfunction, e.g. a myocardial infarction.
The advantage of both hf-echo and self-gated MRI is the low examination time, thus reducing the anaesthetic time, which is especially important in animals with cardiac disease. While realtime imaging is the standard in echocardiography, gated acquisition is possible to improve the resolution. With the introduction of high-frequency electronic transducers, image quality and especially temporal resolution will improve. In MRI, self-gated imaging saves preparation time, and also gives coverage of the full R–R interval, with reasonable temporal resolution. As no realtime heart rate is available from a surface ECG, the level of anaesthesia must be carefully controlled, and adjusted mainly by the respiration rate.
In the present study, we found that MRI measured a larger LV diameter than hf-echo in diastole, but not in systole. Some of this discrepancy could have been caused by different visualization of the endocardial trabeculations in the two methods. In echocardiography, the trabeculae are well visualized because of the difference in density relative to blood. In MRI, we used a bright-blood sequence, likely leading to the disappearance of the trabeculae in end-diastole when the trabecular layer is filled with blood. In end-systole, the trabeculae will be compressed and squeeze out the blood, explaining why there was no difference in end-systole. 10 Different LV levels of image acquisition in the two modalities (apical or basal shift) or misalignment of the M-mode in hf-echo cannot be excluded, but we were constantly using the papillary muscles insertion as a landmark, and switching between long- and short-axis views during acquisition to avoid such errors.
There were significant differences between the wall thickness measurements made by the two image modalities. One important reason for this was the moderate spatial resolution in MRI; 0.27 × 0.27 mm in-plane compared with a typical wall thickness of 0.8 mm, which also resulted in a clear difference in reproducibility in favour of hf-echo. The resolution in MRI could be improved by using a higher-field system, better RF coils and pulse sequences with better signal-to-noise ratios. 5,7 Radial resolution in hf-echo was approximately 0.06 mm. The largest difference for wall thicknesses was found in the posterior wall during systole, with hf-echo displaying lower values for systolic wall thickening compared with the anterior wall. In MRI, the papillary muscles interfered with the endocardial border delineation in some cases. In hf-echo, these structures can be differentiated by looking for continuity of the greyscale lines in the M-mode image (Figure 2).
Studies comparing hf-echo with conventional echocardiography, using probes up to 15 MHz, shows superior assessment and high inter-observer agreement. 3 Reported data recorded by hf-echo on the same type of mice and age, also using the same type of scanner and anaesthesia, are in good agreement with our hf-echo data. 13 Comparing our MRI data with the existing literature, Wiesmann et al. 14 used a 7.05 T MR scanner and found similar wall thickness values but lower LV diameters compared with our results. Although similar wall thicknesses and LV diameters were also obtained in another MRI study of mice, 15 differences in sequence type, spatial resolution, heart rate, animal weight and other factors can complicate direct comparison between studies.
Stuckey et al. 6 recently performed a study that compared cine-MRI and echocardiography for quantification of LV function in rats. They used an ultrasound system operating at a centre frequency of 12 MHz, and an MRI scanner operating at 11.7 T. In agreement with our results, they found that MRI measured larger LV dimensions in end-diastole, but equal or lower values in end-systole. A 12 MHz probe is suitable for rats, as higher frequencies tend to give unsatisfactory ultrasound penetration through the chest wall. In mice, significant improvements in spatial resolution can be gained by going to higher frequencies, as used in the present study.
As expected, Stuckey et al. 6 showed that multislice cine-MRI is more accurate for LV quantification in animals with regional myocardial dysfunction due to chronic infarctions. Recently, Dawson et al. 7 showed that echocardiography is also capable of making reconstructed 3D measurements of LV volumes and function with high accuracy. Compared with this approach, the M-mode approach has obvious limitations, but might be attractive in some settings because of the low level of postprocessing needed.
The animals were placed in the prone and supine positions for MRI and hf-echo, respectively. Few studies are available on the effect of body position on respiratory responses in anaesthesia, but generally potential differences are considered negligible when working with small animals. 16 We have no obvious explanation for the difference in heart rate between the two modalities. The difference might have contributed to the moderate agreement between the methods, as the LV might have operated on different positions of the force–frequency response curve.
Anaesthetic agents affect cardiac function and peripheral arterial resistance, and the effects can be larger in animals with a heart failure phenotype. 17,18 Isoflurane is considered less cardiodepressive than many other anaesthetics, and was thus chosen for our study. 19–22 Isoflurane also has the advantage of being easy to administer and titrate. In this study, we kept the dose of isoflurane as low as possible to reduce potential cardiodepressive effects.
In the present study, we tested the reproducibility by repeating the measurements on the same recordings. This approach shows the variation in the analysis, but does not take into account the variation that can be introduced by repeated acquisition. Due to the more standardized image positioning in MRI, it is likely that the difference would have been reduced if this source of variation had also been taken into account. 6
The different temporal resolution could also have contributed to the differences between the methods. In MRI, the number of reconstructed frames per cardiac cycle was limited by the signal-to-noise ratio. We reconstructed 15 frames/cardiac cycle, giving a typical frame-to-frame time of 8–10 ms. A higher temporal resolution would have increased the likelihood of capturing the true minimal and maximal LV dimensions, possibly improving the agreement. In addition, variation could have been introduced by the different origin of the trigger signal. We did not test the temporal agreement between the start of the QRS complex and the reconstructed trigger signal from MRI, but searched for the largest LV volume in the frames around the start and end of the reconstructed cycle in MRI to minimize the risk of errors. A previous study comparing LV measurements from retrospective gating and prospective triggering found only minor differences between the two approaches. 5 An overview of the strengths and weaknesses of the two methods is provided in Table 2.
Comparison of properties for hf-echo and self-gated high-field MRI for small animal cardiac imaging, for equipment used in the present study
hf-echo: high-frequency echocardiography; MRI: magnetic resonance imaging
In conclusion, both self-gated MRI and hf-echo M-mode are alternative modalities for high-throughput imaging studies of LV function in mice. Hf-echo M-mode is easier to apply, has high temporal and spatial resolution, and good reproducibility. Self-gated MRI might be advantageous in cases of abnormal LV geometry and heterogeneous regional myocardial function, especially with improvements in spatial resolution. The agreement between the methods was moderate in the present study, especially for wall thickness measurements, and this makes it difficult to compare results from the two methods in different studies.
Footnotes
Acknowledgements
This study was supported by grants from the Norwegian Council on Cardiovascular Diseases and by FUGE – Functional Genomics in Norway programme by the Norwegian Research Council (FUGE MIC Trondheim). M Ericsson is the recipient of a research fellowship from the Norwegian Council on Cardiovascular Diseases.