
Abstract
Several studies have been performed to assess heart rate variability (HRV) in several species such as humans, dogs, pigs, calves, rabbits and rats. However, haemodynamic parameters are totally different in each animal, and optimal animal models for studying HRV corresponding to human HRV are still unclear. The purpose of this study was to assess HRV in human subjects and to compare those HRV data with canine, bovine and rabbit HRV data. The heart rate in the human subjects (62.8 ± 7.4 bpm) was significantly lower than that in dogs (124.2 ± 18.8 bpm, P < 0.001), calves (73.4 ± 10.5 bpm, P < 0.05), and rabbits (217.3 ± 21.5 bpm, P < 0.001). The low-frequency waves (LF) (57.9 ± 65.8 ms2/Hz) and high-frequency waves (HF) (33.8 ± 49.1 ms2/Hz) in rabbits were significantly lower than human LF (1216.3 ± 1220.7 ms2/Hz, P < 0.05) and HF (570.9 ± 581.3 ms2/Hz, P < 0.05). Dogs and calves showed similar LF (991.1 ± 646.1 ms2/Hz and 547.0 ± 256.9 ms2/Hz, respectively), HF (702.1 ± 394.1 ms2/Hz and 601.0 ± 666.6 ms2/Hz, respectively) and LF/HF (2.0 ± 1.3 and 2.5 ± 1.9, respectively) when compared with the human data. The present study shows that dogs and calves revealed similar HRV values as those which relate to humans. Large deviation of the HRV values in rabbits compared with humans might be considered when conducting animal studies using those animals to reflect human clinical situations.
Keywords
Heart rate variability (HRV) is an indicator of the autonomic nervous system 1 and a recognized predictor of cardiac death. 2 An autonomic nervous system imbalance, specifically an increase in sympathetic drive, is considered to be a symptom of heart failure and can be measured using HRV. 2–7 HRV is performed by evaluating the spectral analysis of the R–R interval (RRI) variability. 6 This is usually measured by software which can convert the RRI variability into high-frequency waves (HF: 0.15–0.40 Hz) and low-frequency waves (LF: 0.04–0.15 Hz). HF waves are a marker of parasympathetic nervous activity, and LF waves are a marker of both sympathetic nervous activity and parasympathetic nervous activity. 6,8 The ratio of LF to HF (LF/HF) is defined as an indicator of sympathetic nervous activity.
Several studies have been performed to assess HRV in several species such as humans, 3,7 dogs, 6 pigs, 9 calves, 10,11 rabbits, 12 and rats. 13,14 However, haemodynamic parameters are totally different in each animal, 15–17 and optimal animal models for studying HRV corresponding to human HRV are still unclear. Furthermore, there are no published comparative species studies of HRV. Having a useful animal model is needed to accurately investigate HRV for clinical applications. The purpose of this study was to assess HRV in human subjects using the MemCalc system (MemCalc Version 2.5, Suwa Trust Co, Tokyo, Japan) and to compare the HRV data with those of canine, bovine, and rabbit. We also compared the haemodynamic data in different species. The goal of this study was to determine an optimal animal model for investigating HRV to reflect human clinical situations, in addition to reviewing articles regarding normal HRV in different species.
Materials and methods
Nine human volunteers were used in this study. They had no apparent cardiac disorders. The group comprised six men and three women, mean age 34 ± 7 years, mean height 174.0 ± 9.9 cm and mean weight 72.5 ± 19.1 kg. The study protocol was approved by the Cleveland Clinic Institutional Review Board. All subjects gave their informed consent.
Fifteen cross-bred dogs weighing 23.0–39.5 kg (mean 29.1 ± 4.8 kg), nine rabbits (New Zealand white rabbits) weighing 2.3–2.6 kg (mean 2.4 ± 0.1 kg) and nine calves (Holstein) weighing 66.5–160.0 kg (mean 107.4 ± 31.1 kg) were used in this study. This study was approved by the Cleveland Clinic's Institutional Animal Care and Use Committee, and all animals received humane care in accordance with the ‘Guide for the Care and Use of Laboratory Animals’ published by the National Institutes of Health (NIH Publication 85–23, revised 1996).
Time domain analysis and spectral analysis of HRV were performed on the humans, dogs, rabbits and calves using the MemCalc system (MemCalc Version 2.5). 18,19 The system continuously provides heart rate, HF, LF and LF/HF every 2 s (Figure 1). HRV data collection required ∼11 min for each subject with minimal restraint within the ECG leads. The animals were brought to the calm room at 22°C. One minute was required to obtain a baseline reading, and the HRV data were collected over a period of 10 min. The dogs and calves were connected to the ECG machine by three ECG leads: two leads on the front limbs and one lead on a hindlimb in a calm separated room. The HRV data were collected in the morning, and the dogs and calves did not eat prior to data collection. This protocol was consistent for all 15 dogs and nine calves. The rabbits were connected to the ECG machine by three ECG leads: two leads on the upper chest and one lead on the back of the neck. These data were also collected in the morning, and this protocol was consistent with all nine rabbits.
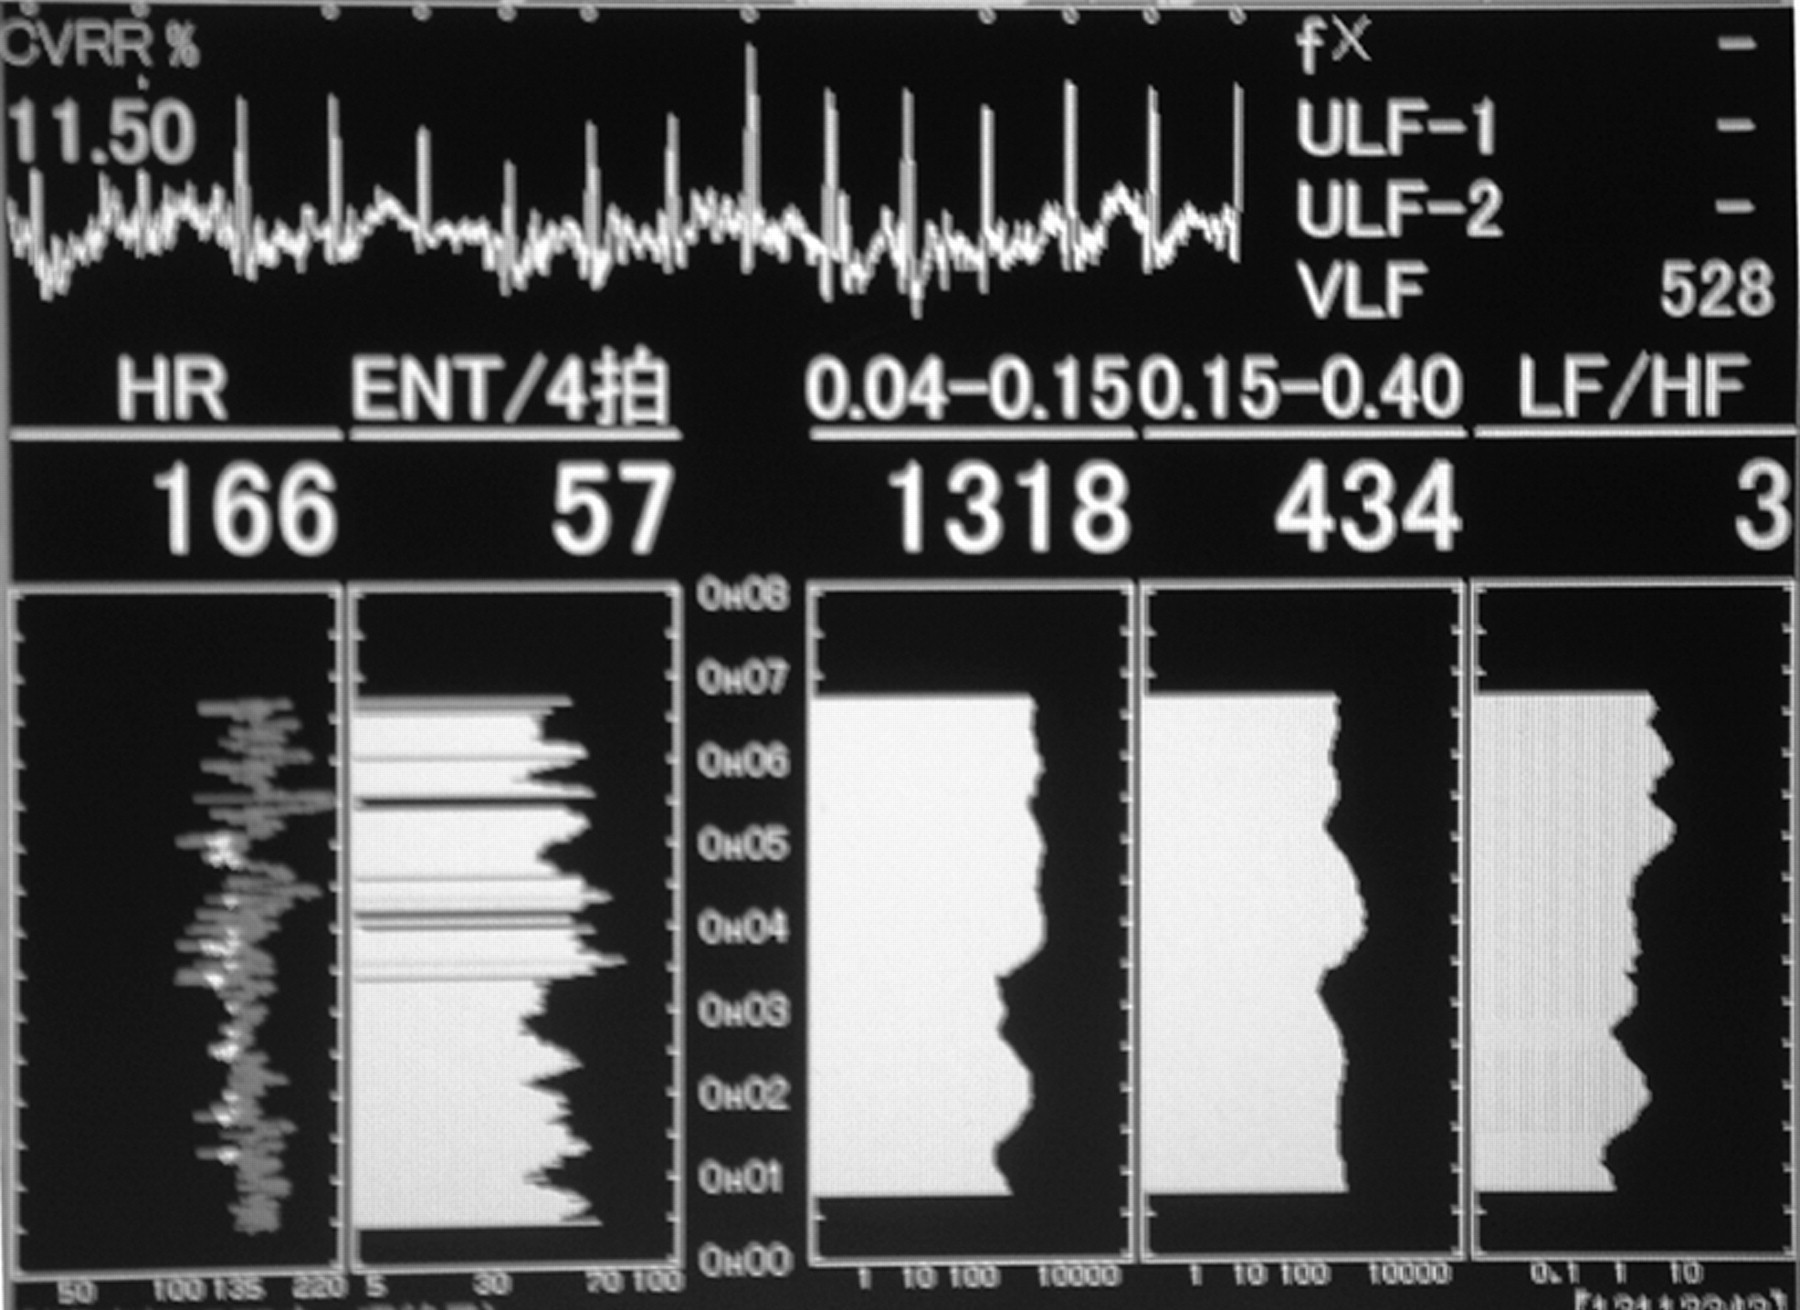
Display of the MemCalc system shows heart rate (HR), entropy values (ENT), low-frequency (LF: 0.04–0.15 Hz) and high-frequency (HF: 0.15–0.40 Hz) waves, and ratio of low- to high-frequency (LF/HF) waves every 2 s
The human volunteers' HRV data were also collected in the late mornings, at times which were most convenient for the volunteers, between 09:30 h and 12:30 h. Two 11 min sessions were recorded while the volunteer was sitting upright in a chair. While data were recorded, the volunteer was asked to stay quiet and stationary. The room conditions were as follows: the temperature was ∼21.7°C; there was minimal noise and disturbance; there was no window in the room; the door was closed; and the lights remained illuminated. Three ECG leads were placed on the volunteer: two leads on either side of the upper chest and one lead on the left side of the mid-abdomen.
The recorded time series were analysed to obtain variability indices in time and frequency domains, using the MemCalc system. The frequency variability was measured as HF (0.15–0.40 Hz) and LF (0.04–0.15 Hz).
Haemodynamic data were taken in dogs and calves under general anaesthetic conditions after obtaining HRV data. Sodium thiopental (10 mg/kg, intravenous) was used for the induction in dogs and ketamine (10 mg/kg, intramuscular) was used in calves. After intubation, the animal was ventilated through an endotracheal tube with a respirator (Servo Ventilator 900C, Solna, Sweden). Anaesthesia was maintained with isoflurane (0.5–2.5%). ECG leads were attached to the extremities to monitor cardiac vital signs. The carotid artery was cannulated for monitoring the arterial pressure (AP). The respirator setting was adjusted as required, based on the results of the arterial blood gas. An 8 Fr. introducer sheath for a 7.5 Fr. Swan-Ganz catheter (Baxter Healthcare, Irvine, CA, USA) was also inserted into the jugular vein for haemodynamic data acquisition. Haemodynamic data collection included the AP, right atrial pressure, pulmonary arterial pressure (PAP), pulmonary capillary wedge pressure and cardiac output (CO). Seven to ten consecutive beats were recorded for analysis after stabilization of the haemodynamic condition. The CO was measured by a flow probe placed around the pulmonary artery in the calf and by thermodilution technique in the dog.
The haemodynamic variables were obtained using a PowerLab data acquisition system (AD Instruments Inc, Mountain View, CA, USA) and analysed using a custom-made visual basic program on Excel software (Excel 2000, Microsoft Corporation, CA, USA). All values were expressed as mean ± standard deviation. An unpaired Student's t-test was used to assess the differences between species. Differences were considered significant at P < 0.05.
Results
Analysis of HRV is shown in Table 1. The heart rate in the human subjects (62.8 ± 7.4 bpm) was significantly lower than that in dogs (124.2 ± 18.8 bpm, P < 0.001), calves (73.4 ± 10.5 bpm, P < 0.05) and rabbits (217.3 ± 21.5 bpm, P < 0.001). The LF (57.9 ± 65.8 ms2/Hz) and HF (33.8 ± 49.1 ms2/Hz) in rabbits were significantly lower than human LF (1216.3 ± 1220.7 ms2/Hz, P < 0.05) and HF (570.9 ± 581.3 ms2/Hz, P < 0.05). Dogs and calves showed similar LF (991.1 ± 646.1 ms2/Hz and 547.0 ± 256.9 ms2/Hz, respectively), HF (702.1 ± 394.1 ms2/Hz and 601.0 ± 666.6 ms2/Hz, respectively) and LF/HF (2.0 ± 1.3 and 2.5 ± 1.9, respectively) as compared with the human data.
Comparison of heart rate variability in different species
LF: low-frequency waves; HF: high-frequency waves
*P < 0.001 vs. human
**P < 0.05 vs. human
The diastolic and mean AP in dogs (99.9 ± 13.2 mmHg and 113.2 ± 16.0 mmHg, respectively) were higher than that in calves (74.0 ± 19.2 mmHg and 89.9 ± 17.2 mmHg, respectively, P < 0.01) (Table 2). The systolic and mean PAP in dogs (18.7 ± 3.9 mmHg and 15.9 ± 3.7 mmHg) were lower than that in calves (36.2 ± 6.5 mmHg and 22.8 ± 5.8 mmHg, respectively, P < 0.01). The CO in calves (10.4 ± 4.4 L/min) was significantly higher than that in dogs (3.5 ± 0.6 L/min, P < 0.01). The stroke volume in calves (100.7 ± 39.1 mL) was significantly higher than that in dogs (30.0 ± 4.9 mL, P < 0.01).
Haemodynamic data in dogs and calves
Data are presented as mean ± standard deviation. RAPm: mean right atrial pressure; PAPs: systolic pulmonary arterial pressure; PAPd: diastolic pulmonary arterial pressure; PAPm: mean pulmonary arterial pressure; PCWP: pulmonary capillary wedge pressure; APs: systolic arterial pressure; APd: diastolic arterial pressure; APm: mean arterial pressure; CO: cardiac output; SV: stroke volume
*P < 0.01 dogs vs. calves
Discussion
The present study analysing the HRV and haemodynamic data in different species reveals that dogs and calves show similar LF and HF values when compared with human data, and dogs show significantly higher AP and lower PAP when compared with calves.
The MemCalc system (MemCalc Version 2.5) was used to record the time domain analysis and spectral analyses of HRV. This system analyses HRV using the maximum entropy method for spectral analysis and the nonlinear least squares method for fitting analysis; data are analysed in 30 s intervals. 18 The MemCalc system provides a more accurate power spectral data analysis than the typical spectral techniques, which use fast-Fourier transform algorithms. Another benefit of using the MemCalc system is the continuous data flow (Figure 1). The system provides a constant feedback of the LF, HF, LF/HF and entropy values; this could become useful in areas such as anaesthesia because data are automatically and continuously analysed. This system is potentially useful for understanding the physiology of autonomic nervous system functionality during anaesthesia.
Several species have been used to investigate HRV in animals. 6,9–14 Small animals such as rabbits and rats have also been widely used, though their body weights are quite different from humans. The data collected in the present HRV studies might indicate that dogs and calves are ideal for the HRV physiological study as it relates to humans because of the comparable LF and HF values that these two species have with the human model (Table 1). Because of the large deviations of the heart rate, HF and LF from the human data, the rabbit might not be an ideal model for studying human-related HRV techniques and procedures.
Table 3 shows results of the literature review for baseline HRV data in humans. 8,20–22 dog, 23,24 calf, 25 rabbit 26 and rat. 27,28 Results revealed that the values in rabbits and rats were quite different from those in humans. Heart rate was also completely different between human and rabbits or rats. These results show that the values in dogs or calves are similar to those in humans. The similarity between the human and the canine LF and HF values in the literature 29 are consistent with the present study. Dogs and calves might be the optimal animal model for studying HRV with the intention of human application. However, the availability and ethical issues might limit its use for conducting animal studies with a calf. Dogs might be an ideal model to investigate HRV in animals.
Literature search of heart rate variability in different species
HR: heart rate, LF: low-frequency waves, HF: high-frequency waves
*Present study
Among various species different haemodynamic parameters have been reported by several investigators. 15–17,30 Our haemodynamic study showed that dogs have high arterial and pulmonary blood pressure, and those results were similar to the results by McDonough et al. 16 and Patterson and Kirk. 30 Harken et al. 17 reported that canine ischaemic patterns differed from those of pigs, rabbits and monkeys due to the high collateral circulation in the canine heart. Patterson and Kirk 30 reported that the pig was a useful model for investigating ischaemic heart disease. Although the HRV values are ideal in dogs, physiological and structural differences in the cardiovascular system of dogs versus humans might be one of the limitations.
One of the limitations of assessing HRV is that it might change dramatically due to the circumstances of the measurements. For example, many of the authors recorded data using long-term monitoring with a 24 h Holter recorder, 8,24 whereas the present study used short-term monitoring using the MemCalc system. It is important to note that it is difficult to directly compare all of the statistical data in the literature search due to the different procedures and recording devices used to obtain the HRV data.
Other limitations of the study included limited species diversity in reference to HRV data. There was an attempt to record data from pigs in our experiment; however, this was not realistic or successful due to the uncooperative nature of these animals without anaesthesia, which restricted such data collection. Another limitation is the short-term nature of the study. Ideally, the animals should have been monitored for 24 h intervals instead of the 11 min intervals that were recorded. Finally, skewing of the HRV data could have occurred from any stress that the animals experienced from the ECG attachments. Recording for longer intervals could prevent any future potential skewing of the data.
In conclusion, the present study shows that dogs and calves are the best animal models for the study of HRV as it relates to humans. High blood pressure of dogs compared with humans might be considered to reflect the results to human. High deviation of the values of HRV in rabbits compared with humans might be considered in conducting animal studies using those animals.