
Abstract
Objective:
The objective was to test the feasibility and acceptability of a novel protocol to measure the properties of the superficial pelvic floor muscles (sPFMs) using grayscale ultrasonography (US), point shear-wave elastography (pSWE), and strain elastography (SE).
Materials and Methods:
This was an observational feasibility study. Feasibility was determined by assessing the number of US images acquired to measure sPFM properties using these tools. Thickness of the sPFMs was assessed using grayscale US, while stiffness and elasticity were measured using pSWE and SE.
Results:
Twenty-six women participated in this study. The US image acquisitions and analyses of sPFM properties were completed in 96% (25 of 26) of women. Several challenges related to the morphological characteristics of sPFM or the US assessment tools were encountered. When measuring the bulbospongiosus muscle, both the muscle and bulb of the clitoris were captured (they moved and contracted similarly and simultaneously). The small size of the ischiocavernosus and superficial transverse perineal muscles also made measuring stiffness challenging.
Conclusion:
Challenges were encountered when measuring the sPFMs using grayscale US, pSWE, and SE. Further studies are required to optimize the protocol to evaluate individual sPFM properties using these tools, with Duplex Doppler potentially valuable to distinguish between vascular and sPFM structures.
The superficial pelvic floor muscles (sPFMs) consist of three muscles in the anterior perineum: the bulbospongiosus, ischiocavernosus, and superficial transverse perineal muscle.1,2 The sPFMs play an important role in sexual functions such as clitoral engorgement, vaginal closure, and reflexive response to enhance sexual pleasure.3 –5 This is due to their attachments to the clitoris and cavernous structures, specifically the bulbospongiosus and ischiocavernosus muscles. However, few studies have investigated sPFM properties (thickness, stiffness, or elasticity) in females, as to date there have been few assessment tools that can measure the individual pelvic floor muscles (PFMs) and discriminate between the sPFMs and deep pelvic floor muscles (dPFMs).
Transperineal ultrasonography (TPUS) assessment tools allow visualization of the anatomic structures of individual PFMs. Grayscale ultrasonography (US) is a commonly available diagnostic imaging tool that can be used to quantify dPFM thickness. 6 Shear-wave elastography (SWE) and strain elastography (SE) are newly emerging TPUS assessment tools that have been recently used to measure dPFM properties, such as stiffness and elasticity. The SWE works by measuring the propagation velocity of induced shear waves in a targeted muscle to estimate tissue stiffness.
Various protocols have been used in previous studies to measure dPFM stiffness, specifically the levator ani muscle (LA), in asymptomatic women using two-dimensional shear-wave elastography (2D-SWE).7,8 Gachon et al 8 positioned a linear transducer in the sagittal plane on the perineum and then tilted it by 10° to visualize the LA at its pubic insertion. The region of interest (ROI) for calculation of shear modulus was manually delineated to measure the LA stiffness. 8 Morin et al 7 employed a different protocol to identify and measure the LA stiffness using 2D-SWE, positioning the transducer in the mid-sagittal plane adjacent to the vagina, and aligning it to visualize the LA fibers. 7 The ROI for calculation of shear modulus was set to a maximum (3 × 3 cm) and contained the LA fibers parallel to the transducer. Measuring and assessing the sPFM stiffness using SWE has not been investigated and requires further research.
The SE is another assessment tool used to measure muscle stiffness, and it is based on the principle of tissue displacement (strain) in response to slight manual compression applied to a muscle using a hand-held transducer.9,10 To assess the LA stiffness using SE, Xie et al11,12 used grayscale US to locate the muscle. After locating the LA, the examiner carried out SE by manually applying slight and constant vertical compression on the muscle. Muscle stiffness data were demonstrated in color, with blue indicating hard tissue, green indicating medium tissue stiffness, and red indicating soft tissue.11,12 Although these TPUS assessment tools have been investigated in previous studies to measure the dPFMs, it is not yet known if these tools can evaluate individual sPFM thickness, stiffness, and elasticity.
A few studies have suggested that the sPFMs may be more involved in sexual dysfunction and pelvic pain pathophysiology than the dPFMs.13 –15 This hypothesis, however, cannot be confirmed due to the absence of an assessment method that can differentiate between these muscle layers. Considering the hypothesized importance of the sPFMs in sexual function and pelvic pain pathophysiology, as well as the potential of grayscale US, point shear-wave elastography (pSWE), and SE to measure individual sPFM properties, more research investigating normal and abnormal sPFM properties is required. Prior to this, however, it is important to test the protocol for measuring sPFM properties in asymptomatic women using grayscale US and TPUS elastography tools before translating the application to females with conditions such as pelvic pain. Therefore, the purpose of this study was to test the feasibility and acceptability of a novel protocol to measure sPFM properties using grayscale US, pSWE, and SE.
Materials and Methods
Study Design
This was an observational feasibility study reported in accordance with the Strengthening the Reporting of Observational Studies in Epidemiology (STROBE) guideline. 16 This study was conducted in the Department of Medical Imaging at the host university, from 2019 to 2020. Pelvic floor and US assessments were conducted in individual clinical rooms. Ethics approval was obtained from the local Human Research Ethics Committees (HREC/43410/2019). All participating females provided written informed consent.
Participants
A convenience sample of healthy adult women was recruited through study flyers posted on an Australian university campus, in affiliated hospitals, and on social media such as Facebook. Female participants were included if they were aged between 18 and 36 years, nulliparous, premenopausal, had sufficient English language skills to participate, and were able to contract and hold their PFMs for at least 3 seconds duration by self-report. The pelvic floor physiotherapy researcher (SK) screened potential eligible participants via telephone screening interviews and online questionnaires using Qualtrics software. The exclusion criteria were pregnancy, symptoms of a pelvic floor disorder, active urinary/vaginal infection, history of gynecological surgery, or any major gynecological, neurologic, or congenital disease that could interfere with participation.
Measurement Devices
Imaging was performed using a RS-80 Prestige (Samsung/Medison, Seoul, Korea) ultrasound equipment system, equipped with shear-wave software (S-shearwave) and SE software (ElastoScan). Two linear array transducers, LA2-9A (frequency range = 2–9 MHz; field of view = 44.16 mm; grayscale, shear-wave and strain) and L3-12A (frequency range = 3–12 MHz; field of view: 37.5 mm; grayscale and strain), were used to obtain sPFM images.
Procedure
Sociodemographic information was collected, including age, body mass index (BMI), and weight. Prior to the commencement of the procedure, participants were asked to empty their urinary bladder. Prior to the TPUS assessments, participants were asked to report whether they had any physical and emotional comfort/discomfort using a yes/no response. Participants who responded “yes” were asked to rate their physical and emotional discomfort using an 11-point numeric rating scale ranging from 0 “no discomfort” to 10 “extreme discomfort.”17,18 Following this, participants were requested to undress from the waist down and use a sheet to cover themselves from waist to knees, with the intention of maximizing privacy while enabling the necessary observation of pelvic floor muscle (PFM) activity. Participants were instructed on how to perform a correct maximum PFM contraction by the pelvic floor physiotherapy researcher (SK) as follows: “contract your PFMs as hard as you can, as if you are trying to hold in urine or prevent the passage of gas.” Ability to contract PFMs was categorized by the physiotherapist according to visual observation of perineal movement (category 0 = no movement; category 1 = incorrect movement; category 2 = weak movement; category 3 = strong inward displacement/lift of perineum). 19 If participants were unable to contract their PFMs (category 0 = no movement), grayscale US was used to verify their ability to contract PFMs. Participants were excluded if grayscale US confirmed their inability to contract and hold an sPFM contraction for at least 3 seconds. Participants were tested in the supine position, with their hips and knees flexed to 60 degrees, hips slightly abducted, and feet flat on the bed. A sonographer (FL) with more than five years of clinical experience in abdominal and gynecologic sonography, as well as TPUS, conducted all imaging assessments. In Australia, the most commonly used method for scanning pelvic floor structure and function, including the PFMs, is TPUS.6,20,21
Image Acquisition
To visualize the bulbospongiosus and ischiocavernosus muscles, the linear transducer was initially placed in the sagittal plane with a midline approach for the bulbospongiosus muscle and an anterior approach for the ischiocavernosus muscle at the perineum. The transducer was then tilted and rotated 5° to the left and right of the vaginal introitus until the bulbospongiosus muscle could be visualized by the sonographer. Then, the transducer was aligned with the bulbospongiosus muscle shape and fibers (See Figure 1A). The transducer was tilted and rotated more laterally 10° to 20° toward the pubic arch until the ischiocavernosus muscle could be visualized by the sonographer, and then the transducer was aligned with the muscle fibers (See Figure 1B). To visualize the superficial transverse perineal muscle, the transducer was placed in the transverse plane, angled toward the anus on the perineum, both to the left and right of the perineal body (See Figure 1C). A frame rate of 7.6 kHz was performed to measure sPFM properties at rest and during maximum voluntary contraction (MVC). To standardize the US image acquisition during contraction, the participants were also asked to perform an MVC, and the measurements were taken during this maximum contraction.
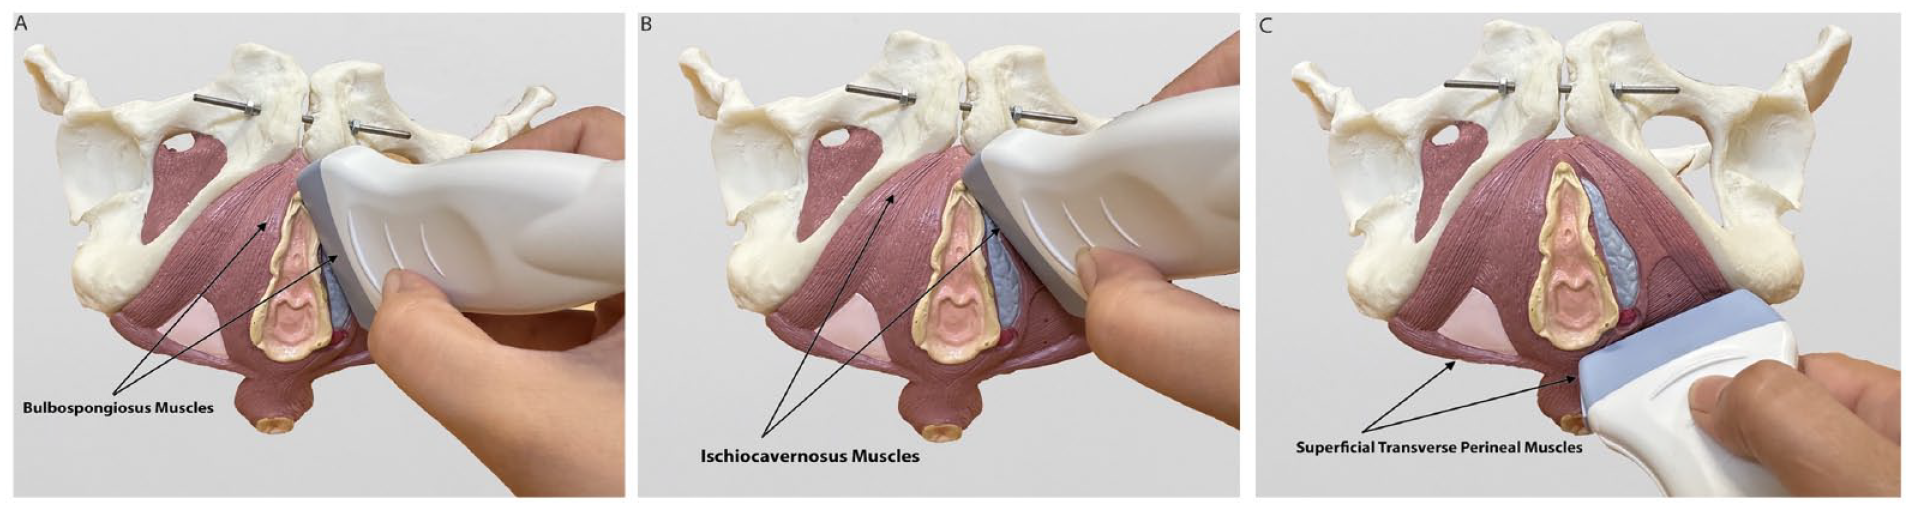
This series of photographs shows the method by which the ultrasound transducer was positioned for measuring the following anatomic structures: (A) bulbospongiosus, (B) ischiocavernosus, and (C) superficial transverse perineal muscles.
Initially, cine clips were obtained to identify individual muscle structures and landmarks using grayscale US. Static images were obtained twice from both sides of each of the individual sPFMs, at rest and during MVC. Participants were instructed to hold each muscle contraction for at least 3 seconds with at least 3 seconds of rest between each PFM contraction. The order of measuring of each sPFM and body side was randomized. A total of 64 sPFM measurements (two examinations on both sides of each sPFM) were taken of each participant.
Feasibility and Acceptability Outcomes
To assess the feasibility of measuring sPFM properties using B-mode US, pSWE, and SE, the number and percentage of US image acquisitions completed, using the methods described in this protocol, were calculated. In addition, the acceptability of these TPUS assessment tools and procedures was determined using participants’ overall physical and emotional discomfort. 18
Measurements of Superficial Pelvic Floor Muscles
1. Superficial pelvic floor muscle thickness using grayscale ultrasonography.
Grayscale US was used to measure the thickness of each sPFM. For the bulbospongiosus and ischiocavernosus, muscle thickness was measured by placing electronic calipers between the inner boundaries (from the superficial fascia to the deep fascia of the muscle structure)22 –24 at two locations: 10 mm and 20 mm distal to the head of the clitoris (glans). For the superficial transverse perineal muscle, the muscle thickness was measured at two locations: 0 mm and 5 mm lateral to each side of the perineal body.
2. Superficial pelvic floor muscle stiffness using point shear-wave elastography
The pSWE was used to assess sPFM stiffness. This type of elastography generates an ultrasound-focused beam that produces a localized perturbation in a single point of the tissue, causing a shear-wave response. The underlying concept is that shear-wave speed is related to tissue stiffness: shear waves travel faster in stiff tissues and slower in soft tissues. 25 The pSWE system quantifies the propagation velocity of the shear waves generated, transforming it into kilopascal (kPa) values.
To measure the bulbospongiosus and ischiocavernosus muscles, a fixed-sized ROI (dimension: 0.5 × 0.5 cm) was selected from the right and left muscular components between 10 and 20 mm distal to the clitoris. For the superficial transverse perineal muscle, the fixed ROI was placed at the right and left muscular components 5 to 10 mm distal to the perineal body.
3. Superficial pelvic floor muscle stiffness using strain elastography
The SE was used to assess sPFM stiffness. The strain ratio between the selected muscle (target) and surrounding fatty tissues was obtained as the reference strain ratio (B)/the target strain ratio (A). This is based on the principle that softer tissue has more deformation than stiffer tissue; therefore, a higher strain ratio indicates greater stiffness (less elasticity).26,27
For the bulbospongiosus and ischiocavernosus muscles, the target strain ratio was obtained from the right and left muscular components between 10 to 20 mm from the clitoris, and the reference strain ratio was obtained from within 10 mm vertically above the muscular measurements. For the superficial transverse perineal muscle, the target strain ratio was obtained from the right and left muscular components 5 to 10 mm from the insertion into the perineal body, and the reference strain ratio was obtained from the tissue within 10 mm vertically above the muscular measurements.
Statistical Analysis
The primary outcome of this study was feasibility, determined by the number and percentage of US images acquired to assess individual sPFM using grayscale US, pSWE, and SE. In a previous feasibility study that used SWE to measure dPFM stiffness in 12 females, 8 US image acquisition and analyses were achieved in all participants (100%) when measuring the dPFM at rest and in 83% of the participants during the valsalva maneuver. For our current feasibility study, the sample size calculation was based on an a priori estimated percentage of US image acquisitions of 95%. Using a proportion of 95%, a 95% confidence interval, and a margin of error of 0.1, the required sample size was 18. To account for potential dropouts (estimated at 20%), a total of 23 participants was required to determine feasibility. 28
Statistical analyses were performed using SPSS v26 (IBM Corporation, Armonk, New York). Descriptive statistics were used to present the participants’ characteristics and TPUS measures. Continuous data were expressed as mean (standard deviations [SD]), and dichotomous data were presented as number and frequency. The number and the percentage of US images acquired for evaluating individual sPFM were reported to assess the feasibility of using these assessment tools to measure sPFM properties. Participant ratings of comfort experienced during the test procedures were analyzed as numbers and percentages. All data were analyzed without imputation for missing data.
Results
A total of 45 females responded to the advertisements and were assessed for eligibility (See Figure 2). Five participants were excluded at the telephone interview stage due to: (1) diagnosis of urinary tract infection; (2) diagnosis of endometriosis and PFM discomfort; and (3) did not provide their email contact. Ten participants could not be contacted for various reasons, and two participants were excluded in the online questionnaire process (See Figure 2). Two participants were also excluded at the clinical appointment stage due to an inability to contract and hold their PFM for at least 3 seconds, which was verified by grayscale US. Twenty-six nulliparous females met the eligibility criteria for inclusion in the study with a mean age of 25.3 (SD = 4.09) years (See Figure 2 and Table 1).
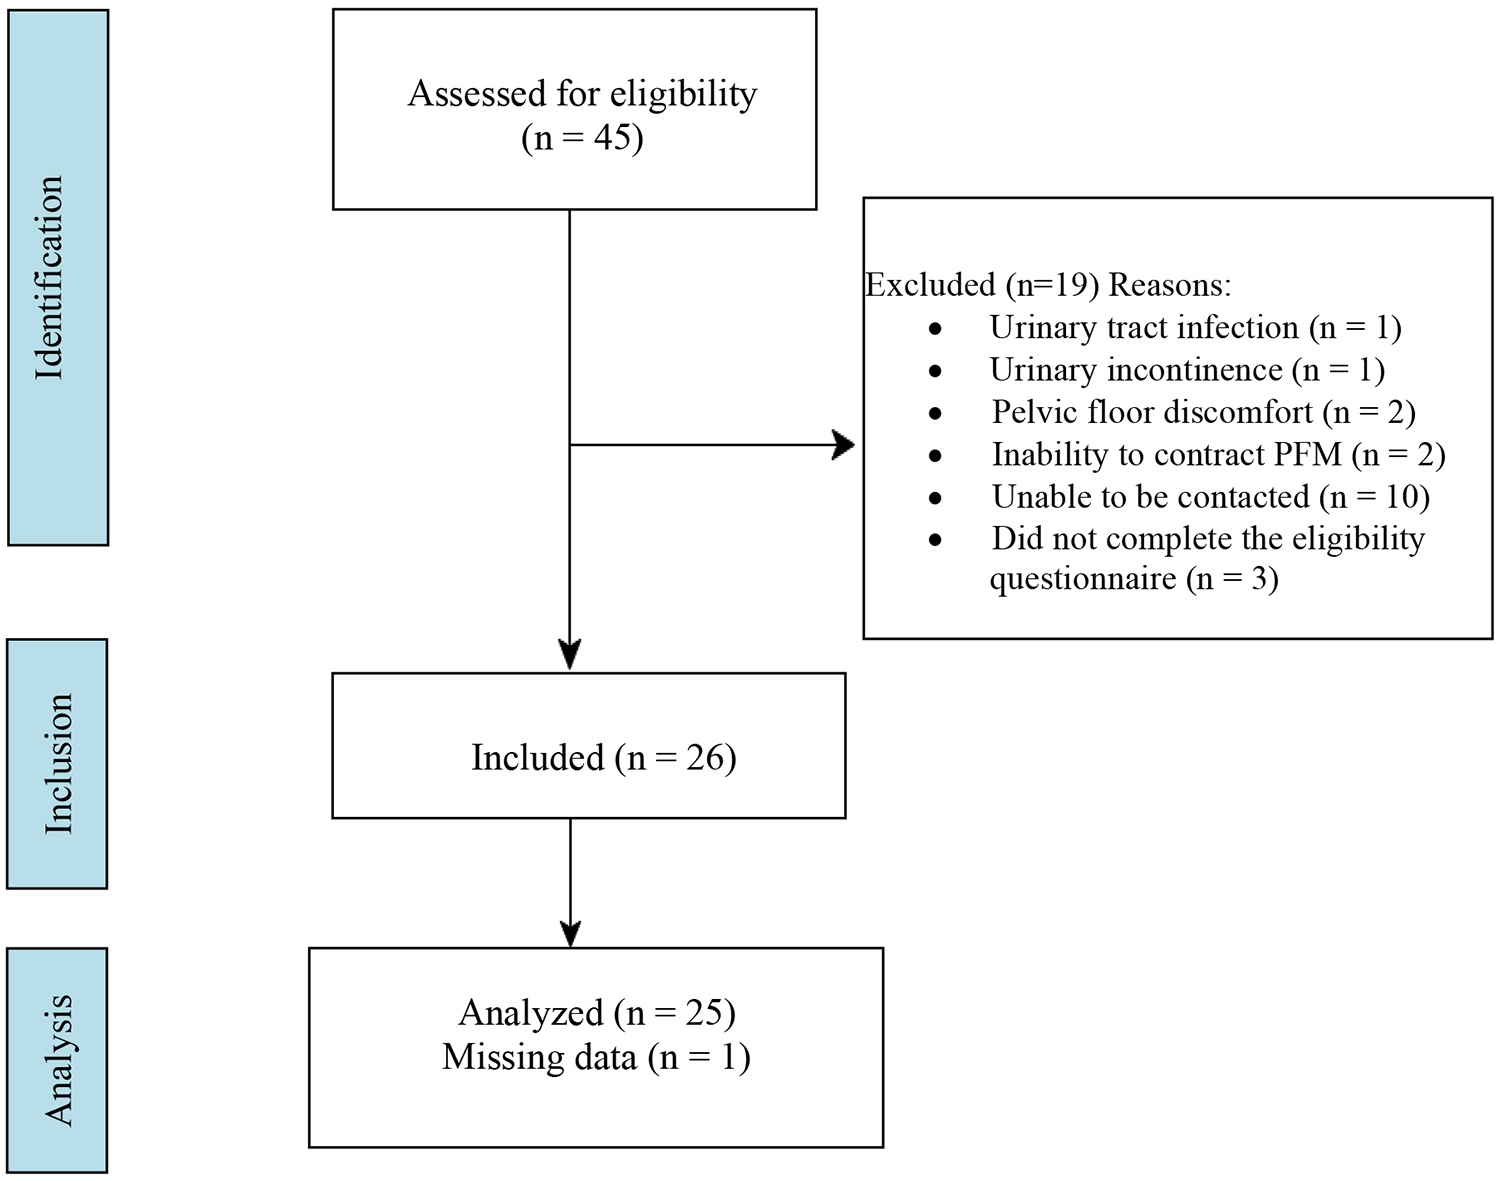
The Strengthening the Reporting of Observational Studies in Epidemiology (STROBE) flowchart is provided to illustrate how participants were recruited, screened, and included in the overall study for data collection and analysis.
The Characteristics of Research Participants Who Completed all Aspects of the Study.
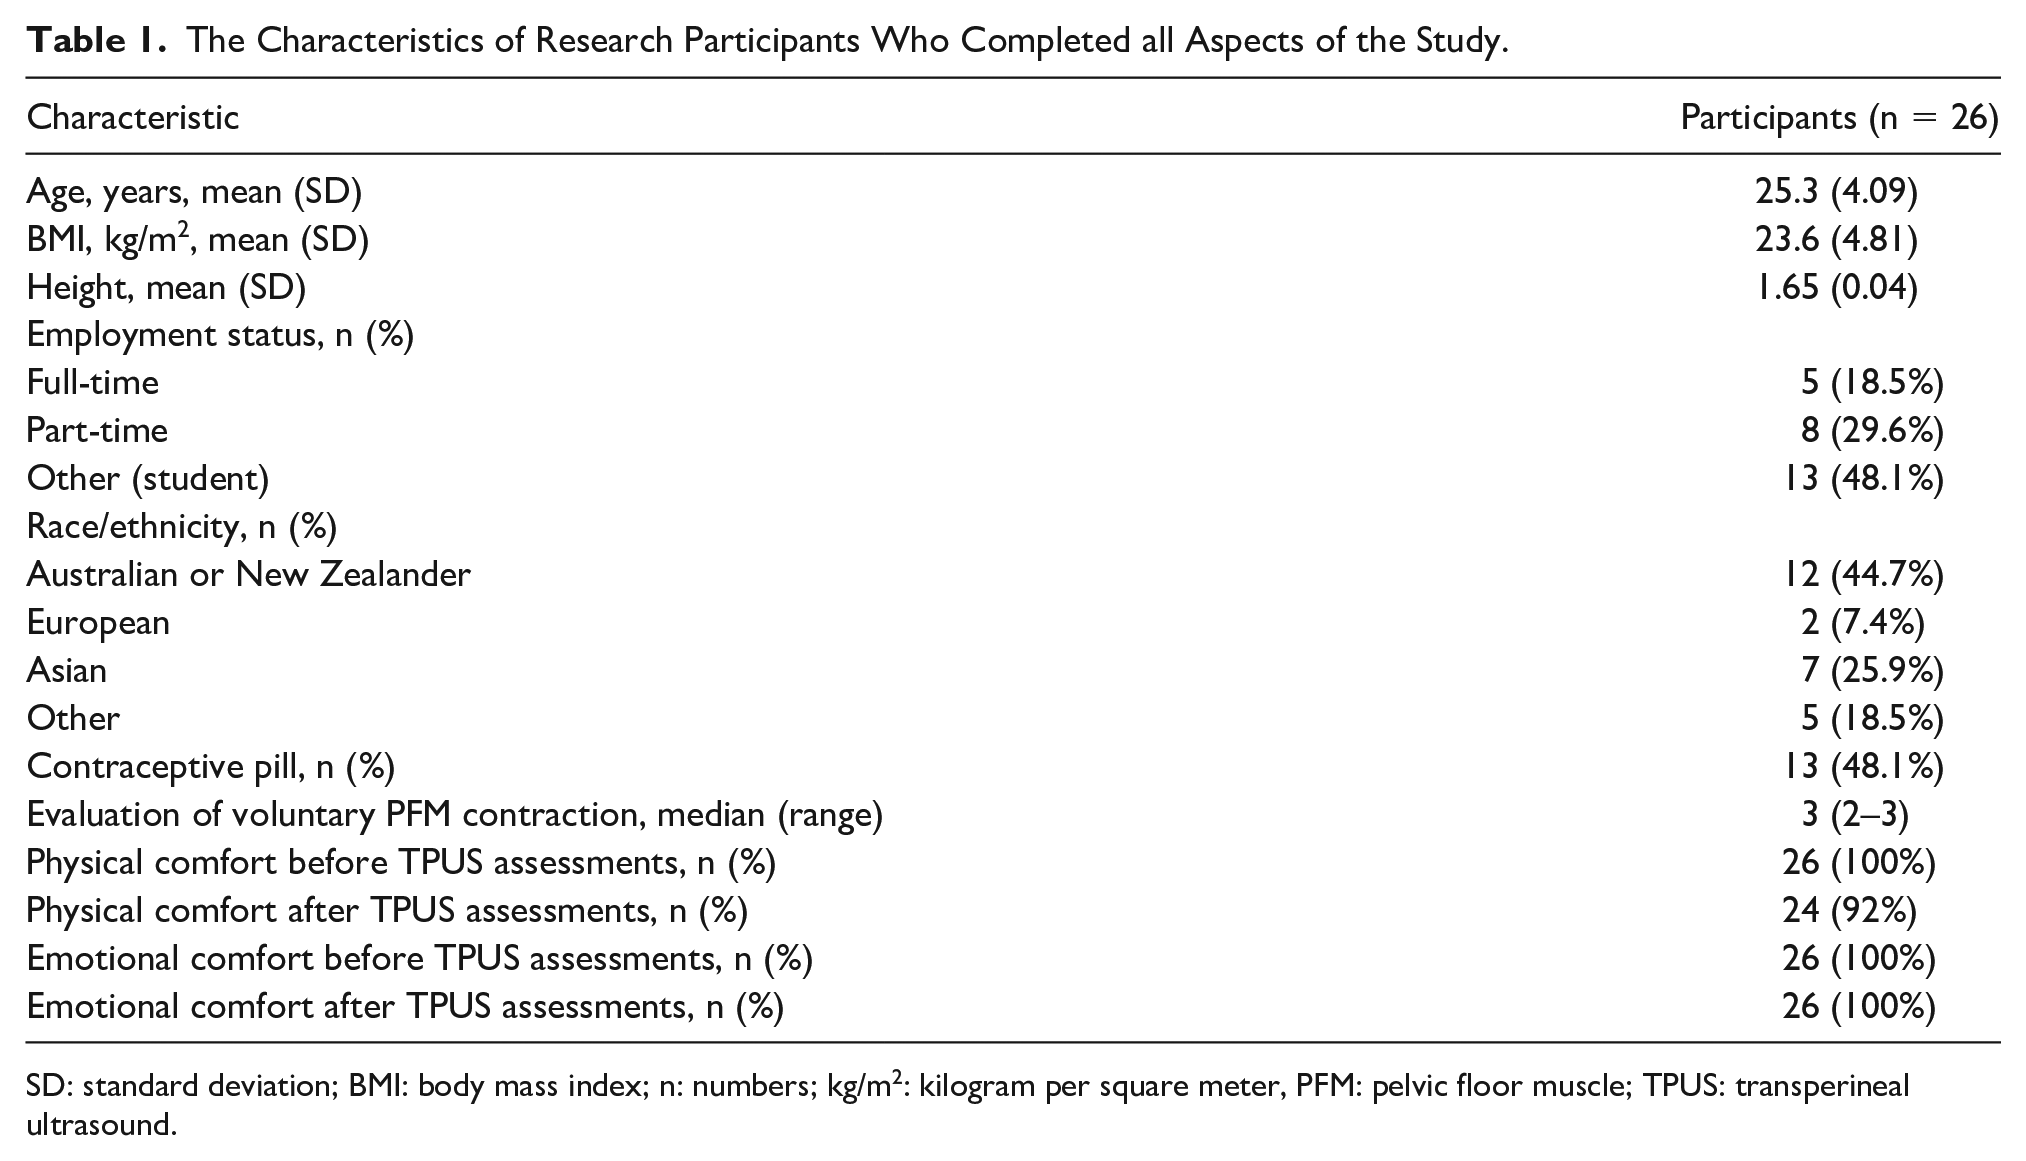
SD: standard deviation; BMI: body mass index; n: numbers; kg/m2: kilogram per square meter, PFM: pelvic floor muscle; TPUS: transperineal ultrasound.
Feasibility Outcomes
All 26 enrolled participants successfully underwent TPUS examination; however, TPUS data from one participant were missing due to technical issues with the TPUS device. Therefore, US image acquisitions and analyses of sPFM properties using grayscale US and elastography were completed in 96% of participants. Based on visual interpretation of the grayscale US images, the superficial transverse perineal muscle appeared to be the thinnest of all three muscles and, consequently, the most difficult to identify. In addition, the superficial transverse perineal muscle showed excessive movement during MVC, which precluded the measurement of stiffness and elasticity using pSWE and SE. Therefore, it was only possible to quantify the superficial transverse perineal muscle properties at rest.
Prior to performing TPUS, all participants reported no physical or emotional discomfort. After completing the three TPUS assessment tools, two participants reported mild physical discomfort due to the transverse position of the transducer to measure the superficial transverse perineal muscle and the pressure from the transducer used during the SE procedure (See Table 1).
Measurements of Superficial Pelvic Floor Muscles
The mean thickness, stiffness, and elasticity values of the right and left individual sPFMs at rest and during MVC are reported in Tables 2–4. Figure 3 shows the thickness of each sPFM as measured by grayscale US, and Figures 4 and 5 display the stiffness measured by pSWE and SE, respectively. Due to the small size of sPFMs and the lack of previous US data on these muscles to guide our measurements, several challenges were encountered in identifying sPFM structures and measuring their properties (See Tables 2–4). Thus, when TPUS images were analyzed in discussion with experts in pelvic floor assessment using US, it is likely that our measurements may not have accurately captured these sPFM properties.
The Sonographic Measurements That Were Recorded of the Bulbospongiosus Muscle, From the Research Participants.
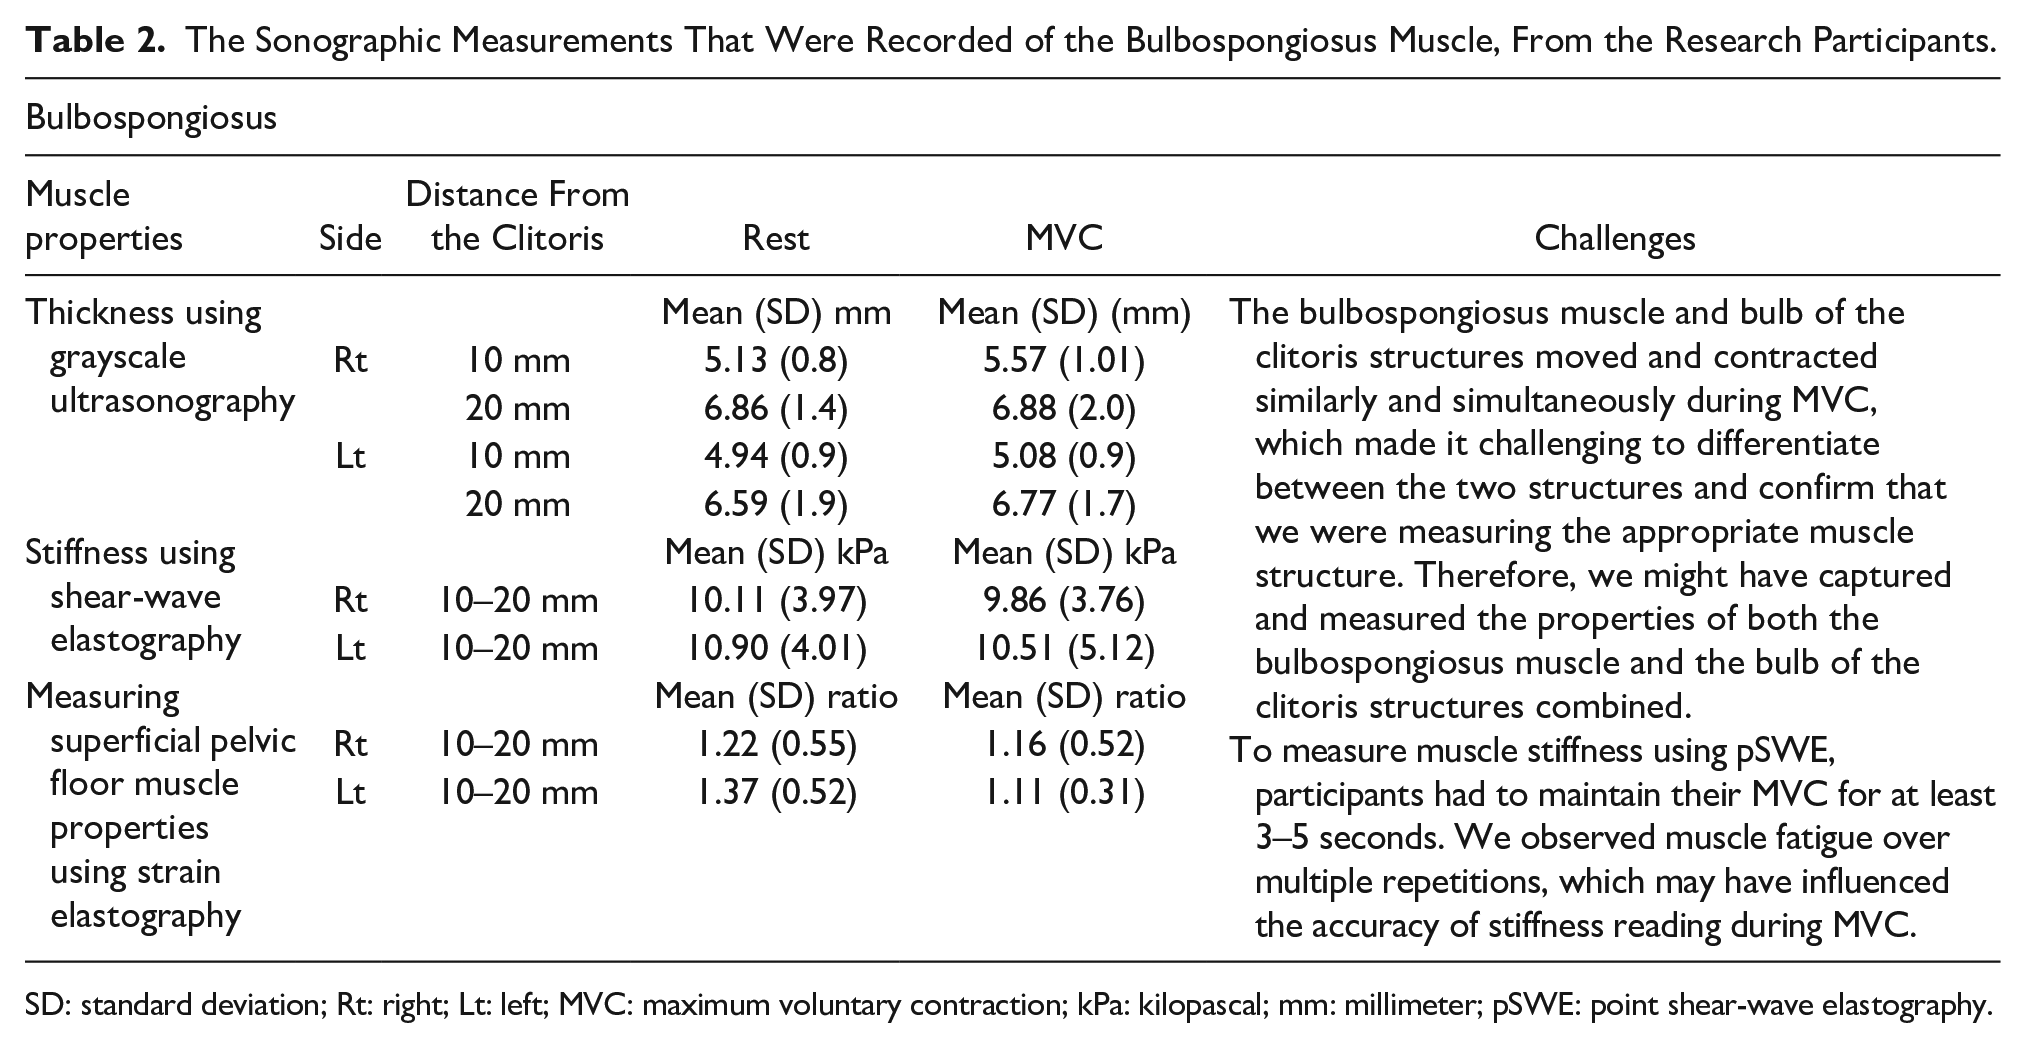
SD: standard deviation; Rt: right; Lt: left; MVC: maximum voluntary contraction; kPa: kilopascal; mm: millimeter; pSWE: point shear-wave elastography.
The Sonographic Measurements That Were Recorded of the Ischiocavernosus Muscle, From the Research Participants.
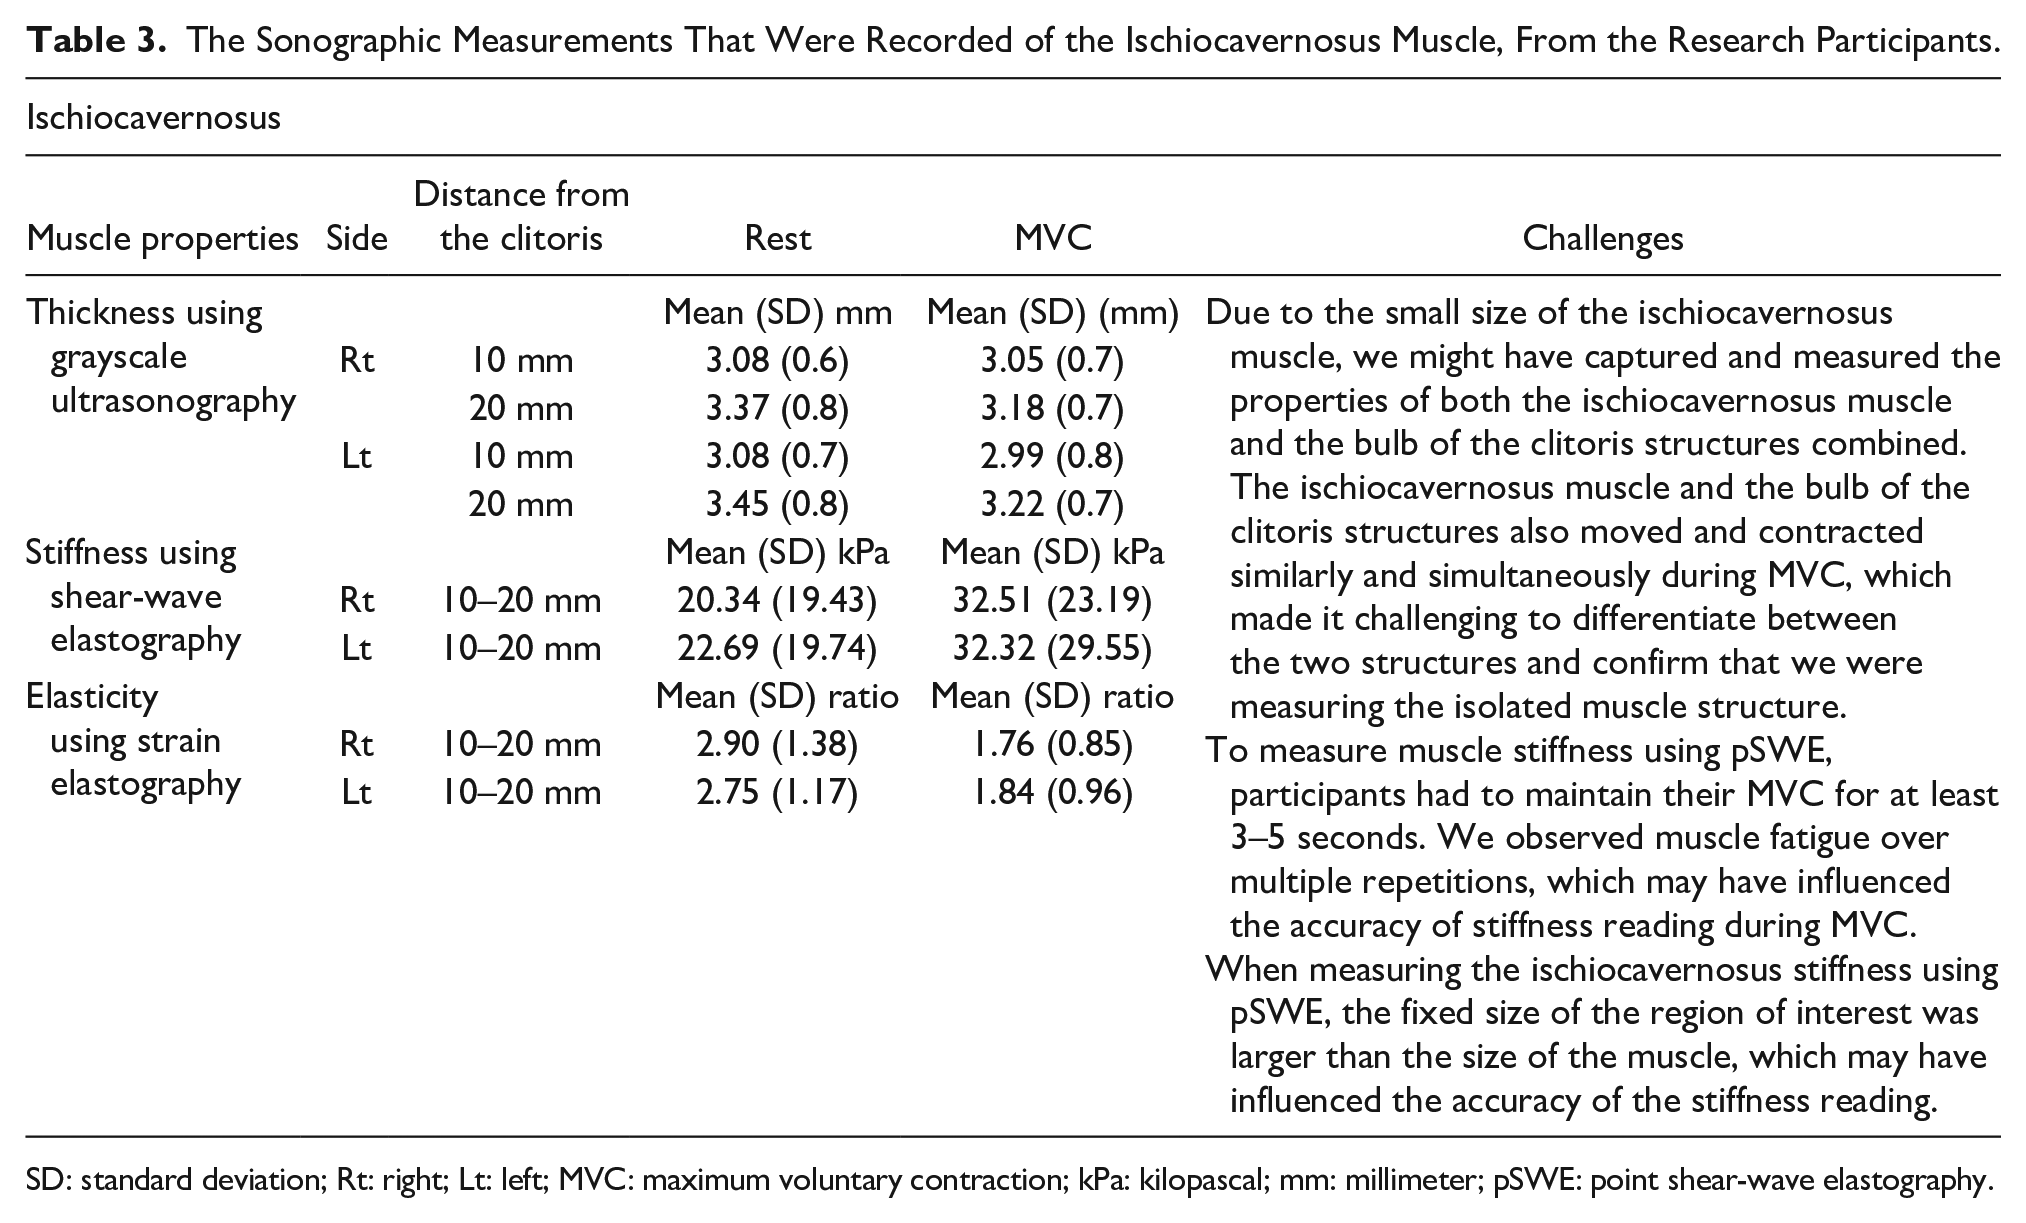
SD: standard deviation; Rt: right; Lt: left; MVC: maximum voluntary contraction; kPa: kilopascal; mm: millimeter; pSWE: point shear-wave elastography.
The Sonographic Measurements That Were Recorded of the Superficial Transverse Perineal Muscle, From the Research Participants.
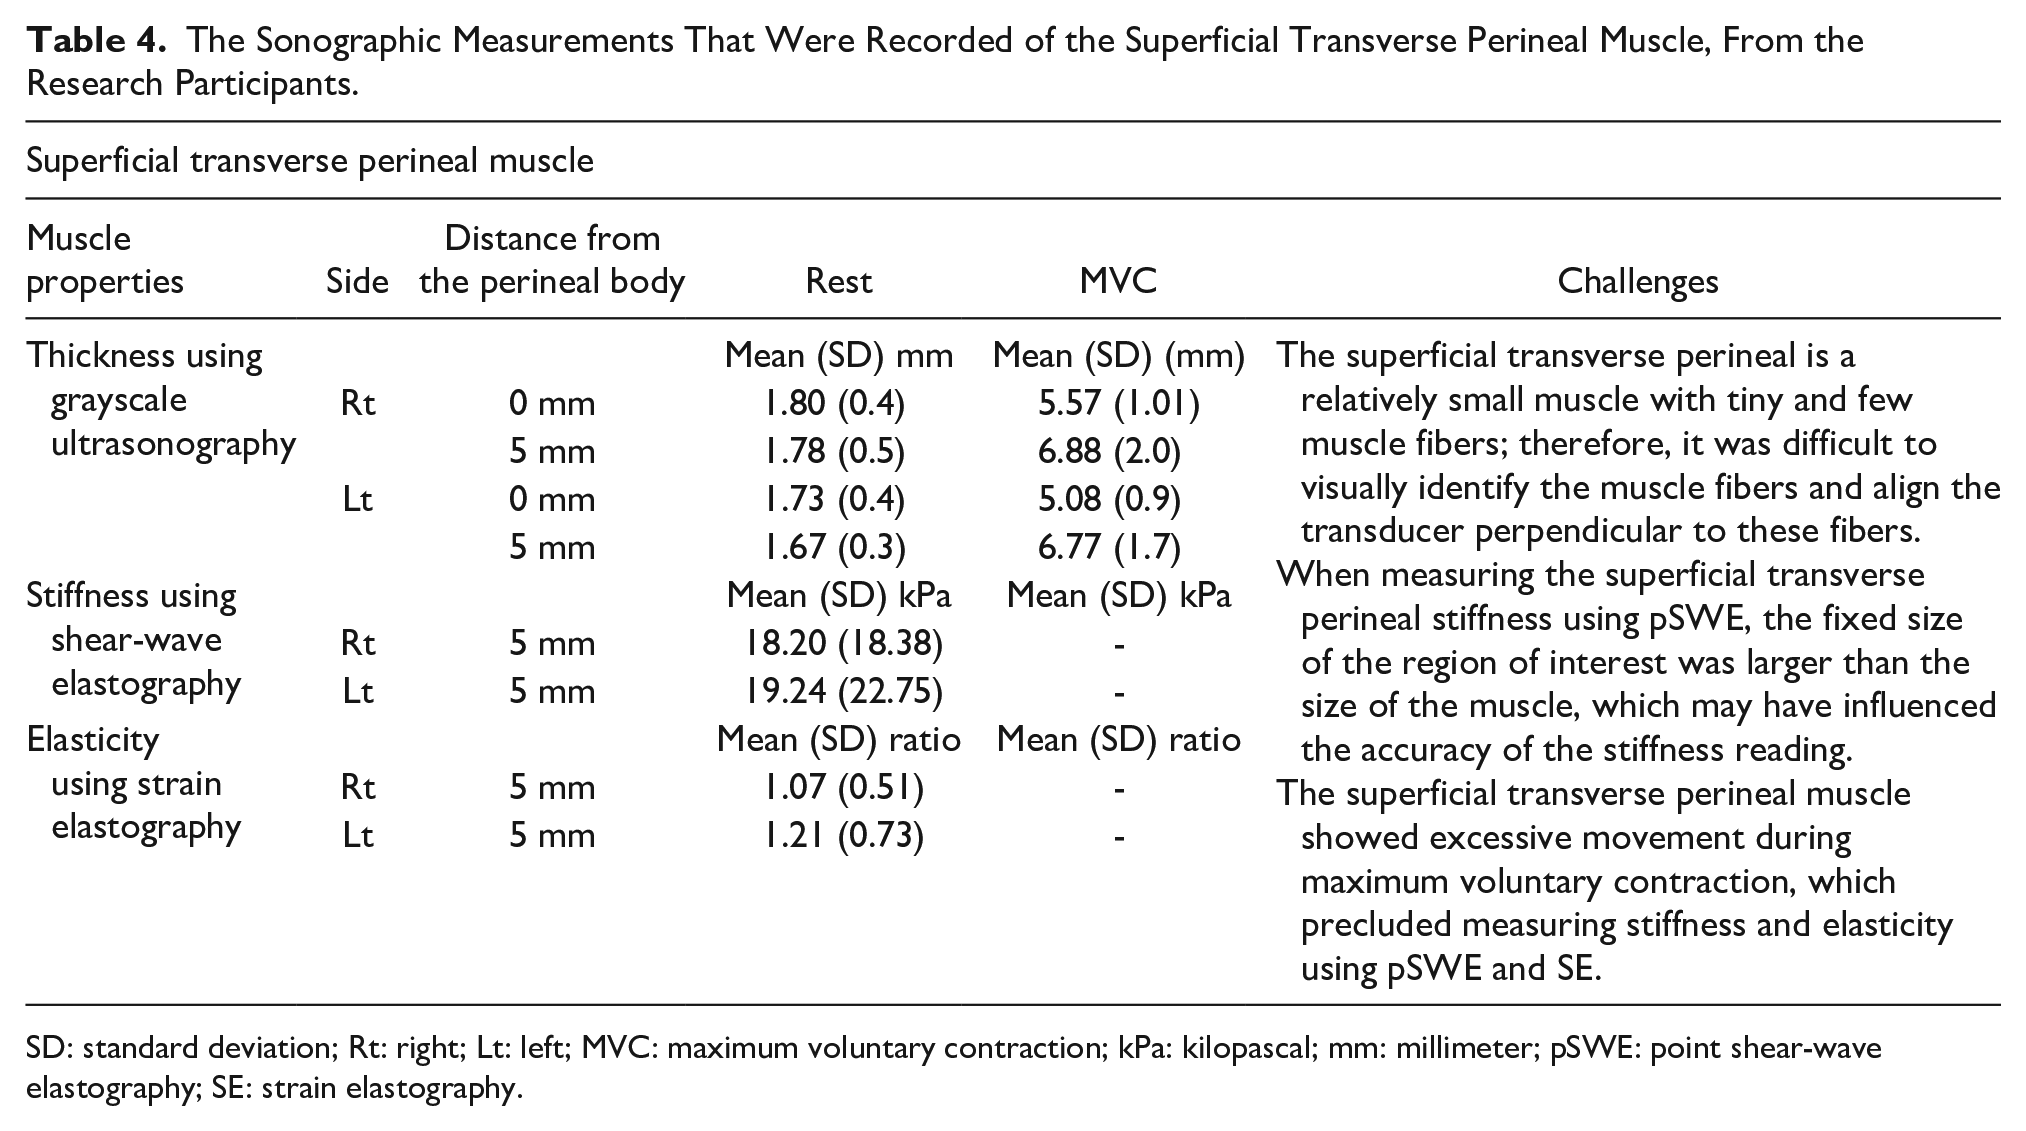
SD: standard deviation; Rt: right; Lt: left; MVC: maximum voluntary contraction; kPa: kilopascal; mm: millimeter; pSWE: point shear-wave elastography; SE: strain elastography.
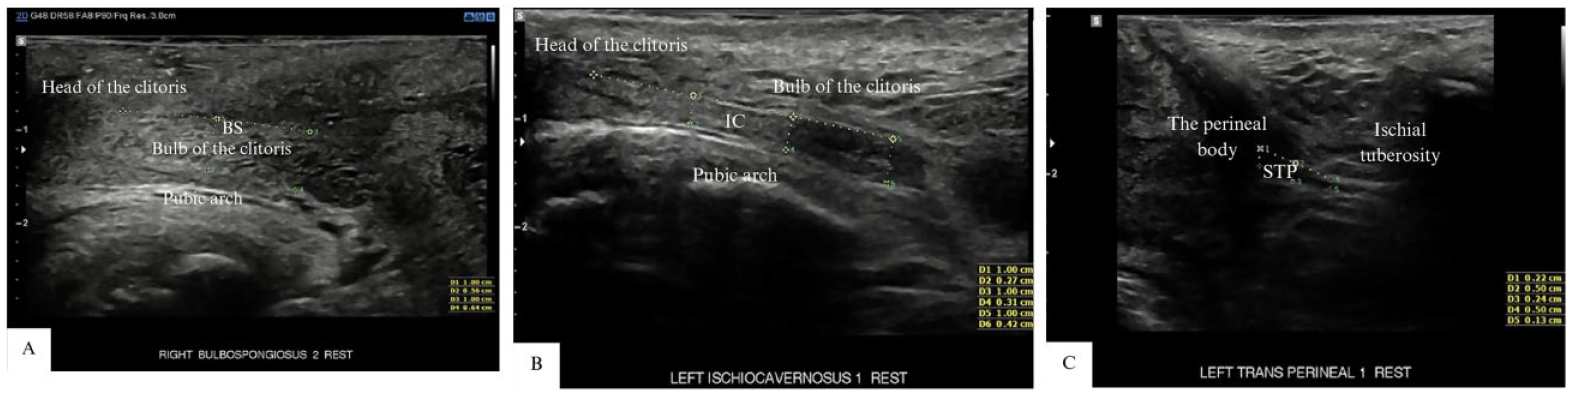
A series of grayscale sonographic images are provided that demonstrated the individual superficial pelvic floor muscle thickness, as measured with electronic calipers: (A) BS: bulbospongiosus, (B) IC: ischiocavernosus, and (C) STP: the superficial transverse perineal muscle.
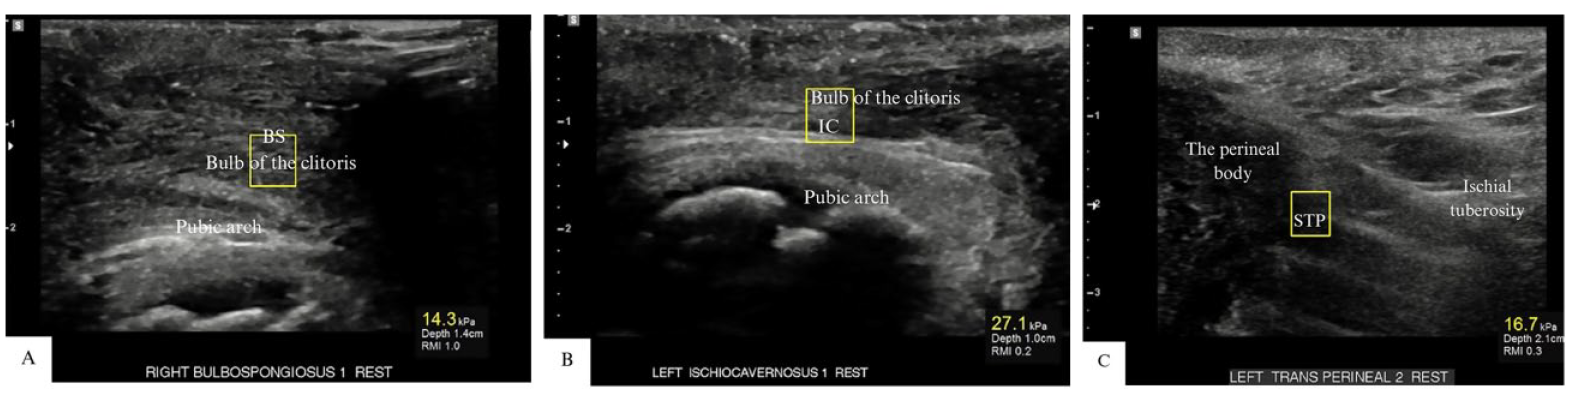
A series of grayscale sonographic images are provided that demonstrated the individual superficial pelvic floor muscle stiffness as measured by point shear-wave elastography. Yellow boxes indicate the region of interest to measure individual sPFM stiffness: (A) BS: bulbospongiosus, (B) IC: ischiocavernosus, and (C) STP: the superficial transverse perineal muscle.
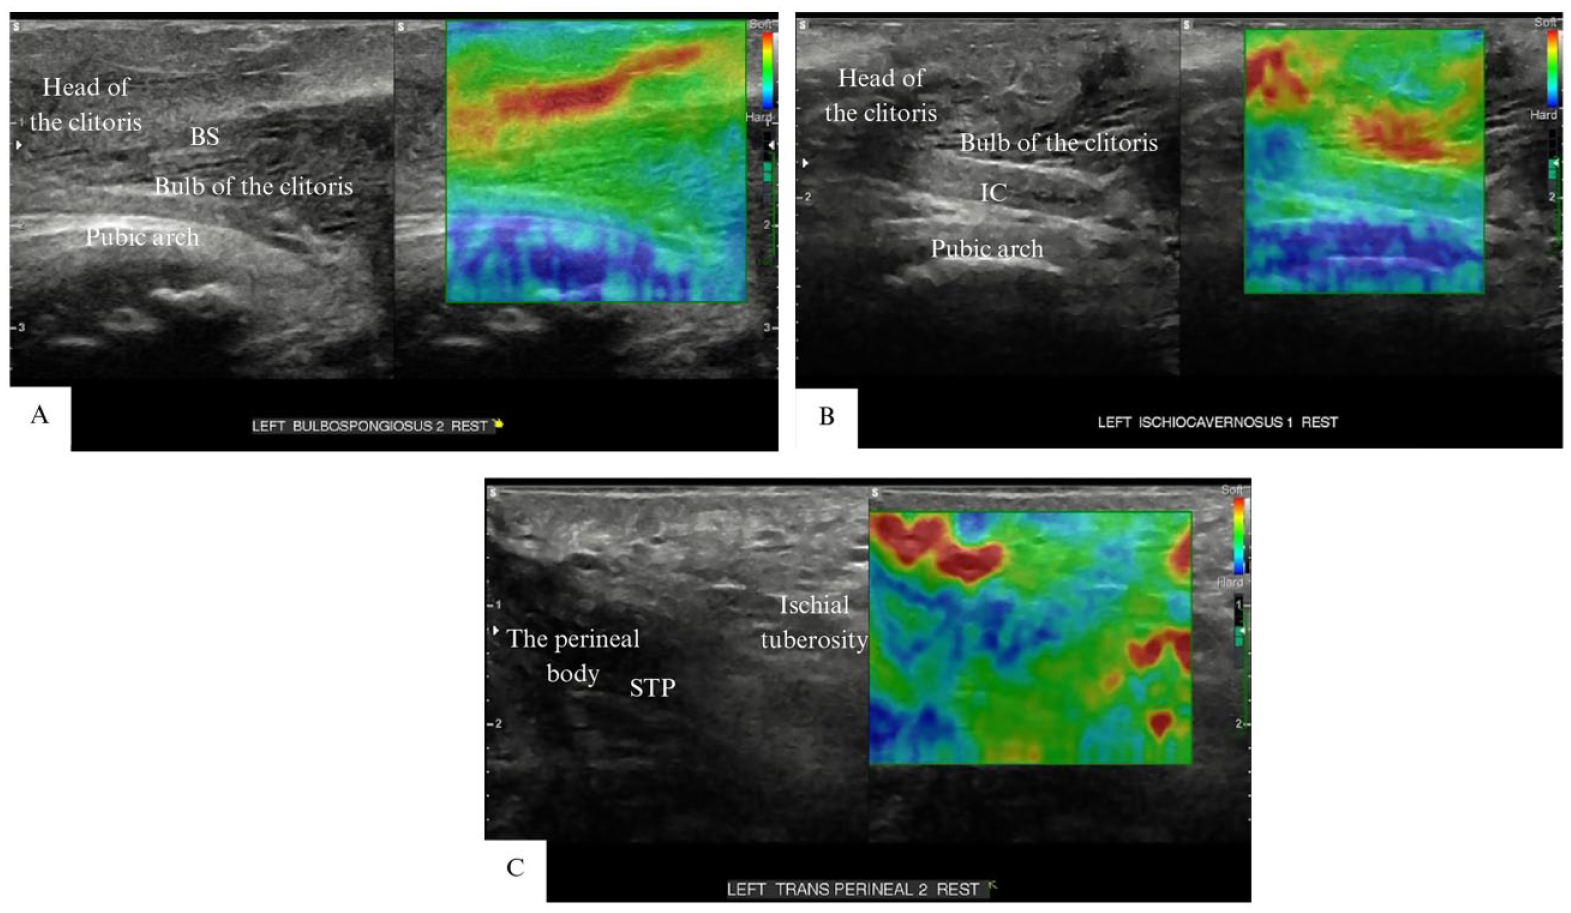
A series of grayscale sonographic images are provided that demonstrated the individual superficial pelvic floor muscle stiffness as measured by strain elastography. The grayscale image (left panel) and elastography image (right panel) are provided. Tissue stiffness is displayed in a spectrum of colors from red (soft tissue) to blue (hard tissue): (A) BS: bulbospongiosus, (B) IC: ischiocavernosus, and (C) STP: the superficial transverse perineal muscle.
Discussion
The aim of this study was to measure the individual sPFM thickness with grayscale US, stiffness with pSWE, and elasticity with SE in females, using a novel protocol. These findings revealed that the bulbospongiosus muscle appeared to be the thickest among the sPFMs. However, it is important to note that both the muscle and clitoral structures were measured because both structures moved and contracted similarly and simultaneously during MVC. The ischiocavernosus muscle seemed to be the stiffest, as suggested by pSWE and SE. Nevertheless, the ROI for calculating shear modulus stiffness may include nearby connective tissues. As such, these findings should be interpreted with caution due to the limitations and challenges we encountered in this study when measuring sPFM properties using these TPUS assessment tools, which may affect the accuracy of these findings.
In this study, several challenges were encountered that related to either the sPFM morphological characteristics or to the TPUS assessment tools when measuring these muscles. One of the challenges related to measuring the sPFM properties was the morphological structure of the sPFMs, particularly the bulbospongiosus muscle. Due to the scarcity of US data on the individual sPFM structures in females, the measurement protocol was based on published PFM anatomy sketches to identify the shapes, borders, and structures of individual sPFMs.1,2,15,29 In several published PFM anatomy sketches,1,2,15,29 the bulbospongiosus muscle originates from the midline of the perineum, bifurcates to encompass the vaginal orifice, and anteriorly attaches to the corpus cavernous of the clitoris. Posteriorly, it attaches to the external anal sphincter muscle.1,2,15,29 Anatomy sketches1,2,15,29 illustrate that the ischiocavernosus muscle is located in the lateral boundary of the perineum and extends along the medial aspect of the ischiopubic ramus, the ischial tuberosity, and ramus, and attaches anteriorly to the clitoris. The superficial transverse perineal muscle originates from the ischial tuberosity, extends medially, and crosses superior to the bulbospongiosus muscle in the midline at the perineal body.1,2,15,29 Based on these PFM anatomy sketches, the transducer was positioned to identify these sPFM structures.
The US images from this study showed that the bulbospongiosus appeared to be the thickest muscle among the sPFMs. In the study, the mean thickness of the sPFM was found to be lower than the mean thickness reported in a previous study. 30 The study by Mørkved et al 30 reported a mean thickness of 7.15 mm for the sPFM in 71 pregnant females using TPUS. However, they did not specify which individual sPFMs were measured. 30 The discrepancy in sPFM thickness between this study and Morkved’s results may be due to differences in the women’s status (nulliparous vs pregnant women), measurement protocols, and the positioning of the transducer. In Morkved’s protocol, 30 the transducer was placed in a parasagittal position on the perineum, just to the right or left of the vaginal introitus, 30 approximately midway between the urethra and the posterior commissure of the introitus, whereas in the current protocol, the transducer was positioned in a more anterior position. The data from Mørkved et al 30 and published PFM anatomy sketches1,2,15,29 regarding the thickness and size of sPFM structures informed the current measurements taken during data collection. However, the current poststudy interpretation of the US images, in light of a more recent understanding of the integration between the combined vascular-clitoral structure and bulbospongiosus muscle structure, indicated that these sPFMs, especially the bulbospongiosus muscle, were in fact relatively small. This suggests that the current data might have overestimated the thickness of these sPFMs. Future studies involving anatomic dissection of the sPFMs in young female cadavers will allow for the precise confirmation of individual structural morphology of these muscles. This, in turn, will optimize US transducer placements, allowing for the precise identification and quantification of the sPFM thickness and striated muscle properties.
Although the current measurement protocol was based on published PFM anatomy sketches in females, these sketches did not provide US images of the sPFM composition (i.e., muscle fibers vs other tissues). In the current US images, the appearance of bulbospongiosus muscle composition seemed to differ from that of a typical striated muscle. Currently, there is a scarcity of US data on the composition of the individual sPFMs in women. In order to confirm whether the bulbospongiosus striated muscle fibers we were examined versus other tissues, it was important to pull from published US images depicting male bulbospongiosus muscle,22,31 which showed similar muscular composition to this study images. Therefore, it was assumed that the structure visualized in this study was the bulbospongiosus muscle, as the muscular composition appeared similar to that in published US studies of male bulbospongiosus muscle.22,31
Another challenge related to measuring the bulbospongiosus muscle was the integration of the vascular tissue structure within the morphology of the muscular structure. The integration of this vascular tissue with striated muscle fibers was not known a priori; therefore, Duplex Doppler was not used to detect this. When an attempt was made to interpret the current US images, poststudy, it was noted that the vascular tissue was, in fact, integrated within the striated muscle fibers. This integration is likely the reason why the thickness of the bulbospongiosus muscle may have overestimated. Both vascular and muscular structures moved and contracted in the same way, and they also moved simultaneously during MVC; thus, it was challenging to differentiate between the two structures using grayscale US, pSWE, and SE. Through the current poststudy interpretation of the US images and reviewing published US images of the clitoral structure,32,33 it was discovered that the vascular tissue was probably the clitoral structure. A previous investigation, suing Duplex Doppler in female participants, revealed vascular tissue within the clitoral structure.32,33 Currently, there is a scarcity of US data regarding the integration of the combined vascular-clitoral structure and sPFM structure in women. Previous research32,33 has focused solely on the clitoral structure without illustrating the anatomic relationship between the combined vascular-clitoral structure and muscular structure in US images. Therefore, it is possible to have inadvertently measured the vascular-clitoral structures and the muscle fibers of the bulbospongiosus muscle combined in this study. For more precise measurements of the bulbospongiosus muscle properties in future studies, researchers should consider using Duplex Doppler to distinguish between these two structures before using grayscale US and elastography.
A further challenge when measuring the sPFMs using TPUS assessment tools was the angulation of the transducer to the line of the muscle fibers. The sPFMs are relatively small in cross-sectional area and thin, with only a few tiny muscle fibers. 34 It was, therefore, difficult to see the muscle fibers and align the transducer perpendicular or near 90 degrees to these fibers. Aligning the transducer to be perpendicular to the muscle fibers is required for pSWE to provide an accurate stiffness measurement. 35 In this study, ischiocavernosus muscle fibers were visible in the TPUS images, but it was more difficult to see these fibers in the bulbospongiosus and the superficial transverse perineal muscles. Therefore, pSWE might not be an optimal assessment method for small muscles with tiny and few muscle fibers. More studies investigating the validity of measuring sPFM stiffness using pSWE and SE assessment tools are required.
Muscle fatigue was another challenge that was encountered as attempts were made to measure individual sPFMs. Several studies in humans have indicated that the dPFMs primarily consist of 70% type I (slow twitch) and 30% type II (fast twitch) fibers36 –38; however, there is a lack of studies on the proportions of these fiber types in the sPFMs of women. Some insight may be gained from a previous study, which found that the bulbospongiosus muscle in female rabbits consists of a high content of glycolytic fibers (type II). 39 Glycolytic fibers (type II) within human skeletal/limb muscles are known to produce rapid MVCs and fatigue quickly.40,41 The finding in female rabbits was consistent with a previous study in men, which found that type II fibers are predominant in both the bulbospongiosus and ischiocavernosus muscles, with percentages of 74% and 67%, respectively, compared with the 23% and 39% of type I (slow twitch). 42 In this study, both sides of individual sPFMs were measured and each muscle was measured twice. The total number of MVC repetitions was 28. Although participants were asked to rest for 2 minutes while the examiner prepared for the next US assessment method, muscle fatigue may have affected the ability of women to perform and maintain 28 repetitions of an MVC, and this may have affected our results. Accurate stiffness measurements using pSWE require that the transducer remains stable in one location for several seconds; therefore, participants had to maintain their MVC for at least 3 seconds. As such, measuring sPFM stiffness at rest might be more accurate than during MVC; however, the validity of measuring sPFM stiffness at rest and during MVC using pSWE needs to be investigated in future studies.
In terms of the challenges related to elastography assessment methods, a fixed ROI was placed to measure sPFM stiffness. The ROI for pSWE used in this study was larger than the size of the sPFMs. As such, during the ischiocavernosus and the superficial transverse perineal muscle stiffness measurements, the fixed ROI used may have included small portions of connective tissue next to the target muscles. This variability in the structures measured within the fixed ROI may have affected the accuracy of stiffness measurements using pSWE. An inability to standardize pressure using SE was another challenge related to the assessment method. Although the display bar, on the screen, was used as a guide to confirm that appropriate and repeatable pressure was being applied, minor variations in pressure could have introduced an error in elasticity reading.9,10,43,44 Following TPUS assessments, the participants overall physical comfort was being assessed without gauging the comfort or discomfort associated with each individual tool. It was noted that SE assessment tools involving manual pressure might be more likely to cause discomfort compared with other tools (B-mode US and pSWE). Future research may consider using 2D-SWE to overcome these limitations, as it does not require external transducer pressure and it enables adjustable size of ROI to fit the measured muscles.10,45
Notwithstanding the challenges encountered in this study, the protocol using grayscale US and elastography may provide valuable insights for designing future studies to measure sPFM thickness and stiffness, as well as to identify the potential clinical significance of individual sPFMs in women with and without pelvic pain. The sPFM data acquisition rate of 96% using these TPUS tools is also encouraging for future researchers. However, the protocol could be further optimized by incorporating Duplex Doppler to better differentiate vascular and muscle structures, as well as using 2D-SWE, which allows both the real-time visualization of the measured muscles and an adjustable ROI size to fit the target muscles. Combining these TPUS tools may facilitate the development of a more robust evaluation protocol for future studies investigating sPFM thickness and stiffness in both asymptomatic and symptomatic women.
The findings of this study may suggest that among the sPFMs of asymptomatic females, the bulbospongiosus appeared to be the thickest, while the ischiocavernosus appeared to be the stiffest. Currently, it remains unknown whether there are clinically significant differences in the thickness, stiffness, or other structural and functional properties of the sPFMs between patients with and without pelvic pain conditions. Further research is warranted to compare the thickness and stiffness of sPFMs between women with and without pelvic pain conditions. If differences are observed, it will be crucial to determine the clinical significance of these variations and the association between these properties and pelvic pain to inform appropriate treatment plans.
Limitations
The major limitation of this study was the pre-experimental research design and the sampling by convenience. This presents threats to internal and external validity so the results must be interpreted with caution. Despite the challenges and limitations associated with measuring sPFM properties using grayscale US, SE, and pSWE, this study has strengths. The US assessments and measurements were also performed by a single skilled and experienced obstetrics and gynecology sonographer, which helped to reduce measurement errors. In addition, this study provides valuable foundational evidence, as this is one of the first publications providing a protocol for measuring individual sPFM using grayscale US, pSWE, and SE in females.
Conclusion
Several challenges were encountered when assessing individual sPFM thickness, stiffness, and elasticity using grayscale US, pSWE, and SE. Despite these challenges, this study has identified key TPUS measurement aspects that researchers and clinicians need to consider when measuring sPFM properties in future studies. To optimize future protocols of measuring individual sPFM properties, anatomic dissection of the sPFMs in young female cadavers would facilitate the confirmation of individual sPFM structural positions and the refinement of US transducer placements. In addition, the clinical applicability of these TPUS assessment tools for measuring sPFM properties can be enhanced by using Duplex Doppler and 2D-SWE. Currently, there is no diagnostic gold standard assessment tool for measuring the properties of individual sPFMs. The TPUS assessment tools are non-invasive and objective, and their clinical significance lies in their ability to measure individual muscle properties, which may be relevant for diagnosing and planning treatment targeting the affected muscle.
Footnotes
Acknowledgements
The authors thank Professor Michal Schneider, Deputy Head of the Department of Medical Imaging and Radiation Sciences at Monash University, Melbourne, Australia, for her expertise, insightful guidance, and contributions to this research protocol. The authors also thank all the study participants for their support and dedication to this study project.
Ethics Approval
Ethical approval for this study was obtained from the local Human Research Ethics Committees (HREC/43410/2019).
Informed Consent
Written informed consent was obtained from all subjects before the study.
Animal Welfare
Guidelines for humane animal treatment did not apply to the present study because no animals were used during the study.
Trial Registration
Not applicable.
Declaration of Conflicting Interests
The authors declared no potential conflicts of interest with respect to the research, authorship, and/or publication of this article.
Funding
The authors disclosed receipt of the following financial support for the research, authorship, and/or publication of this article: The study was funded by the School of Primary and Allied Health Care research seeding grant, Monash University, Melbourne, Victoria, Australia.