
Abstract
Objective
We explored a method for the quantitative sonographic analysis of myometrial texture using computer-aided image analysis software to assess outcomes following treatment with gonadotrophin-releasing hormone (GnRH) agonist for adenomyosis in women with infertility.
Method
Data for patients with ultrasound images of the myometrium obtained at Taipei Medical University Hospital from 1 September 2018 to 5 April 5 2019 were analyzed. Only 10 patients with 20 ultrasound images matched the eligibility criteria. The images were divided into pre-treatment (n = 10) and post-treatment images (n = 10) and quantitative grayscale histograms were obtained from the ultrasound images using publicly available ImageJ computer-aided image analysis software. We analyzed the differences between the pre- and post-treatment images using the Mann–Whitney test and compared the results with outcomes assessed by serum CA-125 levels.
Results
Image analysis of the grayscale histograms revealed significant differences between before and after treatment. The classification of the myometrium pre-treatment and post-treatment was similar using CA-125 and histogram grayscale analysis.
Conclusion
Computer-aided image analysis of grayscale histograms of the myometrium obtained from ultrasound images is an alternative method for assessing myometrial conditions after GnRH agonist treatment in patients with adenomyosis.
Introduction
Adenomyosis, defined by the migration of endometrial glands and stroma from the basal layer of the endometrium to the myometrium, is considered as a benign condition of the uterus. 1 Adenomyosis is associated with clinical symptoms including dysmenorrhea, dyspareunia, abnormal uterine bleeding, and infertility,1,2 and its early diagnosis and treatment are essential to improve the patient’s quality of life. However, because adenomyosis commonly occurs together with endometriosis, its diagnosis remains a clinical challenge.2,3
The only definitive method for diagnosing adenomyosis involves hysterectomy combined with histological examination. 3 However, there is no universal agreement on the exact histological criteria, and there is currently no method for making a diagnosis before invasive surgery.3,4 There is therefore a need for a less-invasive, preoperative test for initial screening of patients with possible adenomyosis prior to a surgical diagnosis. Elevated levels of the serum cancer antigen 125 (CA-125) are commonly found in patients with adenomyosis. 5 Patients with adenomyosis have a higher CA-125-positive rate than those with myoma of the uterus,6–8 and the severity of adenomyosis is positively correlated with serum CA-125 levels. 7 However, elevated serum CA-125 levels are also associated with moderate or severe endometriosis, ovarian endometrioma, and/or deep infiltrating endometriosis,9,10 and the accuracy of serum CA-125 assay alone for diagnosing adenomyosis thus remains limited. Nevertheless it can help in the initial screening of women with possible adenomyosis.7,9
Ultrasound is a quick, safe, easy to use, and inexpensive modality that can identify adenomyosis without the need for surgery; 4 however, there are currently no standard diagnostic imaging criteria for adenomyosis. 11 Early ultrasonographic examination of the myometrium is of limited use for diagnosing adenomyosis3,4 because of its low sensitivity for detecting the disease. 12 In addition, quantitative analysis of ultrasonographic images to extract information on myometrial texture, characterized as hyperechoic (lighter grayscale on images), isoechoic (average grayscale on images), or hypoechoic (darker grayscale on images), is currently unavailable. 13 Advances in commercially available computer-aided image analysis (CAIA) substantially improve imaging of the endometrium using specific calculation programs, thereby helping to determine its structure and assess abnormal texture associated with adenomyosis.4,11,14 Quantitative texture analysis of ultrasonographic images can also be achieved using signal-intensity scores based on grayscale histograms of a region of interest on each image via CAIA, 14 as previously used to evaluate the endometrium, 15 liver texture, 16 and placental conditions. 17 Textural features of adenomyosis in ultrasonographic images, such as subendometrial linear striation, alterations in the junctional zone such as thickening or hyperplasia, and heterogeneous myometrium,11,18,19 can therefore be detected and quantitated using CAIA software and grayscale histograms, to provide an accurate diagnosis of adenomyosis.11,20
Magnetic resonance imaging is currently considered the best imaging modality for diagnosing adenomyosis, but its high cost and limited availability often make it less useful than transvaginal ultrasound, which provides a cost-effective, accurate, and accessible alternative. 20 Quantitative analysis of ultrasonographic images by computer-aided diagnosis can thus be a potentially useful tool for the diagnosis of adenomyosis. 14
In this study, we used computer-aided diagnosis to analyze grayscale histograms of regions of interest in the myometrium on ultrasound images, and determined its diagnostic feasibility in terms of assessing treatment outcomes in patients with adenomyosis. We also examined its relationship with corresponding serum CA-125 levels.
Materials and methods
Patients
This was a retrospective observational study of female patients attending Taipei Medical University Hospital, Taiwan, for infertility between 1 September 2018 and 5 April 2019. The study protocol study was approved by the Institutional Review Board of Taipei Medical University Hospital (IRB number: N201711084). Signed informed consent was obtained from all the patients at the time of ultrasound examination. The female patients were diagnosed with either suspected adenomyosis or adenomyosis, with abnormal CA-125 levels (>35 U/mL). 7 Patients with adenomyosis were treated with a 6- to 8-week course of gonadotropin-releasing hormone (GnRH) agonist (leuprorelin; Leuplin depot 3.75 mg® 1 vial subcutaneous injection; AbbVie Inc. Lake Bluff, IL, USA). Sonographic images and serum CA-125 levels were obtained on the day of confirmatory examination in women with suspected adenomyosis or on the day of receiving GnRH agonist treatment in women with adenomyosis, and again 6 to 8 weeks after GnRH agonist therapy as a measure of treatment outcome in patients with adenomyosis. The inclusion criteria were: no other hormonal therapy, no ovarian abnormalities, and no previous major gynecologic surgery. The patient selection procedure and exclusion criteria are presented in Figure 1.

Flow chart of the patient selection process.
Ultrasound examination and analysis
Sonographic images were divided into two groups:21,22 images taken before treatment (on the day of the injection), and images taken 6 to 8 weeks after treatment. Ultrasonography was performed in all patients by two gynecologists, each with more than 10 years of gynecological ultrasonography experience. All images were obtained using a Philips iU22 ultrasound system (Royal Philips Electronics, Eindhoven, The Netherlands) equipped with a curvilinear transvaginal wide-band 4 to 9 MHz transducer. Identical ultrasound settings, including magnification, focus line, gain, and time gain compensation, were used for each examination.
Image grayscale histogram quantification was carried out using ImageJ software (National Institutes of Health, Bethesda, MD, USA). 23 ImageJ is a public domain Java image-processing program that can calculate the pixel value and the area of a user-defined region (the myometrium) in the ultrasonographic image. Based on the signal-intensity score of the gray-level, the histograms of the endometrium were divided into 0 to 255 gray scales: hypoechoic (0 to 84 gray scales), isoechoic (85 to 170 gray scales), and hyperechoic (171 to 255 gray scales).15,17
Statistical analysis
The histogram results were compared with the adenomyosis treatment scores by two-tailed, non-parametric Mann–Whitney tests, using SPSS, version 24.0 (SPSS Inc., Chicago, IL, USA). For continuous variables, independent t-tests and one-way ANOVA tests were used to compare means between two or more groups, with Scheffe’s post hoc test. Differences between groups were considered significant if the P value was <0.05.
Results
Patients
From 104 patients, only 10 with adenomyosis and CA-125 > 35 U/mL met the study criteria (mean age 37.2 years, range 31–44 years) (Figure 1). Twenty ultrasonographic images were obtained from these 10 patients, 10 images before treatment and 10 images 6 to 8 weeks after GnRH agonist treatment.
CA-125 levels and histograms
The mean CA-125 level before treatment was 175.6961 U/mL and the mean level after treatment was 75.4665 U/mL. The levels for the included patients are shown in Table 1. CA-125 levels fell in all but one patient after treatment.
Distribution of CA-125 levels in patients before and after treatment.

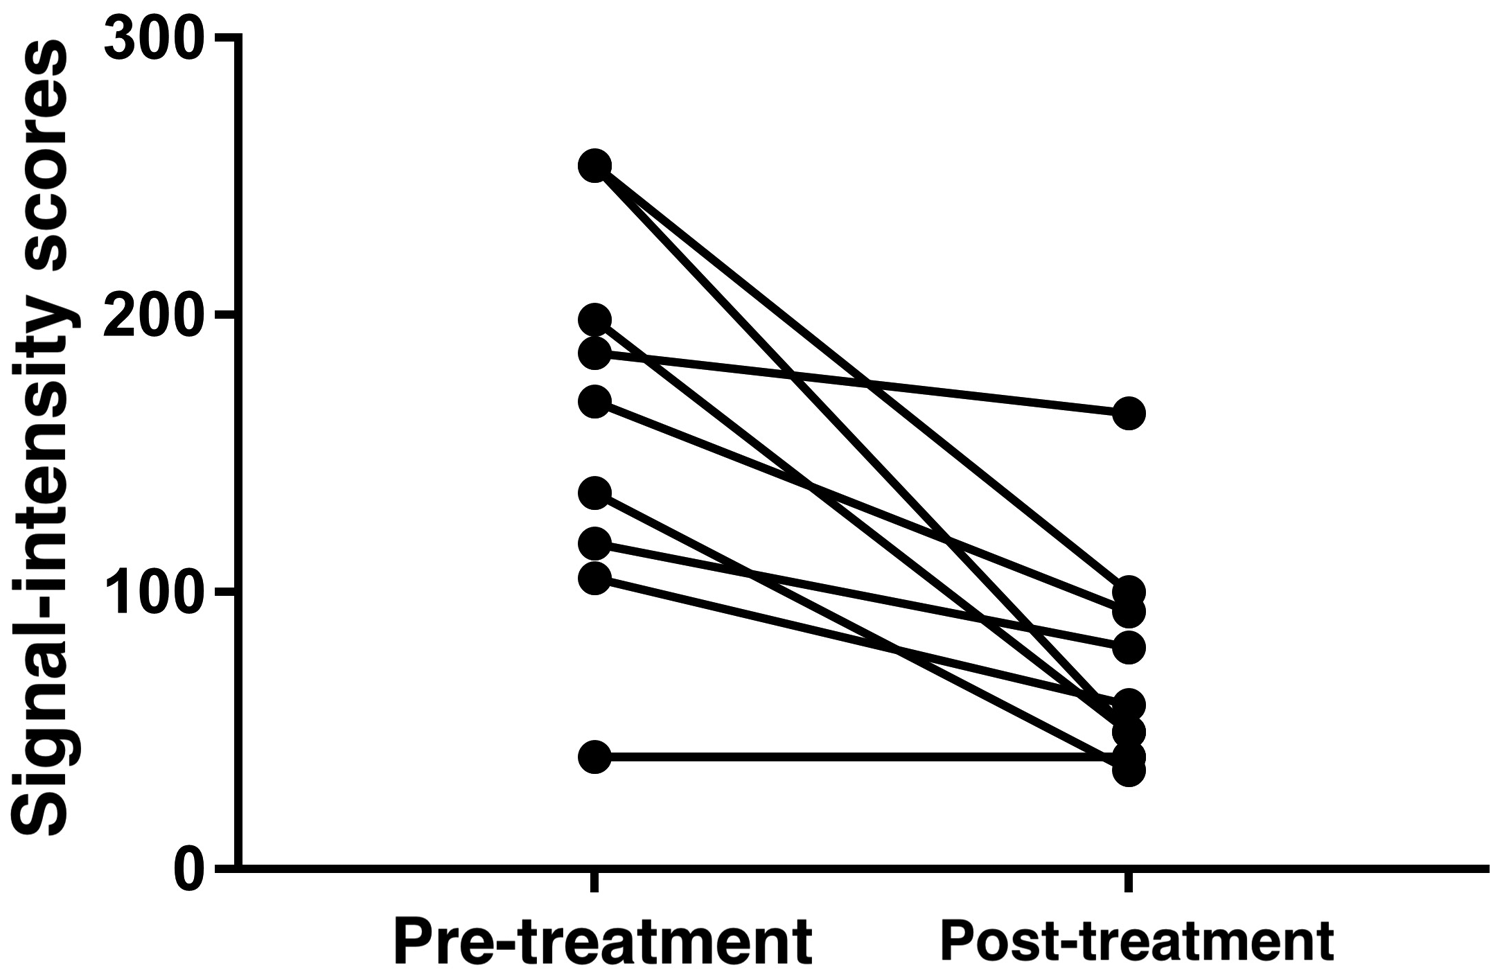
The intensity scores of the grayscale histograms before and after treatment were obtained using ImageJ software and used to characterize the sonographic data (Figure 2). The median signal-intensity score was significantly higher in the pre-treatment compared with the post-treatment images (Mann–Whitney test, P < 0.05).

Box-plots of signal-intensity scores of grayscale histograms based on ultrasound images before and after treatment. There was a significant relationship between classification of the myometrium pre-treatment and post-treatment using CA-125 levels and histogram grayscale analysis, using the Mann–Whitney test (P ≤ 0.05).
The effectiveness of CA-125 as a biomarker was evaluated pre-treatment and post-treatment by paired t-tests (Figure 3).5,7,9 The CA-125 levels before and after treatment according to the paired t-tests and the effectiveness for assessing GnRH agonist treatment outcomes are shown in Table 1.
Paired t-test data showed that the signal-intensity scores correlated with serum CA-125 levels, suggesting that ultrasonographic comparison could be used to evaluate the outcome of GnRH agonist treatment.
Representative ultrasound images and their corresponding histograms before and after treatment are shown in Figures 4 and 5, and Figures 6 and 7, respectively.

Ultrasound image of the uterus in a subject with adenomyosis myometrium before treatment. Yellow line indicates the border of the defined region of interest (myometrium and its contents).

Histogram for the user-defined region of the myometrium before treatment, using ImageJ analysis.

Ultrasound image of the uterus in a subject with adenomyosis myometrium after treatment. Yellow line indicates the border of the defined region of interest (myometrium and its contents).

Histogram for the user-defined region of the myometrium after treatment, using ImageJ analysis.
These results showed that the ultrasound image signal-intensity scores correlated with the serum CA-125 levels, indicating that grayscale ultrasonographic comparisons could be used to evaluate the outcome of GnRH agonist treatment.
Discussion
This pilot study demonstrated good discrimination ability for computer-aided analysis of grayscale histograms for differentiating between myometrial conditions, according to serum CA-125 levels. The diagnostic feasibility of evaluating myometrial conditions using CAIA analysis of grayscale ultrasound histograms for assessing treatment results in patients with adenomyosis has not been reported previously.
Myometrial abnormalities commonly lead to increased uterine size and volume. However, a previous study showed that measurement of uterine size and volume alone may lead to missed diagnoses. 24 Although serum CA-125 levels are susceptible to inflammatory changes, indicating that this measure may also not be a reliable tool for the diagnosis of adenomyosis, its application in monitoring the efficacy of treatment cannot be neglected. 6 In the current study, uterine size and volume, and also its contents and textures, were assessed quantitatively by analyzing grayscale histograms of ultrasound images of the myometrium. This approach will aid the initial evaluation of treatment success in women with adenomyosis treated with GnRH agonists.
ImageJ software is commonly used for post-processing images23,25 and ImageJ analysis of frequency-based ultrasonography has previously been used to diagnose ovarian malignancies. 26 Grayscale histograms of ultrasound images are useful tools for describing the texture of the tissue images.4,11,14 Another study reported that histogram information from B-mode ultrasound images could help to describe the texture of the abortus in medical abortions. 27 Using this method, quantitative ultrasound image echogenicity was shown to be more objective than the examiner’s subjective description. 27 The acquisition of ultrasound grayscale histograms has recently become easier because this feature has been incorporated into commercial sonographic equipment with advanced CAIA. 23 CAIA software allows grayscale histograms to be acquired for a tissue area defined by the user in an ultrasound image. The grayscale histogram can then provide detailed information about myometrial conditions by analyzing the image-pixel characteristics, such as the brightness (intensity), and histogram width and height (tissue size), in a user-defined area.23,28 In this study, the signal-intensity scores of each grayscale histogram classified by the CAIA method showed predictive value for assessing treatment success, in accordance with reduced CA-125 levels, in patients with adenomyosis.
The performance of diagnostic tests is commonly measured by sensitivity and specificity; 29 a high sensitivity combined with a high specificity indicates an ideal diagnostic test. 30 However, many tests routinely fall short of this ideal, and high specificity is often achieved by compromising sensitivity or vice versa. 30 The current method had the potential to accurately classify all patients, with statistically significant results despite the small sample size (P < 0.05).
This study had several limitations. First, the ultrasonographic examinations and CAIA used in this study were operator-dependent. Second, the diagnosis of adenomyosis in all patients was made by ultrasonographic examination, with no histopathological confirmation, which may limit the accuracy of our findings. Finally, the small sample size and irregular distribution of baseline characteristics in our patients may also have influenced the results. Further studies are therefore needed to verify the ability of CAIA software to distinguish between adenomyosis and myometrial abnormalities such as uterine congenital malformations, uterine fibroids, and malignancies.
This pilot study applied a grayscale recognition algorithm using CAIA to indirectly determine myometrial conditions based on the estimated serum CA-125 concentration ranges, by analyzing grayscale histograms of the myometrium from ultrasound images. The results of this study suggest that grayscale histograms of ultrasound images of the myometrium may help gynecologists to determine the efficacy of GnRH treatment in patients with adenomyosis in clinical practice.