
Abstract
Objective:
The aim of this study was to determine the 95% confidence interval (CI) cutoff for sonographic renal artery stenosis (RAS) parameters. A secondary objective was to determine the diagnostic accuracy parameters of peak systolic velocity (PSV), renal aortic ratio (RAR), acceleration index (AI), and acceleration time (AT) for diagnosing RAS.
Materials and Methods:
Diagnostic test accuracy (DTA) parameters and 95% CIs were evaluated for the sonographic cutoff values. A total of 31 articles were extracted and subjected to statistical analysis.
Results:
The mean 95% CI cutoff for PSV, RAR, AI, and AT were 192.50 (175.16, 209.84), 3.10 (2.83, 3.38), 3.39 (2.51, 4.27), and 80.78 (68.56, 93.01), respectively. The pooled mean 95% CI sensitivity of PSV, RAR, AI, and AT were 85.90% (79.84, 91.97), 82.34% (77.58, 87.11), 74.92% (64.53, 85.33), and 73.57% (63.01, 84.13), respectively, whereas the pooled mean specificity of the same parameters was 82.52% (75.78, 89.25), 86.97% (83.12, 90.82), 78.93% (66.34, 91.52), and 82.57% (70.70, 94.44), respectively.
Conclusion:
The pooled mean 95% CI for sensitivity and specificity of the sonographic parameters was concordant with the literature. Based on this higher level of evidence, except RAR, the mean 95% CI cutoff for PSV, AI, and AT were consistent with the cutoff values encountered in the published literature.
Keywords
Renal artery stenosis (RAS) refers to the luminal narrowing of one or more arteries supplying the kidneys. RAS is a preventable cause of secondary hypertension and ischemic nephropathy in adults, with an estimated prevalence of approximately 5% in adults. 1 The prevalence of RAS ranges from 14% to 42% in studies performed on patients with abdominal aortic or peripheral vascular disease and 11% to 23% in patients diagnosed with coronary artery disease. 1 A timely diagnosis of RAS is essential to prevent hypertension and impending ischemic nephropathy due to changes in the renin-angiotensin-aldosterone system (RAAS) autoregulatory mechanism. 2
Most cases of RAS are due to atherosclerosis or fibromuscular dysplasia (FMD), while minor causes of RAS are arterial dissection, arteritis, and neurofibromatosis. 3 Other less-common etiologies are vasculitis, renal artery aneurysm, radiotherapy, collagen vascular disease, or extrinsic compression. 4 RAS due to atherosclerosis is generally seen in the older demographics, while FMD causes RAS primarily in young and middle-aged females. 5 The origin of the renal artery from the aorta is the most frequent site for atherosclerotic stenosis. 6 RAS due to atherosclerosis tends to occur within the proximal vessel, whereas FMD has a predilection for the trunk or the distal renal artery. 7
The mechanism underlying renovascular hypertension (RVH) is the activation of the RAAS. In the case of RAS, with decreased renal perfusion, renin is secreted by the juxtaglomerular apparatus (JGA) in the afferent arteriole. 8 Renin circulates in the blood and cleaves angiotensinogen (secreted by the liver) into angiotensin 1, which is converted into angiotensin 2 in the vascular endothelium of the lungs and the kidneys. 9 Angiotensin 2 is a potent hormone that raises blood pressure by various mechanisms. 10 Diagnosing the etiology of RVH at the earliest opportunity is crucial to prevent irreversible kidney damage.
Diagnostic imaging is vital to managing RAS and subsequent RVH and biochemical workup. Captopril renography, computed tomography angiography (CTA), magnetic resonance angiography (MRA), and Doppler sonography are the four noninvasive radiologic imaging techniques for diagnosing RAS.3,11 The American College of Radiology (ACR) and the Society of Interventional Radiology (SIR) consider renal angiography the gold standard for diagnosing and evaluating RAS. 12 The literature consensuses that catheter angiography should be performed if noninvasive tests are equivocal or inconclusive despite clinical symptomatology.13–15 Angiography can pose risks of thromboembolism or contrast-associated acute kidney injury.16,17 This procedure has potentially significant complications, so clinicians have moved to noninvasive means to diagnose RAS. The American Institute of Ultrasound in Medicine (AIUM), Society of Pediatric Radiology (SPR), ACR, and the Society of Radiologists in Ultrasound (SRU) consider sonography an appropriate imaging technique to assess the renovascular systems. 18
Although there are many sonographic criteria for diagnosing RAS, the objective was to concentrate on four of the well-established sonographic parameters suggested in the literature. The four sonographic parameters for diagnosing RAS are peak systolic velocity (PSV) in the renal artery and renal aortic ratio (RAR; direct, extrarenal, or proximal criteria) and acceleration index (AI) and acceleration time (AT; indirect, intrarenal, or distal criteria). There appears to be inconsistency in the literature regarding the threshold cutoff sonographic criteria for diagnosing RAS or RVH. ACR appropriateness criteria for RVH suggest cutoff values for PSV between 180 cm/second and 300 cm/second, RAR ≥3.5, and AT ≥70 milliseconds. The ACR appropriateness criteria for RVH do not mention AI, but the majority of the literature suggests a cutoff value of <3 m/sec 2 as an indication for RAS.3,19–22 Therefore, the aim of this research was to determine the 95% confidence interval (CI) cutoff values for PSV, RAR, AI, and AT in detecting RAS in adults. A secondary objective was to determine the diagnostic test accuracy (sensitivity and specificity) of PSV, RAR, AI, and AT.
Materials and Methods
To evaluate the aim and objective of this research study, it was important to adopt a rapid review methodology. Cochrane defines a rapid review as a form of knowledge synthesis that accelerates the process of conducting a traditional systematic review by streamlining or omitting specific methods to produce evidence for stakeholders in a resource-efficient manner. 23 The study protocol was approved by PROSPERO, a priori, and registered with CRD number 42023447281. PROSPERO is an international systematic, rapid, umbrella review database of protocols for prospective studies with a potential health-related outcome. 24 Institutional review board (IRB) approval was deemed exempt due to the lack of human participation or patient records being utilized. The Preferred Reporting Items for a Systematic Review and Meta-Analysis of diagnostic test accuracy studies (PRISMA-DTA) approach focused on a rapid review deemed appropriate for the current study. 25
The rapid review methodology also applied the PICO framework. PICO stands for population, intervention, comparator, and outcome of the intended clinical question or study. 26 The population in this study consisted of adults aged ≥19 years with RAS or suspected of RAS. The intervention undertaken in this study consisted of evaluating the cutoff values and estimating the sensitivity and specificity of each of the four sonographic parameters for RAS. Since renal angiography is widely recognized as a gold standard for RAS, it was used as a reference standard for the sonographic diagnosis of RAS. The study’s outcome was evaluated based on the statistical analysis of the full-text articles. The selection criteria for screening the articles were based on inclusion and exclusion criteria. The inclusion criteria for selecting the articles were age ≥19 years with RAS or suspicion of RAS, peer review articles in the English language only, published in or after 1993 (depicting the role of at least one of the four sonographic parameters), articles mentioning diagnostic accuracy parameters, namely, sensitivity or specificity, with at least a 50% reduction in renal artery diameter, and finally all articles with human studies only. The exclusion criteria were language other than English or publications before 1993, any gray literature comprising conference papers, letters to the editor, or non–peer-review articles, and articles not mentioning at least one of the four sonographic parameters. Articles with RAS in renal transplant and in-stent stenosis were also excluded.
The rationale behind choosing the age cutoff of 19 years and above was to exclude the pediatric population. Medline search defines adults as those aged 19 years and above, while age groups 13 to 18 years are considered adolescents. 27 The authors did not place any upper limit on the age since the study was primarily based on adults. Moreover, atherosclerosis is one of the etiologies for RAS and is more common in an older demographic; hence, an upper age limit was not applied in the inclusion or exclusion criteria. The reason for excluding articles with renal transplant and in-stent stenosis is the reported different hemodynamics involved compared to native kidneys.28,29 Articles published before 1993 were excluded because of the ambiguity in using color-coded duplex sonography (CCDS) to determine the sonographic parameters. Many articles published before 1993 did not utilize CCDS to establish the diagnosis of RAS. 14 Although frequently performed for diagnostic purposes, we did not include resistive index (RI) as one of the intrarenal sonographic parameters owing to the physiologic increase of RI with age and hypertension. 30 Renal artery diameter reduction ≥50% was used as one of our inclusion criteria since RAS is considered to be significant at this level of stenosis. 2
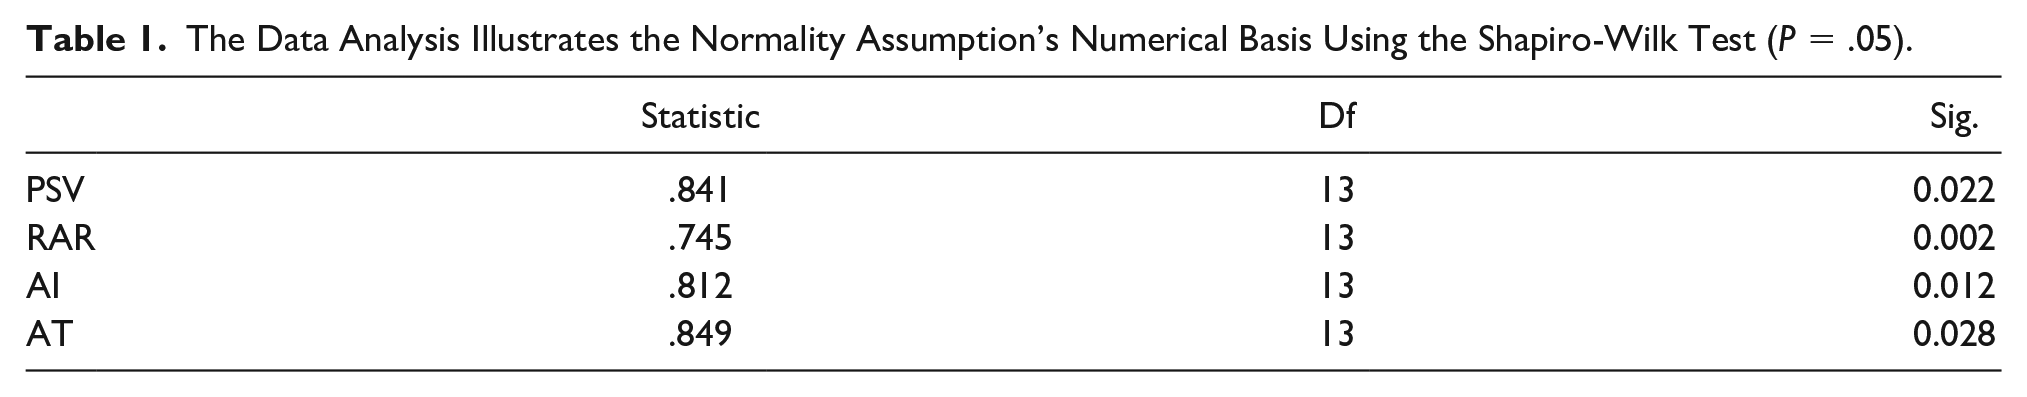
Parametric tests are more powerful than nonparametric tests and must satisfy certain statistical assumptions.30,31 Some of these assumptions are that (1) the data should follow a normal distribution, (2) the data are independent or without correlation, and (3) the data should be continuous. Nonparametric tests are recommended for data analysis if any of the aforementioned assumptions are unsatisfied. 32 The normal distribution of the four parameters is assessed numerically by the Shapiro-Wilk normality test since the sample size is less than 50. 33 Normality testing is one of the most critical assumptions that must be verified before proceeding with parametric tests. 34
Literature Procurement
A literature search was performed by a qualified university librarian using the following databases: Cochrane Central (OVID), Medline (OVID), Embase (OVID), and CINAHL (EBSCO). An initial search was conducted in Medline and then subjected to Peer Review of Electronic Search Strategies (PRESS) by the library staff before being translated to other databases. Medical Subject Heading (MESH) terms, Boolean operators, index/keywords, and appropriate truncation/wildcards were used to make the searches more relevant to the research objectives and inclusion and exclusion criteria. References from the included studies were screened for possible inclusion in the current study (see Supplemental Appendix 1—QR code).
Study Selection
Three thousand four hundred sixty-eight peer-reviewed articles from all four databases were imported into Rayyan software. 35 Three authors (GD, RPJ, and AG) conducted a pilot exercise on 20–25 abstracts to calibrate and test the screening methodology based on the predetermined selection criteria (inclusion and exclusion) by achieving an interrater reliability of at least 80% (Cohen’s kappa statistics, 0.80). GD and RPJ screened the rest of the abstracts using Rayyan software in the blind mode. Any discrepancies between the two authors were resolved by a third author (AG). Eighty-nine articles were included in the full-text review and screened by one author (GD) based on the selection criteria. A second author (RPJ) screened all the excluded articles for inadvertent exclusion. We included all articles that reported the cutoff values for at least one of the four sonographic parameters. The PRISMA chart below illustrates the selection process of the full-text articles 36 (see Figure 1).
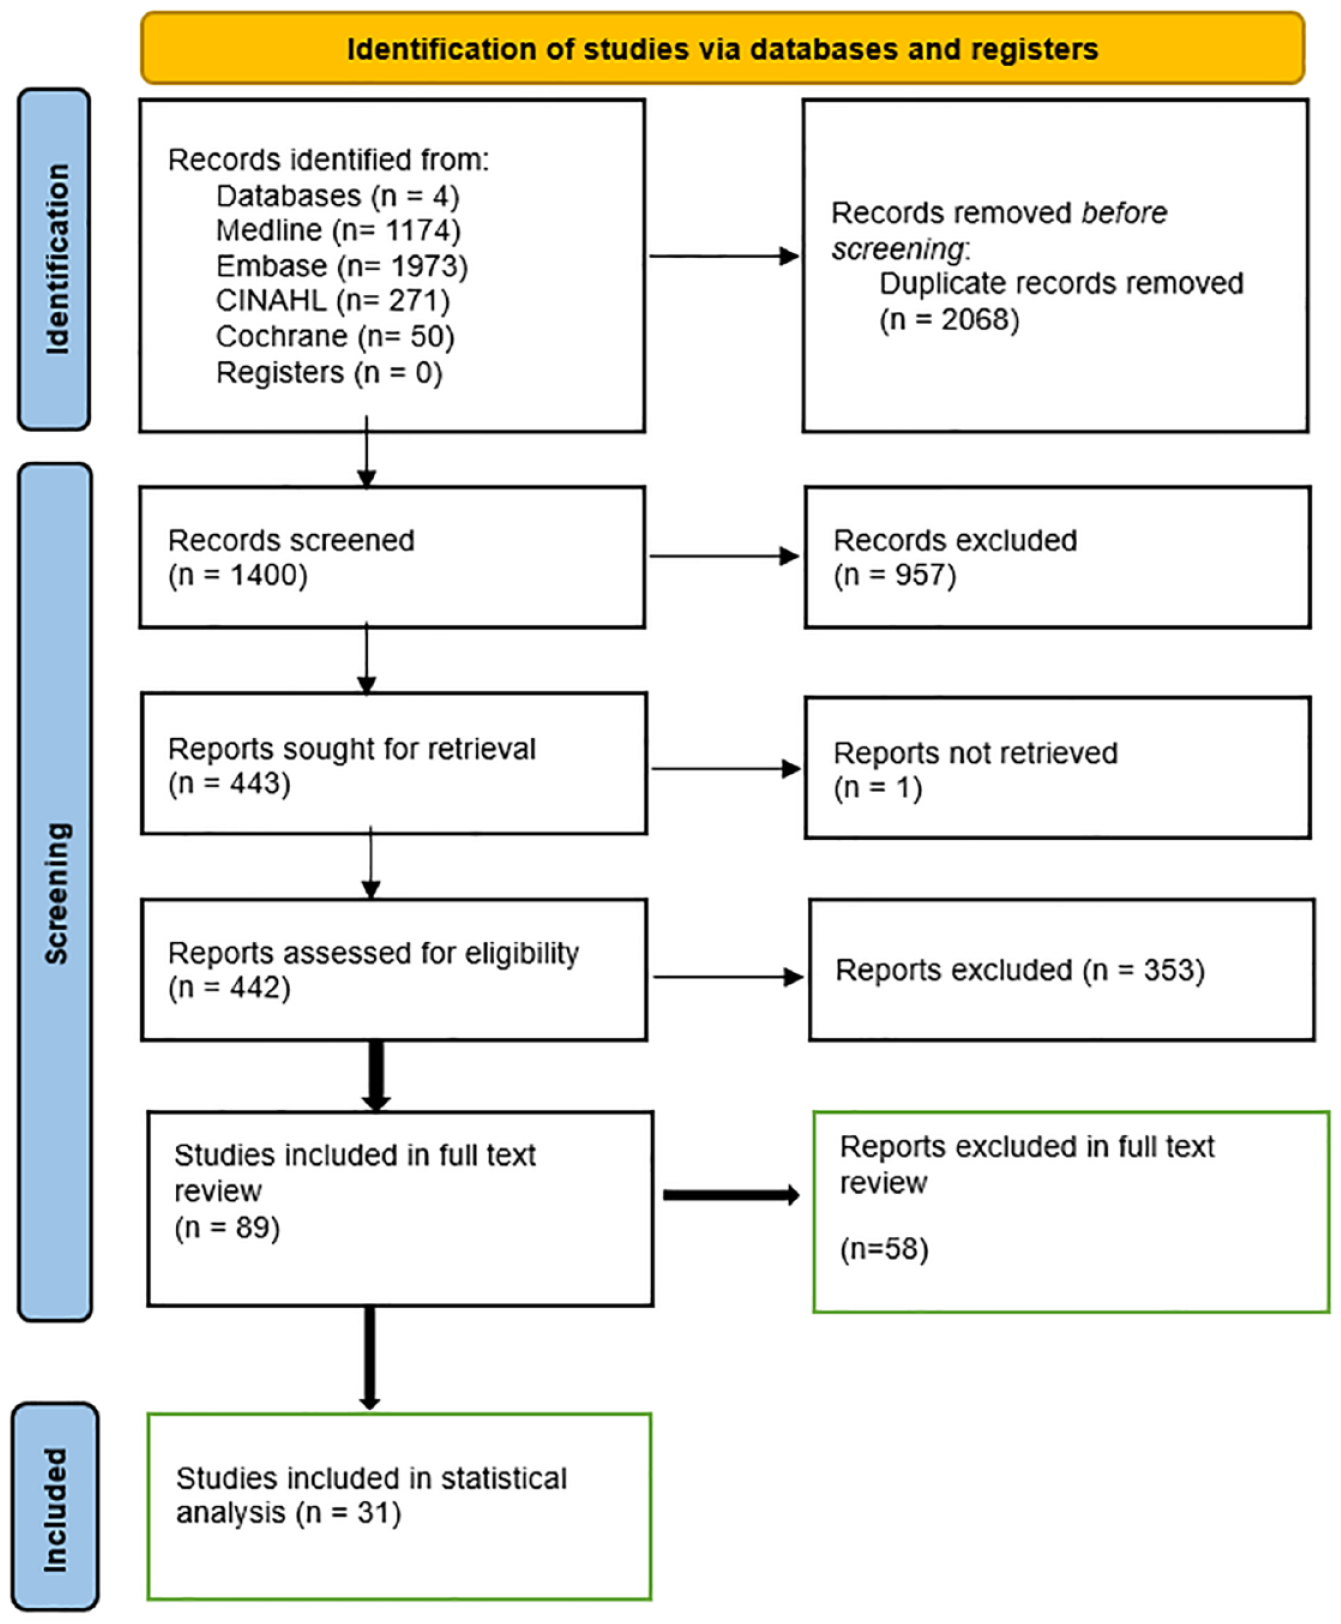
The Preferred Reporting Items for Systematic Reviews and Meta-Analyses (PRISMA) chart illustrates the stepwise inclusion of the final number of articles for statistical analysis for renal artery stenosis (RAS).
Results
Data Extraction and Risk-of-Bias Assessment
The raw data for sensitivity, specificity, and cutoff values for PSV, RAR, AI, and AT (from the 31 articles) were extracted and recorded in Microsoft Excel. It is important to note that not all articles included in the final stage reported cutoff values for all four sonographic parameters.
At least two authors (GD and RPJ) extracted the data independently, tallied it in Microsoft Excel, and then recorded it in Microsoft Word (see Supplemental Appendix 2—QR code). Minor discrepancies were resolved by consensus among the authors. Quality assessment of diagnostic accuracy studies (QUADAS)-2 was used to mitigate the risk of bias or assess the quality of the study. 37 The two authors (GD and RPJ) diligently assessed the four components of QUADAS-2 to evaluate the risk of bias. Any discrepancy was carefully addressed with the assistance of the third author (AG; see Supplemental Appendix 1—QR code). The final Excel dataset was imported into the Statistical Package for Social Sciences (SPSS 29.0) for statistical analysis. 38
Normality Assumption for PSV
The hypothesis: The null hypothesis (H0) states that the PSV cutoff values are normally distributed, while the alternate hypothesis (Ha) assumes that the cutoff values have asymmetric distribution. The authors decided to use α = 0.05 as the level of signification. The null hypothesis is rejected for PSV since the P = .022 < .05. Thus, at α = 0.05, there is evidence to reject the assumption that the true mean PSV cutoff values are normally distributed (P = .022). Likewise, no evidence supports the assumption that RAR, AI, and AT datasets are normally distributed at P-values of .002, .012, and .028, respectively (see Table 1). Thus, the normality assumption is violated for all four sonographic parameters. Therefore, a nonparametric statistical analysis was performed to evaluate PSV, RAR, AI, and AT. The binomial or sign test was used to analyze the four sonographic parameters statistically.
The Data Analysis Illustrates the Normality Assumption’s Numerical Basis Using the Shapiro-Wilk Test (P = .05).
Binomial Test
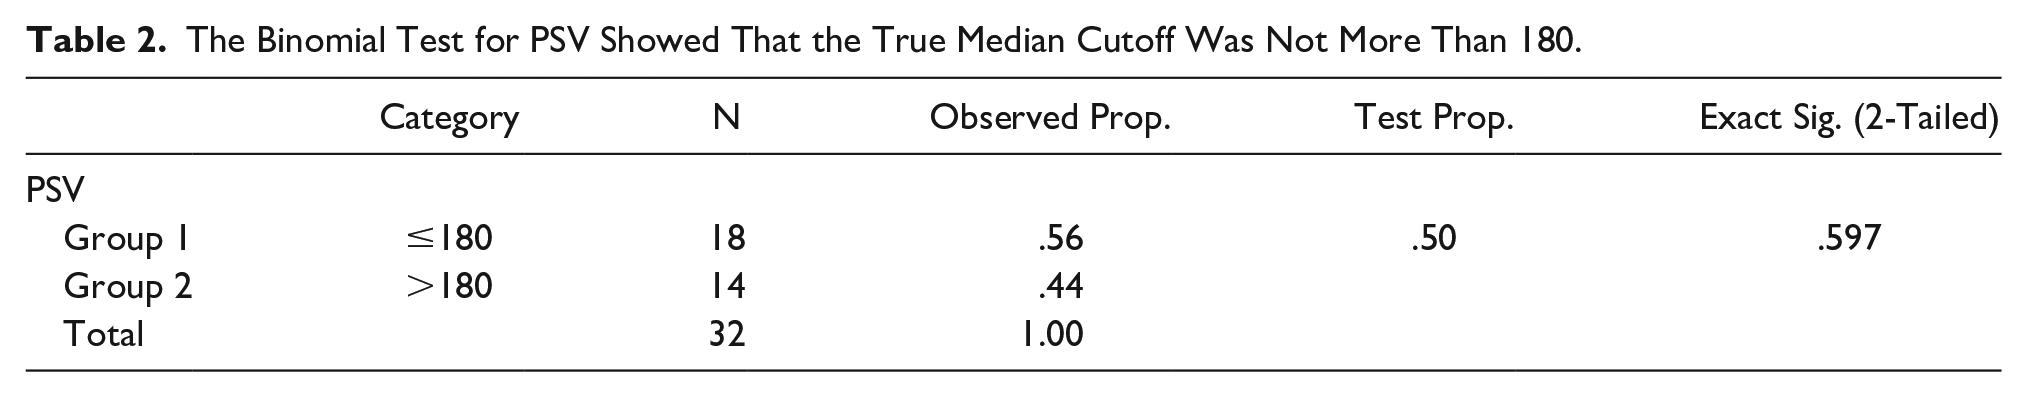
The binomial test for PSV is interpreted as follows: the hypothesis: H0 (null hypothesis): M = 180 (the true median PSV cutoff is 180 cm/second); Ha (alternate hypothesis): M > 180 (the true median PSV cutoff value is greater than 180). Decision rule: Since the P-value is 1 = .597/2 = .70 > .05 = α, we do not reject H0. Conclusion: At the 5% significance level, there is no evidence to conclude that the true median PSV cutoff value is greater than 180 cm/second (P-value = .70; see Table 2). Similarly, after defining the null and alternate hypothesis for RAR, AI, and AT, it was concluded that the true median cutoff values for RAR, AI, and AT are not more than 3.5, 3 m/sec 2 , and 70 milliseconds, respectively.
The Binomial Test for PSV Showed That the True Median Cutoff Was Not More Than 180.
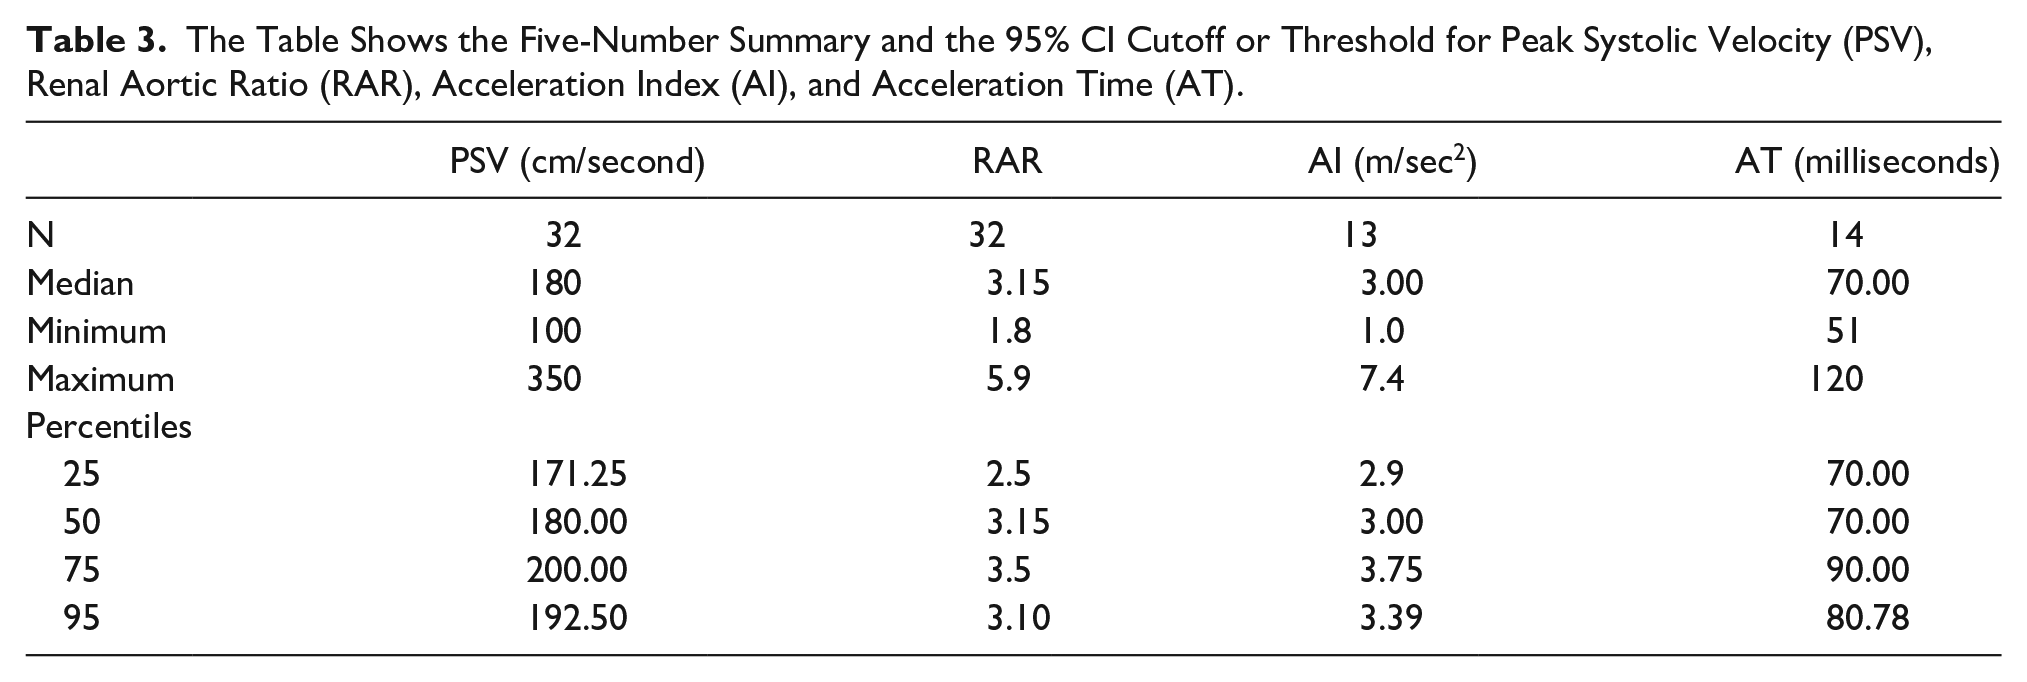
A five-number summary is an acceptable way of displaying the dataset’s asymmetric, skewed, or non-normal distribution. 39 Five number summaries for the above four sonographic parameters are shown in Table 3. For instance, a five-number summary in the case of PSV (see Table 3) is described as follows: minimum = 100, maximum = 350, first quartile or Q1 = 171.25, middle quartile or median = 180, and third quartile or Q3 = 200. Likewise, the five-number summary for RAR, AI, and AT can be elucidated accordingly. Furthermore, many authors encourage CIs in biomedical sciences, with 95% of the most commonly reported CI in the literature.40,41 The numerical expression of 95% CI for the cutoff of PSV, RAR, AI, and AT was calculated to be 192.50 [175.16, 209.84], 3.10 [2.83, 3.38], 3.39 [2.51, 4.27], and 80.78 [68.56, 93.01], respectively (see Table 3).
The Table Shows the Five-Number Summary and the 95% CI Cutoff or Threshold for Peak Systolic Velocity (PSV), Renal Aortic Ratio (RAR), Acceleration Index (AI), and Acceleration Time (AT).
Secondary Aim
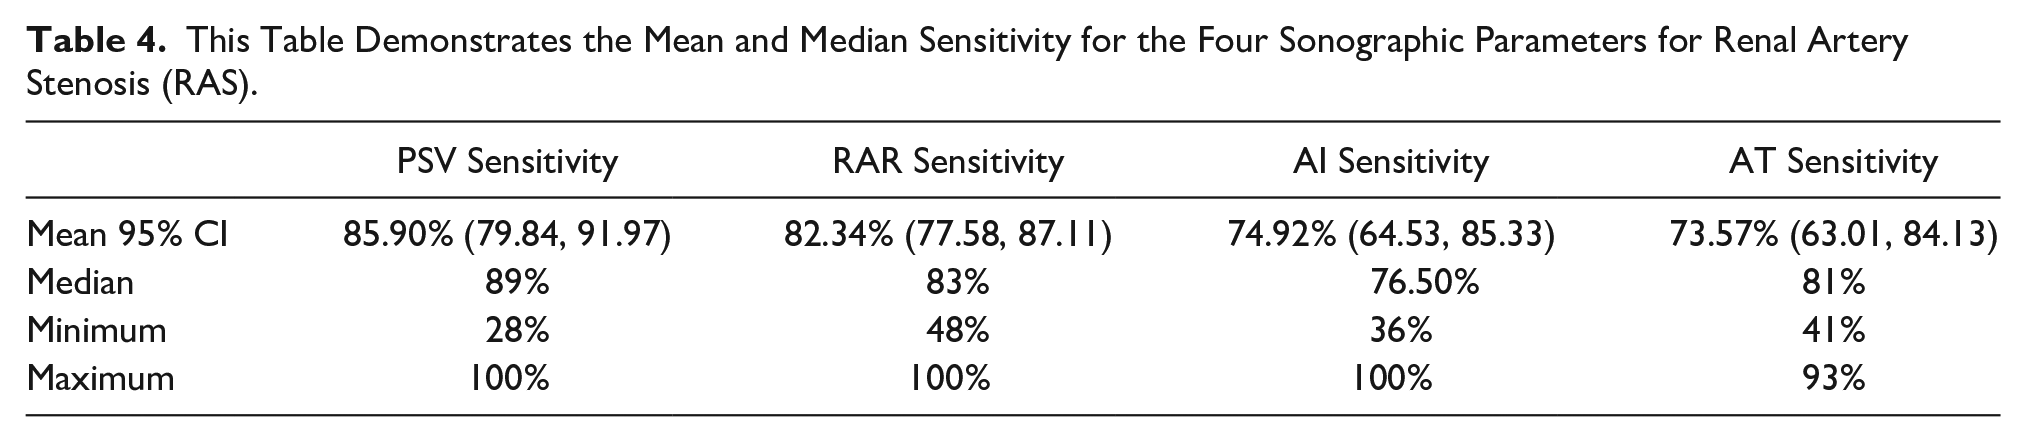
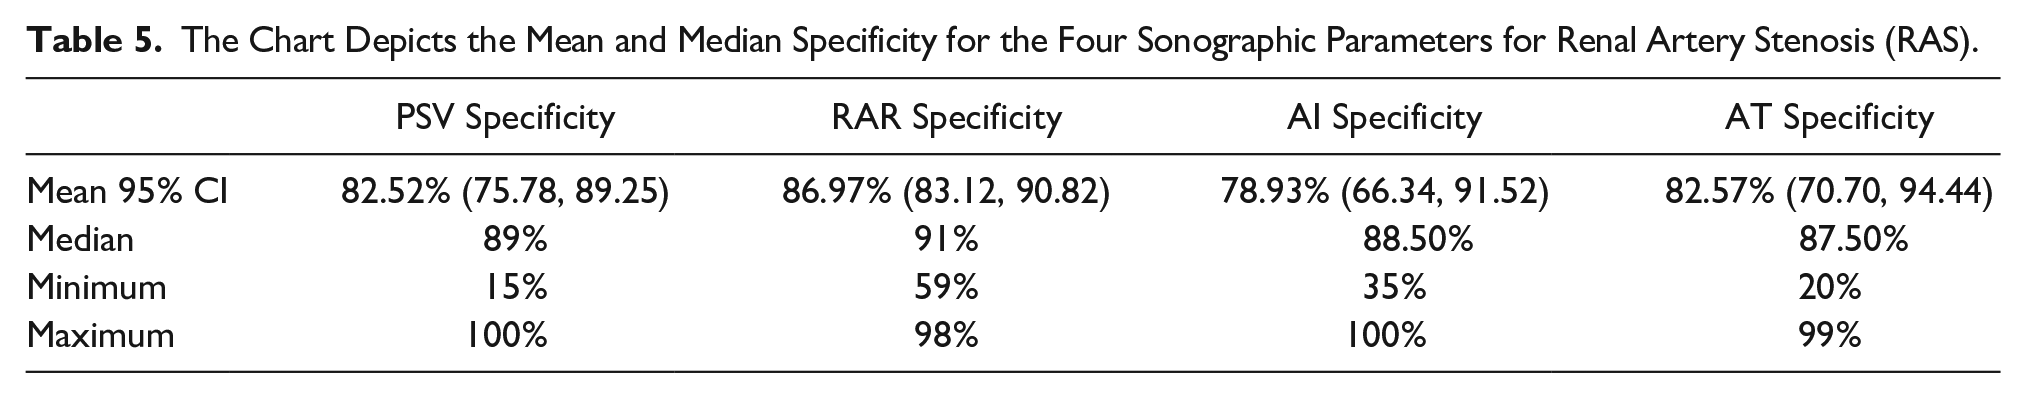
The secondary aim of the study was to describe the diagnostic accuracy parameters for PSV, RAR, AI, and AT. The mean diagnostic accuracy parameters (sensitivity and specificity) for PSV, RAR, AI, and AT were computed using the SPSS software. The mean 95% CI sensitivity for PSV, RAR, AI, and AT was 85.90% (79.84, 91.97), 82.34% (77.58, 87.11), 74.92% (64.53, 85.33), and 73.57% (63.01, 84.13), respectively, while the mean specificity for the same four parameters were 82.52% (75.78, 89.25), 86.97% (83.12, 90.82), 78.93% (66.34, 91.52), and 82.57% (70.70, 94.44), respectively (see Tables 4 and 5). The median sensitivity for PSV, RAR, AI, and AT was 89%, 83%, 76.50%, and 81%, while the median specificity for the same parameters was 89%, 91%, 88.50%, and 87.50%, respectively (see Tables 4 and 5).
This Table Demonstrates the Mean and Median Sensitivity for the Four Sonographic Parameters for Renal Artery Stenosis (RAS).
The Chart Depicts the Mean and Median Specificity for the Four Sonographic Parameters for Renal Artery Stenosis (RAS).
Discussion
In the present study, since the data displayed asymmetric distribution for all sonographic criteria for RAS, the mean 95% CI for the cutoffs and the mean 95% CI for the diagnostic accuracy parameters should be interpreted cautiously. CI is generally deduced in the context of a normal distribution.39,42,43 The authors recommend using the median cutoff value for all four sonographic parameters rather than the mean 95% CI.
The median cutoff value for RAR in the present study was calculated to be 3.15 (see Table 3). Except for RAR, the mean 95% CI for all the other three sonographic parameter cutoff values were within the range of cutoff values commonly followed in the literature. The mean 95% CI cutoff value for RAR in the current study was 3.10, with the upper limit at 3.38 and the lower limit at 2.83. The most widely accepted/adopted cutoff value for RAR in the literature (e.g., 3.5) is outside the upper limit of the 95% CI. If the CI (α) is decreased to 0.01, the upper limit of 99% CI for RAR extrapolates to 3.47, again under the commonly accepted threshold for RAR (e.g., 3.5). In the current study, it is essential to note that the threshold of 3.5 for RAR is not wrong, but it simply denotes that this cutoff is three standard deviations above the mean on a Gaussian bell curve. In summary, a high cutoff (e.g., ≥3.5 in the case of RAR) will decrease sensitivity but increase specificity. 44 For instance, a retrospective cohort study published in 2012 demonstrated an increase in specificity from 72% to 99% when the RAR threshold is raised from 3 to 5. 45 The interpreting physician must decide the trade-off between sensitivity and specificity based on their experience with sonographic diagnosis or screening of RAS.
Most of the literature considers cutoff values for PSV between 180 cm/second and 300 cm/second. 20 Miralles et al. 46 suggested a cutoff at 198 cm/second, while Kohler et al. 47 and Olin et al. 11 advocated PSV values above 200 cm/second as significant for RAS. Hansen et al. 48 reported that the cutoff value of PSV above 180 cm/second suggests a hemodynamic compromise in the renal vasculature and is, hence, ideal for screening RAS. Some authors believe that PSV ≥ 180 cm/second has a negative predictive value (NPV) of 95%, so there is no need to measure any other parameters for RAS.29,49 The current study’s true median PSV cutoff value was not established statistically above 180 cm/second (see Table 2). Thus, 180 could be used as a threshold or cutoff sonographic parameter for RAS screening. The mean 95% CI for PSV cutoff was calculated to be 192.50 cm/second, with the upper limit at 209.84 cm/second and the lower limit at 175.16 cm/second. Hua et al. 50 reported that PSV was the best criterion for ruling out RAS and did not recommend the other three parameters as playing a significant role in the RAS assessment. Kawarada et al. 51 also supported PSV as the best parameter for detecting RAS.
Likewise, the median sonographic threshold for AI was calculated to be 3 m/sec 2 , while the mean 95% CI for AI was established to be 3.39, with the lower limit at 2.51 m/sec 2 and the upper limit at 4.27 m/sec 2 . The median cutoff for AT was 70 milliseconds, while the mean 95% CI for the same parameter was at 80.78 milliseconds, with the lower limit at 68.56 milliseconds and the upper limit at 93.01 milliseconds (see Table 3). The median and mean 95% CI cutoff values for both the intrarenal parameters in the current study were concordant with what is reported ubiquitously in the literature and support the work of other authors.3,52,53 Some authors do not support relying on intrarenal sonographic parameters for ruling out RAS.29,54,55 Some studies have recommended combining intrarenal and extrarenal sonographic parameters to rule out RAS.52,53 The authors believe this to be an appropriate sonographic strategy for RAS screening or diagnosis. Due to bowel gas, sonographic evaluation of the renal artery from the aorta to the renal hilum can be difficult, regardless of the patient’s fasting state or different scanning planes. Hence, intrarenal sonographic parameters can serve as secondary nonspecific markers of RAS.
The 95% CI of the sensitivity and specificity of all four sonographic parameters for RAS was consistent with the literature review (see Tables 4 and 5). It is important to note that the diagnostic accuracy parameters for the four sonographic criteria for screening RAS should not be compared because SPSS did not account for the missing data for AI and AT. The datasets/variables for AI and AT are fewer than those for PSV and RAR (see Supplemental Appendix 2—QR code). Hence, the measure of central tendency, especially the mean, could have been affected by the sample size.56,22
Limitations
Only four of the most common sonographic parameters for diagnosing RAS were assessed in this study. The current study did not compare the four sonographic parameters to determine the best diagnostic accuracy criteria for RAS. The exclusion of gray literature and language restrictions may have limited the search results and data interpretation. Lastly, articles with duplicated or accessory renal arteries were not included in this study since most of the screened articles did not appear to confirm the renal artery duplication with angiography or address the significance of RAS in association with renal artery duplication.
Conclusion
Based on the current statistical analysis, rather than adhering to a single cutoff value for the sonographic diagnosis of RAS, a range of cutoff values, preferably within the 95% CI, might better predict the disease. Thus, in the current study, completing the objective of recommending or suggesting robust cutoff values on sonographic parameters for RAS screening was implausible. Future studies could overcome this if a systematic review (rather than a rapid review) with a larger sample size is obtained by placing fewer restrictions on the eligibility criteria and implementing a more robust parametric statistical analysis with forest plots and receiver operating curves (ROC). Moreover, in the current study, the mean 95% CI of sensitivity and specificity of all four sonographic parameters were concordant with the literature. It is essential to recognize that intrarenal sonographic parameters must be complemented with PSV and RAR to increase the CI of sonographic diagnosis of RAS. The 95% CI for the PSV, AI, and AT cutoff values were consistent with the literature. The commonly utilized cutoff value of 3.5 in the literature for RAR was outside the upper limit of the 95% CI. Regardless of the statistical analysis, the practicing clinician must take care in interpreting the statistical results as having clinical significance, especially if the sample size is small. 57 In conclusion, Doppler sonography plays an important diagnostic role in the preliminary screening or diagnosis of RAS.
Supplemental Material
sj-docx-1-jdm-10.1177_87564793241260732 – Supplemental material for The Diagnostic Accuracy of Sonographic Parameters for Renal Artery Stenosis in Adults: A Rapid Literature Review Based on a Statistical Approach
Supplemental material, sj-docx-1-jdm-10.1177_87564793241260732 for The Diagnostic Accuracy of Sonographic Parameters for Renal Artery Stenosis in Adults: A Rapid Literature Review Based on a Statistical Approach by Gurinder Dhanju, Iain Kirkpatrick, Ashraf Goubran, Sheldon Wiebe, Rachan Preet Jammu and Nicole Askin in Journal of Diagnostic Medical Sonography
Supplemental Material
sj-docx-2-jdm-10.1177_87564793241260732 – Supplemental material for The Diagnostic Accuracy of Sonographic Parameters for Renal Artery Stenosis in Adults: A Rapid Literature Review Based on a Statistical Approach
Supplemental material, sj-docx-2-jdm-10.1177_87564793241260732 for The Diagnostic Accuracy of Sonographic Parameters for Renal Artery Stenosis in Adults: A Rapid Literature Review Based on a Statistical Approach by Gurinder Dhanju, Iain Kirkpatrick, Ashraf Goubran, Sheldon Wiebe, Rachan Preet Jammu and Nicole Askin in Journal of Diagnostic Medical Sonography
Supplemental Material
sj-pdf-3-jdm-10.1177_87564793241260732 – Supplemental material for The Diagnostic Accuracy of Sonographic Parameters for Renal Artery Stenosis in Adults: A Rapid Literature Review Based on a Statistical Approach
Supplemental material, sj-pdf-3-jdm-10.1177_87564793241260732 for The Diagnostic Accuracy of Sonographic Parameters for Renal Artery Stenosis in Adults: A Rapid Literature Review Based on a Statistical Approach by Gurinder Dhanju, Iain Kirkpatrick, Ashraf Goubran, Sheldon Wiebe, Rachan Preet Jammu and Nicole Askin in Journal of Diagnostic Medical Sonography
Footnotes
Acknowledgements
We acknowledge our families, colleagues, management, and radiologists at the prestigious St. Boniface Hospital (Winnipeg), Saskatchewan Health Authority, and the University of Manitoba for providing the necessary support for publishing this rapid review of renal artery stenosis with Sage Publications Inc.
Declaration of Conflicting Interests
The authors declared no potential conflicts of interest with respect to the research, authorship, and/or publication of this article.
Funding
The authors received no financial support for the research, authorship, and/or publication of this article.
References
Supplementary Material
Please find the following supplemental material available below.
For Open Access articles published under a Creative Commons License, all supplemental material carries the same license as the article it is associated with.
For non-Open Access articles published, all supplemental material carries a non-exclusive license, and permission requests for re-use of supplemental material or any part of supplemental material shall be sent directly to the copyright owner as specified in the copyright notice associated with the article.