
Abstract
Objective:
The primary purpose is to define the mean renal artery anastomosis peak systolic velocity (RAA PSV) and the renal artery anastomosis to external iliac artery ratio (RAA-to-EIA) of renal transplant recipients without graft dysfunction. Moreover, to determine associations with type of vascular anastomosis and type of graft.
Materials and Methods:
This is a single-center retrospective analysis of kidney transplant recipients. Recorded variables included recipient age, type of vascular anastomosis, type of graft, RAA PSV, and external iliac artery PSV (EIA PSV). Such variables were evaluated on different postoperative follow-up periods.
Results:
There was a high degree of reliability between the RAA PSV and EIA PSV (P < .001). The mean RAA PSV was 174 cm/s ± 72.9 cm/s with 95% confidence interval (CI) (162.2 cm/s-185.5 cm/s].
Conclusion:
This study highlights the importance of determining the normal range of RAA PSV and showed that a high PSV does not necessarily indicate dysfunction.
Kidney transplantation (especially with living donor kidneys) represents an optimal therapy for patients with end-stage renal disease, leading to better long-term survival and quality of life than dialysis.1,2 After remaining relatively stable for many years, the number of kidney transplants has increased since 2015, reaching the highest annual count in 2019. While the number of living-donor transplants rose again in 2019, only a tiny proportion of the waiting list receives living-donor transplants. 3
Renal transplant arterial anatomy can vary. In deceased donor transplantation, the donor renal artery is frequently accompanied by a trimmed segment of donor aorta (Carrel patch) and anastomosed to the recipient external iliac artery (EIA) in an end-to-side fashion. In the case of a living kidney donor, end-to-side anastomosis of the donor renal artery and recipient EIA is usually performed. 4
Updates of immunosuppressive protocols and surgical techniques have decreased morbidity and improved patient and graft survival in kidney transplant recipients.5–7 However, surgical complications continue to increase the morbidity of these patients. One of these surgical complications is renal artery stenosis (TRAS), which constitutes 75% of vascular complications.8–11 It is a relatively frequent complication with an incidence between 1 and 23% and generally presents 3 to 24 months after transplant surgery.12–15 If not treated, TRAS can lead to graft loss; therefore, early diagnosis is crucial to prompt management and successful treatment of complications.16–18
Evaluating vascular patency of the graft is paramount in reducing dysfunction. Currently, TRAS is diagnosed mainly through the following methods: digital subtraction angiography (DSA), color Doppler ultrasound (CDU), computed tomography angiogram (CTA), and magnetic resonance angiogram (MRA). DSA is still the gold standard for the diagnosis of TRAS. 19 However, the frequently used first-line imaging tool to evaluate allograft dysfunction and complications is CDU. 20 It is a readily available noninvasive method to study peak systolic velocity (PSV) of the transplanted renal artery and the transplanted renal artery to external iliac artery ratio (RAA-to-EIA). 21 The first and most important sign is the elevated PSV, which can have different cut-off values depending on the author, usually >2 m/s. Regarding the RAA-to-EIA ratio, the abnormal value is usually 1.8 to 2, though this finding is controversial.22–25
Nonetheless, the normal range of PSV in renal transplants without clinical suspicion for TRAS is not well established. According to multiple authors, this velocity can range from 130 to 300 cm/s.26–28 Determining these values would be crucial to guide the management of graft dysfunction.
The main goal of this study was to define the mean renal artery anastomosis PSV (RAA PSV) and the RAA-to-EIA ratio in renal transplant recipients without clinical evidence of graft dysfunction. Also, to assess the general agreement between RAA PSV and the PSV in the EIA (EIA PSV) and evaluate how these parameters change after transplantation on different follow-up periods. Finally, to study the influence of vascular anastomosis and type of graft (living or deceased kidney donor) upon the RAA PSV.
Materials and Methods
This is a single-center retrospective analysis of kidney transplant recipients at a local hospital from May 2010 to March 2020. The University of Miami Institutional Review Board approved this study and waived written informed consent.
Sonography Protocol
Patients underwent CDU evaluation at different periods after renal transplant according to the standard departmental protocol. Credentialed medical sonographers performed the examinations, and board-certified radiologists interpreted the studies. Renal morphologic characteristics and size were first evaluated with gray-scale sonography, followed by color Doppler and spectral Doppler analysis of the ipsilateral EIA, the renal artery anastomosis, and the interlobar vessels (Figure 1).
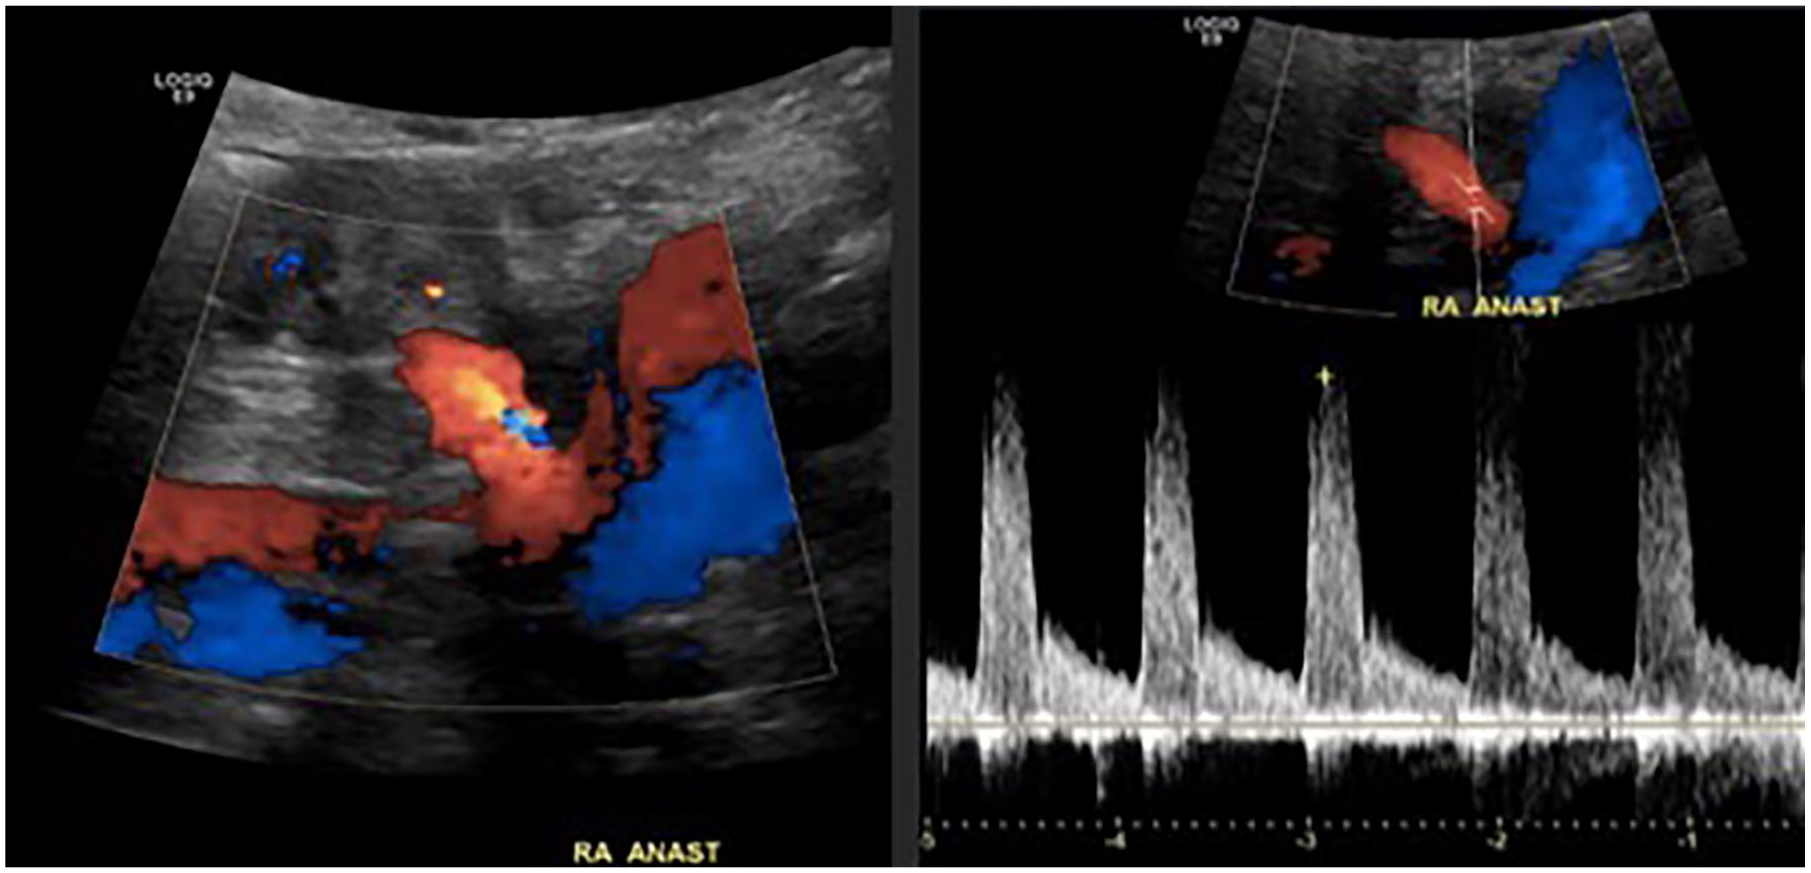
Color and spectral Doppler analysis of the renal artery anastomosis. Optimal insonation angle of <60°. Low resistance waveform in the renal artery anastomosis.
Data Retrieval
Data from patients were retrospectively retrieved from the institutional search engine using the keywords “ultrasound renal transplant” and “renal artery anastomosis” and subsequently selected for the absence of TRAS. Therefore, exclusion criteria included graft dysfunction (increased creatinine), refractory hypertension or graft failure, confirmed renal artery stenosis, more than 1 renal artery anastomosis, and death during the follow-up period. Repeated search result for the same patient was also considered an exclusion criterion.
The collected variables included age at the time of transplant, living or deceased kidney donor, type of vascular anastomosis, number of donor arteries, RAA PSV, and EIA PSV. These variables were evaluated for each postoperative follow-up period: 0 to 2 days, 1 month, 6 months, 12 months, 5 years, and more than 5 years.
Statistical Analysis
Statistical analysis was conducted using the software RStudio version 1.2.1335. Descriptive measures such as mean, median, standard deviation, and interquartile range were computed. T-test, intraclass correlation coefficient, and pairwise plots were performed to explore the association between the RAA PSV and EIA PSV. Analysis of variance (ANOVA) and box plots were used to assess the association of vascular anastomosis and type of graft with the RAA PSV.
Results
A total of 431 patients were retrieved from the renal transplant ultrasound search. Of these, 120 were excluded due to graft dysfunction, failure, or death. More than 1 renal artery anastomosis was present in 74 subjects, who were also excluded. Repeated search results were obtained in 90 subjects, therefore, also omitted. The remaining 147 subjects met the inclusion criteria and were included for further analysis. The mean age for the entire cohort was 54.9, with the majority (87.1%) receiving deceased donor grafts (Table 1). The predominant type of anastomosis was an end-to-side single renal artery on Carell patch to the external iliac artery (46.3%) (Table 1).
A Summary Demographics Based on the Dataset Variables.
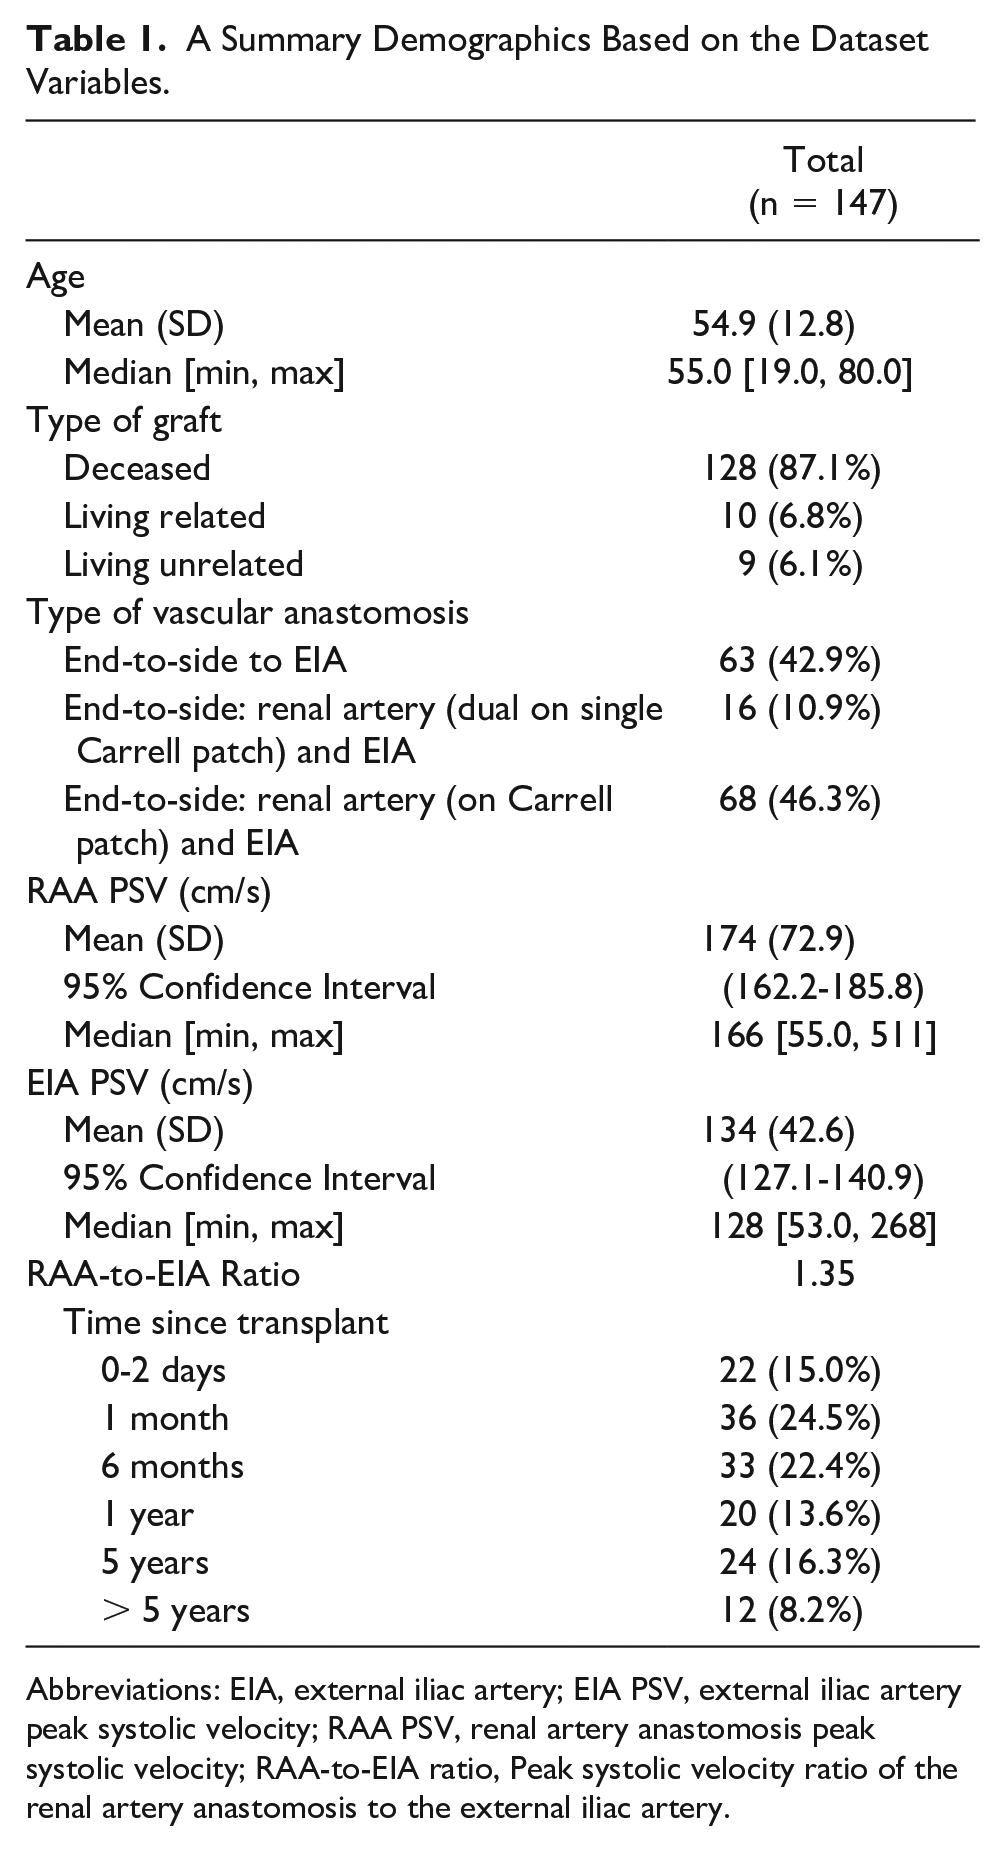
Abbreviations: EIA, external iliac artery; EIA PSV, external iliac artery peak systolic velocity; RAA PSV, renal artery anastomosis peak systolic velocity; RAA-to-EIA ratio, Peak systolic velocity ratio of the renal artery anastomosis to the external iliac artery.
Association Between RAA PSV and EIA PSV
The following results are listed in Table 1. The mean RAA PSV was 174 cm/s ± 72.9 cm/s with 95% confidence interval (CI) (162.2 cm/s-185.5 cm/s], and a median of 166 cm/s. The mean EIA PSV was 134 cm/s ± 42.6 cm/s with 95% CI (127.1 cm/s–140.9 cm/s], and a median of 128 cm/s. The mean ratio between RAA and EIA was 1.35.
Overall, the RAA PSV and EIA PSV tend to increase proportionally in the same direction, specifically if the PSV is between 50 and 200 cm/s (Figure 2). This effect is consistent among the different timelines and translates into a mean RAA-to-EIA ratio never greater than 2, which is the generally considered abnormal value. There was a high degree of reliability between the RAA PSV and EIA PSV (P < .001).
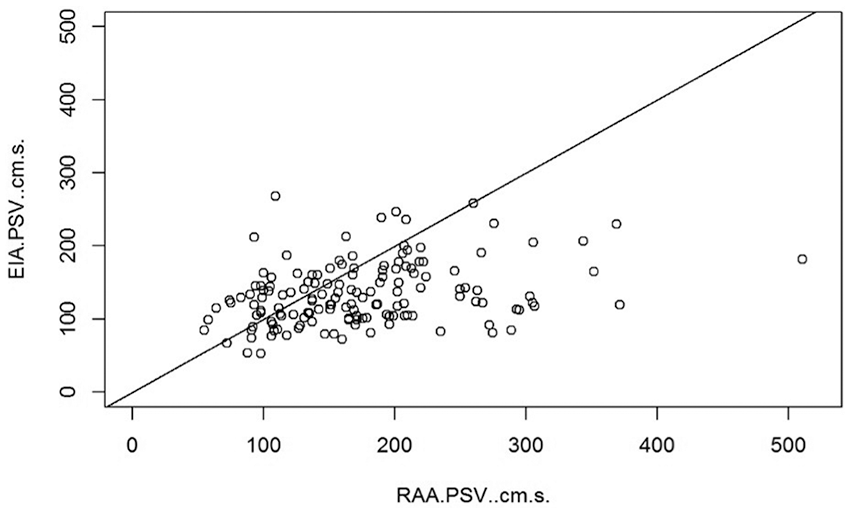
A plot of the general agreement between RAA PSV and EIA PSV. The RAA PSV and EIA PSV tend to increase proportionally in the same direction, more notable when the PSV is between 50 and 200 cm/s. EIA PSV, external iliac artery peak systolic velocity; PSV, peak systolic velocity; RAA PSV, renal artery anastomosis peak systolic velocity.
Stratified Analysis According to Each Timeline Period
In the 0 to 2 days period, 22 patients were included (Table 1). The median RAA PSV was 160 cm/s (range: 75-352 cm/s), and the mean RAA-to-EIA ratio was 1.4 (Table 2).
The Stratified Data Analysis for Each Timeline Period, Posttransplantation.
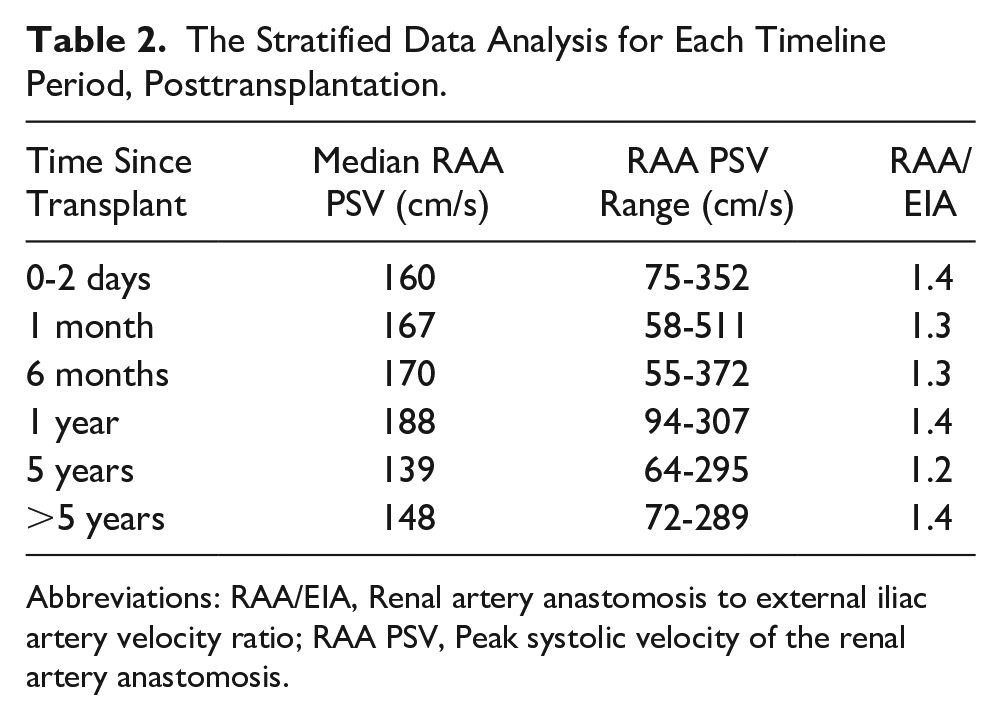
Abbreviations: RAA/EIA, Renal artery anastomosis to external iliac artery velocity ratio; RAA PSV, Peak systolic velocity of the renal artery anastomosis.
For the timeline of 1 month after renal transplant, 36 patients were analyzed (Table 1). The median RAA PSV was 167 cm/s (range: 58-511 cm/s), and the mean RAA-to-EIA ratio was 1.3 (Table 2). An intraclass correlation coefficient (ICC) of 0.29 was obtained with 95% CI (0.0168-0.52] (P = .041).
At the time of 6 months after renal transplant, 33 patients underwent evaluation (Table 1). The median RAA PSV was 170 cm/s (range: 55-372 cm/s), and the mean RAA-to-EIA ratio was 1.3 (Table 2). The ICC was 0.39 with 95% CI [0.113-0.61] (P = .012).
For the time of 1 year after transplantation, 20 patients were included (Table 1). The median RAA PSV was 188 cm/s (range 94-307 cm/s), and the mean RAA-to-EIA ratio was 1.4 (Table 2).
At the period of 5 years since transplantation, 24 patients underwent analysis (Table 1). The median RAA PSV was 139 cm/s (range: 64-295 cm/s), and the mean RAA-to-EIA ratio resulted in 1.2 (Table 2).
At the timeline beyond 5 years of renal transplantation, 12 patients were included (Table 1). The median RAA PSV was 148 cm/s (range: 72-289 cm/s), and the mean RAA-to-EIA ratio was 1.4 (Table 2).
Association Between RAA PSV and Type of Vascular Anastomosis and Type of Graft
A comparison of the median (IQR [inter-quartile range]) in each group was performed. Most subjects had an end-to-side anastomosis of the renal artery to EIA with a median PSV of 160 cm/s and IQR [110, 200] (Figure 3); and deceased-donor graft with a median PSV of 170 cm/s and IQR [120, 210] (Figure 4). However, there was a significant overlap of IQRs among the different groups, suggesting no evidence of an association between type of vascular anastomosis (P = .05) and type of graft (P = .2) with RAA PSV.
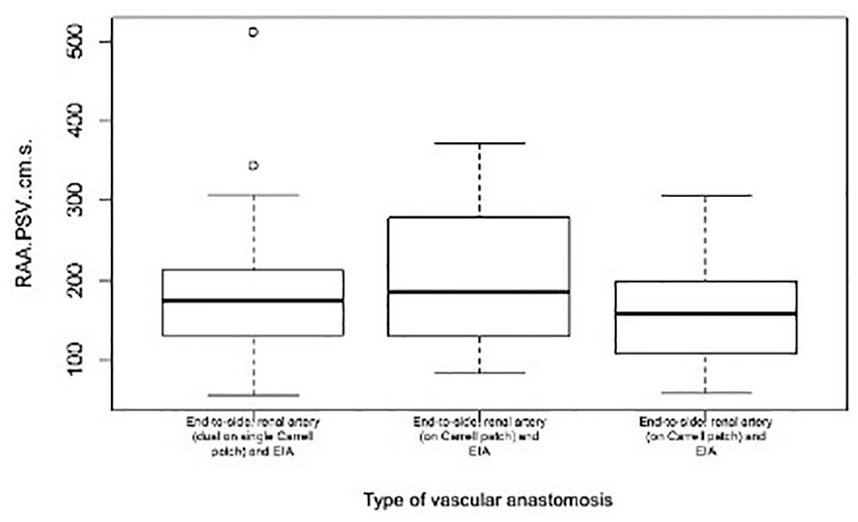
Box plots of the renal artery anastomosis peak systolic velocity, according to the type of vascular anastomosis. Most subjects had an end-to-side anastomosis of the renal artery to EIA with a median PSV of 160 cm/s and IQR [110, 200]. However, there was a significant overlap of IQRs among the different groups, suggesting no significant association. EIA, external iliac artery; IQR, inter-quartile range; PSV, peak systolic velocity; RAA PSV, renal artery anastomosis peak systolic velocity.
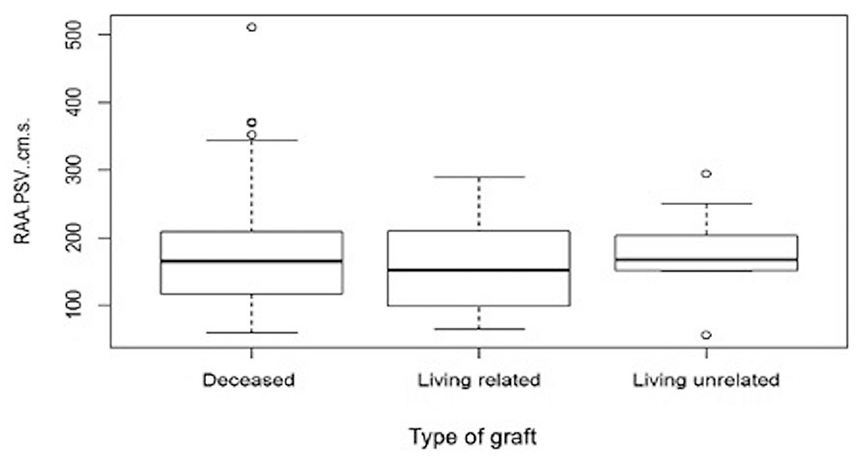
Box plots of the renal artery anastomosis peak systolic velocity, according to the type of graft. Most subjects had deceased donor graft with a median PSV of 170 cm/s and IQR [120, 210]. Overlap of IQRs among the different groups suggests no significant association between the variables. IQR, inter-quartile range; PSV, peak systolic velocity; RAA PSV, renal artery anastomosis peak systolic velocity.
Discussion
These results showed a high degree of reliability between the RAA PSV and EIA PSV and revealed a progressive decrease in the RAA PSV over time after transplantation. Considering that the cohort was comprised of patients without TRAS, a high PSV early after transplant does not automatically suggest graft disfunction. Moreover, it was determined that surgical anastomosis and type of donor graft do not significantly influence the RAA PSV.
Although kidney transplants have been quite successful over the years, graft dysfunction can still be a critical problem for some patients when not managed correctly. 29 Sonography is a widely available and effective way to identify parenchymal and vascular causes of graft dysfunction and is performed at various periods of follow-up. 30 Of note, the most common vascular cause of graft dysfunction is TRAS, which can be accurately diagnosed with methods such as sonography and angiography.31–34 However, TRAS misdiagnosis can occur when considering the PSV alone, leading to unnecessary angiographic evaluation.22–24 Therefore, it is paramount to establish a normal RAA PSV to guide the diagnosis of graft dysfunction.
This investigation addressed how RAA PSV and the RAA-to-EIA ratio change at different follow-up periods. The RAA PSV decreased progressively after transplantation with a relatively stable RAA-to-EIA ratio (Table 2). Therefore, the RAA and EIA PSV tended to change in concert, an essential finding since significant deviations may increase the ratio to abnormal values. 35
In many cases of vascular graft dysfunction, the PSV is elevated above 250 to 300 cm/s. 33 However, this study demonstrates that a PSV greater than these values does not necessarily indicate graft dysfunction. In the perioperative period, isolated elevated PSV in the renal artery may be related to edema or technical limitations. Therefore, it is crucial to reassess on follow-up CDU. 36 This finding has been confirmed by other studies showing that evaluation of additional ultrasound parameters such as acceleration time and intrarenal artery waveforms improves the accuracy of detecting a hemodynamically significant arterial stenosis.37–39 Also, Patel et al 26 suggest that a higher PSV threshold is necessary for a low-risk population such as this study cohort.
Only a few investigations have studied the normal ranges of PSV in the RAA, EIA, and the RAA-to-EIA ratio and how these parameters change over months to years. For instance, Robinson et al studied a cohort of healthy transplanted patients followed in the immediate postoperative period to more than 11 months after transplant. On the contrary, the current study had more stratification of follow-up periods encompassing more time after transplantation. Robinson et al showed an average RAA PSV between 195 cm/s and 206 cm/s; such values are included in the mean obtained in this investigation which was 174 cm/s ± 72.9 cm/s. They calculated a mean RAA-to-EIA ratio of 1.7, compared to 1.35 obtained in this study. They had approximately 26% of patients with PSV greater than 250 cm/s, corroborating that healthy patients may have higher values of RAA PSV. However, they did not explore the association between RAA PSV with vascular anastomosis and the type of donor graft. 27
Regarding the mean RAA PSV, the obtained values are similar to those reported by other studies after successful angioplasty treatment for TRAS, further validating the results.40,41 Also, the progressive PSV decrease at advanced follow-up periods correlates with other authors who also studied healthy patients at long-term follow-up periods. 42
About the associations of anastomosis type and RA PSV, the results from this study are similar to Zomorrodi et al, 43 where there was no statistically significant difference in the incidence of stenosis in the compared surgical techniques. Accordingly, Papila Kundaktepe et al analyzed the effects of different reconstruction techniques and sites on patient/graft outcomes. They found no statistically significant differences in complications. 44 However, other studies focused on patients with severe TRAS have reported significantly different PSV between end-to-end and end-to-side arterial anastomoses and recommend these should be considered in the interpretation of CDU when screening for severe TRAS.7,45
Exploring the influence of the type of graft on the RA PSV, several risk factors for TRAS have been suggested in cadaveric and live donor transplantation, including long cold ischemia time and multiple graft arteries. Of note, vascular complications have been more reported and analyzed in the cadaveric transplantation. In this study, there was no statistically significant influence of the type of graft upon the RAA PSV. Similar to Debare et al, 46 who assessed outcomes and complications among deceased donors, live donor HLA-compatible and live donor HLA-incompatible and found no significant difference in complication rates. Oman et al evaluated vascular complications in live donor renal transplantation and found a 0.4% incidence of TRAS. They explained this because live donor renal transplantation is usually performed under more favorable circumstances and they are not typically subject to ischemic injury. However, the low number of stenotic complications in their results precluded a definitive conclusion. 47
Limitations
This study has both strengths and weaknesses. It evaluated the PSV and explored the associations with the type of vascular anastomoses and type of graft. It also included advanced follow-up periods compared to other studies. This is, however, a retrospective study with inherent selection bias. Moreover, there may have been observer variability in conducting sonographic evaluations. Despite such limitations, this work opens new areas for the study of transplanted kidneys. Further multicenter studies should confirm the obtained PSV range with larger sample sizes. The clinical utility of these parameters should be addressed to determine whether deviations in these values may help clinicians diagnose graft dysfunction and further improve survival in kidney transplant patients.
Conclusion
Detection of the renal allograft function changes is a crucial task in the appropriate management of complications. Accurate and noninvasive diagnostic tests take a fundamental place in the early diagnosis of functional impairment. The implications of this study rely on whether clinicians should be concerned when obtaining high PSV values and showed that a high RAA PSV could be present in patients without graft dysfunction. It also demonstrated a tendency to decrease over months. Consequently, it is essential to establish a normal PSV range that can guide the management of graft dysfunction and contextualize the RAA PSV with other factors such as the time after transplant and patient risk factors before diagnosing TRAS.
Footnotes
Acknowledgements
Dr Gaetano Ciancio, Professor UMMG. Surgery—Transplant Kidney/Pancreas. For his valuable opinion on the importance of the research. Dr Victor Casillas and Dr Beatrice Madrazo, Professor of Clinical Radiology. For their important suggestions on the structure of the research.
Declaration of Conflicting Interests
The author(s) declared no potential conflicts of interest with respect to the research, authorship, and/or publication of this article.
Funding
The author(s) received no financial support for the research, authorship, and/or publication of this article.