
Abstract
Objective:
Hypertensive and diabetic patients are at higher risk of developing ocular complications. Color and spectral Doppler, as a noninvasive technique, can be used to monitor and access the ophthalmic artery (OA) and its hemodynamic characteristics. The aim of this study was to investigate the hemodynamics of OA in diabetes and hypertension.
Materials and Methods:
This cross-sectional study was conducted at the University of Lahore sonography clinic. The patients were investigated using Toshiba Xario with 5 to 7.5 MHz linear transducer and the scanning was completed with closed eyelids. Those included in the study were hypertensive and diabetic patients. Exclusions were made based on a patient’s history of eye surgeries, trauma, inflammation, glaucoma, cataract, and pregnancy.
Results:
There were 200 patients recruited and of which, 41 were hypertensive and diabetic, whereas 159 were normal subjects. In this cohort, 41 patients (20%) were positive for hypertension and diabetes. There were 159 patients (79%) were negative for diabetes and hypertension. The resistive index (RI) of right OA was 0.783 ± 0.114 with 0.029. When considering the OA hemodynamics recorded, the pulsatility index (PI), the systolic/diastolic (S/D) ratio, RI, and end diastolic velocity (EDV) were significantly correlated among those with hypertension and diabetes. In the normal subjects, all hemodynamic measurements were seen as normal, when compared to those with hypertension and diabetic.
Conclusion:
This cohort study may suggest that there is a pathological increase in vascular resistance, PI, S/D ratio, and decreased blood flow velocities, in ophthalmic artery, for those hypertensive and diabetic patients.
Diabetes mellitus (DM) may be a group of long-term diseases characterized by hyperglycemia. Type 1 DM and type 2 DM were introduced to exchange the previous “insulin-dependent” and “non-insulin-dependent” terms. In the following years, many studies elucidated the explanation and temporal contribution of insulin resistance and β-cell insulin secretion in type 2 DM. Furthermore, a central role for insulin resistance in the development of a cluster of cardio metabolic alterations (dyslipidemia, inflammation, and high blood pressure) was suggested. 1 Possibly as a consequence of the secular changes in DM risk factors, within the last 10 years, the limitation of an easy distinction between type 1 DM and type 2 DM has been increasingly recognized, with patients showing the coexistence of insulin resistance and immune activation against β-cells. 2 Type 1 DM is typically prevalent in children and young adults. It develops when the body’s system destroys pancreatic beta cells, the sole cells within the body that make the hormone insulin, which regulates blood sugar. Only 5% of individuals with DM have this type of the disease. 3 This is managed by insulin injection. Type 2 DM is the most common manifestation of the disease. There are multiple factors causing type 2 DM including genetic and environmental factors affecting beta-cell function and tissue insulin sensitivity. In type 2 DM, there is decreased production of insulin, or the cells are not sensitive to insulin. Type 2 DM, always begins as insulin resistance, a disorder in which the cells do not use insulin properly. 4 Because the need for insulin rises, the pancreas gradually loses its ability to supply it. When glucose builds up within the blood rather than going into the cells, it can cause far-reaching health complications like heart, nerve, and kidney damage. Diabetes mellitus is the major contributor to renal failure, nontraumatic lower-limb amputations, and new cases of blindness among adults, within the United States. Long-term elevation of blood sugar level results in damage of blood vessels, known as angiopathy. The endothelial cells lining the blood vessels absorb more glucose than normal. More-than-normal surface glycoproteins are deposited in basement membrane and weakens it, which is considered microvascular disease (damage to small blood vessels) and macrovascular disease (damage to the arteries).5,6 Hypertension is often classified as either essential (also referred to as primary or idiopathic) or secondary. About 90% to 95% of hypertension is essential hypertension. 7 Some authorities define essential as that which has no known explanation, while others define its cause as being thanks to over consumption of sodium and under consumption of potassium. 7 High blood pressure indicates that the hypertension may be a result of a selected underlying conditions, with a well-known mechanism, such as long-term renal disorder, narrowing of the aorta or kidney arteries, or endocrine disorders like excess aldosterone, cortisol, or catecholamines. Persistent hypertension may be a major risk factor for hypertensive ischemic heart disease, stroke, peripheral artery disease, and long-term renal disorder.8,9 In response to hypertension, the retinal circulation undergoes a series of pathophysiological changes. Within the initial, vasoconstrictive stage, there is vasospasm and a rise in retinal arteriolar tone, due to local auto regulatory mechanisms. This stage is seen clinically as a generalized narrowing of the retinal arterioles. Persistent hypertension results in intimal thickening, hyperplasia of the media wall, and hyaline degeneration within the subsequent, sclerotic stage. This stage corresponds to more severe generalized and focal areas of arteriolar narrowing, changes within the arteriolar and venular junctions. Then there is disruption of the blood-retina barrier, necrosis of the smooth muscles and endothelial cell called exudative stage. Swelling of the disk may occur and typically indicates malignant hypertension. 10 Spectral Doppler is a noninvasive technique to assess quantitative and qualitative blood flow velocities. In ophthalmic practice, spectral Doppler has been used extensively for diagnostic evaluation of ophthalmic and orbital disorders. Spectral Doppler provides information about blood velocity at sites of complex vasculature through simultaneous Doppler and gray-scale sonography. It also allows noninvasive examination of blood flow velocities of the ophthalmic artery and its branches within the orbit, even in states of decreased blood flow. Spectral Doppler is a reliable tool for quantitative assessment of ophthalmic artery blood flow velocity; however, alterations in ophthalmic artery blood flow in DM and hypertension have yet to be fully explored. The objective of this clinical research was to analyze the spectral Doppler measurement taking Doppler indices of peak systolic velocity (PSV), end diastolic velocity (EDV), resistive index (RI), and pulsatility index (PI) of OA in diabetic and hypertensive patients.11,12 This overall aim was to evaluate differences in OA hemodynamics recorded with patients diagnosed as hypertensive and diabetic compared with normal participants.
Materials and Methods
The research design was a cross-sectional cohort study performed at the Lahore University’s sonography clinic. This research was reviewed and ethically approved by The University of Lahore’s internal review board. Patients were recruited from August 1, 2019 to January 30, 2020. A total 200 patients were voluntarily enrolled in the study and provided written informed consent. The exclusion criteria used in the study was based on a patient having a history of previous eye surgeries, trauma, inflammation, glaucoma, cataracts, or a pregnancy. The sonograms and blood flow velocity, with the ophthalmic artery, were completed using a Toshiba Xario XG SSA-660A (Tokyo, Japan) ultrasound equipment system. A 5 to 7.5 MHz linear phase array transducer was used for imaging the patient cohort. The protocol for imaging was made consistent with the methods described by American Institute of Ultrasound in Medicine’s standard guidelines. 13 All measurements were performed with patients in the supine position. The OA was typically identified adjacent to the optic nerve. The PSV, EDV were determined in centimeters per second. Pulsatility index and RI were subsequently calculated using the ultrasound equipment system’s software. The output power was monitored using the mechanical index (MI) and lower to less than 0.2 for imaging the eye and orbit. The sonogram of the orbit was performed through the closed eyelid and using sterile gel as a couplant. Patients who wore contact lenses needed to remove them before the examination. As little pressure as possible was exerted on the eye to avoid inaccurate vascular recordings and patient discomfort. To stabilize the transducer, the sonographer placed their fingers on the forehead or cheek of the patient. The patient was instructed to keep their eyes closed and to remain reasonably still, during the examination. Gray-scale sonography was primarily performed to review the anatomy within the orbit. Color Doppler flow information was then obtained to identify the main vascular structures, within the orbit. The insonation angle was adjusted to between 0° and 40°, depending on visualization of the OA at the center of vessel, where typically blood flow is laminar. Pulsed Doppler recordings were then be obtained. A small Doppler gate was adjusted to give accurate and reproducible waveforms. The patient’s sonography examination took approximately 10 to 15 minutes per eye. Statistical comparisons were made based on group means and the use of the Student’s t-test. The statistical significance was set a priori at P < .05. All data were statistical analyzed using IBM SPSS, version 21.
Results
This cohort study was with 200 patients who attended the clinic. The descriptive statistics for this cohort are provided in Table 1. The total cohort consisted of 200 patients, of which, 41 patients (20%) tested positive for DM and hypertension. These patients were compared to 159 patients (79%) who tested negative for DM and hypertension (Table 2).
The Sex of the Patient Cohort That Were Consented to the Research Study.
Total 200 participants were recruited in this study, out of them 67 were male with 33% and 133 were female with 66%.
The Results of Testing the Patient Cohort for the Presence of Type 2 Diabetes Mellitus and Hypertension.
These patients provided Doppler velocity data that allowed for the measurement of PSV, EDV, RI, PI, and a systolic to diastolic ratio (S/D) (Figures 1–6). These measures were determined by analyzing the flow velocity within the OA (Table 3).
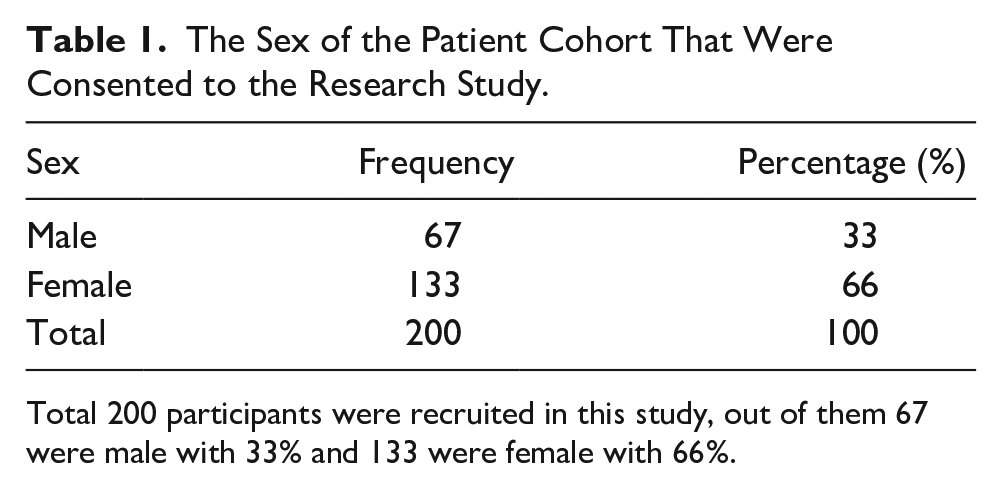
A sonographic image of the right ophthalmic artery and the resulting waveform from a patient with type 2 diabetes mellitus and hypertension. The right ophthalmic artery velocity data: PSV: 19.9 cm/s, EDV: 3.4 cm/s, PI: 2.36, RI: 0.83, and S/D: 5.85. EDV, end diastolic velocity; PI, pulsatility index; PSV, peak systolic velocity; RI, resistive index; S/D, systolic/diastolic ratio.
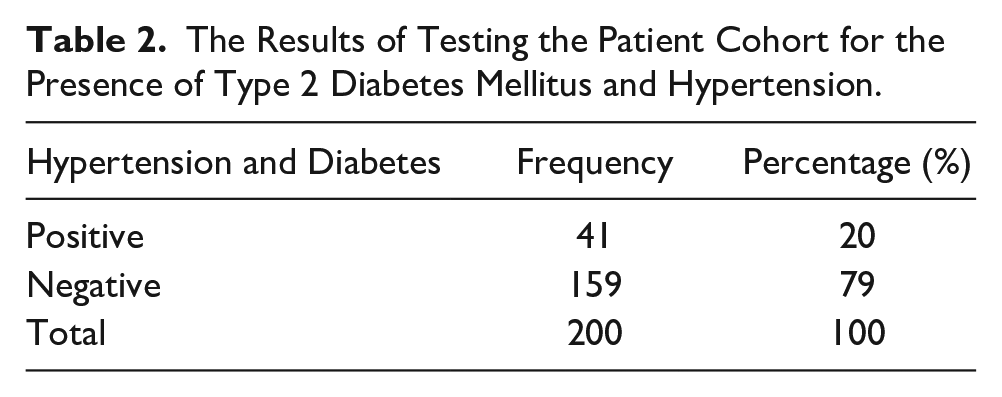
A sonographic image of the left ophthalmic artery and the resulting waveform from a patient with type 2- diabetes mellitus and hypertension. The left ophthalmic artery velocity data: PSV: 17.6 cm/s, EDV: 3.3 cm/s, PI: 2.34, RI: 0.81, and S/D: 5.33. EDV, end diastolic velocity; PI, pulsatility index; PSV, peak systolic velocity; RI, resistive index; S/D, systolic/diastolic ratio.
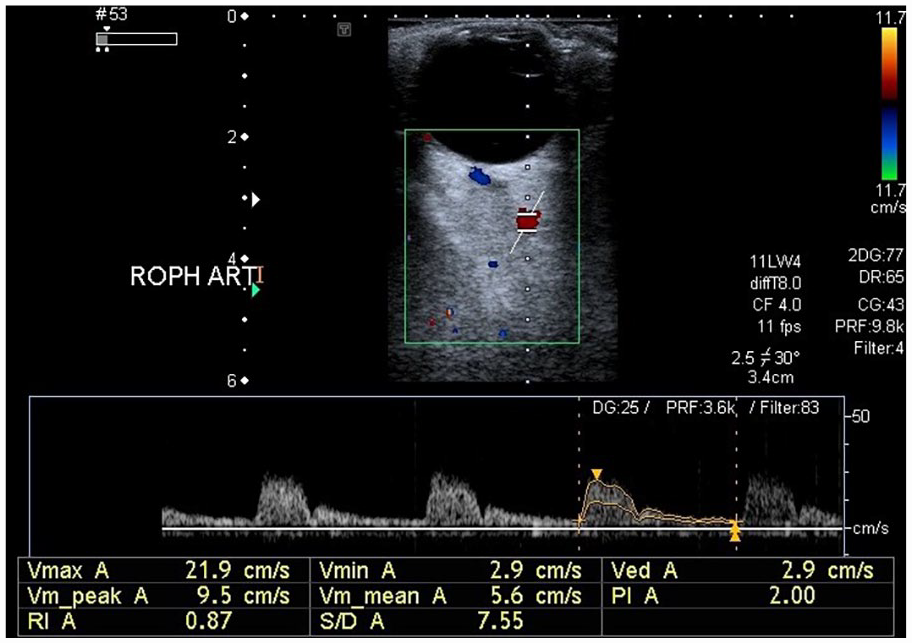
A sonographic image of the right ophthalmic artery and the resulting waveform from a patient with type 2- diabetes mellitus and hypertension. The right ophthalmic artery velocity data: PSV: 21.9 cm/s, EDV: 2.9 cm/s, PI: 2.00, RI: 0.87, and S/D: 7.55. EDV, end diastolic velocity; PI, pulsatility index; PSV, peak systolic velocity; RI, resistive index; S/D, systolic/diastolic ratio.
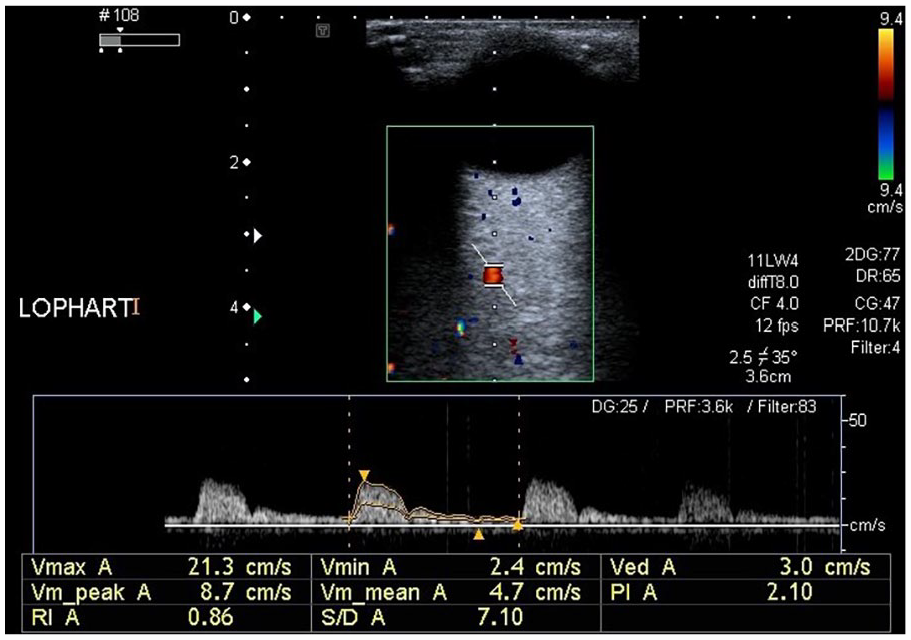
A sonographic image of the left ophthalmic artery and the resulting waveform from a patient with type 2- diabetes mellitus and hypertension. The left ophthalmic artery velocity data: PSV: 21.3 cm/s, EDV: 3.0cm/s, PI: 2.10, RI: 0.86, and S/D: 7.10. EDV, end diastolic velocity; PI, pulsatility index; PSV, peak systolic velocity; RI, resistive index; S/D, systolic/diastolic ratio.
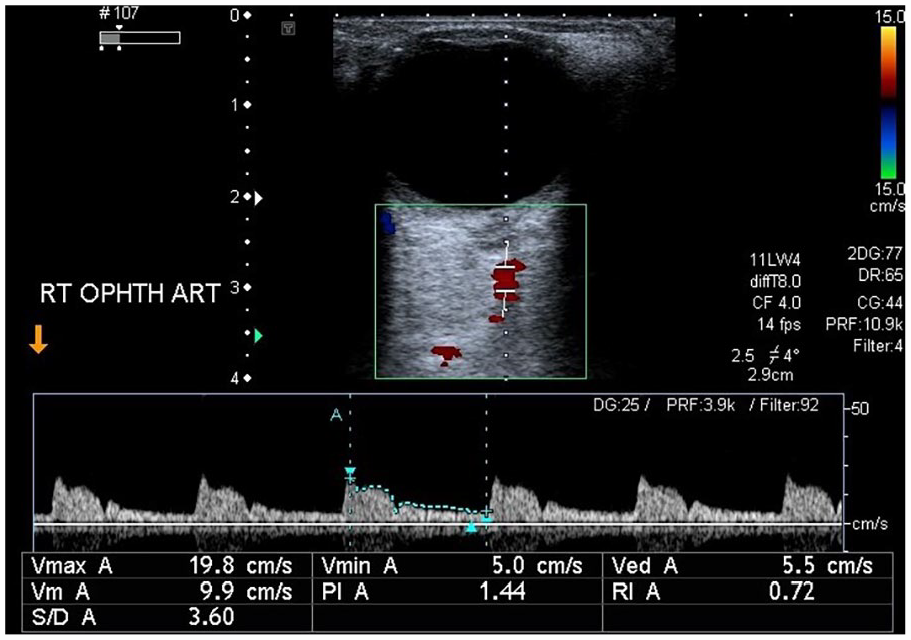
A sonographic image of the right ophthalmic artery and the resulting waveform from a patient who tested negative for diabetes mellitus and hypertension. The right ophthalmic artery velocity data, in the normal patient: PSV: 19.8 cm/s, EDV: 5.5 cm/s, PI: 1.44, RI: 0.72, and S/D: 3.60. EDV, end diastolic velocity; PI, pulsatility index; PSV, peak systolic velocity; RI, resistive index; S/D, systolic/diastolic ratio.
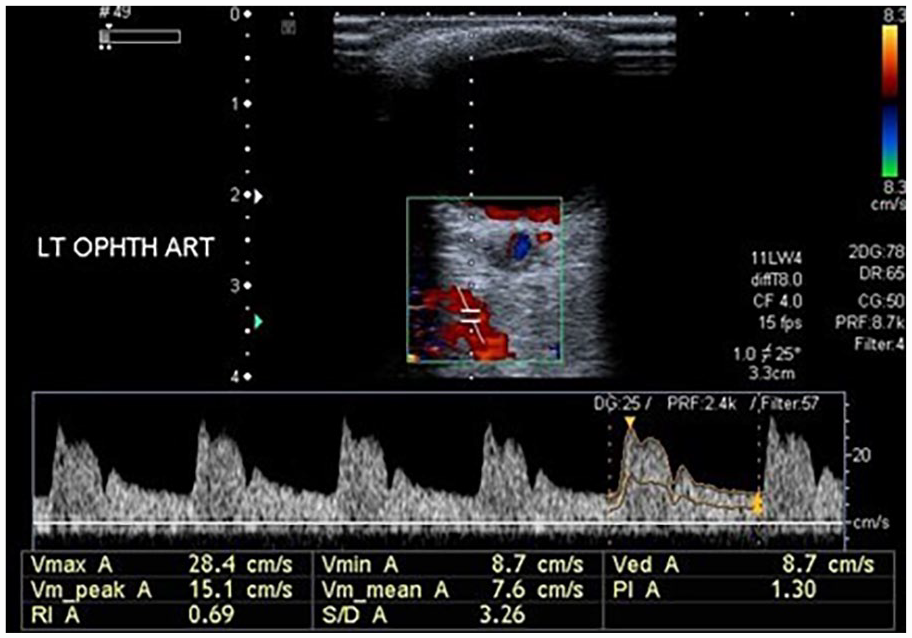
A sonographic image of the left ophthalmic artery and the resulting waveform from a patient who tested negative for diabetes mellitus and hypertension. The left ophthalmic artery velocity data, in the normal patient: PSV: 28.4 cm/s, EDV: 8.7 cm/s, PI: 1.30, RI: 0.69, and S/D: 3.26. EDV, end diastolic velocity; PI, pulsatility index; PSV, peak systolic velocity; RI, resistive index; S/D, systolic/diastolic ratio.
The Doppler Data Recorded Within the Ophthalmic Artery for Those Patients Who Tested for Type 2 Diabetes Mellitus and Hypertension.
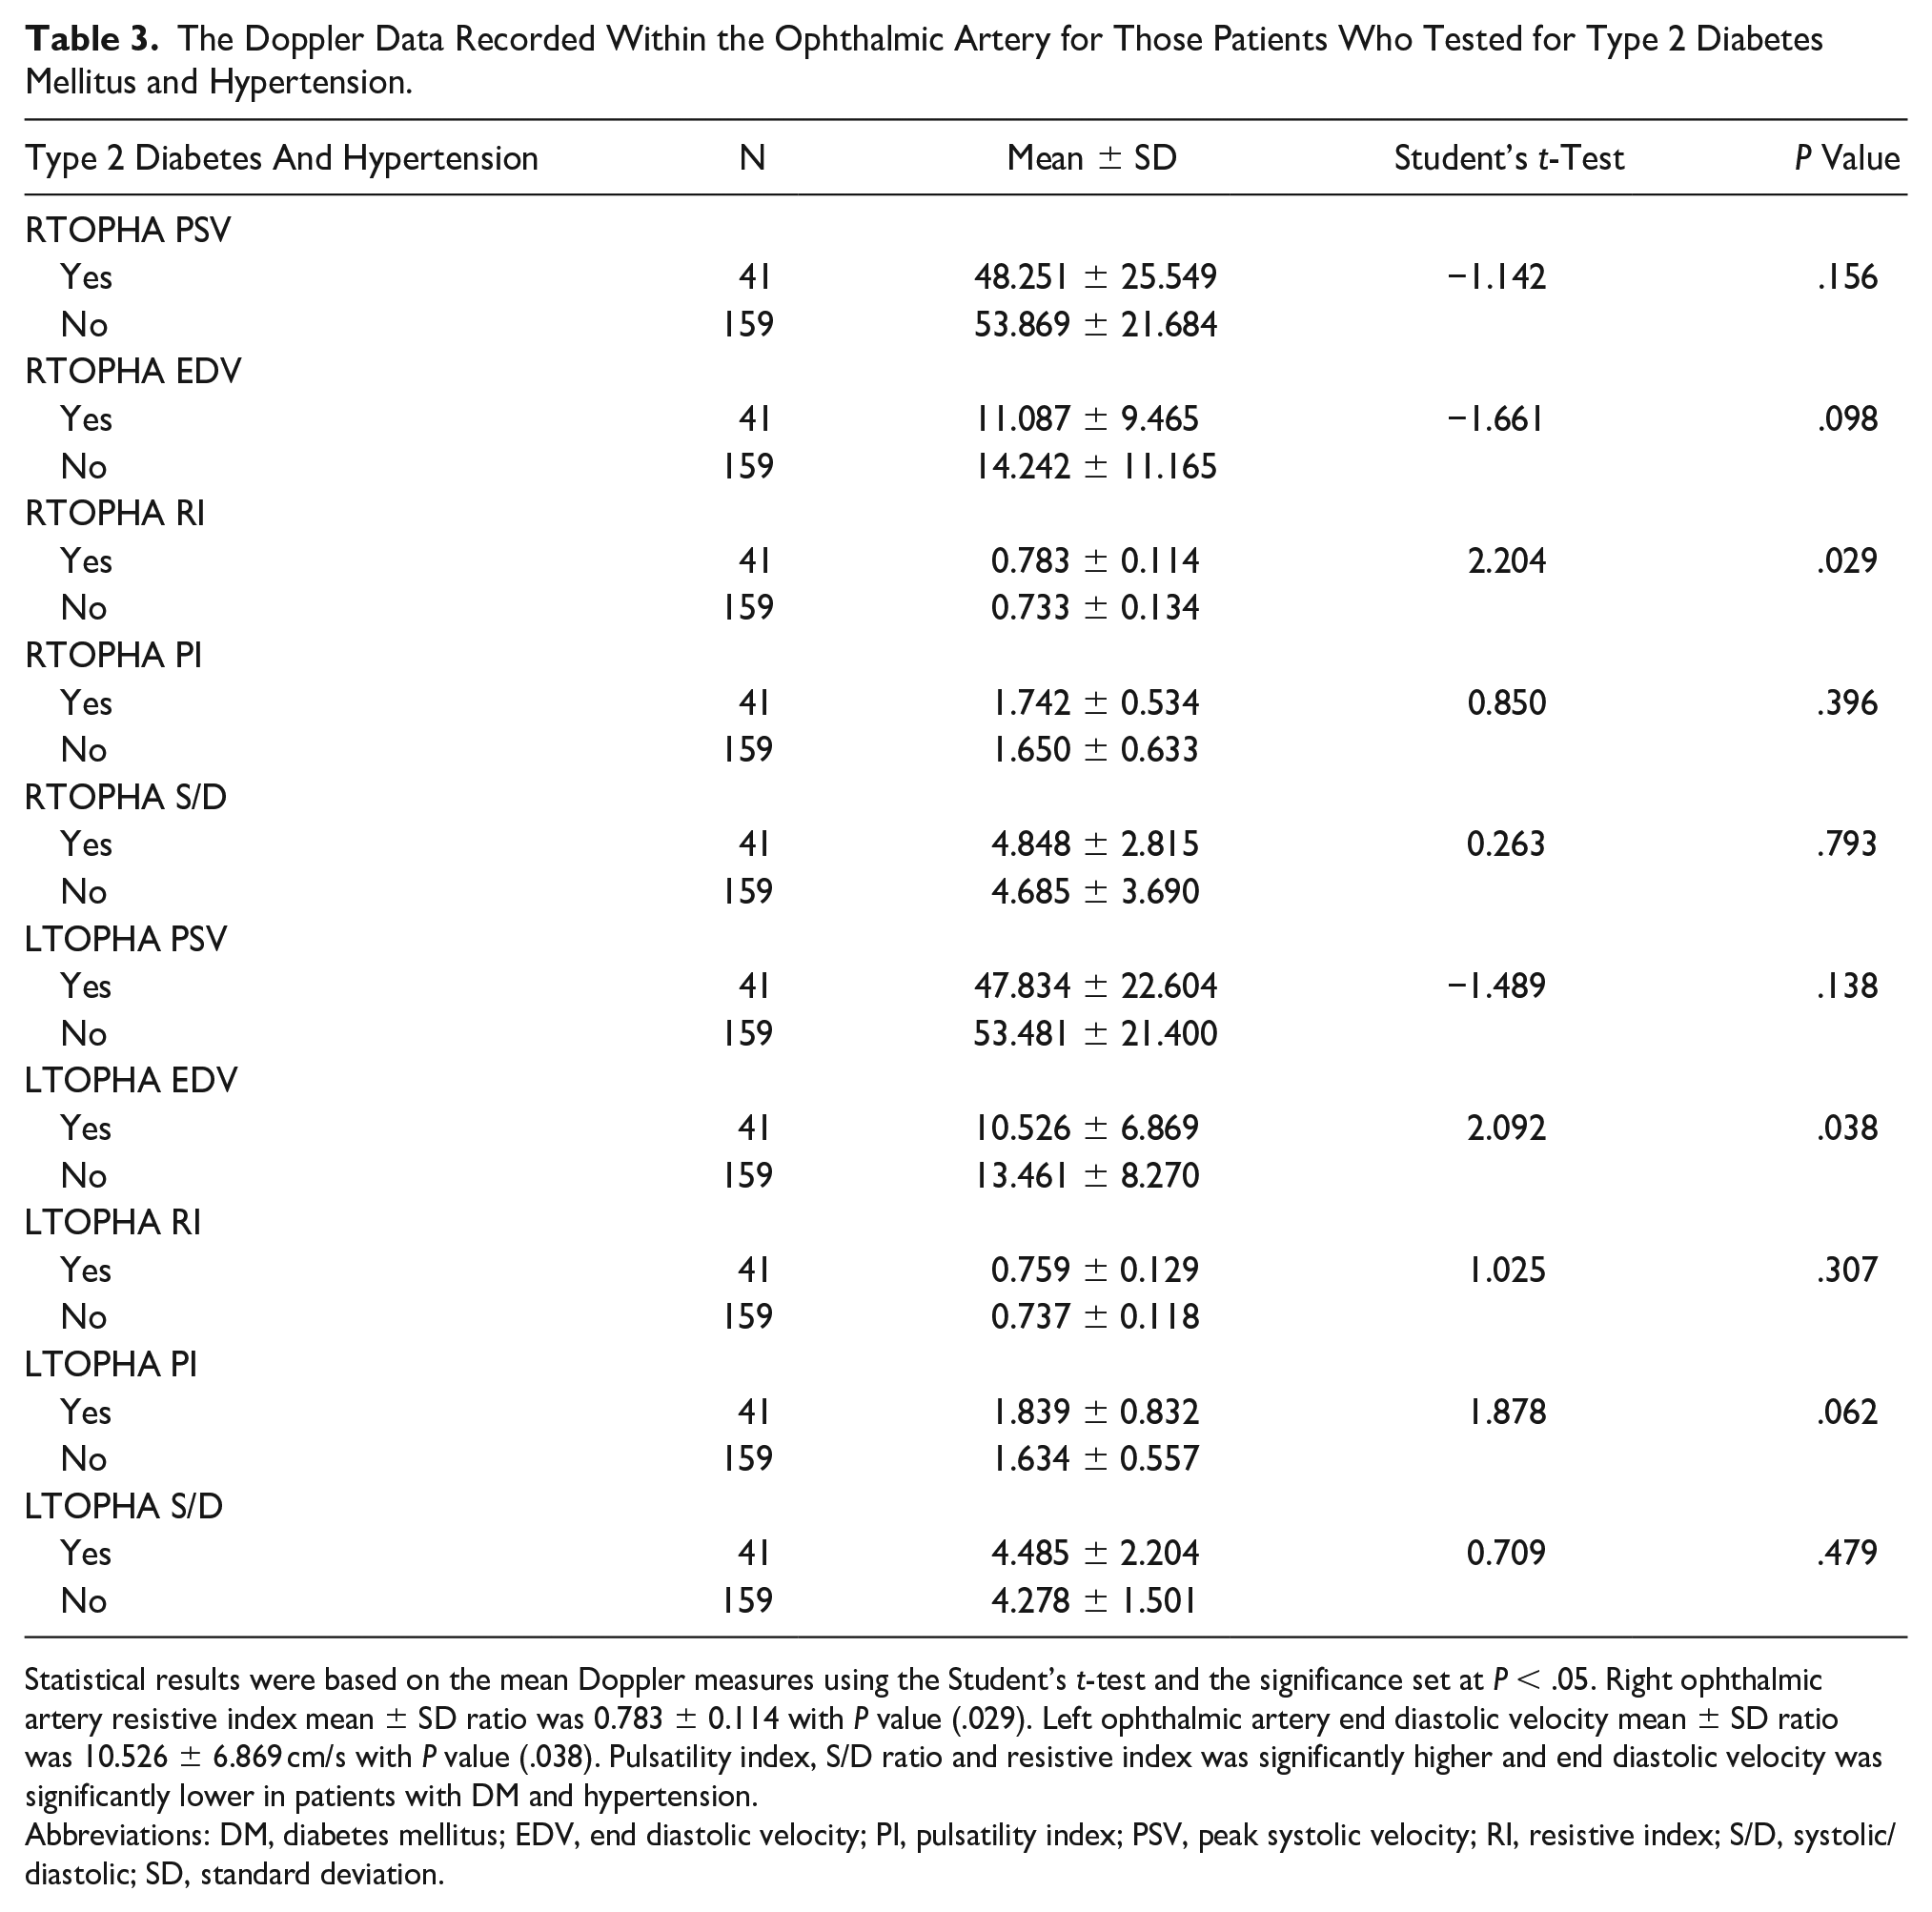
Statistical results were based on the mean Doppler measures using the Student’s t-test and the significance set at P < .05. Right ophthalmic artery resistive index mean ± SD ratio was 0.783 ± 0.114 with P value (.029). Left ophthalmic artery end diastolic velocity mean ± SD ratio was 10.526 ± 6.869 cm/s with P value (.038). Pulsatility index, S/D ratio and resistive index was significantly higher and end diastolic velocity was significantly lower in patients with DM and hypertension.
Abbreviations: DM, diabetes mellitus; EDV, end diastolic velocity; PI, pulsatility index; PSV, peak systolic velocity; RI, resistive index; S/D, systolic/diastolic; SD, standard deviation.
The right OA had a mean RI of 0.783 ± 0.114 SD and a comparative statistical significance of P < .029. The left OA had a mean EDV of 10.526 cm/s ± 6.869 SD and a comparative statistical significance of P < .038. The PI, RI, and S/D ratio were all significantly higher within the group of DM and hypertensive patients. However, the EDV was significantly lower in patients with DM and hypertension.
Discussion
The main observations, this study, were as follows, the mean PI, RI, and S/D ratio measurements, within the OA, were significantly higher in both DM and hypertensive patients, whereas the mean EDV, recorded with the OA, was significantly lower, in DM and hypertensive patients. These results can be compared to a prospective study conducted by Divya et al., 14 which included 50 diabetic patients and 50 age-matching controls. In that study, they recorded the Doppler parameters, PSV, EDV, PI, and RI with the OA, posterior ciliary artery (PCA), and central retinal artery (CRA), as well as the central retinal vein (CRV). Those study results demonstrated that the RI, within the OA was significantly higher than the control group (P = .000). 14 Their study concluded that significant changes in RI and flow velocities were also observed in the retrobulbar vessels, especially in OA for those DM patients compared to normal controls. 14 The spectral Doppler results demonstrated an increased resistance or decreased flow velocities that could be useful to predict individuals at higher risk. 14 Findings in this study were found to be similar to the aforementioned cohort, as increased vascular resistance, PI, and S/D ratio, in the OA and decreased EDV were recorded in the cohort of DM and hypertensive patients. Khatri et al. 15 recruited 81 DM patients between the ages of 40 and 70 years. The assessed the RI of the CRA, as a bioimaging biomarker for DM severity. The mean RI within the CRA, for that study cohort demonstrated a significant increase (P < .001) with the severity of DM. 15 However, they predicted that the RI, with the CRA, could be used as a reliable bioimaging biomarker. 15 They performed another similar study with the OA and concluded that the mean RI was increased in the OA among a cohort of DM patients, which predicted its severity. 12 In this cohort study, the mean RI (0.783 ± 0.114 SD), with the OA, among the DM and hypertensive patients showed a significant increase (P <.029).
Reddy et al. 11 also investigated the characteristics of ocular blood flow. He evaluated the color Doppler imaging parameters with a group of hypertensive subjects and measured the ocular flow velocities, RI, and PI, of 100 young hypertensive patients and 50 age-matching healthy controls. The spectral Doppler parameters of the OA, CRA, and PCA were measured in all participants. The results showed that the Doppler parameters were significantly higher in young subjects diagnosed with hypertension, compared to the healthy controls. The current study results were similar when compared with these study results. A study by Mattina et al. examined 280 patients affected with hypertension and concluded that the flow waveform of the OA could reflect a vascular hemodynamic burden. The use of spectral Doppler allows for the safe and noninvasive evaluation of the RI, within the OA, which can therefore be a useful marker for improved risk stratification of developing cardiovascular disease and fostering an early and personalized intervention. 16 This study also concluded a similar treatment potential for both DM and hypertensive patients.
Samuel and Chellaraj conducted a randomized and prospective study of 60 patients who represented age groups that varied between 50 and 80 years. In this study, they recorded the PSV, EDV, and RI, within the cohort. 17 In this particular study, they found that the RI was increased in the OA and CRA, in those DM patients. However, they found that the EDV was decreased, within the OA, among their DM patients, and ophthalmic artery in diabetics. 17 They reached to the conclusion that spectral Doppler was useful in evaluating the hemodynamic circulation in orbital vessels and was a useful imaging technique to assess the progression of DM, when other techniques are unavailable. 17 This study concluded that ocular sonography provides reliable information on blood flow velocities, at the sites of complex vasculature. 17 The hallmark of this study was similar to the conclusion described by Samuel and Chellaraj. In another study by Basturk et al., 18 they evaluated 103 DM patients and compared results with a control group of 30 subjects. The RI values were obtained using Doppler of the OA, with those patients. The orbital arterial RI values in those patients were higher than those in the control group. They concluded that the RI measurement may be useful as one of the markers for early diagnosis and follow-up in diabetic patients. 18 Those study results are very similar to the results of this study that was conducted. Akal et al. enrolled 60 patients with hypertension and compared them to 30 healthy subjects. They recorded mean RI values, within the OA, CRA, and PCA, using color Doppler. They concluded that RI might be a useful marker for the ocular hemodynamic of retinal vessels, provides morphologic, and vascular information for those patients with hypertension. 19 Again those study results are very comparable to the data that were recorded and conclusions of this study.
In a study by Mohammad, 20 they studied 50 DM and hypertensive patients (28 females and 22 males), who ranged in age from 20 to 77 years. They concluded that gray-scale ultrasonography was the initial imaging modality used in most patient cases, due to the fact that it was readily available, simple, cost-effective, nonionizing, noninvasive, and reliable modality for ocular diagnostics among DM and hypertensive patients. 20 Furthermore, they suggested that sonography must be used routinely for ocular evaluation of DM and hypertensive patients. 20 However, in this study it would be worthwhile to use spectral Doppler, within the OA, to routinely predict changes in color Doppler parameters. Another research study completed by Dimitrova and Kato has suggested that spectral Doppler is a widely used diagnostic method for evaluating ocular circulation and should be used to assess blood velocity parameters in the OA, CRA, and PCA. 21 Also they described the usefulness of spectral Doppler in the assessment of retinal diseases classified as vascular diseases, degenerations, dystrophies, and detachment. These works demonstrate evidence that points to the value of spectral Doppler for ocular research and as a potentially useful clinically diagnostic tool. 21 This study, likewise adds to this evidence and would support the use of spectral Doppler in case of ocular vascular pathologies.
Based on a limited search of the literature, this study may be the first of its kind in attempting to predict OA hemodynamic characteristics, such as PSV, EDV, RI, PI, and S/D ratio, for patient diagnosed with DM and hypertension. This cohort data compared spectral Doppler imaging parameters in the DM and hypertensive patients to a group of normal patients.
Limitations
This study has the major limitation of the research design and the threats to internal and external validity. In addition, the cohort of patients were a convenient sample, and therefore, these results cannot be generalized to a larger patient population.
Conclusion
This cohort study concluded that the PI, RI, and S/D ratio, measured with the OA, were significant among those DM and hypertensive patients. The PI, RI, and S/D ratio and was significantly higher and EDV was significantly lower in the DM and hypertensive patients. Whereas, among the normal patients, the cohort, all the hemodynamics were noted as normal values when compared to the DM and hypertensive patients. This may suggest there is a pathological increase in vascular resistance, PI, S/D ratio, and decreased blood flow velocities, within the OA, among DM and hypertensive patients.
Footnotes
Declaration of Conflicting Interests
The authors declared no potential conflicts of interest with respect to the research, authorship, and/or publication of this article.
Funding
The authors received no financial support for the research, authorship, and/or publication of this article.
Ethics Approval
Ethical approval was taken from University of Lahore for the study.
Informed Consent
Informed consent was not sought for the present study because all case data were de-identified and/or aggregated and followed ethics committee or IRB guidelines (also referred to as the Honest Broker System).
Animal Welfare
Guidelines for humane animal treatment did not apply to the present study.
Trial Registration
Not applicable.