
Abstract
Objective:
Assess the correlation between the qualitative sonographic score for detecting hepatic steatosis (HS) and liver fat quantification, using proton magnetic resonance spectroscopy (MRS).
Materials and Methods:
Sixty-six patients with known or suspected nonalcoholic fatty liver disease (NAFLD) underwent ultrasonography (US) and magnetic resonance imaging (MRI). The qualitative sonographic score and fat quantification, measured by MRS, were the techniques used. A Kappa coefficient was used for agreement calculation, and a Fisher test was used to assess the normality of the variables. The MRS results were the gold standard for US quality assessment.
Results:
The agreement between MRS and US was 50% (Kappa 0.35). Ultrasonography results were more severe in 42.4% of the cases, and 66.7% of the patients had a body mass index greater than 30 (P = .017). For diagnosis of HS, US presented 100% sensitivity, 30.8% to 60% specificity, 61.7% to 72.7% accuracy, 40% to 69.2% false-positive rate, 0% false-negative rate, 53.8% positive predictive value, and 100% negative predictive value.
Conclusion:
Ultrasonography is a reliable exam for detecting HS, although not for grading purposes. Therefore, US is not a good predictor of HS severity for the management and follow-up of NAFLD.
Key Takeaways
Ultrasound is highly sensitive for the diagnosis of NAFLD.
A detailed description of liver echogenicity, acoustic penetration, and visualization of liver vessels, as well as the diaphragm, is encouraged, although qualitative grading of steatosis through these parameters is inaccurate.
Nonalcoholic fatty liver disease (NAFLD) is characterized by excessive lipids within hepatocytes unrelated to secondary causes, such as alcohol consumption, use of steatogenic medications, or hereditary disorders. 1 It can be identified by clinical history combined with a histological analysis showing hepatic steatosis (HS) in more than 5% of the biopsy sample or using magnetic resonance imaging (MRI) to determine a fraction of fatty material in the examined area exceeding 5.6%.2,3
Nonalcoholic fatty liver disease prevalence is high: 24.25% worldwide, and it is a disease presented in varying degrees of severity such as only excessive fat accumulation to inflammation, known as nonalcoholic steatohepatitis (NASH) and then fibrosis with occasional development of hepatocellular carcinomas. 4 Ultrasonography (US) is the most frequently used imaging test for NAFLD screening due to its low cost and wide availability, although MRI is more accurate.5,6
Detection of HS, using US, is made possible by an increased liver tissue interface with ultrasound waves due to lipid accumulation. This has the effect of making the liver more echogenic and at the same time reducing the visibility of more distant portions from the transducer. 7 Sonographic grading of HS can be done using a classically described qualitative score of 4 degrees: normal, slight steatosis, moderate steatosis, and severe steatosis8,9 (see Figures 1–4).
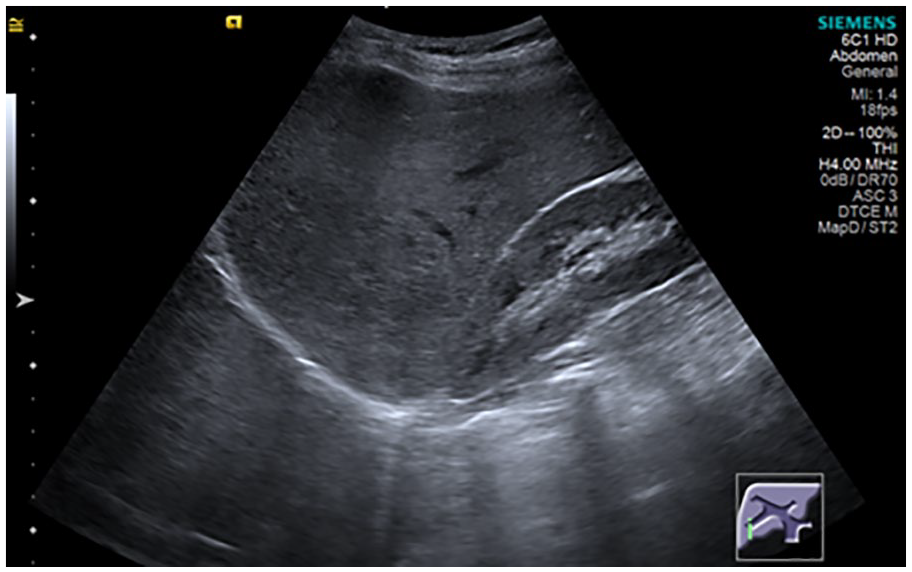
A normal sonogram of the liver (parasagittal subcostal view of the right hypochondrium showing liver and right renal cortex with similar echogenicity).
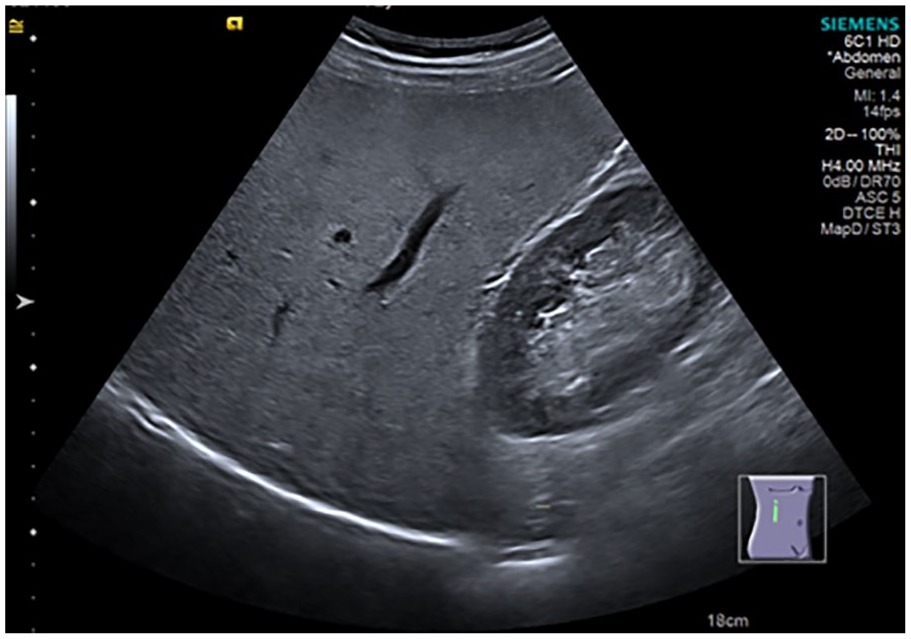
A sonogram demonstrating slight liver steatosis (parasagittal subcostal view of the right hypochondrium showing increase in echogenicity of the liver parenchyma against renal cortex with normal visualization of the diaphragm and intrahepatic vessels).
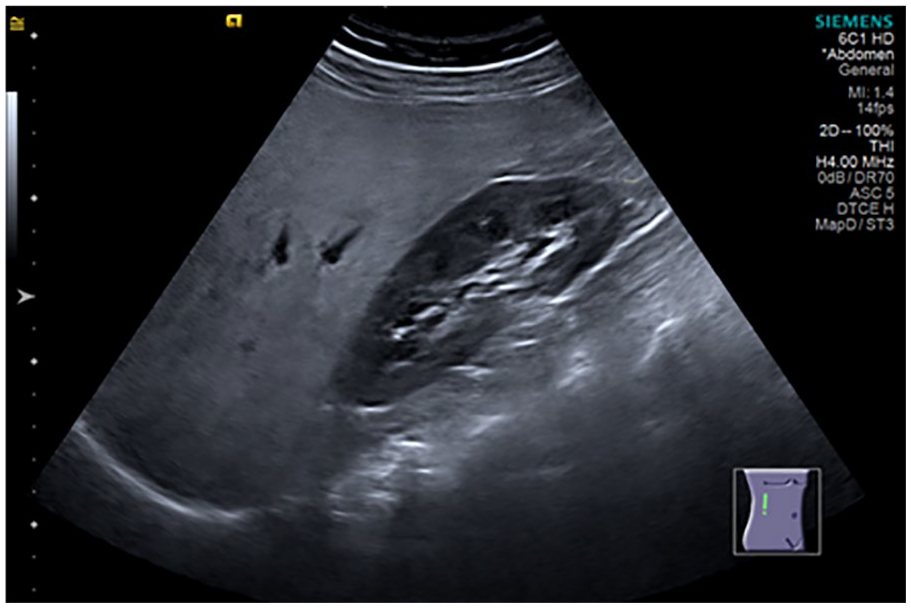
Sonogram demonstrating moderate liver steatosis (parasagittal subcostal view of the right hypochondrium showing increase in echogenicity of the liver parenchyma against renal cortex with impaired visualization of the intrahepatic vessels and diaphragm).
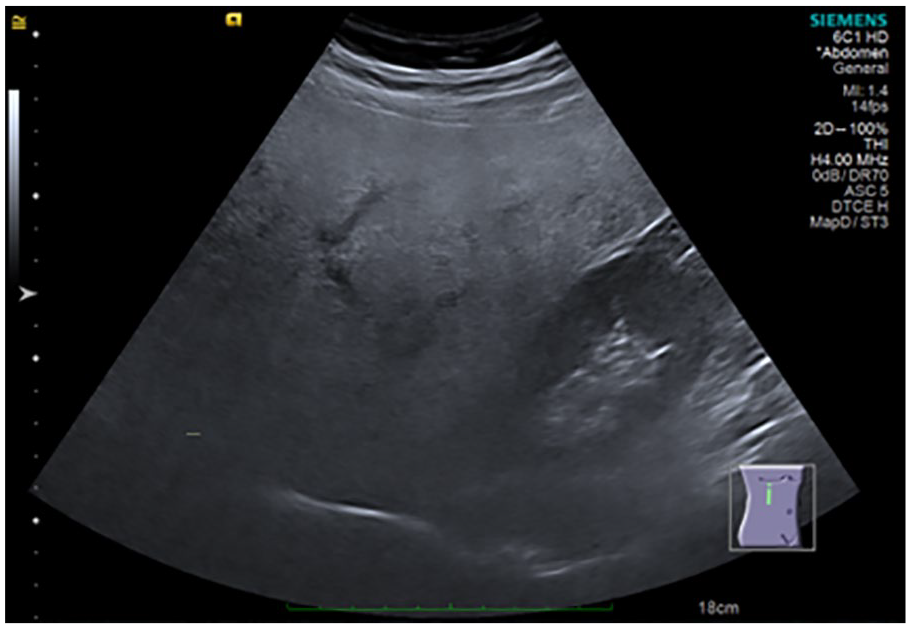
Sonogram demonstrating severe liver steatosis (parasagittal subcostal view of the right hypochondrium showing marked increase in echogenicity of the liver, with low penetration of the posterior segment of the right lobe of the liver and poor visualization of the hepatic vessels and diaphragm).
While some studies have shown a good correlation between qualitative grading using US and semiquantitative histological grading obtained by biopsy, the histological parameter is subject to important limitations, including variability of the tissue sample obtained and high dependence on the observer.10–11 Thus, fat quantification using MRI has become the new gold standard, besides it is better validated when compared to biochemical analysis of the amount of intrahepatic triglycerides or stereological computerized analysis of fat vesicles.12–14 Among all methodologies for quantifying liver fat by MRI, proton magnetic resonance spectroscopy (MRS) has the highest sensitivity, being used as a reference of good indicator of HS severity when compared to other methods.15,16
The aim of the study was to assess the correlation between the qualitative ultrasound score for detecting HS and liver fat quantification using proton MRS in the study population.
Materials and Methods
Study Population
This is a cross-sectional observational study, in which patients diagnosed or suspected to have NAFLD underwent US and MRI to be evaluated. Qualitative sonographic score, hepatic ultrasound elastography using the p-SWE technique (point shear wave elastography), assessment of heterogeneity of hepatic fat infiltration on MRI, quantification of iron by hepatic relaxometry and quantification of liver fat by proton MRS. This study was approved by the Research Ethics Committee of the CNPJ Institution 76.659.820/0001-51 using report No. 3,715,894.
The sample comprised the following inclusion criteria:
Patient agrees to participate in the study and sign the informed consent form.
Age greater than or equal to 18 years of age.
Nongravid patients.
Patients with suspicion or presence of fatty liver.
Patients without long-term hepatitis B or C (negative serologic test results for hepatitis B and C defined as HbsAg-negative and anti-HCV-negative antigens).
Patients with an alcoholic consumption of no more than 120 grams per week, on average for the last 3 months.
The exclusion criteria were as follows:
Patients with pacemakers, brain aneurysm clips, cochlear implants, metal implants in the body, infusion pumps, or electrostimulators.
Claustrophobic patients.
Bile duct obstruction detected by US.
Patients with a history or sonographic signs of heart failure: reduced compressibility of the inferior vena cava, pleural effusion, and predominant B lines in pulmonary US.
Acute/subacute liver inflammation defined as an elevation of transaminases greater than 5 times the normal value in the last 3 months.
Elastography measurements with interquartile variation of the median >0.15 m/s.
Hepatosiderosis detected by MRI.
Advanced long-term liver disease with fibrosis defined as elastography stiffness >1.7 m/s or >9 kPa. 17
Visually very heterogeneous HS in the parenchyma on MRI assessment.
Criteria (a) and (b) are related to the contraindication for MRI examination. 18 Criteria (c), (d), (e), and (f) are related to false positives for the definition of advanced hepatic fibrosis by elastography. 19 Items (g) and (h) are related to a confounding factor in the graduation of HS by US. Item (i) is related to the technical limitation of fat measurement by spectroscopy using only one voxel.
The presence of comorbidities, as well as the anthropometric and sociodemographic data of the patients, were documented.
Data Collection
The period selected for data collection was from September 2018 to July 2019. Anthropometric data of patients and the presence of comorbidities were evaluated. The imaging exams were performed and analyzed first by US and then by MRI, within a maximum period of 7 days, by the same radiology specialist. The qualitative score of HS was computed before the result of fat quantification by MRS was known. Last, all data were tabulated using Excel, so that the biostatistical analysis could be performed.
Each patient was instructed to fast for 4 hours before they underwent US. Initially, a standard thoracic and abdominal ultrasound examination was performed on the same device (S2000 HELX; Siemens, Erlangen, Germany), then the qualitative HS score was assessed by an image containing the longest longitudinal axis of the right kidney and liver, with the patient in a left lateral decubitus position using subcostal or intercostal window. Per study protocol, US machine settings were consistently performed with a frequency of 4 MHz, a dynamic range of 70 dB, gray scale map “D,” Advanced SieClearTM software at level 5, and Dynamic TCETM at “High” level. Measurement of liver stiffness was performed after the definition of the degree of steatosis, by the same US device, using the acoustic radiation force impulse point shear wave (ARFI pSWE) technique. The examination was performed on the hepatic segment VIII, between 2 and 6 cm of the liver capsule with the patient in a supine position, in expiratory apnea and with the right arm abducted, using at least 8 measurements and median interquartile variation <0.15.
The sonographic score used to graduate steatosis was grade 0 (normal) when echogenicity was normal (Figure 1); grade 1 (slight) when there was only a diffuse increase in echogenicity of the liver parenchyma with normal visualization of the diaphragm and intrahepatic vessels (Figure 2); grade 2 (moderate) in which there was a moderate diffuse increase in hepatic echogenicity associated with impaired visualization of the intrahepatic vessels and diaphragm (Figure 3); grade 3 (severe), a marked increase in echogenicity was observed, with low penetration of the posterior segment of the right lobe of the liver and poor visualization of the hepatic vessels and diaphragm (Figure 4).8,20 Ultrasonography and initial grading were performed by the same examiner with 15 years of experience, before shear wave stiffness measurement. Subsequently, 2 independent examiners, with 2 years of experience each, analyzed the images saved in the hospital’s file and gave their reports of HS graduation, without knowing neither the initial grading nor the results between each other.
An MRS protocol was established for fat quantification by a single technologist experienced with the examination technique using 1.5 Tesla Magnetom Aera Siemens, Germany. The entire liver was examined with a 16-channel surface coil using the VIBE e-DIXON sequence with a 400 mm field of view in the transverse direction, 9° flip angle and 320 matrix resolution. Fat quantification was obtained by MRS according to the software HISTO LiverLab using voxel of 3.0 × 3.0 × 3.0 cm3 in the hepatic segment VIII based on locating images, avoiding large vessels or lesions, and excluding hepatic heterogeneity in the sequences in and out of phase as well as in fat and water maps (see Figure 5).
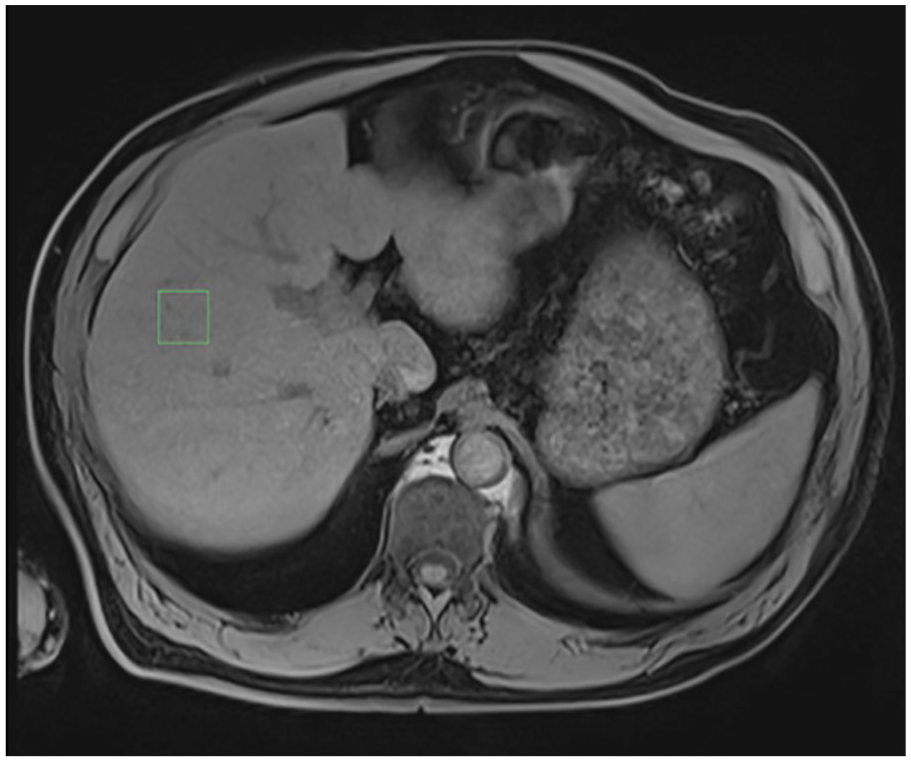
The region of interest in fat quantification by magnetic resonance spectroscopy (axial T1-weighted image with fat suppression showing the region of interest placed in the hepatic segment VIII).
Grading of HS using MRI was based on the percentage of fat measured by MRS, being considered normal ≤5.60, slight ≥5.61 and ≤16.46, moderate ≥16.47 and ≤27.32 and severe ≥27.33 and ≤38.21 (see Figure 6). These values represent the fat percentages tertiles of the studied population and are similar to those studied by Kühn et al, 21 which was based on the histopathological calibration modified for resonance.
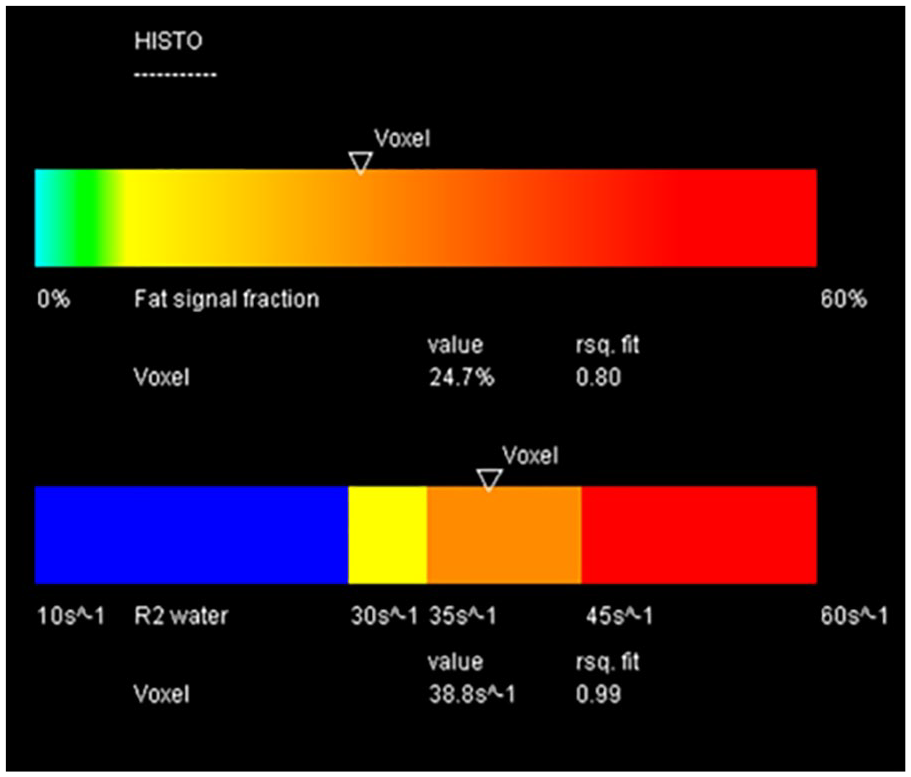
The liver fat fraction obtained by magnetic resonance spectroscopy.
The exams did not use any type of preparation or medication/contrast.
Statistical Analysis
The results obtained in the study were described with means, standard deviations, minimum values, maximum values (quantitative variables), or frequencies and percentages (categorical variables). The condition of normality of the variables was assessed by a Fisher’s test, for which P values <.05 were considered statistically significant. Kappa coefficient was used to assess the exact agreement between US and MRS quantification of steatosis in 4 groups (normal, slight, moderate, and severe). A second analysis of agreement was performed separating 2 groups: (1) obese, defined as body mass index ≥30 and (2) nonobese, with body mass index <30. Interobserver variability analysis were performed using the weighted Kappa coefficient that defines the distance of normal, slight, moderate, and severe categories between the most experienced examiner and each less-experienced examiner, as well as between the 2 less-experienced examiners. Agreement values used in the interpretation of the results were 0 to 0.20, low agreement; 0.21 to 0.40, reasonable agreement; 0.40 to 0.60, moderate agreement; 0.61 to 0.80 high agreement; and 0.81 to 1.00 very high agreement. 22 Sensitivity, specificity, accuracy, false-positive probability, false-negative probability, positive predictive value, and negative predictive value were calculated to assess the quality of the US to diagnose slight steatosis and differentiate moderate from severe steatosis, considering MRS as the gold standard. Analyses were done using IBM SPSS Statistics v.20.0. Armonk, NY: IBM Corp.
Results
One-hundred and four patients were referred to the study and 66 meet the inclusion criteria (see Figure 7). The characteristics of the sample are described in Table 1.
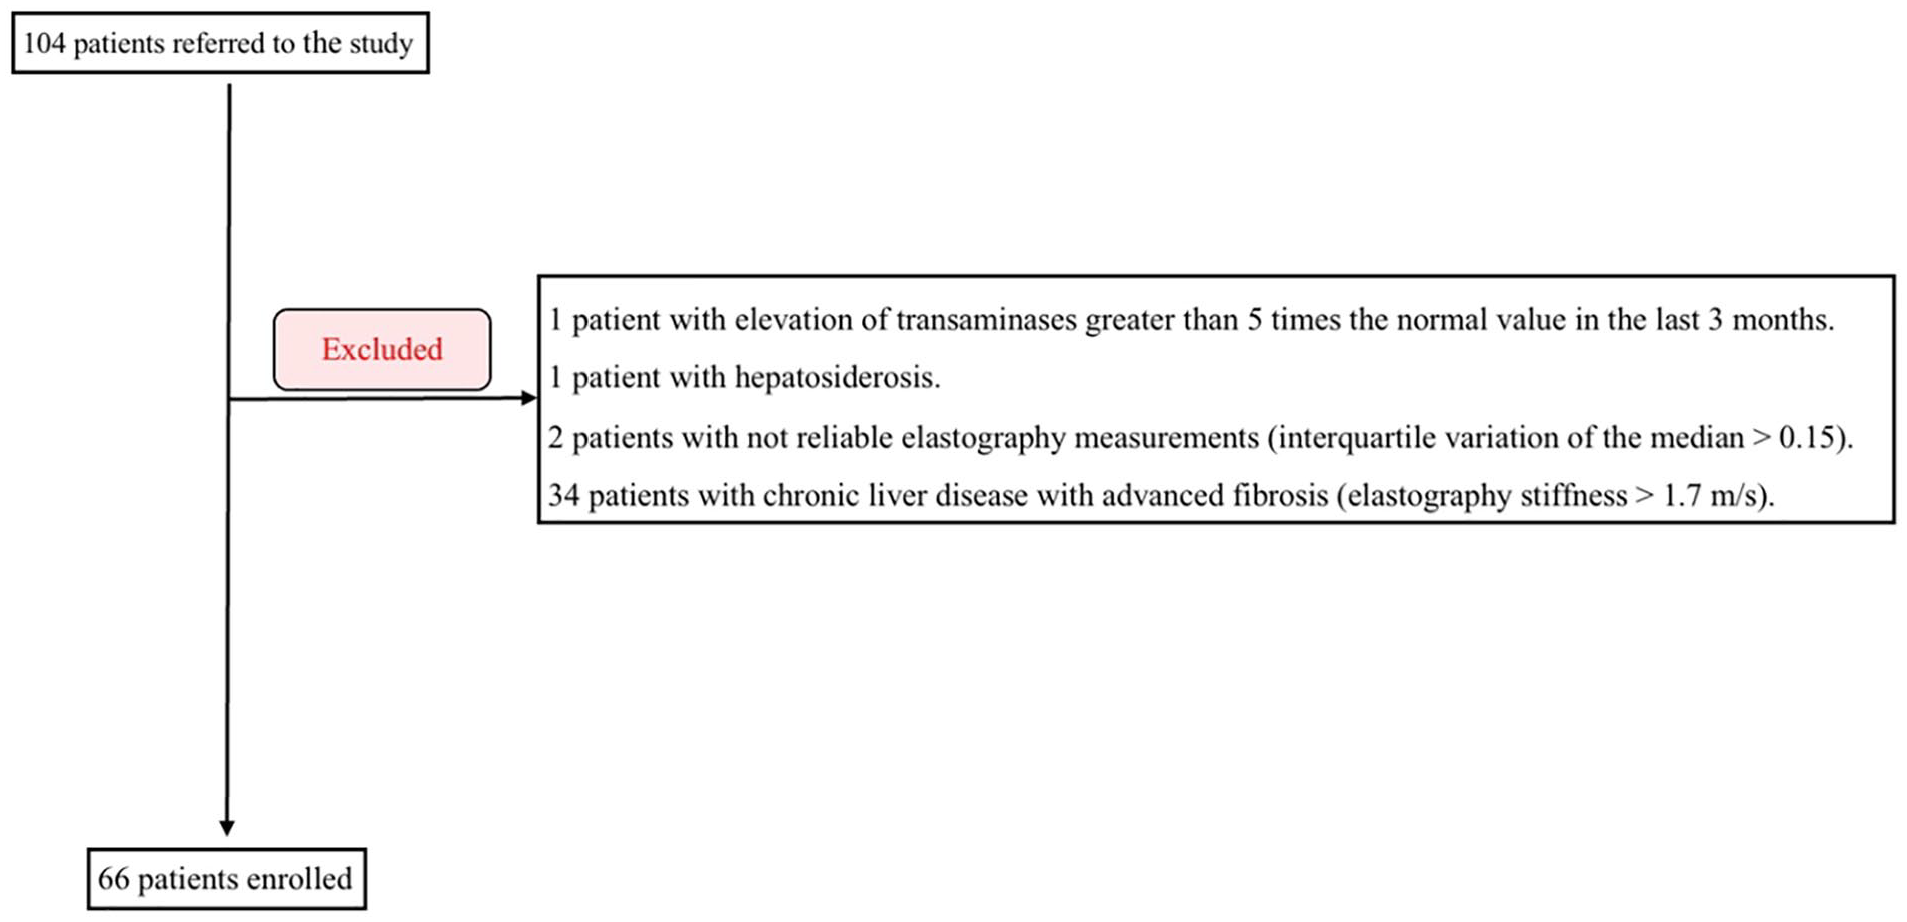
A flowchart of the study population.
The Descriptive Statistics Generated by the Patients Included in the Study.
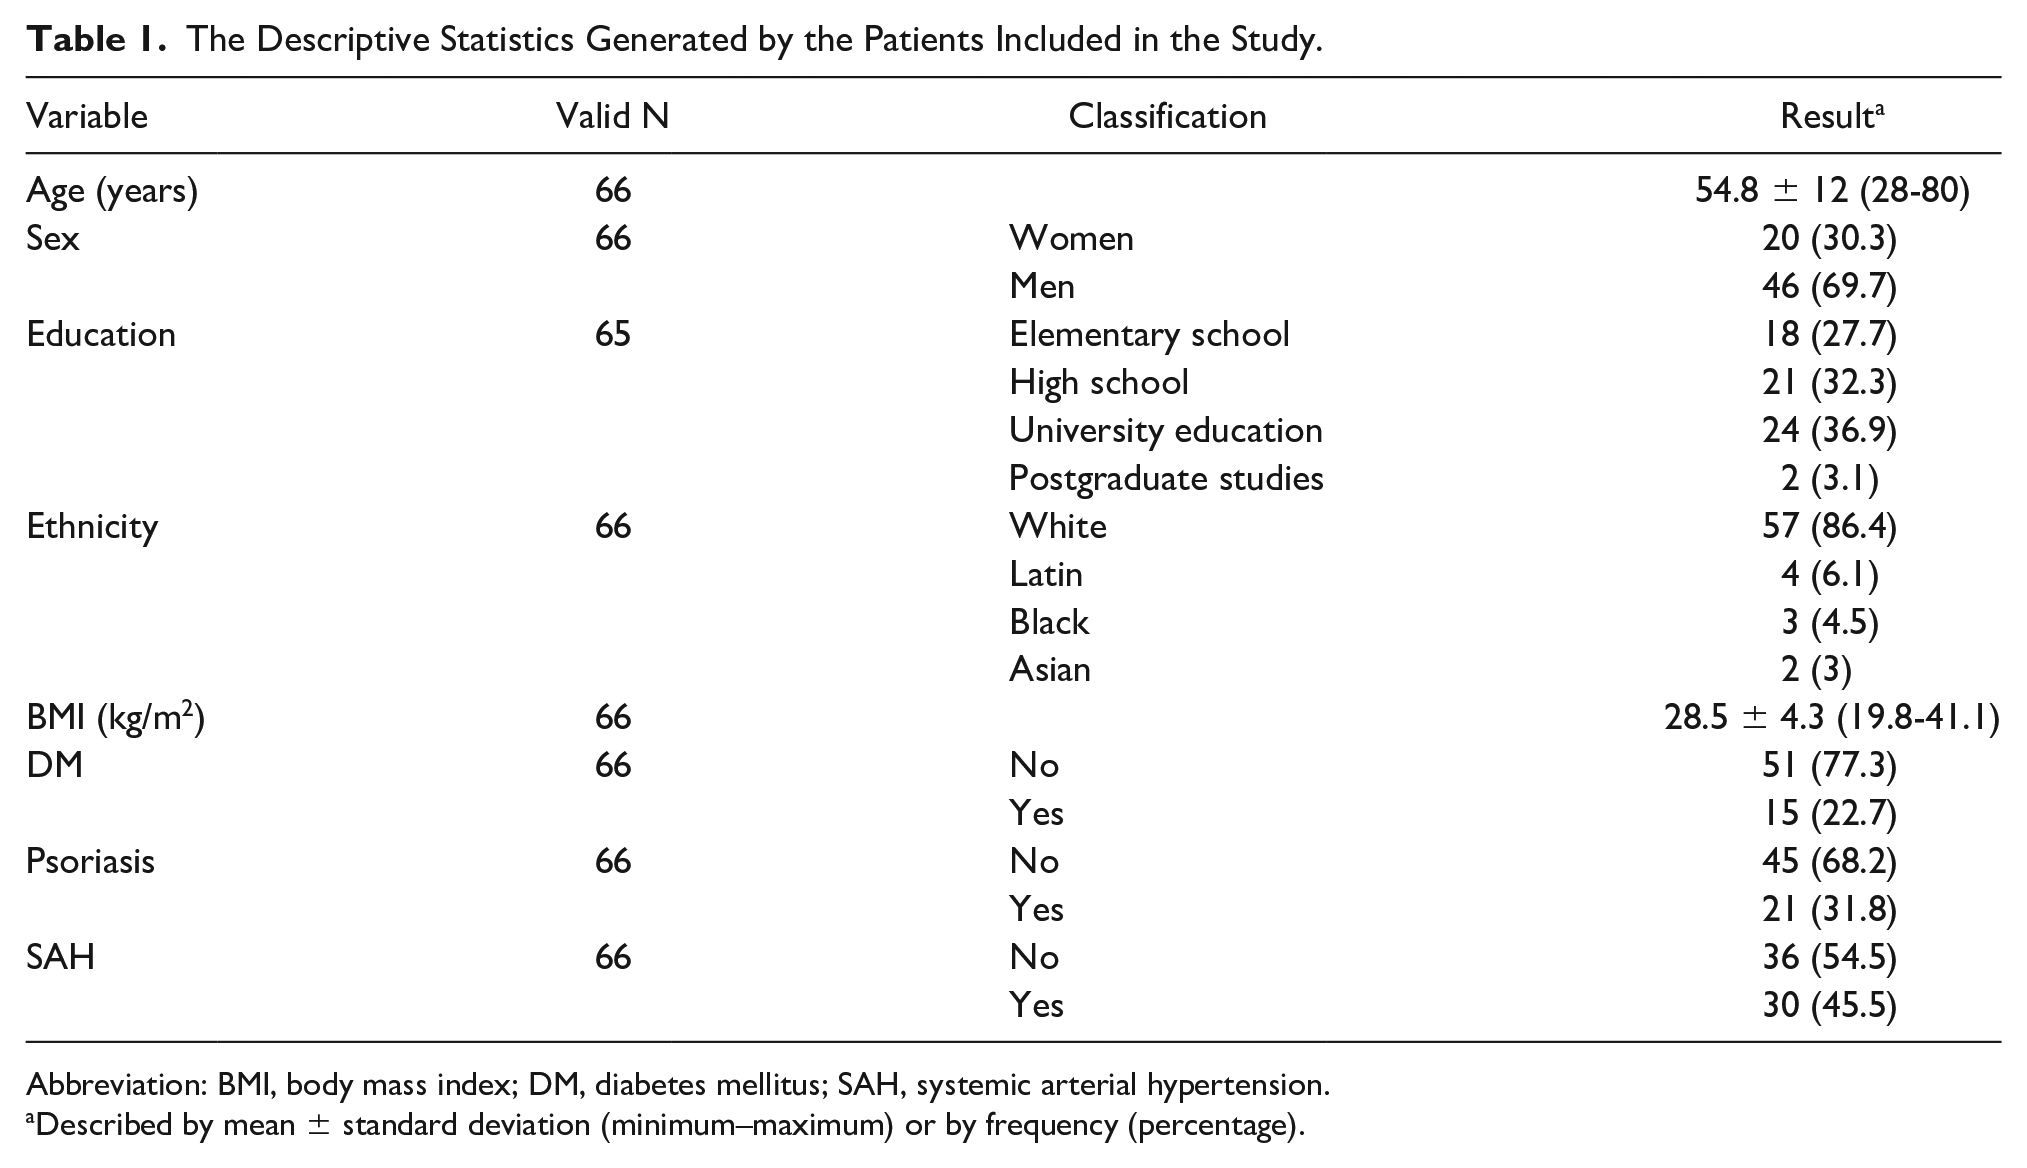
Abbreviation: BMI, body mass index; DM, diabetes mellitus; SAH, systemic arterial hypertension.
Described by mean ± standard deviation (minimum–maximum) or by frequency (percentage).
The average fat fraction obtained by MRS was 13.4 ± 9%, the minimum 1.2% and the maximum 38.2%. Regarding the grading of HS by MRS, 15 (22.7%) were classified as normal, 30 (45.5%) as slight steatosis, 16 (24.2%) as moderate steatosis, and 5 (7.6%) as severe steatosis. However, the grading of HS by US among the cases was normal in 18 (27.3%), slight in 9 (13.6%), moderate in 24 (36.4%), and severe in 15 (22.7 %).
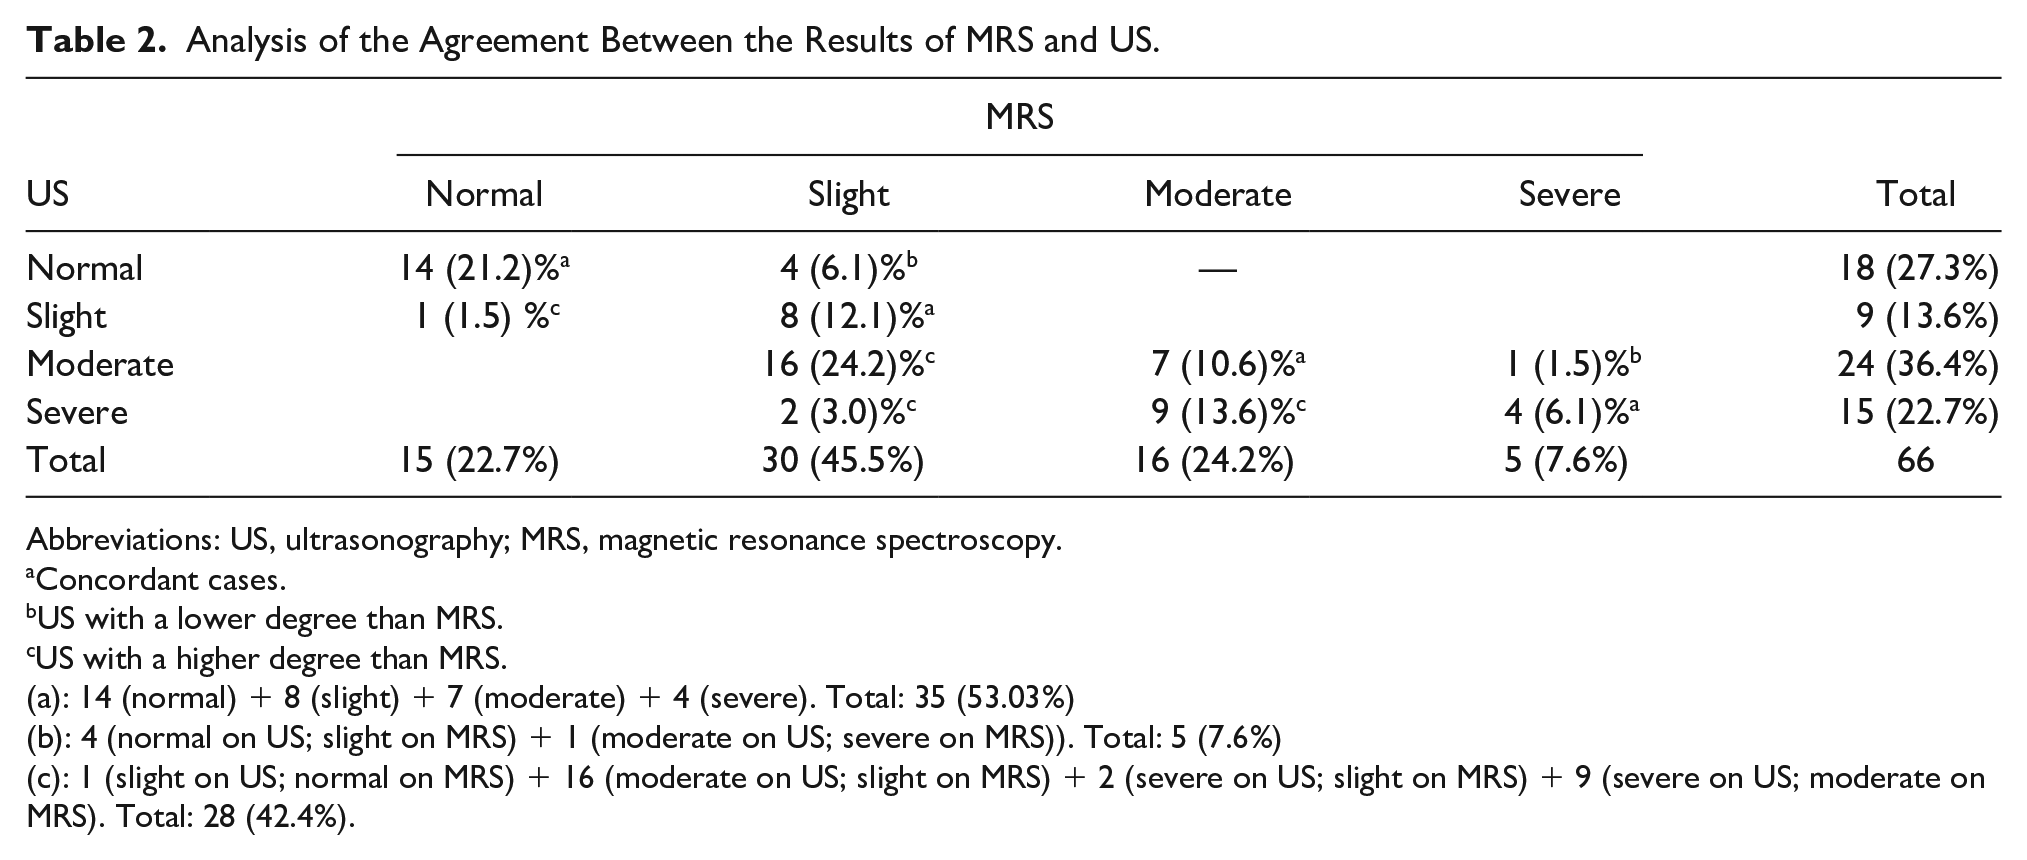
Kappa coefficient was used to assess the agreement between diagnoses by US and MRS. It was consistent in 50% of cases, with a Kappa value of 0.35 and a 95% confidence interval (CI) ranging from 0.21 to 0.59 (reasonable to moderate agreement). Twenty-eight patients (42.4%) presented US evidencing a higher HS grading compared to MRS, and 5 (7.6%) presented US evidencing a lower HS grading compared to MRS (see Table 2).
Analysis of the Agreement Between the Results of MRS and US.
Abbreviations: US, ultrasonography; MRS, magnetic resonance spectroscopy.
Concordant cases.
US with a lower degree than MRS.
US with a higher degree than MRS.
(a): 14 (normal) + 8 (slight) + 7 (moderate) + 4 (severe). Total: 35 (53.03%)
(b): 4 (normal on US; slight on MRS) + 1 (moderate on US; severe on MRS)). Total: 5 (7.6%)
(c): 1 (slight on US; normal on MRS) + 16 (moderate on US; slight on MRS) + 2 (severe on US; slight on MRS) + 9 (severe on US; moderate on MRS). Total: 28 (42.4%).
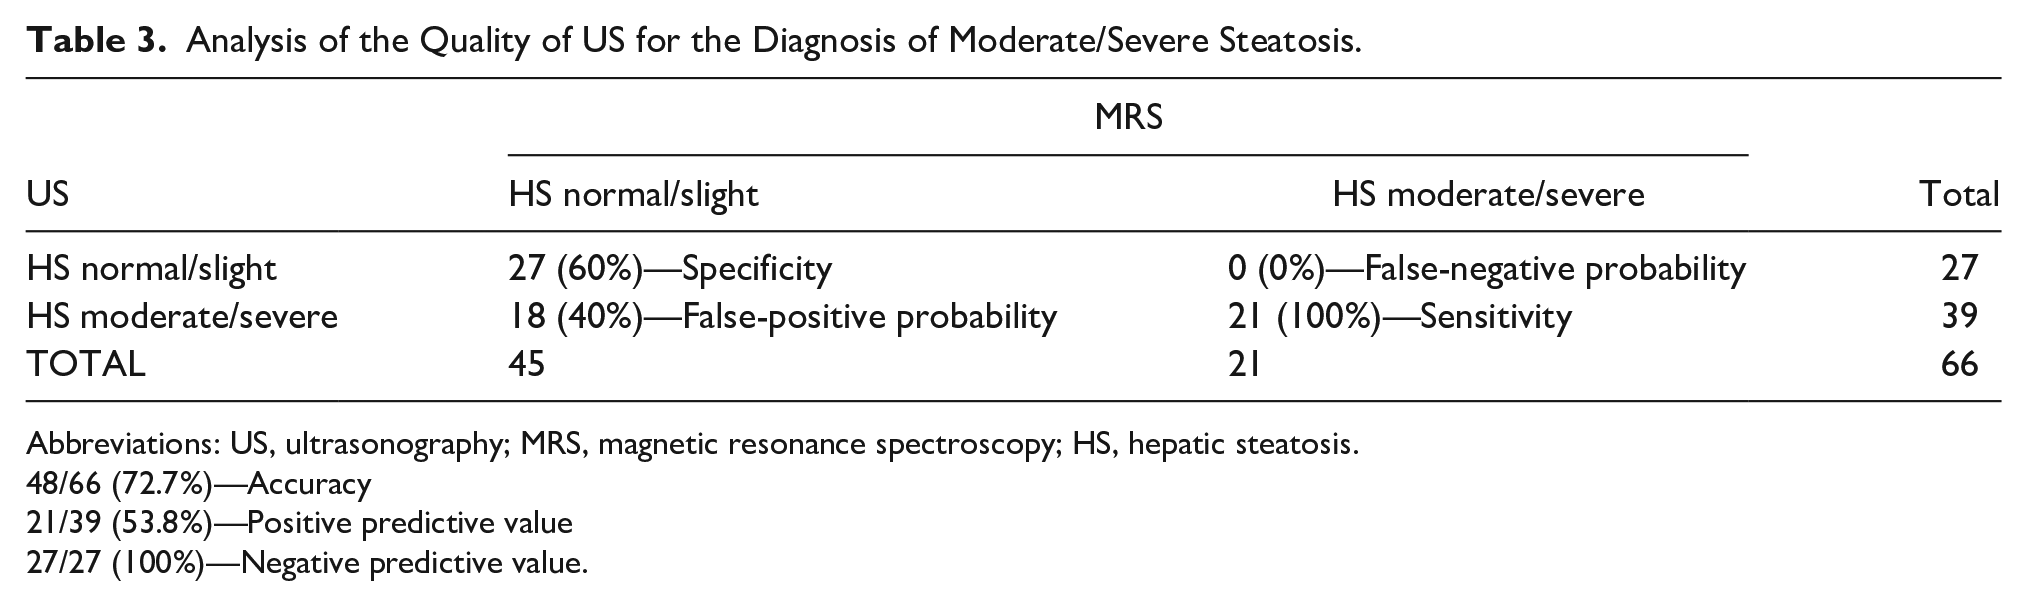
The quality analysis of US for diagnosis of HS used MRS results as the gold standard. The following classifications were grouped for the assessment of moderate and severe HS grading: normal/slight (absence of disease in moderate/severe forms) and moderate/severe (presence of moderate/severe disease). The US showed 100% sensitivity, 60% specificity (95% CI: 45.7%-74.3%), 72.7% accuracy (95% CI: 62%-83.5%), 40% false-positive probability (95% CI: 25.7%-54.3%), 0% false-negative probability, 53.8% positive predictive value (95% CI: 38.2%-69.5%), 100% of negative predictive value (see Table 3).
Analysis of the Quality of US for the Diagnosis of Moderate/Severe Steatosis.
Abbreviations: US, ultrasonography; MRS, magnetic resonance spectroscopy; HS, hepatic steatosis.
48/66 (72.7%)—Accuracy
21/39 (53.8%)—Positive predictive value
27/27 (100%)—Negative predictive value.
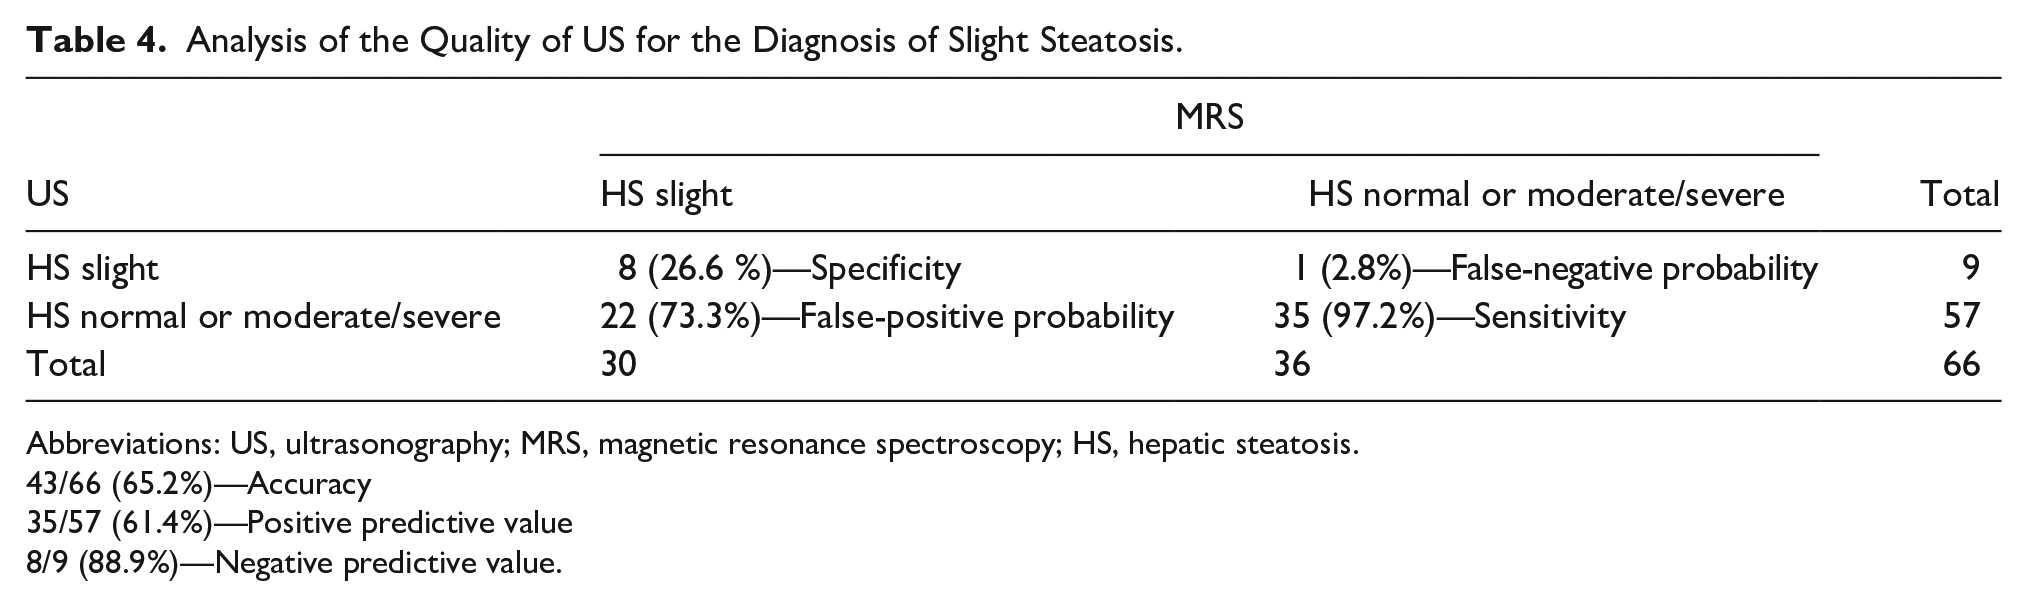
Similarly, for the analysis of graduation of slight HS, the following classifications were grouped: presence of slight steatosis (absence of disease in normal or moderate/severe forms) and absence of slight steatosis (presence of normal or moderate/severe disease). Ultrasonography showed 97.2% sensitivity (95% CI: 91.9%-100%), 26.6% specificity (95% CI: 10.8%-42.5%), 65.2% accuracy (95% CI: 53.7%-76.6%), 73.3% probability of false positive (95% CI: 57.5%-89.2%), 2.8% probability of false negative (95% CI: 0%-8.1%), 61.4% of positive predictive value (95% CI: 48.8%-74%), and 88.9% of negative predictive value (95% CI: 68.4%-100%) (see Table 4).
Analysis of the Quality of US for the Diagnosis of Slight Steatosis.
Abbreviations: US, ultrasonography; MRS, magnetic resonance spectroscopy; HS, hepatic steatosis.
43/66 (65.2%)—Accuracy
35/57 (61.4%)—Positive predictive value
8/9 (88.9%)—Negative predictive value.
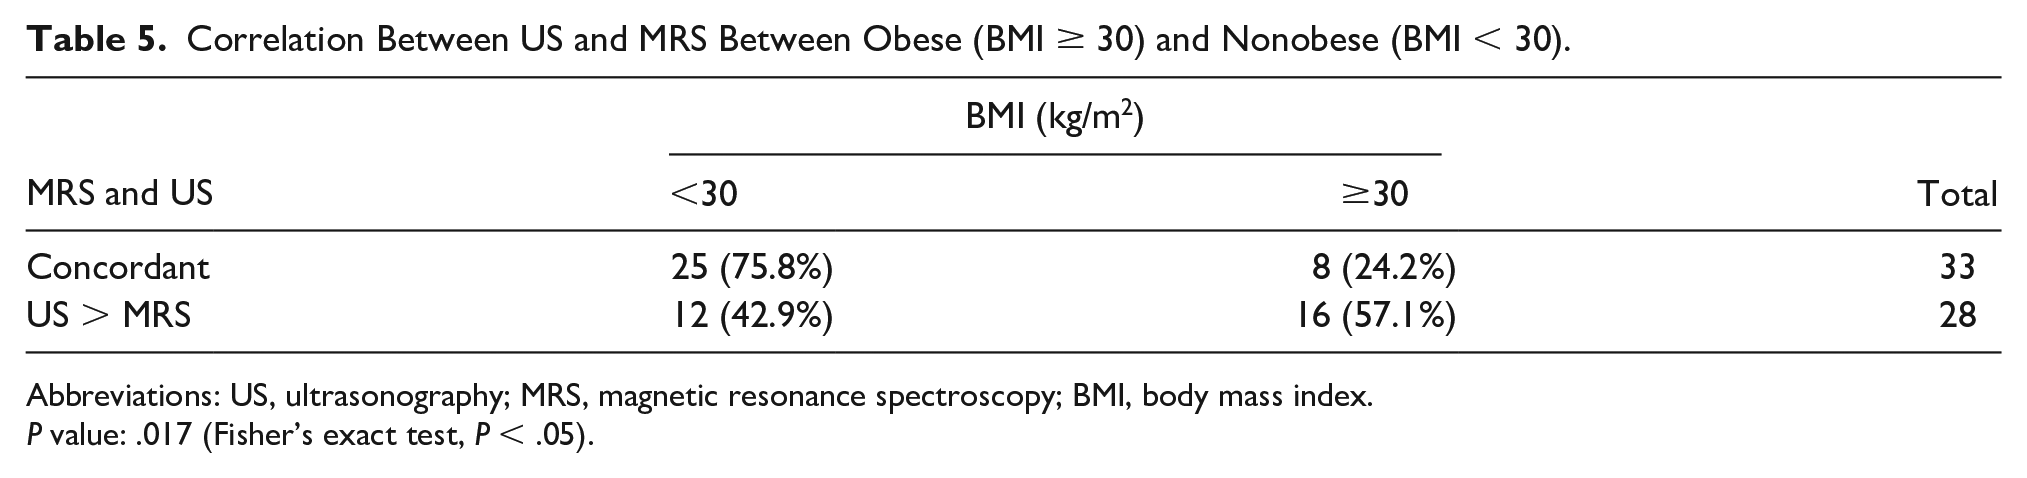
Patients’ body mass index (BMI) was correlated with cases that agreed between MRS and US (concordant cases) and cases with increased US grading compared to MRS (no concordant cases). This sample (61) was divided into obese (BMI ≥ 30) and nonobese (BMI < 30). Among the concordant cases (33), the mean BMI was 26.7 ± 4, minimum 19.8 and maximum 34.8. In this group, 25 patients were non-obese and 8 were obese. While in no concordant cases, US results are super estimated in comparison to MRS, as shown by more aggravating US results than MRS (28), the average BMI was 30.8 ± 3.9, the minimum was 25.3 and the maximum was 41.1, with 16 patients being obese. The P value was equal to .017 (see Table 5).
Correlation Between US and MRS Between Obese (BMI ≥ 30) and Nonobese (BMI < 30).
Abbreviations: US, ultrasonography; MRS, magnetic resonance spectroscopy; BMI, body mass index.
P value: .017 (Fisher’s exact test, P < .05).
The weighted Kappa coefficient between the experienced examiner and independent examiner 1 was 0.43 (95% CI: 0.26-0.61); between the experienced examiner and independent examiner 2 was 0.38 (95% CI: 0.22-0.53); and between the 2 independent examiners with similar experience was 0.39 (95% CI: 0.22-0.57).
Discussion
Because of the high prevalence of HS, US has been favored as a screening test since it is a low-cost, accessible, and noninvasive exam.
This study did not neglect any case of moderate to severe HS, revealing high sensitivity (100%) for nonslight presentation of the disease. For detection of slight HS, the sensitivity is also high (97.2%) in disagreement with most of the literature, which reports reduced sensitivity of US for detecting slight HS.6,7 This finding can be explained by the difference in the population of this study, composed of patients with NAFLD and not volunteers.
Regarding the specificity of grading, it was moderate (60%), with all disagreements occurring in patients with normal liver or slight steatosis on MRS and obesity was evident as a confounding factor. In the population studied, although US has been excellent for NAFLD screening, it was not a good technique for grading the disease. Considering that the probability of false positive was 40% and false negative was 0%, in this study, US demonstrated a tendency to overestimate the degree of HS, especially in obese patients. The low agreement found in the obese subgroup can be explained by possible interference of subcutaneous fat thickness in ultrasound bundles before reaching liver parenchyma. This may have been the reason obese patients comprised 66.7% of the cases in which US had a higher HS grade compared to MRS, indicating an overestimation of the result.
Comparison between the qualitative graduation of HS by US and MRS, as the gold standard, presented a weak to moderate agreement between the 2 methods. In 42.4% of cases, US interpretation indicated a more aggravating result than MRS, demonstrating a possible false aggravation of the disease. This result disagrees with the study carried out by Kramer et al 16 that evidenced a good correlation between subjective graduation by US and MRI, which may be due to different studied populations, mostly without HS in the study mentioned and to the different cut-off points used for graduation by MRI. In this study, we use the tertiles of the population and Kramer et al, used the arbitrary values 10% and 20% to discriminate between moderate and severe steatosis.
Interobserver variability analyses showed a reasonable to moderate agreement, either between an experienced observer and 2 other less-experienced observers, as well as between the 2 less-experienced observers; therefore, a technical limitation of the subjective grading of HS.
Limitations
This study has potential limitations: (1) even though no patient in the study had heterogeneous HS shown in the e-DIXON sequence evaluation of the entire liver, single voxel spectroscopy on segment VIII may not represent the mean fat accumulation in the entire liver volume in some of the patients; (2) since patients’ livers were not histologically examined, long-term inflammation as a confounding factor shown in US cannot be excluded, even with transaminases and elastography values within normal range; (3) as the study was conducted in a single center and using the same US and MRI devices, the generalization of the results is reduced.
Conclusion
In this study, US reveals to be a reliable method for detecting HS and an excellent screening test. Although, qualitative grading by US is not a good indicator of HS severity for the management and follow-up of NAFLD patients. The description of increased echogenicity, as well as visualization parameters of intrahepatic vessels and diaphragm, give an idea of the liver fat infiltration. Nevertheless, we should consider that the qualitative grading of steatosis by US may not reflect the same degree of hepatic fat fraction, especially in obese individuals.
Footnotes
Ethics Approval
This study was approved by the Research Ethics Committee of the CNPJ Institution 76.659.820/0001-51 using report No. 3,715,894.
Informed Consent
All patients agreed to participate in the study and signed the informed consent form.
Animal Welfare
No animal housing or experiments were conducted in this study.
Trial Registration
Not applicable.
Declaration of Conflicting Interests
The authors declared no potential conflicts of interest with respect to the research, authorship, and/or publication of this article.
Funding
The authors received no financial support for the research, authorship, and/or publication of this article.