
Abstract
Objective:
Lymphoedema involves swelling, especially in the subcutaneous tissues. For lymphoedema management to be successful, it is necessary to remove the interstitial fluid. Subcutaneous echogenicity may be associated with interstitial fluid, but echogenicity is not an indicator for the evaluation of management because we do not directly compare echogenicity with the interstitial fluid. We aimed to identify an outcome indicator for the evaluation of interstitial fluid using ultrasonography. We assessed the correlation between echogenicity and transverse relaxation rate (R2) on magnetic resonance imaging.
Methods:
This was an observational study. Healthy adults with leg swelling after activity for >8 h were recruited. The legs of 13 women were evaluated using ultrasonography, magnetic resonance imaging and measurements of the limb circumference before and after an intervention to reduce the swelling.
Results:
Echogenicity in the oedema group was greater than that of the controls. Echogenicity decreased with reductions in oedema. The range of the strongest correlations with the changes in R2 occurred at echogenicity values of 48–144 (Pearson’s correlation coefficient: r = −0.63 and p < 0.01). Thus, it was possible to evaluate the interstitial fluid using echogenicity.
Conclusion:
The outcome indicators for the evaluation of interstitial fluid using ultrasonography were echogenicities in the range of 48–144, and these values were valid for assessing the interstitial fluid in the subcutaneous tissue.
Introduction
Lymphoedema is the swelling, particularly in subcutaneous tissues, that results from the obstruction of lymphatic vessels or lymph nodes, and it involves the accumulation of lymph in the affected region. 1 Lymphoedema is caused by abnormalities or diseases originating in the lymphatic system either from congenital or acquired conditions or surgical lymph node excision. 2 Patients with lymphoedema accumulate ~80% of the fluid in the tissues in the subcutaneous tissues. 3 This fluid is chronically accumulated, and substantial subcutaneous adipose tissue and tissue fibrosis may develop. 4 Early detection and conservative therapy may halt the progression of lymphoedema and possibly reverse the condition; 5 therefore, it is necessary to treat lymphoedema in the early stages.
For lymphoedema therapy to be successful, it is necessary to remove the interstitial fluid from the subcutaneous tissue in an early stage. Nurses and other health professionals administer lymphoedema management protocols. The aim of lymphoedema managements is to reduce swelling by decongesting the impaired lymphatic pathways, reducing the lymphatic load, promoting the development of collateral drainage routes and stimulating the functions of the remaining patent routes. 4 In the clinical setting, the limb circumference (or limb volume) has been the most frequently used parameter for evaluating management protocols. 6 However, this technique involves indirect measures of the changes in the interstitial fluid, and muscle atrophy, fibrous tissue deposition, and weight gain may be inaccurately attributed to fluid accumulation. 7 In a previous study, the difference in the limb circumference (i.e. the difference between the limb circumferences of the affected and unaffected sites) was not associated with lymphoedema management. 8 Outcome indicators for the evaluation of lymphoedema management protocols are needed to directly measure the interstitial fluid in the subcutaneous tissue. Magnetic resonance imaging (MRI) may be the most accurate technique because MRI can clearly differentiate between the fluid and adipose tissue and because quantification is possible using the relaxation times in the subcutaneous tissue. 9 In the tissue, fluid exhibits the longest transverse relaxation time (T2), and T2 of the adipose tissue is lower. 9 The transverse relaxation rate (R2) indicates the tissue density in the water, and it is theoretically fit with the water signal. However, this technique cannot be used in routine examinations due to its high-cost and time-consuming nature.
Ultrasonography can be used to evaluate structural changes in the tissues. 1 Ultrasonography is also non-invasive and allows for real-time processing. Ultrasonography has three advantages. The first is that ultrasound devices can be operated with a simple button; therefore, it is possible for many health professionals to easily use ultrasonography. The second advantage is that handy-type ultrasound devices that can be used to assess patients at the bedside have been developed. 10 Finally, high-frequency devices have infiltrated the clinical setting and allow for the assessment of skin conditions in which nurses and many health professionals are interested. Therefore, these devices are easy for many health professionals to adopt in the clinical setting. In previous studies, the tissue structure was less homogeneous,11–13 and echogenicity of the oedematous tissue was higher than that of the normal subcutaneous tissue.11,12 Suehiro et al. 14 showed that subcutaneous echogenicity was linearly correlated with lymphoedema staging. Echogenicity is altered by the conditions surrounding the tissue. Therefore, subcutaneous echogenicity may be associated with the interstitial fluid in the subcutaneous tissue.
Subcutaneous echogenicity is not an outcome indicator for evaluating lymphoedema management protocols because we do not directly compare the changes in the echogenicities with the interstitial fluid. B-mode ultrasound devices are used to measure the morphology of the internal organs and lesions on the body surface, but these devices are not used to measure the interstitial fluid based on echogenicity. Echogenicity is easily altered by the pressure and angle of the probe 10 and by image processing in the ultrasound devices, which makes it less reliable. To solve this issue of low reliability, one researcher has performed all the measurements while maintaining a constant probe pressure and angle. Additionally, we used only a single ultrasound device and the stabilized image processing of that ultrasound device.
We aimed to identify the outcome indicators for the evaluation of the interstitial fluid in the subcutaneous tissue using ultrasonography. We assessed the correlation between the echogenicities and the R2 values in healthy adults. We hypothesized that the correlation between echogenicity and R2 would be stronger than the correlation between the limb circumference and R2. Both lymphoedema and oedema occur in healthy adults and are present whenever there is an imbalance between capillary filtration and lymph drainage regardless of the aetiology. 15 Therefore, we recruited healthy adults.
Materials and methods
Subjects
This was an observational study. All participants who met the following inclusion criteria were recruited: (1) age >20 years, (2) healthy women without cardiovascular disease and (3) swollen legs after working for >8 h primarily while standing. Participants with pacemakers or metal in their bodies and those who were claustrophobic were excluded. The ethics committee of Kanazawa University approved this study (permit no. 509), and all participants gave informed written consent.
Procedure
MRI, ultrasonography and leg circumference measurements were evaluated before and after the intervention for swelling reduction. As a control, ultrasonography and leg circumference measurements were also performed in the absence of swelling. Control measurements were conducted within 4 h of waking. The intervention that was performed to reduce swelling involved leg elevation and vibration for 20 min. These interventions have previously been shown to increase blood flow and reduce oedema in swollen legs.16,17 A Rela Wave (Global Micronics, Kashiwa, Japan) was used for the vibrator. The frequency and horizontal vibration were 47 Hz and 1.78 m s², respectively. The vibrator was placed under the legs with a cushion composed of urethane and expandable beads that was 80 cm long, 80 cm wide and 5 cm thick. The participants placed their legs on the centre of cushion, and they lied in the supine position while elevating their legs.
MRI
Using a 0.4-T open MRI system (APERTO Eterna; Hitachi Medical Corporation, Tokyo, Japan), multiple spin-echo (SE) images of the leg were acquired with the following parameters: repetition time, 2500 ms; echo times, 30 and 75 ms; slice thickness, 8 mm; matrix size, 256 × 256; number of signals averaged, 1; receiver bandwidth, ±45.1 kHz; and field of view, 220 mm. Next, the T2 images were calculated from the multiple SE images on a pixel-by-pixel basis. On the T2-weighted coronal images, the centre between the popliteal fossa and the lateral malleolus (anterior site) and three points in the same plane (posterior, medial, lateral sites) were marked so that the corresponding transverse MR image could be selected.
Ultrasonography
A Mylab™ Five (Esaote, Genoa, Italy) was used at 18 MHz for the ultrasound investigations. The probe was placed transversely on the leg, and the images of the skin, subcutaneous tissue, muscle and occasionally bone were obtained. The measurement dimensions were set to 4.0 cm wide and deep. The gain was adjusted to 88%. Sample ultrasound images were acquired at the three markers (i.e. the posterior, medial and lateral sites). Ultrasound images were also acquired while maintaining the probe pressure to clearly describe the small saphenous vein. We performed three measurements per marker site, and the intraclass correlation coefficient (ICC) for the echogenicity measurements was 0.99 (p < 0.01).
Limb circumference
The limb circumference was measured at the centre between the popliteal fossa and the lateral malleolus. A single researcher performed each measurement three times. The ICCs that were generated were 1.00 (p < 0.01).
Calculations of R2 with MRI
To correlate the echogenicities and the R2 values, regions of interest (ROIs) were selected in the three marker sites (i.e. the posterior, medial and lateral sites). The ROIs were 4 cm wide, and their thicknesses matched the subcutaneous tissue. To assess the correlation with limb circumference, ROIs were set in all the subcutaneous tissues. Changes in the T2 relaxation rates (∆R2) before and after the intervention were calculated using the following equation

The T2 oedema reduction indicates the mean T2 after the intervention, and the T2 oedema situation indicates the mean T2 before the intervention. The measurements of the T2 values were performed using ImageJ (v 1.46r; National Institutes of Health, Bethesda, MD, USA).
Principles of ultrasound
Echogenicity indicates the brightness of the image. An ultrasound wave is emitted from the ultrasound probe and is then propagated through the body. In this process, echogenicity is altered due to phenomena such as attenuation and reflection. 10 The reflection of ultrasound waves occurs at the surface boundaries between different types of media (e.g. bone and water). 10 Hyperechogenicity and hypoechogenicity indicate that echogenicity of an area is greater or less than that of the surrounding tissue, respectively.
Echogenicity calculations
We switched from a grey scale to a 16-colour scale (range of pixel intensities: 0–255) for imaging using the ImageJ analysis software to facilitate the observation of changes in echogenicity. The ROIs were 4 cm wide, and their thicknesses matched the subcutaneous tissue. To quantitate the ultrasonographic echogenicity, we selected the range of echogenicity that exhibited the strongest correlation with the R2 values. For the ultrasound imaging, we calculated the echogenicity levels of the pixels, and the changes in echogenicity rates (∆U) before and after the intervention were calculated using the following equation

where A indicates the echogenicity levels of the pixels in the controls, B indicates the echogenicity levels of the pixels in the reduced oedema (i.e. after the intervention) and C indicates the echogenicity levels of the pixels in the oedematous situation (i.e. before the intervention).
Limb circumference
We calculated the mean of three measurements, and the rate of change in the limb circumference was calculated using the following equation

where α indicates the mean circumference in the control, β indicates the mean circumference in the reduced oedema (i.e. after the intervention) and γ indicates the mean circumference in the oedema condition (i.e. before the intervention).
Statistical analysis
Pearson’s product–moment correlation coefficient was used to examine the correlation between (∆U) and (∆R2). ΔL and ΔR2 were not normally distributed; therefore, non-parametric coefficients (i.e. Spearman’s rank correlation coefficients) were used. The data were analysed using the SPSS v19 statistical software (IBM–SPSS, Inc. Chicago, IL, USA). In all, 23 images were required according to sample size calculation. The main result was echogenicity in ultrasonography, and the sample size mentioned here does not mean the number of subjects but the number of images. Sample size estimates were based on the following: customary effect size, 0.60; a level, 0.05; power, 80%. 18
Results
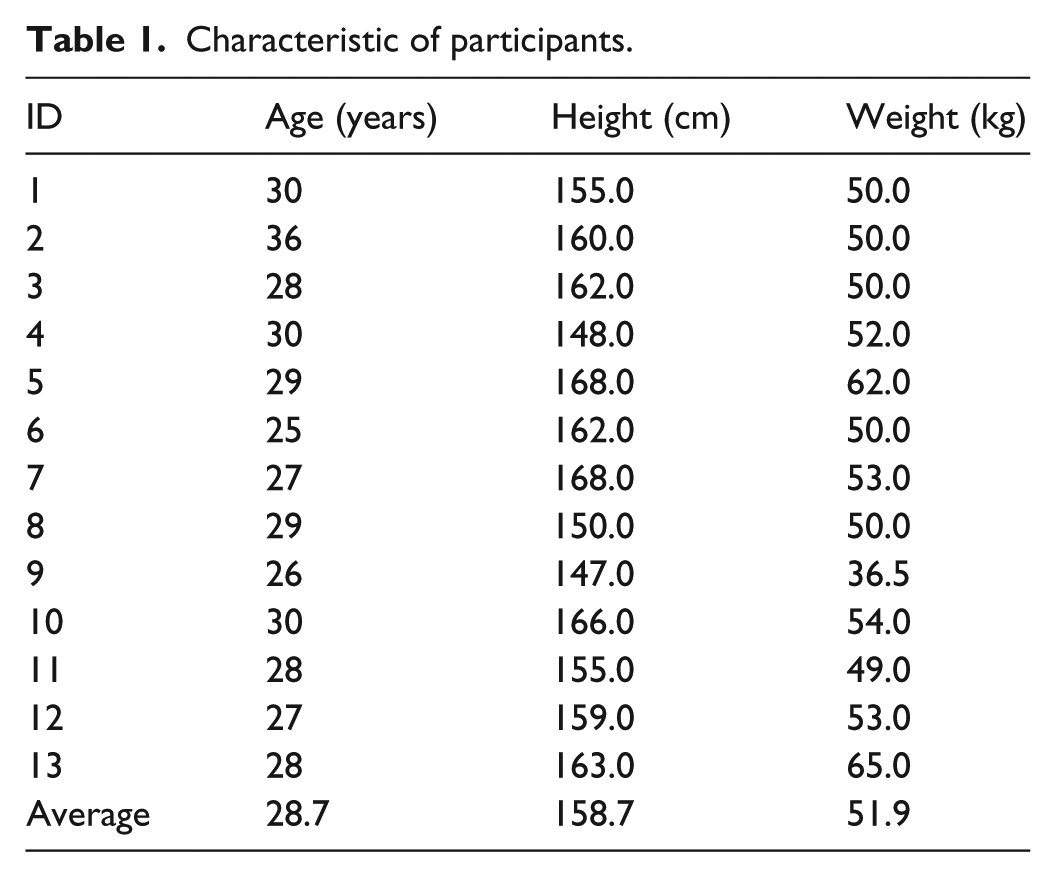
In all, 13 healthy adults ranging in age from 25 to 36 years, in height from 147 to 168 cm and in weight from 36.5 to 65 kg participated in the study (Table 1). All participants had Japanese ethnic backgrounds.
Characteristic of participants.
The structural changes were observed on the 16-colour scale (Figure 1). In the controls, ‘a deep blue colour’ covered the subcutaneous tissue. However, in the oedema situation, echogenicity was higher than that observed in the controls, which corresponded to the increases in the blue and green colours. In the reduced oedemas, echogenicity was decreased as evidenced by the reductions in the amounts of blue and green. The range of the strongest correlation with the R2 values was 48–144 echogenicity (R2 = 0.4015; Table 2).

Ultrasound images of (a) oedema situation, (b) oedema reduction and (c) control leg (ID 3). In the controls, ‘the deep blue colour’ covered the subcutaneous tissue. In the oedema situation, ‘the blue and green colours’ were increased. In oedema reduction, ‘the amount of blue and green’ was reduced.
Correlation of echogenicity with T2 relaxation rate.

R2: coefficient of determination.
The ∆U, ∆R2, and ∆L results are shown in Table 3. The mean (range) ∆U of the 48–144 range of echogenicity values was −0.05% (−0.43% to 0.12%), and the mean (range)∆R2, which was compared with the ultrasound imaging, was 2.82 × 10⁻⁶ S−1 (−4.68 × 10⁻⁶ to 21.33 × 10⁻⁶ S−1). The mean (range) ∆L was −1.95% (−5.45% to 0.28%), and the mean (range) ∆R2, which was compared with the limb circumference, was 1.68 × 10⁻⁶ S−1 (−1.58 × 10⁻⁶ to 5.19 × 10⁻⁶ S−1).
Three measurements per person.

A significant negative correlation was observed between ∆U in the range of 48–144 echogenicity and the ∆R2 values in terms of the comparison with the ultrasound imaging (Pearson’s correlation coefficient: r = −0.63 and p < 0.01; Figure 2). However, no significant correlation was observed between the ∆L and ∆R2 values in terms of the comparison with the limb circumference (Spearman’s rank correlation coefficient: r = −0.13 and p = 0.68; Figure 3).
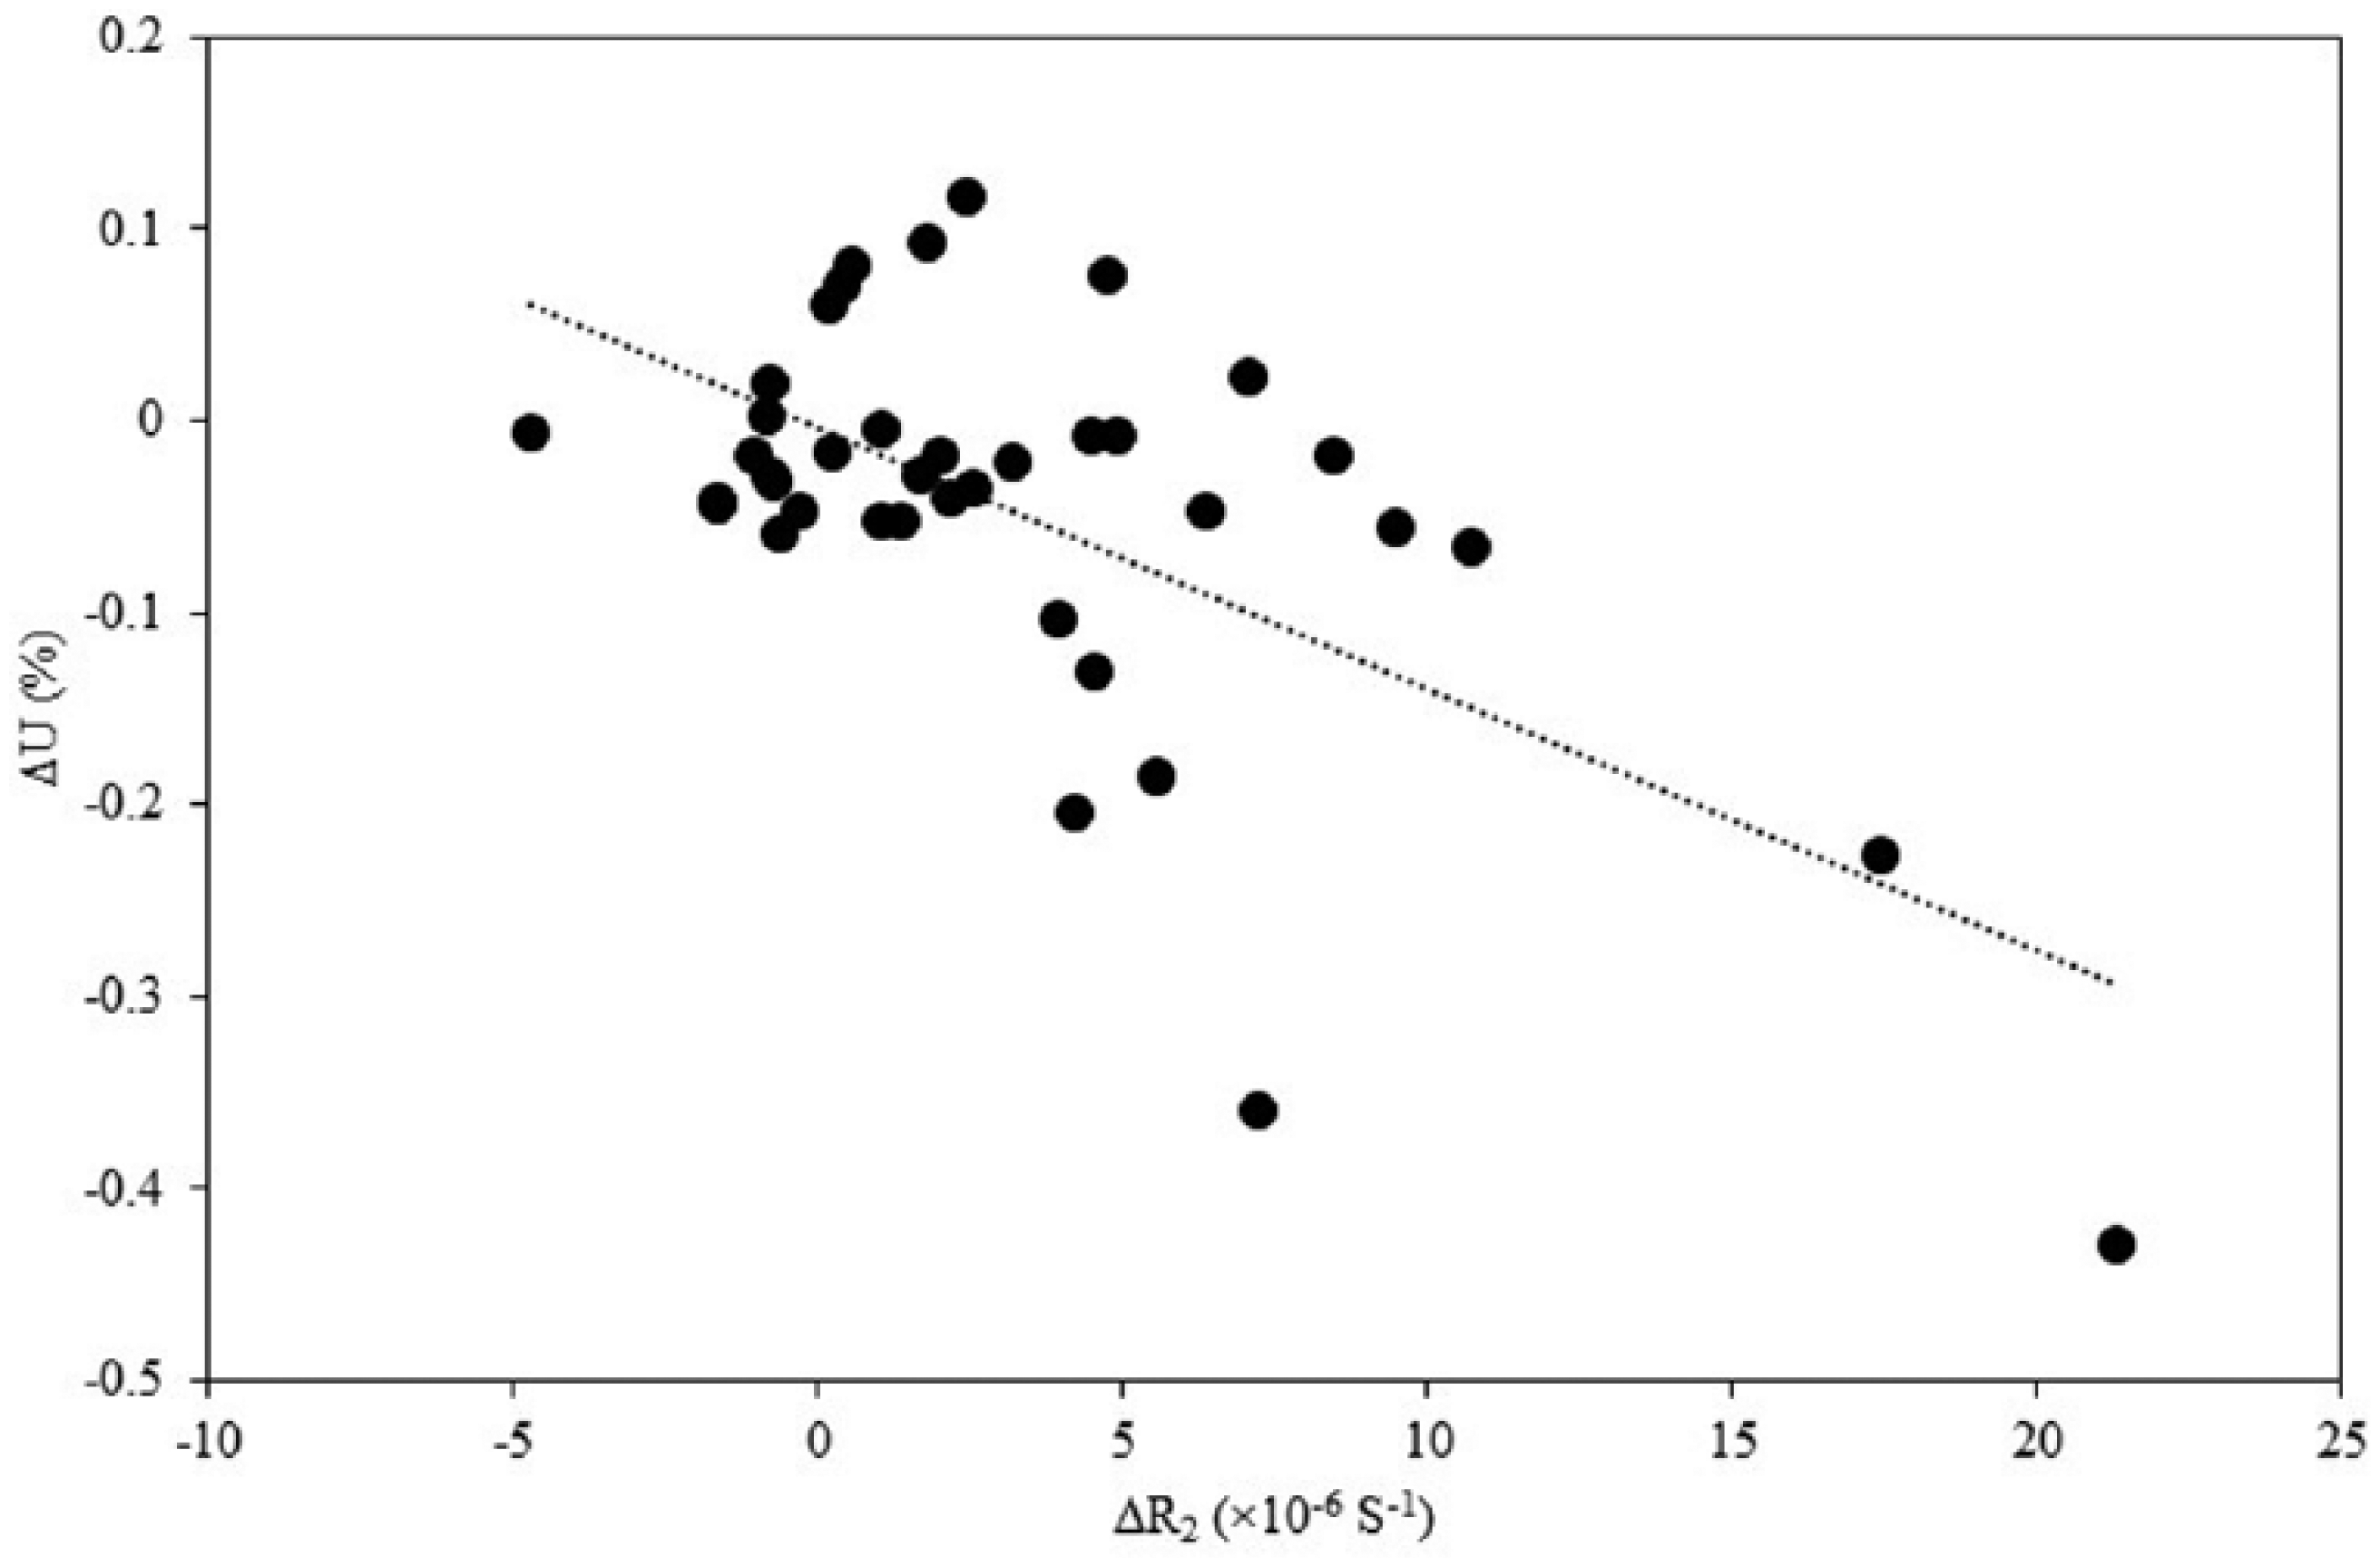
Correlation between ∆U of 48–144 echogenicity and ∆R2. A total of 39 samples with 13 participants were acquired. Pearson’s correlation coefficient: r = −0.63 and p < 0.01.

Correlation between ∆L and ∆R2. A total of 13 samples with 13 participants were acquired. Spearman’s rank correlation coefficient: r = −0.13 and p = 0.68.
Discussion
Our findings indicate that the echogenicities in the range of 48–144 correlated with the R2 values; thus, echogenicity may be a valid indicator for assessing the interstitial fluid in the subcutaneous tissue. Echogenicity is a relatively subjective tool 1 because ultrasound images are easily altered by alterations in the pressure and angle of the probe 10 and by the image processing that occurs in ultrasound devices; these factors make echogenicity less reliable. To address this issue of low reliability, a single researcher performed the measurements using a single ultrasound device. The ICCs in the 48–144 echogenicity range were 0.99 (p < 0.01), and they exhibited high reliability. It was possible to evaluate the interstitial fluid by improving the reliability. We assessed all the ranges of echogenicity and found that echogenicity was correlated with the R2 values only in the range of 48–144. The R2 value is likely proportional to water; 19 therefore, the 48–144 echogenicity range may measure the interstitial fluid in the subcutaneous tissue.
In this study, increased echogenicity was observed in the oedema condition in the range of 48–144. In previous studies, oedematous tissue structures have been found to be hyperechogenic compared with the normal subcutaneous tissue.11,12,14 Tassenoy et al. 11 reported that oedematous subcutis exhibits an echogenicity that is 141.9% higher than that of normal subcutis. Increased echogenicity of the subcutaneous tissue with a blurring of the interface between the subcutaneous tissue and the skin has also been previously reported in lower lymphoedema. 20 These changes have been observed in various inflammatory conditions. 21 Therefore, the interstitial fluid may influence echogenicity. The novel finding of this study is that echogenicity was associated with the interstitial fluid only in the range of 48–144.
The findings of this study supported our hypothesis that the correlation between echogenicity and R2 would be stronger than the correlation between limb circumference and R2. The lower limb circumference was not correlated with R2 (Spearman’s rank correlation coefficient: r = −0.13 and p = 0.68; Figure 3). In the clinical setting, limb circumference (or limb volume) has been the most frequently used measure for evaluating lymphoedema therapies. 6 However, this technique cannot differentiate between bone, muscle, fat and fluid. In contrast, ultrasonography can directly describe the subcutaneous tissue. These differences may explain why the correlation between echogenicity and R2 was greater than that between R2 and limb circumference. However, this study included a small sample (n = 13) in the correlation between limb circumference and R2. We cannot state that limb circumference does not indicate a change in interstitial fluid.
We captured the changes in the interstitial fluids in the subcutaneous tissues using the changes in the range of 48–144 echogenicity, and we found that lymphoedema managements can be more easily evaluated with ultrasound devices. To implement this technique, we would need to develop a new management protocol that delays the progression of lymphoedema.
The findings of this study have three limitations. The first limitation is that only one expert in ultrasonography operated a single ultrasound device. Ultrasound imaging is easily altered 10 by the operator and the image processing of ultrasound devices, and echogenicity is a relative evaluation. In this study, we adjusted the imaging in a controlled manner, and a single researcher performed all the measurements with a single device. In a future study, we will need to examine the inter-operator and inter-equipment variabilities. References need to be inserted into the ultrasound images, and adjustments need to be made to echogenicity to evaluate the interstitial fluid in different health professions. The second limitation is that the participants were healthy adults. Suehiro et al. 14 reported similar findings and described their findings as ‘increased echogenicity limited to the area above the muscular fascia’ in the early-stage lymphoedema. Therefore, this study may have primarily evaluated patients with early-stage lymphoedema. However, in late-stage lymphoedema, large amounts of subcutaneous adipose tissue and tissue fibrosis may develop and alter the tissue structure. 4 Indeed, the lymphoedemous subcutaneous tissue exhibits several patterns of structural change. 12 The use of the echogenicity range of 48–144 may affect measurements of the interstitial fluid. In the future, we need to assess whether this technique is applicable for patients with lymphoedema. The third limitation is that the measurement sites were the legs. We did not observe whether the 48–144 echogenicity range could be used to evaluate the interstitial fluid in any region other than the lower limbs.
Conclusion
It is possible to evaluate the interstitial fluid using echogenicity. The outcome indicator for the evaluation of the interstitial fluid using ultrasonography was echogenicity in the range of 48–144, and this indicator was valid for assessing the interstitial fluid in the subcutaneous tissue.
Footnotes
Declaration of conflicting interests
The author(s) declared no potential conflicts of interest with respect to the research, authorship and/or publication of this article.
Funding
The author(s) disclosed receipt of the following financial support for the research, authorship, and/or publication of this article: The study was performed with the support of a JSPS KAKENHI grant (No. 26670919).