
Abstract
Objective:
The objective of this study was to compare proximal, local, and distal muscle morphology in women with and without patellofemoral pain (PFP).
Materials and Methods:
Proximal, local, and distal muscle thicknesses (MTs) were obtained with B-mode sonography in healthy (control group [CG], n = 20) and PFP (PFP group, n = 20) women. In addition, muscle mass was measured by the sum of the synergistic MTs. Data were analyzed by independent t-test, Mann-Whitney U test, and effect size.
Results:
PFP women had smaller gluteus medius (P = .02, d = 0.7), vastus medialis (P < .01, d = 1.0), and flexor digitorum brevis (P < .01, d = 1.0) MT and greater gastrocnemius medialis (P = .04, d = 0.6) MT than CG. Quadriceps muscle mass (P = .01, d = 0.8) and foot muscle mass (P = .008, d = 0.9) were smaller, while plantar flexor muscle mass was greater in the PFP group than in CG (P = .01, d = 0.8).
Conclusion:
PFP women have proximal, local, and distal MT alterations in comparison with CG, which may explain possible changes in muscle strength and functionality.
Patellofemoral pain (PFP) is characterized by retropatellar and/or peripatellar pain that usually occurs during activities involving knee flexion, such as squats and stair ascent and descent. 1 PFP is the most common clinical knee manifestation in sports medicine mainly affecting women.2,3 It has been related to 11%–17% of all knee injuries4,5 and 20% of all running-related injuries. 3 Also, there is a higher PFP incidence in women. 6 More than 90% of people with PFP experience persistent pain up to 20 years after the symptom’s onset,7,8 which impairs patients’ functional performance and reduces their quality of life.9,10
A common clinical finding associated with PFP is muscle weakness,11–13 and the mechanisms related to muscle strength deficits are commonly attributed to central (i.e., neural) 14 and peripheral (i.e., skeletal muscle) parameters. 11 One of the important skeletal muscle structural parameters is muscle thickness (MT), as it has a positive correlation to maximum voluntary contraction. 15 Also, a smaller MT was associated with higher levels of pain in PFP, 16 demonstrating a clinical effect of PFP in skeletal muscle structural parameters, which may affect functionality. However, although the knee extensor muscles are directly involved in PFP, muscle morphology studies in patients with PFP have revealed controversial results. While some studies found no difference between PFP and asymptomatic subjects for quadriceps muscle morphology (i.e., MT and cross-sectional area),17,18 others reported significant deficits (i.e., volume, pennation angle, and cross-sectional area) in the PFP group.19–21 Similarly, while a smaller cross-sectional area of foot muscles was observed in individuals with pronated feet and symptomatic overuse injuries in the lower extremity (among them PFP), 22 controversial findings were observed in proximal muscles acting at the pelvis and hip joint.16,23,24 While the MT of trunk muscles (internal and external oblique) appears to be smaller in PFP, 16 no differences were observed in the gluteus medius and gluteus maximus of PFP subjects compared to asymptomatic subjects.23,24
PFP etiology is multifactorial, with biomechanical deficits being observed at hip/trunk (proximal factors), knee (local factor), and ankle/foot (distal factors) in patients with PFP. 25 Changes in MT of synergistic muscles may also change their impact on musculoskeletal biomechanical properties. In the quadriceps muscle, for example, a reduction in the size of vastus medialis (VM) relative to vastus lateralis (VL) has been considered a factor responsible for poor patellar tracking during knee flexion and extension movements.20,26 This between-synergists size difference may lead to different pressure regions at the articular cartilage surface of the patella and the femur, which may cause cartilage degeneration, thereby leading to joint pain. Similarly, distal muscles are responsible for controlling the foot movements during functional tasks, 22 and abnormal foot movements are linked to lower limb misalignment. 27 Intrinsic foot muscles can control foot posture and counteract the medial longitudinal arch deformation,22,28 which may also affect lower limb alignment. Therefore, changes in distal muscle structure may lead to abnormal limb function that may contribute to PFP.
Despite the above-mentioned evidence of muscle structure deficits in PFP, no previous studies were found that made a comprehensive evaluation of the lower limb muscle morphology encompassing muscles that act proximally to the knee (hip), locally at the knee, and distally to the knee (ankle/foot) in women with PFP. Thus, this study aims to evaluate the lower limb muscle morphology and muscle mass of synergistic muscles in women with PFP and compare it to a matched control group (CG) of healthy women. The hypothesis is that young women with PFP will have lower MT of individual muscles and lower muscle mass of synergistic muscles at all lower limb joints compared to the healthy CG.
Materials and Methods
Study Design
In this cross-sectional study, women with PFP and healthy women without PFP attended a single session of ultrasonographic (US) evaluations. CG subjects were recruited from the university where the study was conducted, whereas patients with PFP were recruited through posted flyers at the university and through social media advertisements. The evaluations were developed between October 2018 and May 2019.
This study was approved by the University’s Ethics Committee for Human Research (Protocol no. 2.089.328) and was prospectively registered on Clinical Trials (no. NCT03663595). All participants were informed of the benefits and risks of the investigation before signing an institutionally approved informed consent document to participate in the study.
Participants
The sample size was determined a priori based on a previous study of this research group (unpublished data), which observed a 10% difference in quadriceps muscle mass between women with and without PFP (PFP = 4.7 ± 0.6 cm; CG = 5.2 ± 0.6 cm), with an effect size (ES) of 0.88, observed power of 1 − β >0.80, and an alpha level equal to 0.05 using a statistical package (G*Power 3.1.3; Frauz Faur Universität Kiel, Germany). 29 The quadriceps muscle mass was considered for sample size determination because the generalized quadriceps atrophy (and the resulting muscle weakness)11,17,19,20,30–32 is the most evident factor in idiopathic PFP. In addition, muscle atrophy is directly related to muscle weakness, and quadriceps weakness is the only prospective risk factor for PFP with at least moderated evidence in the PFP population. 31 A minimum sample size of 17 subjects per group was indicated. However, due to possible losses, 20 participants per group were recruited from a total of 40 women between 18 and 42 years of age. Anthropometric characteristics of both groups and PFP clinical data are presented in Table 1.
Characteristics of PFP and CG Participants.
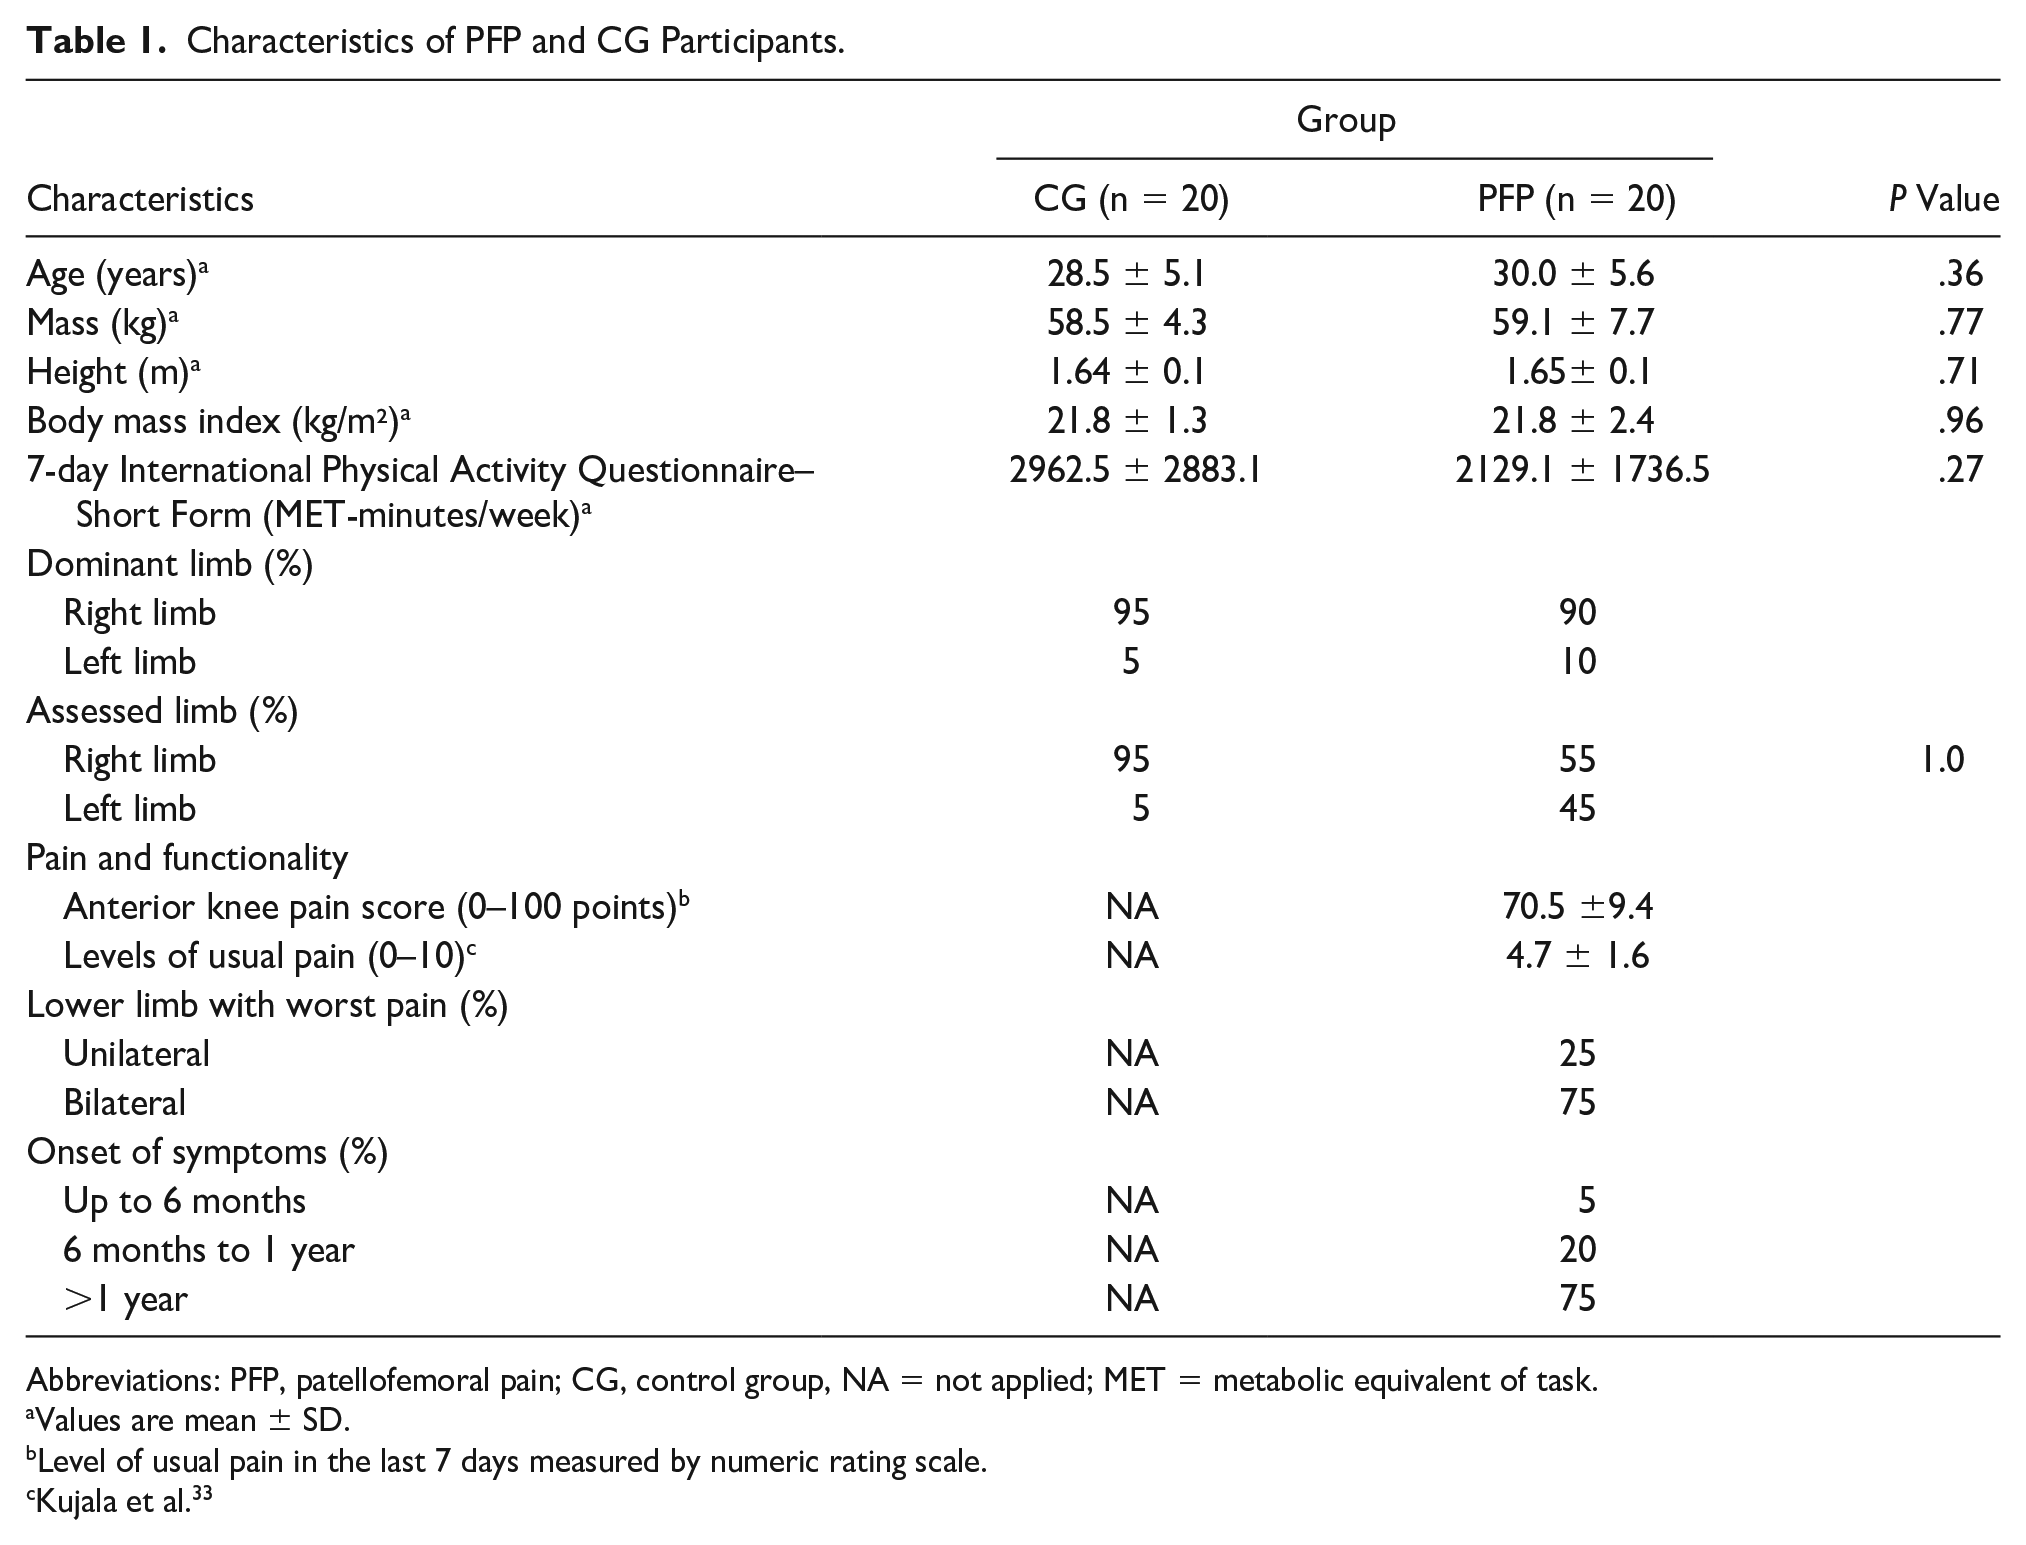
Abbreviations: PFP, patellofemoral pain; CG, control group, NA = not applied; MET = metabolic equivalent of task.
Values are mean ± SD.
Level of usual pain in the last 7 days measured by numeric rating scale.
Kujala et al. 33
Eligibility criteria
The CG group was composed of healthy women with similar characteristics (body mass, height, age, body mass index, physical activity level) as those of the PFP group, but with no pain symptoms at the knee joint and no history of lower limb injury. Also, CG subjects had no physical limitations at the lower limb that could affect the functionality during daily living activities or sports participation. A physiotherapist, with 6 years of clinical experience, evaluated PFP participants based on the following inclusion criteria: (1) self-report of peripatellar or retropatellar pain in at least two of the following situations: squatting, running, kneeling, jumping, climbing or descending stairs, sitting for a long time, and sitting with knees flexed; (2) present ongoing patellar pain for at least 3 months before the start of the study; (3) a minimum level of 3 out of a 10 in numeric rating scale for knee pain, where 0 and 10 correspond to “no” and “intolerable pain discomfort,” respectively; (4) beginning of PFP not related to trauma; (5) not participating in any PFP treatment in the last 12 months; and (6) testing positive for the patellar grind test (Clarke’s Sign, in which the patella is compressed against the trochlea manually while the clinician asks the patient to contract the quadriceps, and the test is positive if the patient reports pain). Participants were excluded from the PFP group if they presented signs or symptoms of (1) meniscal or other intra-articular pathologies; (2) signs of patellar apprehension; (3) history of hip, knee, or ankle joint injury; (4) evidence of joint effusion; and (5) history of patellofemoral joint surgery.
Procedures
CG and PFP group subjects were instructed to not participate in any vigorous activity 48 hours before the tests. As previous studies did not observe a significant difference in muscle morphology between the dominant and nondominant sides in healthy women or a group of healthy subjects (male/female),18,34 only the dominant limb (used to kick a ball) was evaluated in the CG. In PFP patients with unilateral pain, only the affected limb was assessed. In patients with bilateral pain, the evaluation was performed in the limb with the worst symptoms. PFP and CG were not matched based on dominance because only 32% of the subjects with unilateral PFP had symptoms in their dominant limb, 17 and there is a significant difference in muscle morphology between the affected and unaffected side in women with PFP.11,18 In addition, MT was negatively related to pain levels, 16 and it was expected that PFP subjects with bilateral symptoms would have significant muscle atrophy on the limb with the worst symptoms.
Before the US evaluations, the participants’ physical activity level was measured using the short form of the 7-day self-administered International Physical Activity Questionnaire (IPAQ). In addition, PFP participants were requested to complete the Kujala Questionnaire 33 for determining knee functionality level. This questionnaire has a functionality score (anterior knee pain score [AKPS]) ranging from 0 to 100, where the higher values indicated better functionality. Finally, a numeric rating scale was used to determine PFP participants’ knee pain level in the previous week.
US assessment
A B-mode ultrasound system (Logiq P6; GE Healthcare, Waukesha, Washington, USA) with a matrix linear-array probe (60 mm linear-array ML6-15, 5–15 MHz; GE Healthcare) was used for US measurements. A researcher with 7 years of experience with the musculoskeletal US performed all measurements and data analyses. The researcher who conducted the US assessments was not blinded to the clinical status of the subjects (PFP or CG). All US images were obtained in a relaxed condition, as previously described in the literature,35–37 on a single session (~ 60 minutes) after the subjects were laid down on a stretcher in a supine position for a period of 5–10 minutes to re-establish body fluids. 38
MT of the proximal (tensor fasciae latae [TFL], gluteus medius [GM], gluteus maximus [GMAX]), local (rectus femoris [RF], VM, VL, biceps femoris [BF]), and distal (peroneus longus and brevis [PLB], tibialis anterior [TA], gastrocnemius medialis [GMED], soleus [SOL], flexor digitorum longus [FDL], flexor digitorum brevis [FDB], flexor hallucis brevis [FHB] and abductor hallucis [ABH]) muscles to the knee joint was evaluated. Participants were laid down in the supine position with hip, knee, ankle, and foot at the neutral position for TFL, RF, VM, VL, TA, PLB, FLD, FDB, and ABH evaluations. For GM, participants were placed in the lateral position, with the hip in the neutral position. And for GMAX, BF, GMED, and SOL, subjects were placed in the prone position with hip, knee, and ankle in the neutral position. Additional information about probe position and representative US images of proximal muscles are presented in Figure 1, local muscles in Figure 2, and distal muscles in Figure 3.
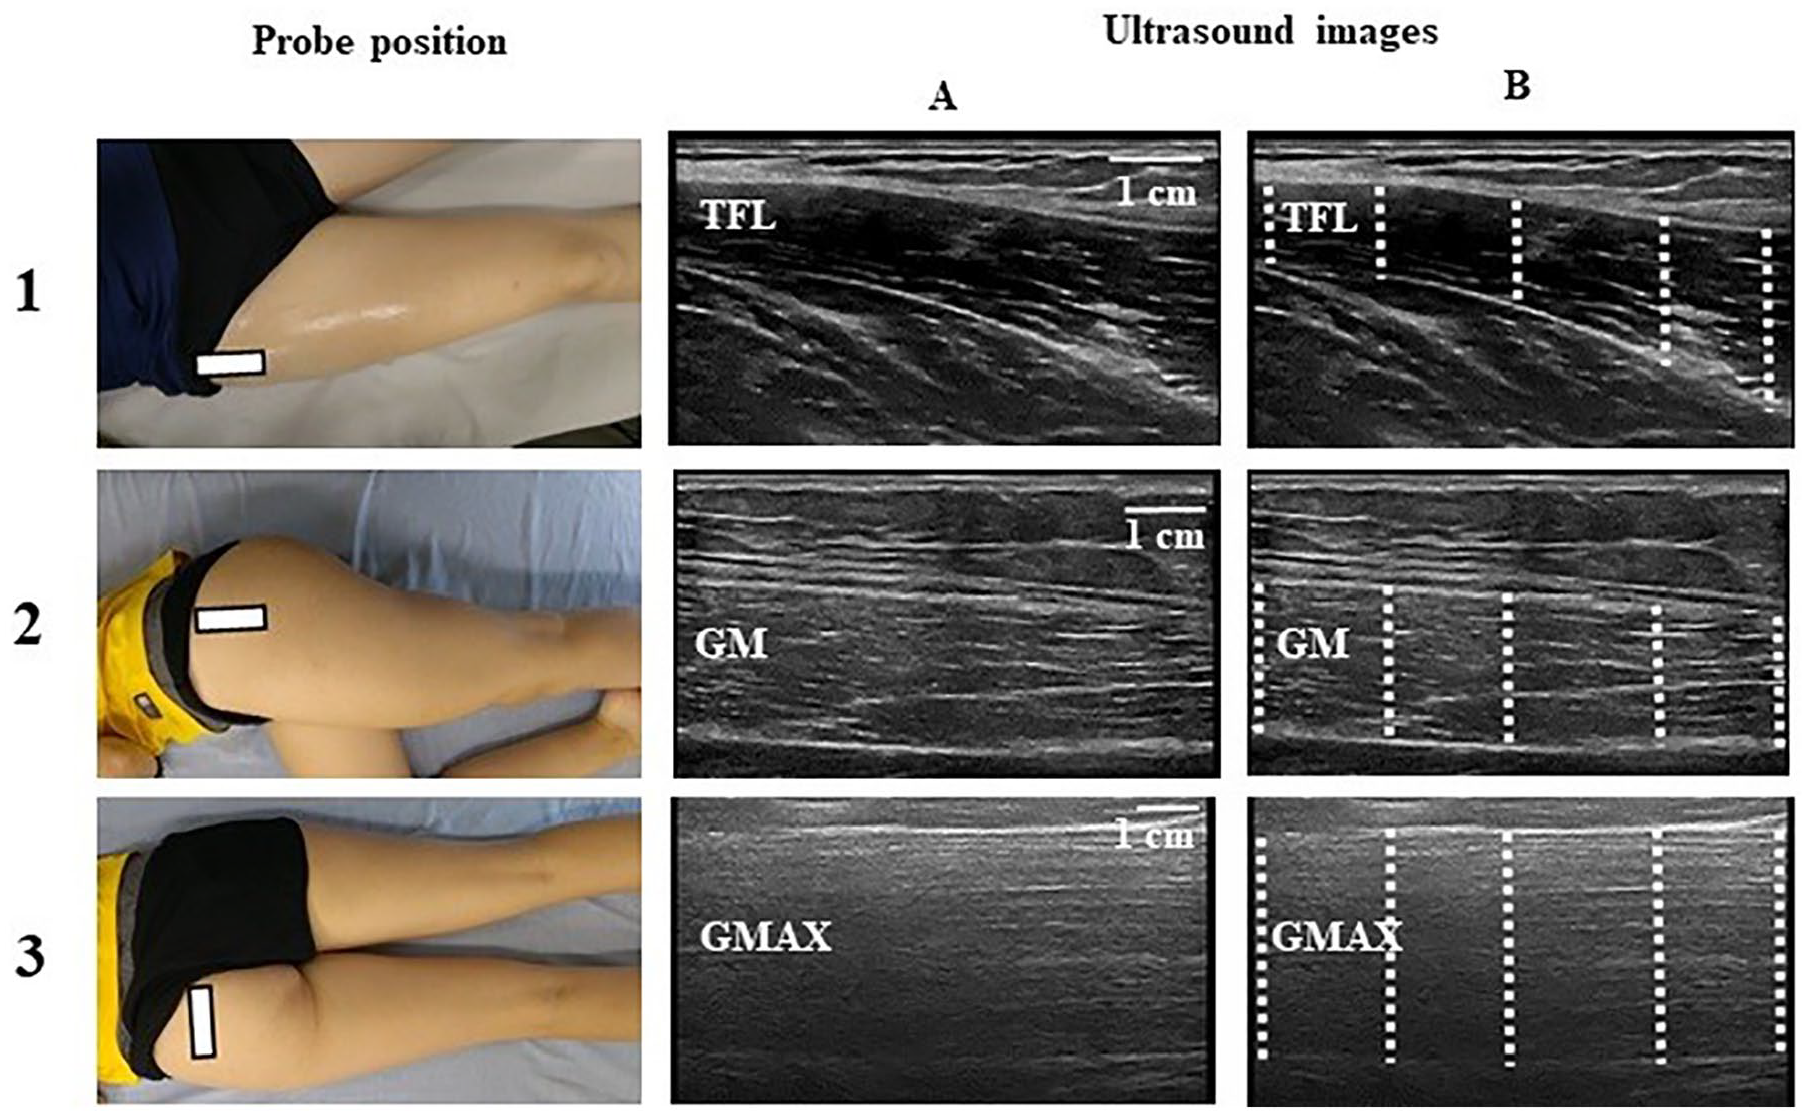
Proximal muscles to the knee joint, with probe position and representative examples of ultrasonographic images (A) and their respective MT assessment points (B). 1—tensor fascia latae (TFL), the transducer was placed in the axial plane over the anterior superior iliac spin; 2—gluteus medius (GM), the transducer was placed in the axial plane at the midway point between the proximal end of the iliac crest and the femur’s greater trochanter; 3—gluteus maximus (GMAX), the transducer was placed in the transversal plane at one-third of the distance between the posterior superior iliac spine and the greater trochanter. White rectangle represents the probe position, and dashed lines represent the MT assessment points. MT, muscle thickness.
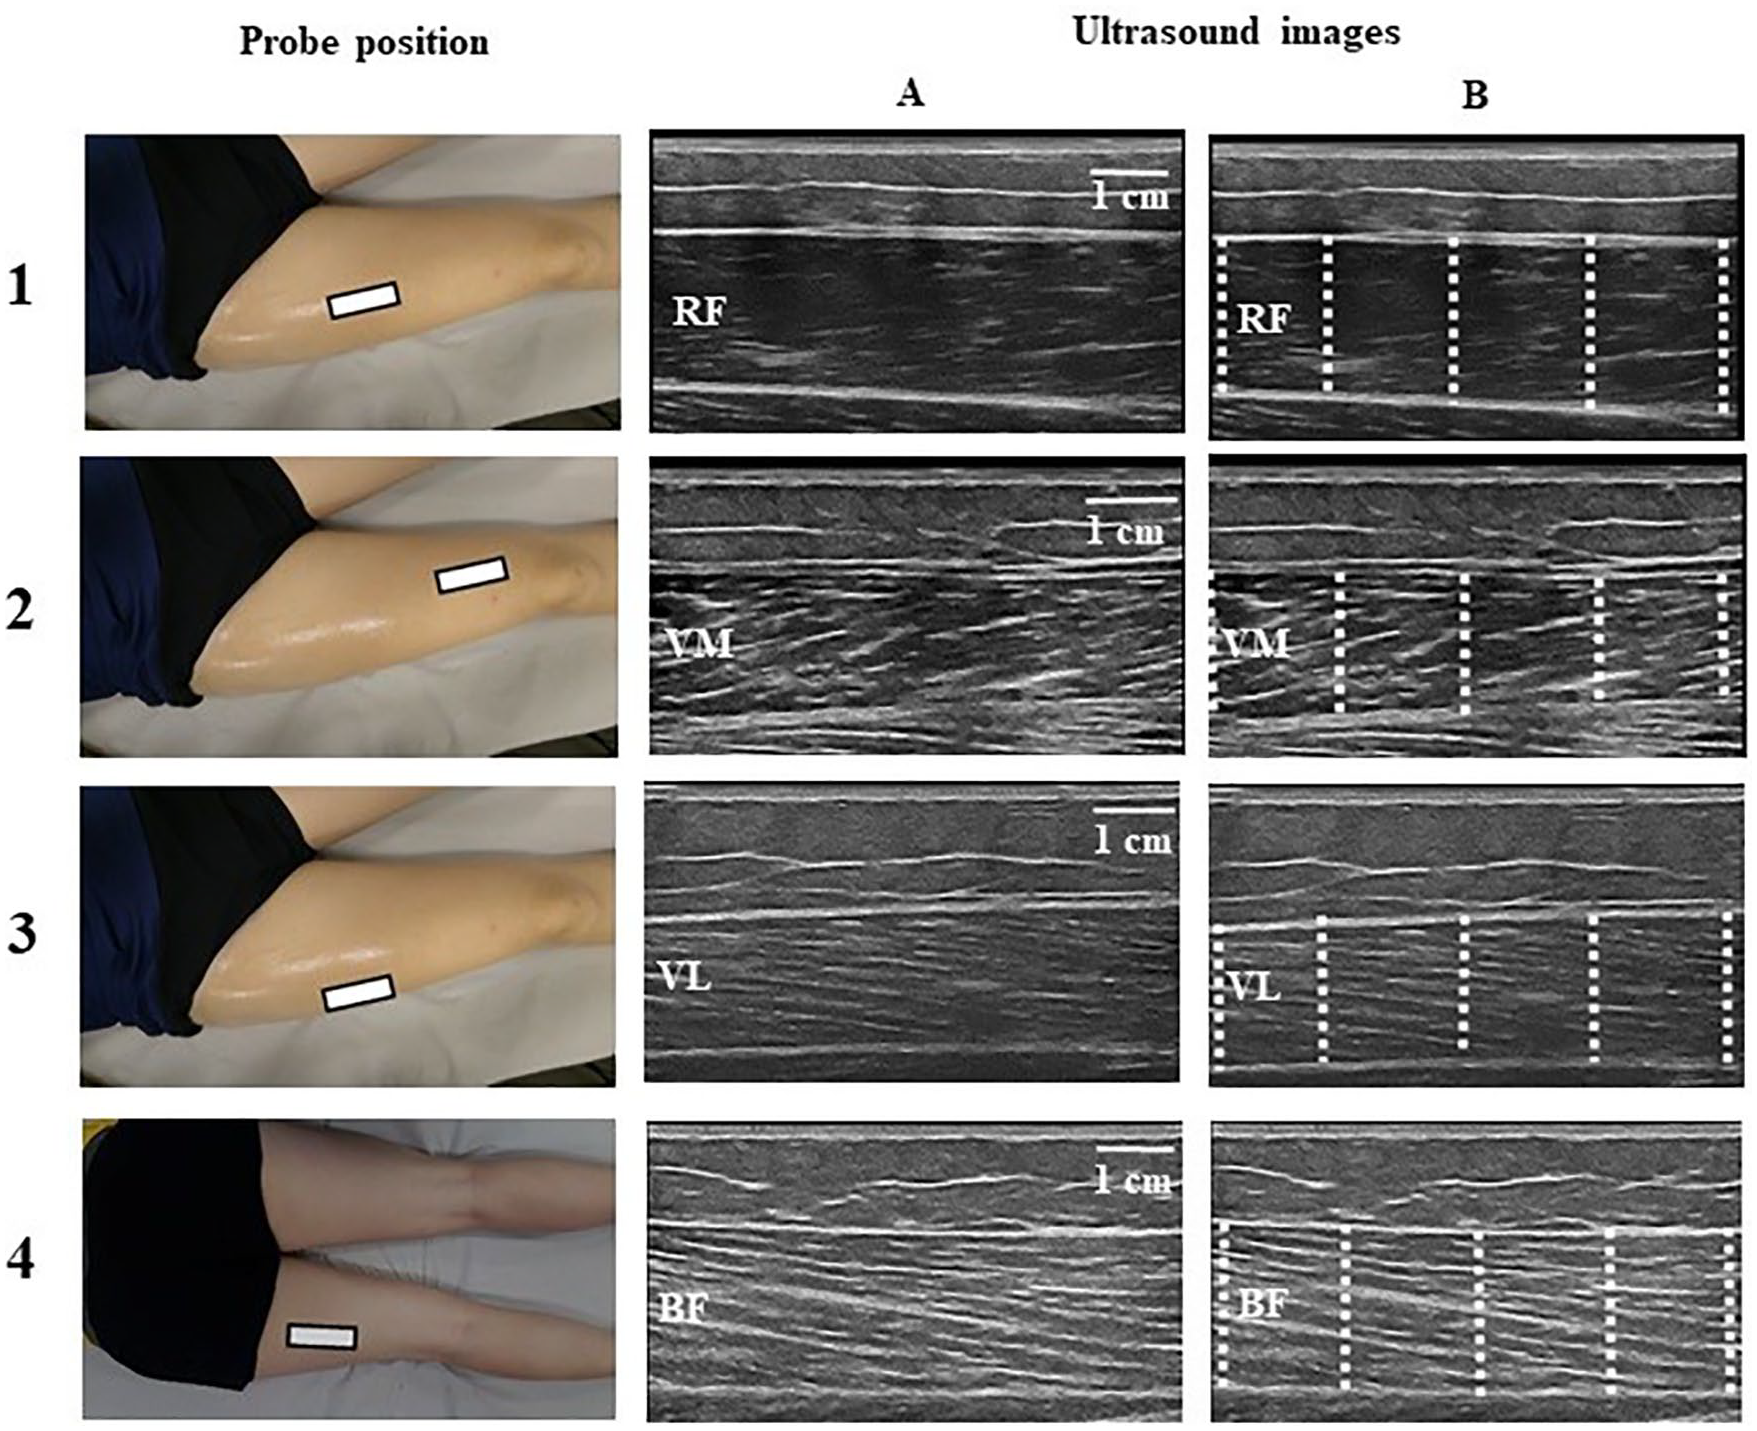
Local muscles to the knee joint, with probe position and representative examples of ultrasonographic images (A) and their respective MT assessment points (B). 1—rectus femoris (RF), the transducer was placed in the axial plane at the midway point between the great trochanter and the femur lateral condyle; 2—vastus medialis (VM), the transducer was placed in the axial plane at 25%–30% between the great trochanter and the femur lateral condyle; 3—vastus lateralis (VL), the transducer was placed in the axial plane at the midway point laterally to RF over VL between the great trochanter and the femur lateral condyle; 3—biceps femoris (BF), the transducer was placed in the axial plane at the midway point between ischial tuberosity and lateral condyle of the tibia. White rectangle represents the probe position, and dashed lines represent the MT assessment points. MT, muscle thickness.
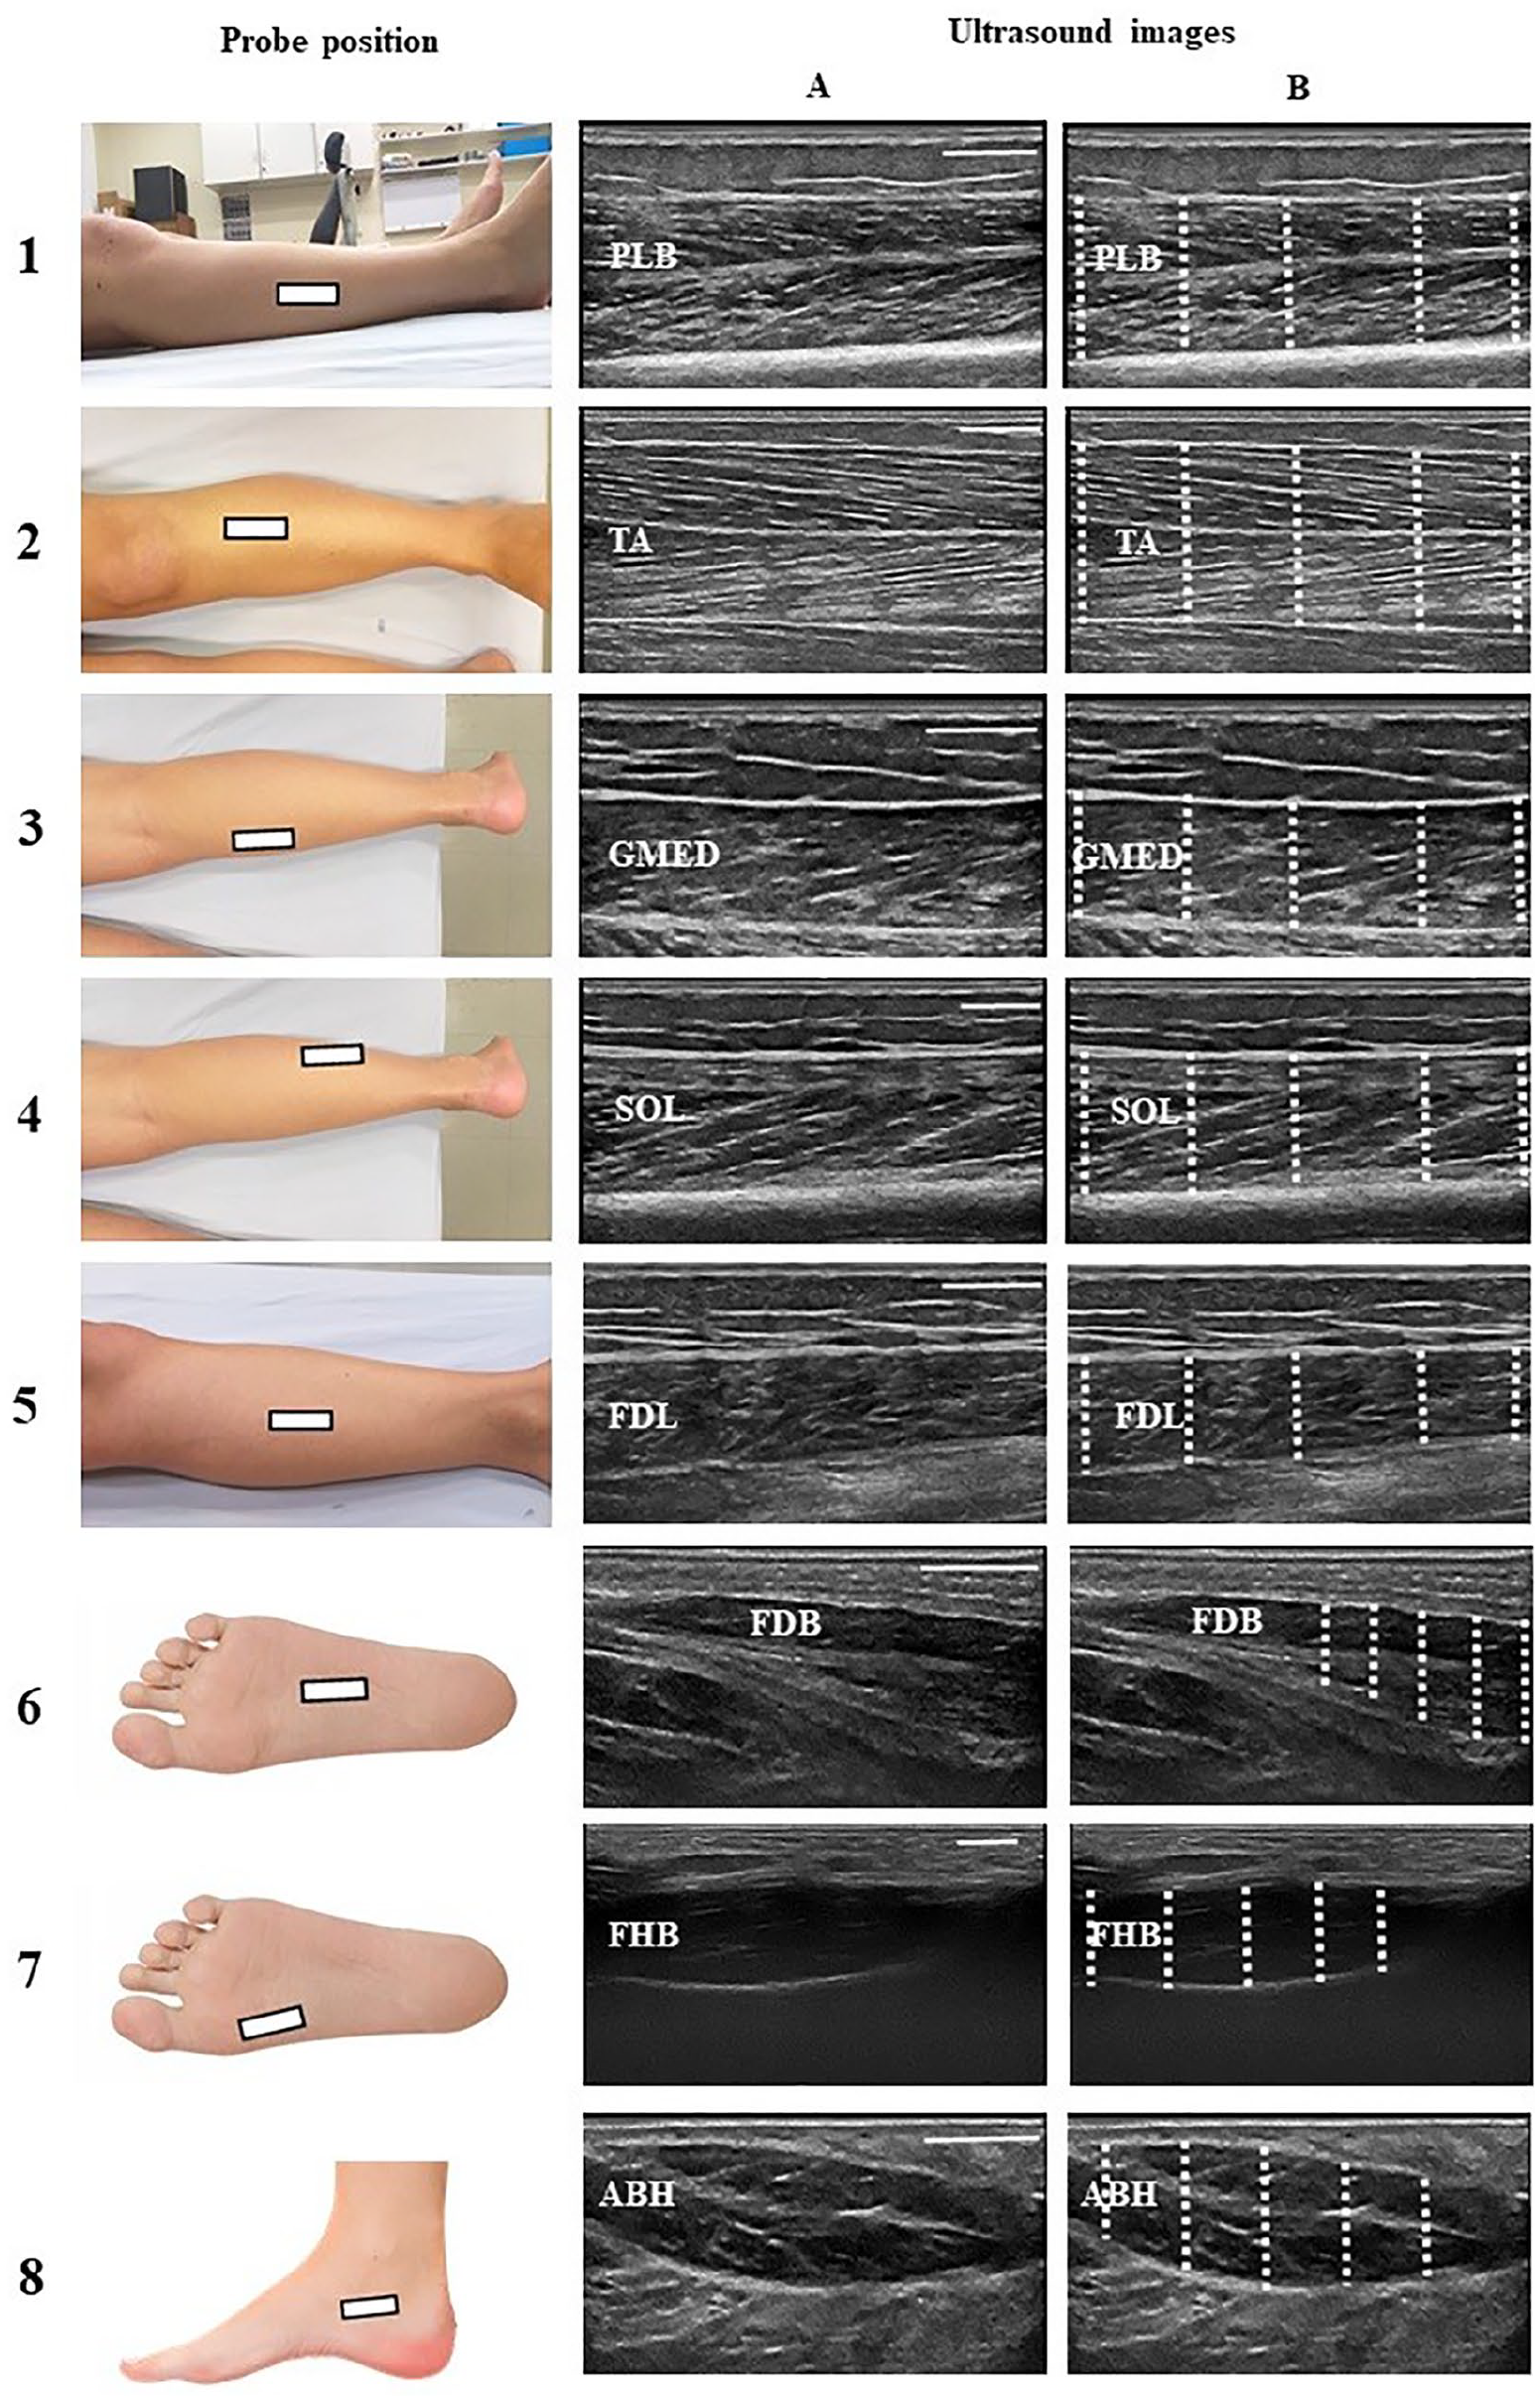
Distal muscles to the knee joint, with probe position and representative examples of ultrasonographic images (A) and their respective MT assessment points (B). 1—peroneus longus and brevis (PLB), the transducer was placed in the axial plane at the midway point (50%) between the fibular head and the lateral malleolus’ inferior border; 2—iibialis anterior (TA), the transducer was placed proximally in the axial plane, at 30% of the line between the fibula’s lateral malleolus and the femur’s condyle; 3—gastrocnemius medialis (GMED), the transducer was placed in the axial plane over the medial gastrocnemius head at 30% proximally between the popliteal crease and the lateral malleolus; 4—soleus (SOL), the transducer was placed in the axial plane at the midway point between the popliteal crease and the lateral malleolus; 5—flexor digitorum longus (FDL), the transducer was placed in the axial plane at the midway point between the medial tibial plateau and the medial malleolus’ inferior border; 6—flexor digitorum brevis (FDB), the transducer was placed perpendicular to a line from the calcaneus medial tubercle to the third toe; 7—flexor hallucis brevis (FHB), the transducer was placed perpendicular to a line parallel to the muscle; 8—abbductor hallucis (ABH), the transducer was placed along a line perpendicular to the long axis of the foot at the anterior aspect of the medial malleolus. White rectangle represents the probe position, and dashed lines represent the MT assessment points. MT, muscle thickness.
Muscle mass was obtained for different lower limb regions by summing the MTs from synergistic muscles (i.e., with similar function) in these regions.17,35,36 Therefore, hip posterolateral muscle mass was obtained from GM and GMAX; quadriceps mass was obtained from RF, VM, and VL; plantar flexor muscle mass was obtained from GMED and SOL; and foot muscle mass was obtained from FDB, FHB, and ABH.
Mean values were obtained from three US images for each muscle to determine MT. US images were analyzed using ImageJ software (National Institutes of Health, USA) according to the procedures previously described. 35 MT was considered the distance between deep and superficial aponeuroses and was calculated through the mean value of five parallel lines drawn at right angles between the superficial and deep aponeuroses along each US image (Figures 1–3). Reliability analysis was conducted by having the same analyst reanalyze the images in the same manner with an interval of 7–10 days after the first analysis.
Statistical Analysis
All statistical tests were performed with SPSS (version 22.0; SPSS Inc., Chicago, IL, USA). Shapiro-Wilk tests were used to verify data normality. An independent t-test or a Mann-Whitney U test was used to compare groups for age, anthropometric characteristics, physical activity level, and study outcomes. Fisher’s exact test was used to test the difference in the assessed limb sides between the groups. The between-groups ES were calculated through Cohen’s d and classified as trivial (<0.2), small (>0.2), moderate (>0.5), large (>0.8), or very large (>1.3). 39
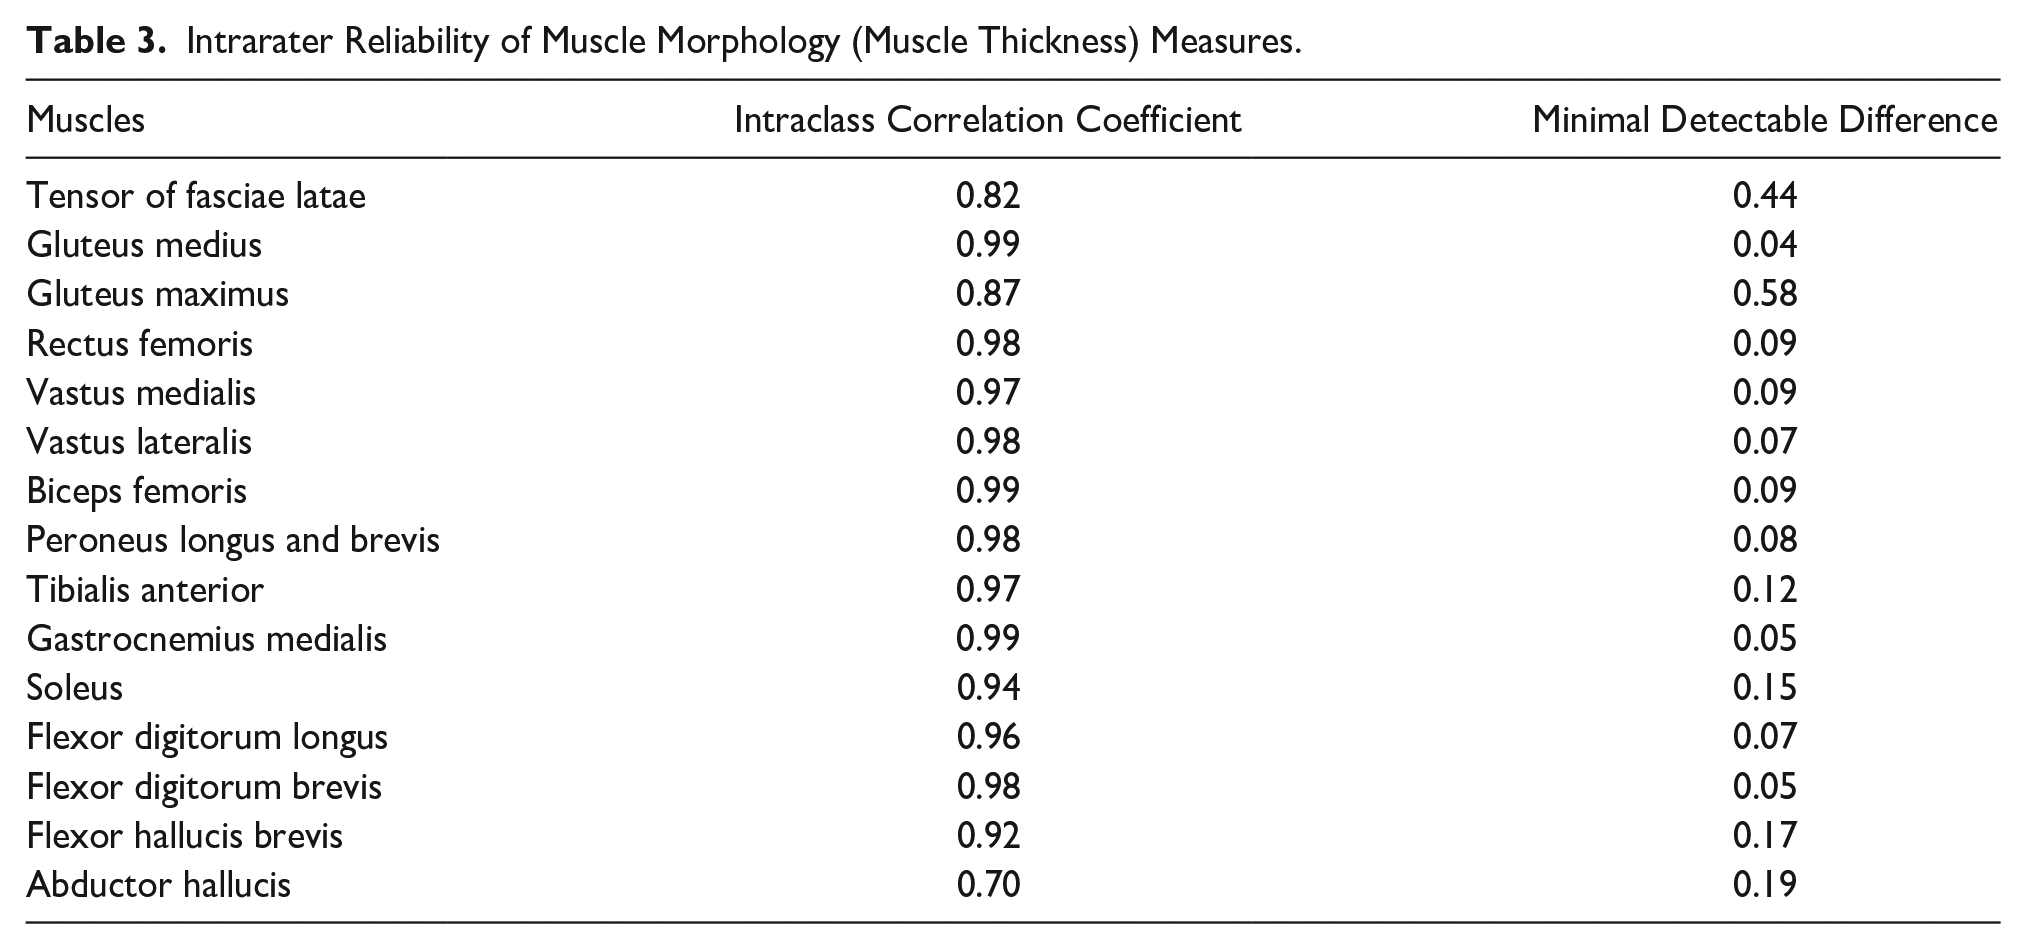
An intraclass correlation coefficient (ICC) was applied to verify the intra-rater reliability in 10 participants (5 PFP group and 5 CG). The participants’ selection for the reliability analysis was random. ICC values were classified as indicating no reliability for values between 0.00 and 0.25, poor reliability for values between 0.26 and 0.49, moderate reliability for values between 0.50 and 0.69, high reliability for values between 0.70 and 0.89, and very high reliability for values between 0.90 and 1.00.
40
The minimum detectable difference (MDD) was also used to define the smallest difference that can be detected, which is not due to chance or systematic error. The MDD was calculated using the following equation:
Results
PFP and CG participants were similar in age, anthropometric characteristics, and physical activity level (Table 1). The PFP group’s AKPS self-reported function was 70.5 points, the usual pain level was 4.7, and 95% of the patients had onset of symptoms at least 6 months prior to the tests (Table 1). Eleven (55%) participants in the PFP group had pain symptoms or the worst symptoms in their dominant limb, and 55% of patients with PFP had the right side assessed. In CG, 95% of participants had the right side assessed.
Except for BF MT’s between-groups comparison, all analyses were made with an independent t-test. The MT of GM (−13.4%), VM (−15%), and FDB (−23.5%) was smaller in the PFP group compared to CG, with moderate to large ES (range: 0.7–1.0) (Table 2), while the MT of GMED was greater (9.8%) in the PFP group compared to CG, with moderated ES (0.6).
Comparison of Lower Limb Muscle Thickness (in cm) Between the PFP Group and Control Group.
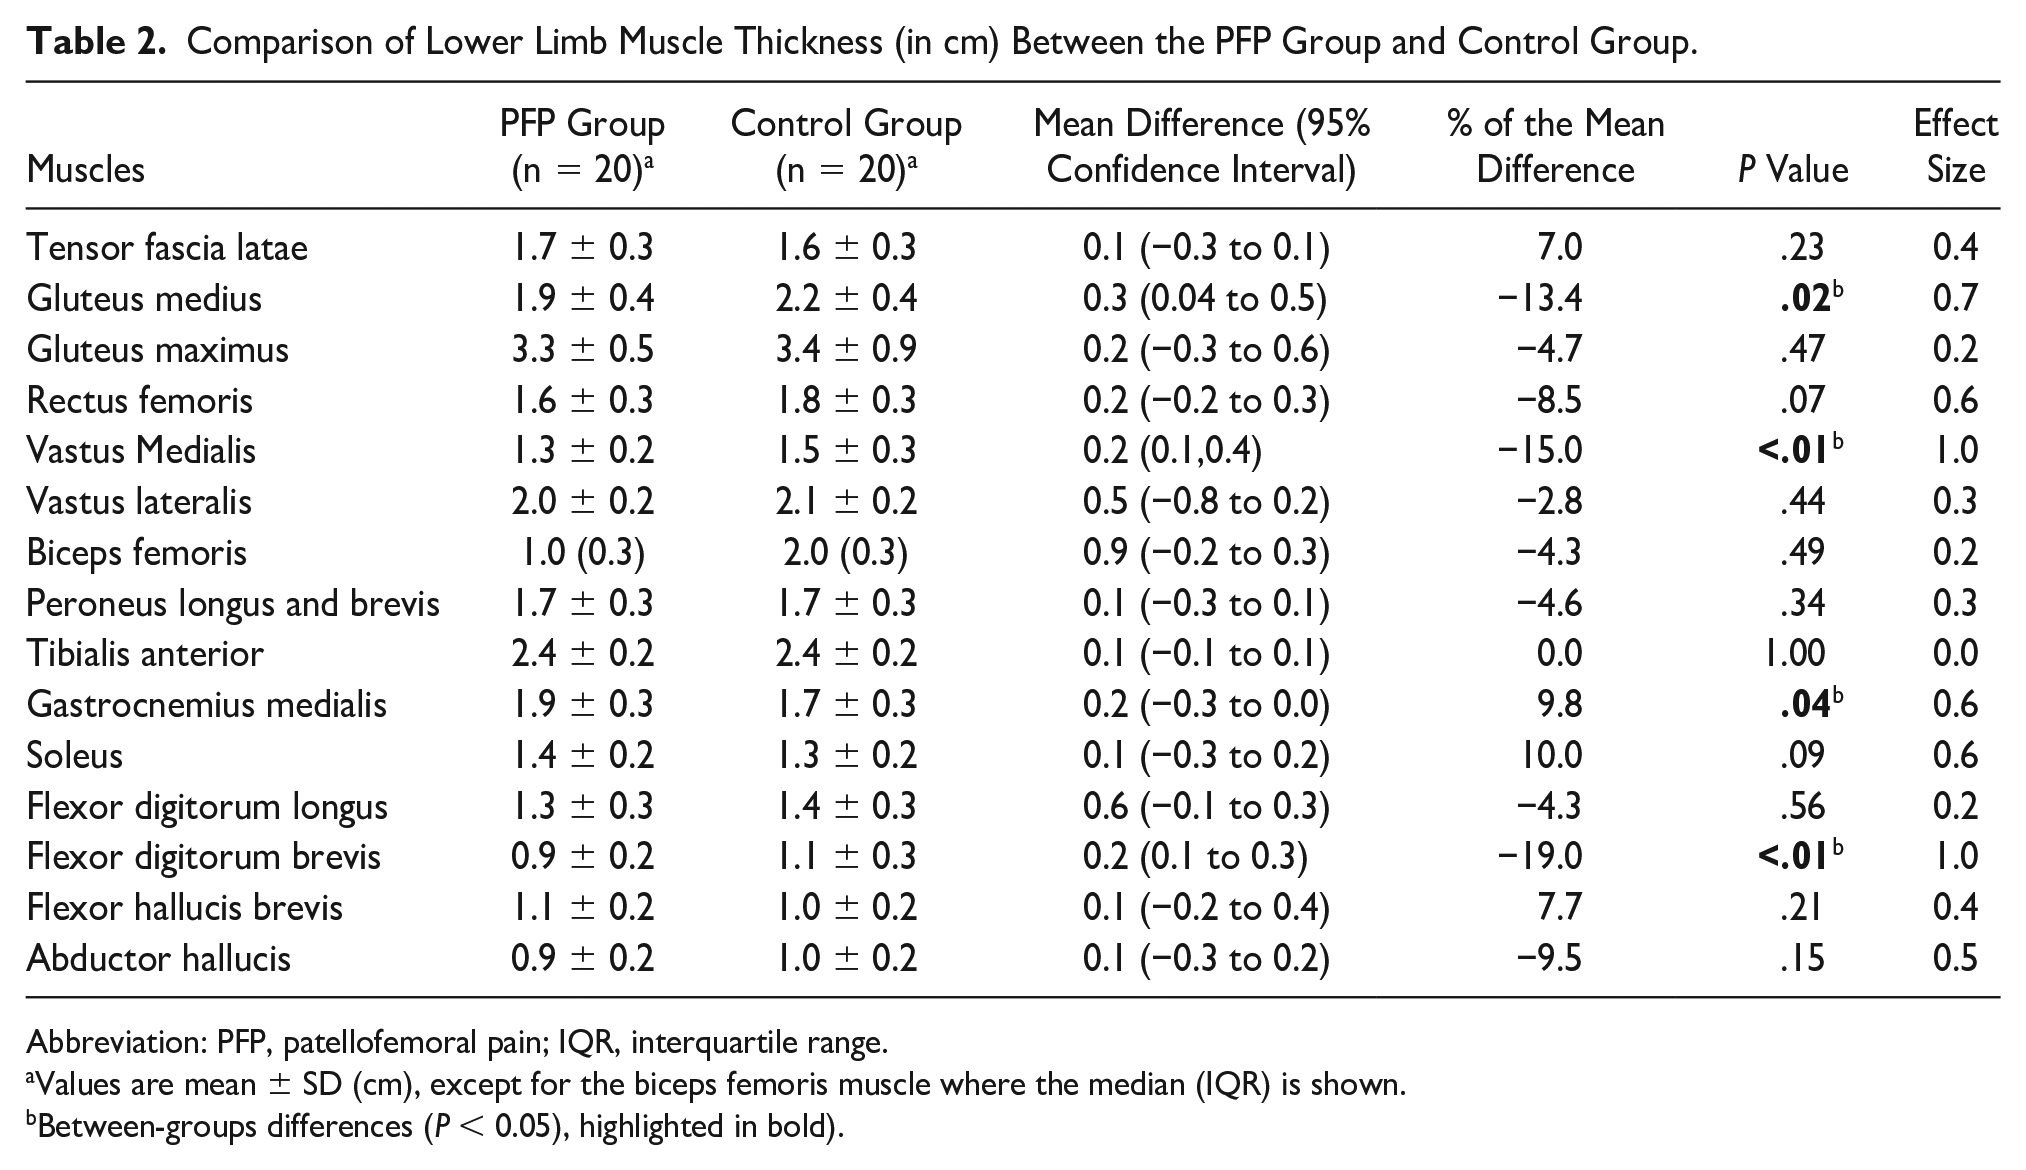
Abbreviation: PFP, patellofemoral pain; IQR, interquartile range.
Values are mean ± SD (cm), except for the biceps femoris muscle where the median (IQR) is shown.
Between-groups differences (P < 0.05), highlighted in bold).
Overall, high to very high intra-rater reliability values were found for all measurements (ICC range: 0.70–0.99; Table 3). In addition, for the outcomes with significant between-groups difference values, all mean differences were greater than the measurements’ MDD values.
Intrarater Reliability of Muscle Morphology (Muscle Thickness) Measures.
Quadriceps muscle mass (−9%) and foot muscle mass (−12.3%) were lower in the PFP group than in CG, with moderated to large ES (range: 0.7–0.9; Table 4), while plantar muscle mass was greater in the PFP group compared to CG (6.7%), with large ES (0.8).
Comparison of Muscle Mass (in cm) Between CG and the PFP Group for Different Evaluated Regions.
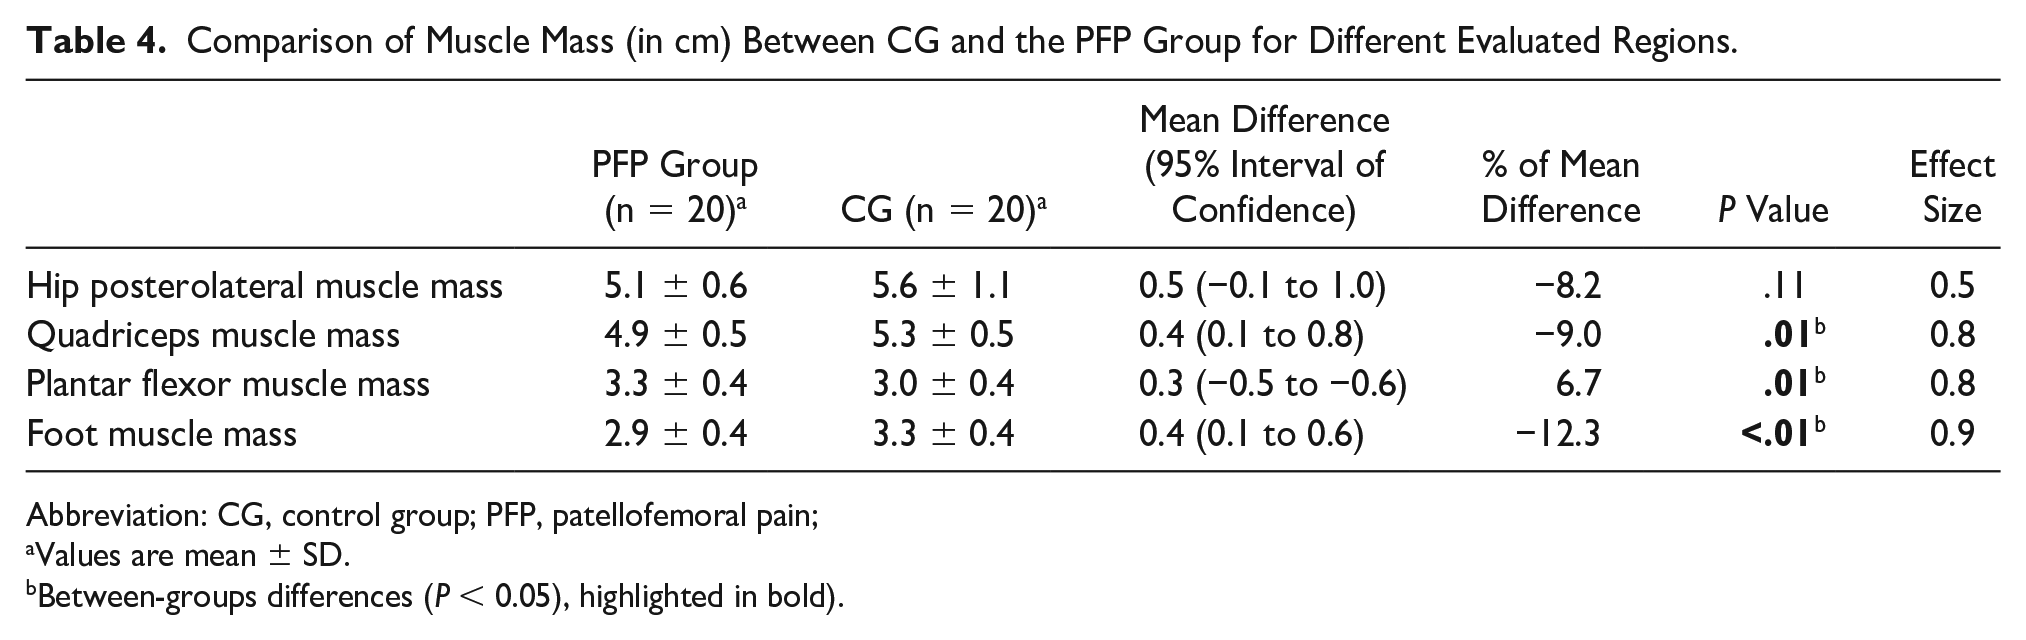
Abbreviation: CG, control group; PFP, patellofemoral pain;
Values are mean ± SD.
Between-groups differences (P < 0.05), highlighted in bold).
Discussion
The main findings of this study are that young women with PFP have simultaneous alterations in MT at the hip (proximal factor), knee (local factor), and ankle/foot (distal factor) in comparison with women without PFP, showing evidence that PFP is a complex and multifactorial clinical problem that should be treated more globally (i.e., proximally, locally, and distally to the knee). More specifically, as expected, we observed a lower MT of GM (−13.4%), VM (−15%), and FDB (−23.5%), as well as lower quadriceps muscle mass (−9%) and foot muscle mass (−12.3%) in the PFP group compared to CG. However, contrary to the preliminary hypothesis, the PFP group showed a higher MT of GMED (9.8%) and higher plantar flexor muscle mass (6.7%) than CG.
The MT of GM reduced (−13.4%) in patients with PFP in comparison with healthy subjects. Previous studies that analyzed GM’s MT in patients with PFP did not observe significant alterations compared to healthy subjects.23,24 Methodological differences in sample characteristics and the number of measurement points used to determine MT may explain the between-studies controversial findings. Previous meta-analyses observed that reduced hip abduction strength is associated with dynamic knee valgus during single-leg squat tasks. 41 This dynamic knee valgus may be the result of femoral adduction (relative to the pelvis), tibial abduction (relative to the femur), or the combination of both during weight-bearing activities.42,43 Also, dynamic knee valgus is positively associated with knee pain severity. 44 The lower MT of GM observed in this study, combined with delayed and shorter duration of GM’s activation, 45 indicates that structural and neural deficits in women with PFP may explain the hip abductors’ weakness observed in PFP, thereby explaining the dynamic knee valgus described in previous studies. In addition, a hip-abductor muscle-strengthening protocol has been shown to be effective in decreasing knee pain. 46 Similarly, a 20% increase in hip abductor strength (normalized to body weight) resulted in a 4.3° improvement in knee valgus, 47 which has been reported as the difference in hip adduction angle between women with and without PFP. 12 Thus, effective interventions with a focus on hip muscle strengthening, with special attention to GM actions, are necessary to optimize the lower limb alignment and to decrease pain in patients with PFP.
Contrary to a previous study, 17 this study’s results showed significant quadriceps muscle atrophy due to the lower mass (9%) in the PFP group compared to healthy subjects. Methodological differences in sample characteristics and the number of quadriceps’ MT components added as representative of quadriceps muscle mass may explain the between-studies controversial findings. Giles et al 17 observed that all portions of the quadriceps muscle are reduced in patients with unilateral PFP in comparison with the asymptomatic limb, but not when compared with individuals without PFP. Conversely, this study observed smaller quadriceps muscle mass (−9%) and selective atrophy of the VM (−15%) in women with PFP in comparison with healthy women. This study’s results suggest that intervention programs should focus on knee extensor muscle training, with special attention to VM during rehabilitation.
To the best of the researcher’s knowledge, this is the first study to evaluate the plantar flexor muscle morphology in women with PFP in comparison with healthy women. Contrary to expectations, patients with PFP showed higher GMED’s MT (9.8%) and plantar flexor muscle mass (8.2%) compared to CG. The greater GMED’s MT and plantar flexor muscle mass, and the smaller plantar flexion flexibility observed in patients with PFP, 48 may explain the lower ankle dorsiflexion range of motion previously observed in patients with PFP. 49 The reduction in ankle dorsiflexion range of motion is associated with the increase in hip and knee movements in the frontal and transverse planes and with knee mobility reduction.50–52 In addition, a previous study observed that individuals with excessive dynamic knee valgus showed greater GMED activation during a squatting task. 53 This greater GMED activation can lead to a thicker GMED, which in turn can be a mechanism to reduce the mechanical demand over the knee extensors and the patellofemoral compression during weight-bearing activities of the lower limbs when a greater contribution of the plantar flexors occurs. 54
The extrinsic and intrinsic foot muscles provide specific contributions for supporting the foot’s medial longitudinal arch 55 and, consequently, for the maintenance of the neutral foot joints’ alignment. The fact that FDB was the only foot muscle with significant MT reduction (−23.5%) in the PFP group may be due to its anatomic and biomechanical characteristics. While FDL seems to be required to create greater supination moments at the ankle joint, FHB and ABH are directly related to the hallux’s function, and their proximity to the medial foot arch may require them to work in the maintenance of the medial longitudinal arch. Their higher mechanical demands during foot function may explain why there was no between-groups difference in their MTs 37 compared to the FDB’s lower MT. Interestingly, FDB’s activation has a significant influence on calcaneal eversion, calcaneal abduction, and metatarsal adduction. 28 Therefore, FDB’s lower MT may determine alterations in foot alignment (e.g., pronated foot) and the excessive calcaneal eversion previously observed in patients with PFP.56,57 Thus, as previously suggested in the literature, 58 a distal strengthening program focused on foot muscle actions should be considered in PFP rehabilitation programs.
The novelty of this study was that women with PFP have simultaneous alterations in muscle morphology at the hip (proximal factor), knee (local factor), and ankle/foot (distal factor) joints. However, some limitations should be taken into account when interpreting and applying this study results to clinical practice. First, the sample was composed exclusively of young women, which limits the extrapolation of the results to other groups (e.g., men, elderly) than young adult women with PFP. Although sex is not a risk factor for future development of PFP, 31 women were chosen because they are 2.2 times more likely to develop PFP compared to men. 6 Also, women demonstrated greater hip adduction compared to men with PFP during running and squatting, and therefore kinematics due to squatting and running are different between the sexes. 59 In addition, women with PFP have lower GM activation than healthy women, which may be related to their above-mentioned greater hip adduction. As such difference was not observed between men with and without PFP, 12 activation differences between sexes may also change the desired outcomes. Taken altogether, these results demonstrate that men and women with PFP present different neuromechanical alterations, which is a confounding factor in a mixed sample. Therefore, evaluation of muscle morphology was completed first in women because of their higher PFP incidence and to avoid confounding factors determined by intrinsic sex neuromechanical differences. Second, images of all muscles were collected in a relaxed condition, which limits the extrapolation to contracted situations in which MT may change in different ways among the different muscles due to intrinsic architecture. However, despite the information that MT may slightly increase during muscle contraction, it is expected that changes in US images from the contracted to the relaxed conditions will probably maintain the same pattern observed for the relaxed state, which probably will not change the observed results. Third, the differences in dominance between the two groups might have contributed to the differences in the outcomes. More specifically, while in the PFP group 55% of the analyzed lower limbs were dominant limbs, in CG only the dominant limb was analyzed. Lower muscle mass was observed in the PFP symptomatic limb,11,18 demonstrating higher atrophy than the asymptomatic one. However, muscle morphology was similar between sides in healthy subjects (male/female),18,34 and therefore the evaluation of only the dominant limb probably did not interfere with the results. Fourth, the researchers were not blinded to the subjects’ condition (PFP or healthy), which may bring some bias to the results. However, all the methodological steps were carefully applied and similar among all the subjects, and therefore there was likely little or no interference in the obtained results. Finally, due to being a cross-sectional study, the findings cannot be pointed out as being the cause or effect of PFP in women. Further prospective studies are necessary with additional/different populations (i.e., men, older adults), based on the sex differences in kinematic alterations observed in patients with PFP 59 and different contractile conditions (i.e., relaxed and contracted) 16 to clarify whether muscle morphological alterations are the cause or the effect of PFP.
Conclusion
Women with PFP have proximal, local, and distal muscle morphological alterations in comparison with healthy women without PFP, which may explain possible changes in muscle strength and functionality. Future PFP treatment intervention programs should focus not only on strengthening the quadriceps muscle but also on proximal and distal muscles to the knee joint when rehabilitating patients due to this complex multifactorial orthopedic disease.
Footnotes
Acknowledgements
The authors thank CAPES and CNPq-Brazil for their financial support.
Ethics Approval
This study was approved by the University’s Ethics Committee for Human Research (Protocol no. 2.089.328).
Informed Consent
Written informed consent was obtained from all subjects before the study.
Animal Welfare
Guidelines for humane animal treatment did not apply to the present study because only humans were evaluated in our study.
Declaration of Conflicting Interests
The authors declared no potential conflicts of interest with respect to the research, authorship, and/or publication of this article.
Trial Registration
This work was prospectively registered on Clinical Trials (no. NCT03663595).
Funding
The authors disclosed receipt of the following financial support for the research, authorship, and/or publication of this article: This study was financed in part by the Coordenação de Aperfeiçoamento de Pessoal de Nível Superior—Brasil (CAPES)—Finance Code 001, with PhD scholarships granted for KDP and ESR. M.A.V. is a recipient of a CNPq research productivity grant (Nr. 311421/2016-4).