
Abstract
Obesity has been linked to several chronic health conditions, including increased risk for cardiovascular disease, type 2 diabetes, some cancers, and metabolic syndrome. Understanding the trends in metabolic syndrome and examining those who are at an increased risk for metabolic conditions is paramount. Currently body mass index (BMI), waist circumference (WC), and dual-energy X-ray absorptiometry (DXA) are believed to be appropriate screening measures for assessing body composition and metabolic syndrome risk. This approach uses diagnostic medical sonography (DMS) as a tool for assessing abdominal adiposity in hopes of this methodology being adopted to help determine an individual’s risk for metabolic conditions. A convenience sample of overweight and obese cancer survivors provided several anthropometric measures as well as imaging data to determine if sonographic measures of abdominal fat could be assessed longitudinally. These measures were then compared to corresponding measures of BMI, WC, and DXA (android percent body fat, subscores). These measures demonstrated moderately positive association and were statistically significant. DMS is an indirect imaging tool that could be used in correlation with other measures to help determine an individual’s risk for metabolic syndrome.
Keywords
Approximately 93 million adults and over 13 million children and adolescents across the United States are considered overweight or obese. 1 Health care expenditures are shown to be 81% greater in obese adults versus those of normal weight.2,3 The prevalence of type 2 diabetes and hypertension has steadily increased in the United States, with metabolic syndrome rates estimated at more than 30%. 4 Due to the increased risk for metabolic conditions in America’s obese populations, identifying patients at risk with a reliable and practical tool is vital to providing preventive health measures. Given the link between abdominal adiposity and metabolic syndrome, determining an individual’s risk for disease by measuring abdominal adiposity is greatly needed.
The use of diagnostic medical sonography (DMS) has been shown to be a reliable and easily accessible tool when measuring abdominal adiposity. 5 DMS is an indirect imaging tool that could be used in correlation with other measures to help determine an individual’s risk for metabolic syndrome. The value of DMS for gauging abdominal obesity and the risk for metabolic disease is that it is relatively inexpensive, noninvasive, and a validated indirect assessment tool. DMS has the ability to measure increased abdominal adiposity and monitor changes in body composition. 5 The use of DMS could be a more feasible and advantageous tool for routine clinical examinations due to its portability compared to large and immobile imaging methods such as dual-energy X-ray absorptiometry (DXA), computed tomography (CT), and magnetic resonance imaging (MRI). DMS provides a nonionizing imaging method that is performed at levels that do not cause increased risk of bioeffects. 5 This approach uses DMS as a tool for assessing abdominal adiposity to demonstrate the utility of this method in quantifying an individual’s risk for metabolic conditions. The current study is a continuation of previous research that used this convenience sample of cancer survivors. Baseline measures were analyzed to assess for statistically significant associations between imaging and anthropometric measures and compare intrarater and interrater reliability of DMS measures. 6 The current study utilizes the methodology used previously to longitudinally assess changes in body composition over time using sonographic measures and comparing them to current “gold standards” (body mass index [BMI] and DXA). By investigating the accuracy, reproducibility, and efficiency of sonographic adipose measures, this study constructs the framework for an alternative approach to help determine an individual’s risk for metabolic conditions.
Method
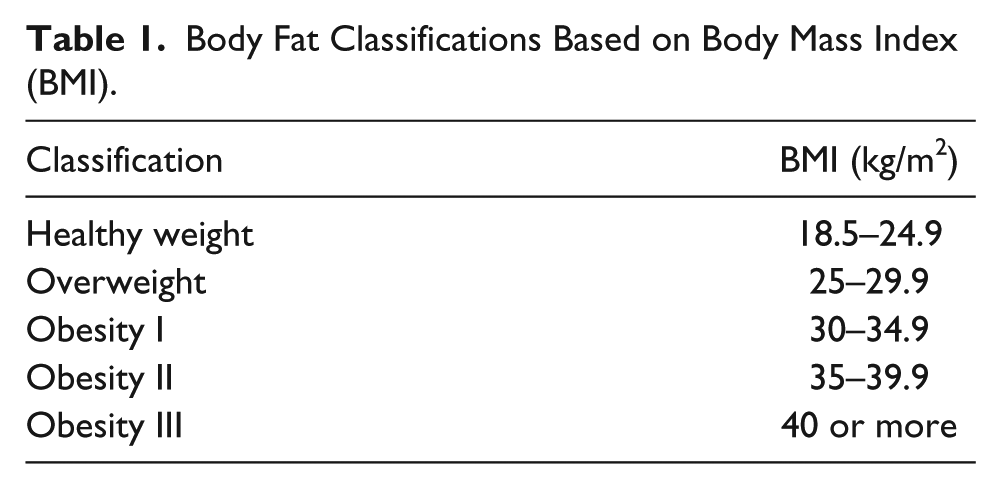
Eighty obese cancer survivors (4 men and 76 women) were recruited to participate in the study. All participants were known cancer survivors who had not received any active treatment for the preceding two years and met the criteria for overweight or obesity, based on BMI measurements (see Table 1). These participants were a part of a program designed to increase healthy lifestyle choices with the potential outcome of weight loss. Participants were asked to report to a sponsored clinical research center for measurements at baseline (month 0), 6 months following baseline measures (month 6), and 12 months following baseline measures (month 12). During each visit, participants underwent several, identical, standard body composition measurements. In addition, each participant had DMS and DXA imaging at each visit.
Body Fat Classifications Based on Body Mass Index (BMI).
Anthropometric Data
Height and weight were measured and used to calculate BMI by the following formula 1 :

See Table 1. Waist circumference was measured at the superior border of the iliac crest. This measurement was conducted three times and averaged by the same registered dietitian across all three visits. DMS and DXA measures were performed concurrently at each visit.
DMS was performed by a trained sonographer using a GE logiq 9 (GE, Milwaukee, Wisconsin) ultrasound machine with a 9.0-MHz (6–8 MHz) linear transducer for participant baseline measurements. For visits 2 and 3, DMS was performed using a GE logiq i ultrasound machine with a 9.0-MHz (6–8 MHz) linear transducer. No differences in measurements were found across equipment. The protocol for scanning visceral and subcutaneous fat was obtained by using methods outlined in previous literature by Stigall et al. 6 and Woldemariam et al. 7 These methods included DMS postexamination measurements taken at the xiphoid, umbilicus, and the waist. Subcutaneous minimum fat and visceral fat maximum were measured at the level of the xiphoid. Subcutaneous fat maximum and visceral fat minimum were measured at the level of the umbilicus. Mesenteric fat thickness was measured at the level of the waist (Figure 1). All DMS image collection and analyses were completed by a credentialed sonographer.
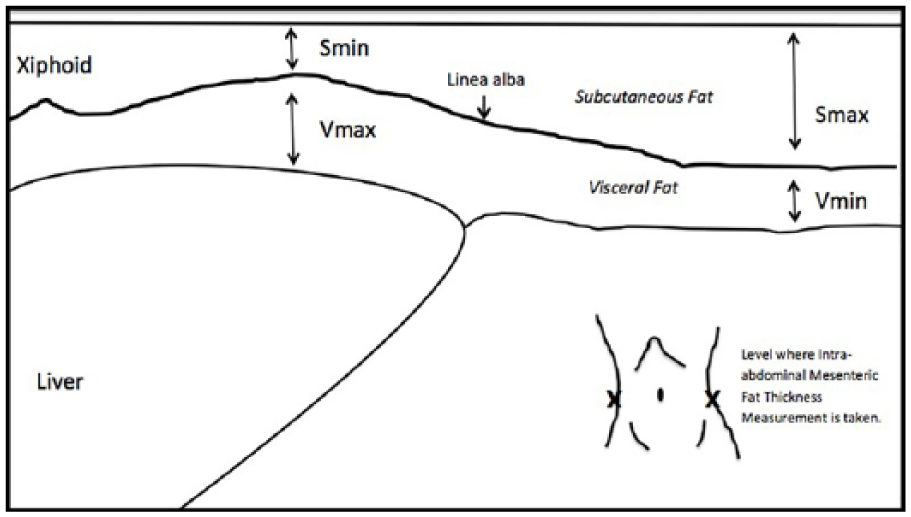
Diagram demonstrating the location of where sonographic measures are taken.
The DXA body composition protocol used was adopted by using methods outlined in previous literature by Stigall et al. 6 Percent body fat (% BF) was quantified using a GE Lunar iDXA. All images and equipment were operated by a trained registered nurse. The android subscore of percent body fat (% BF), which consists of the area between the ribs and the pelvis, 8 was chosen as the appropriate metric for comparison to DMS as it fully encompasses the abdominal region.
Data Analysis
Statistical analyses were performed by a biostatistician using SAS (version 9.4; SAS Institute, Cary, North Carolina). The associations of variables were determined by using trend graphs and Pearson correlation coefficients. The statistical power was set a priori at P < .05. Each participant’s body composition measurements were analyzed longitudinally (see Table 2 for variables). Intergroup comparisons were determined, using least squares (LS) mean differences. Changes over time in each variable were investigated using type III tests of fixed effects.
Descriptive Statistics for Each Measure Across Three Time Points.
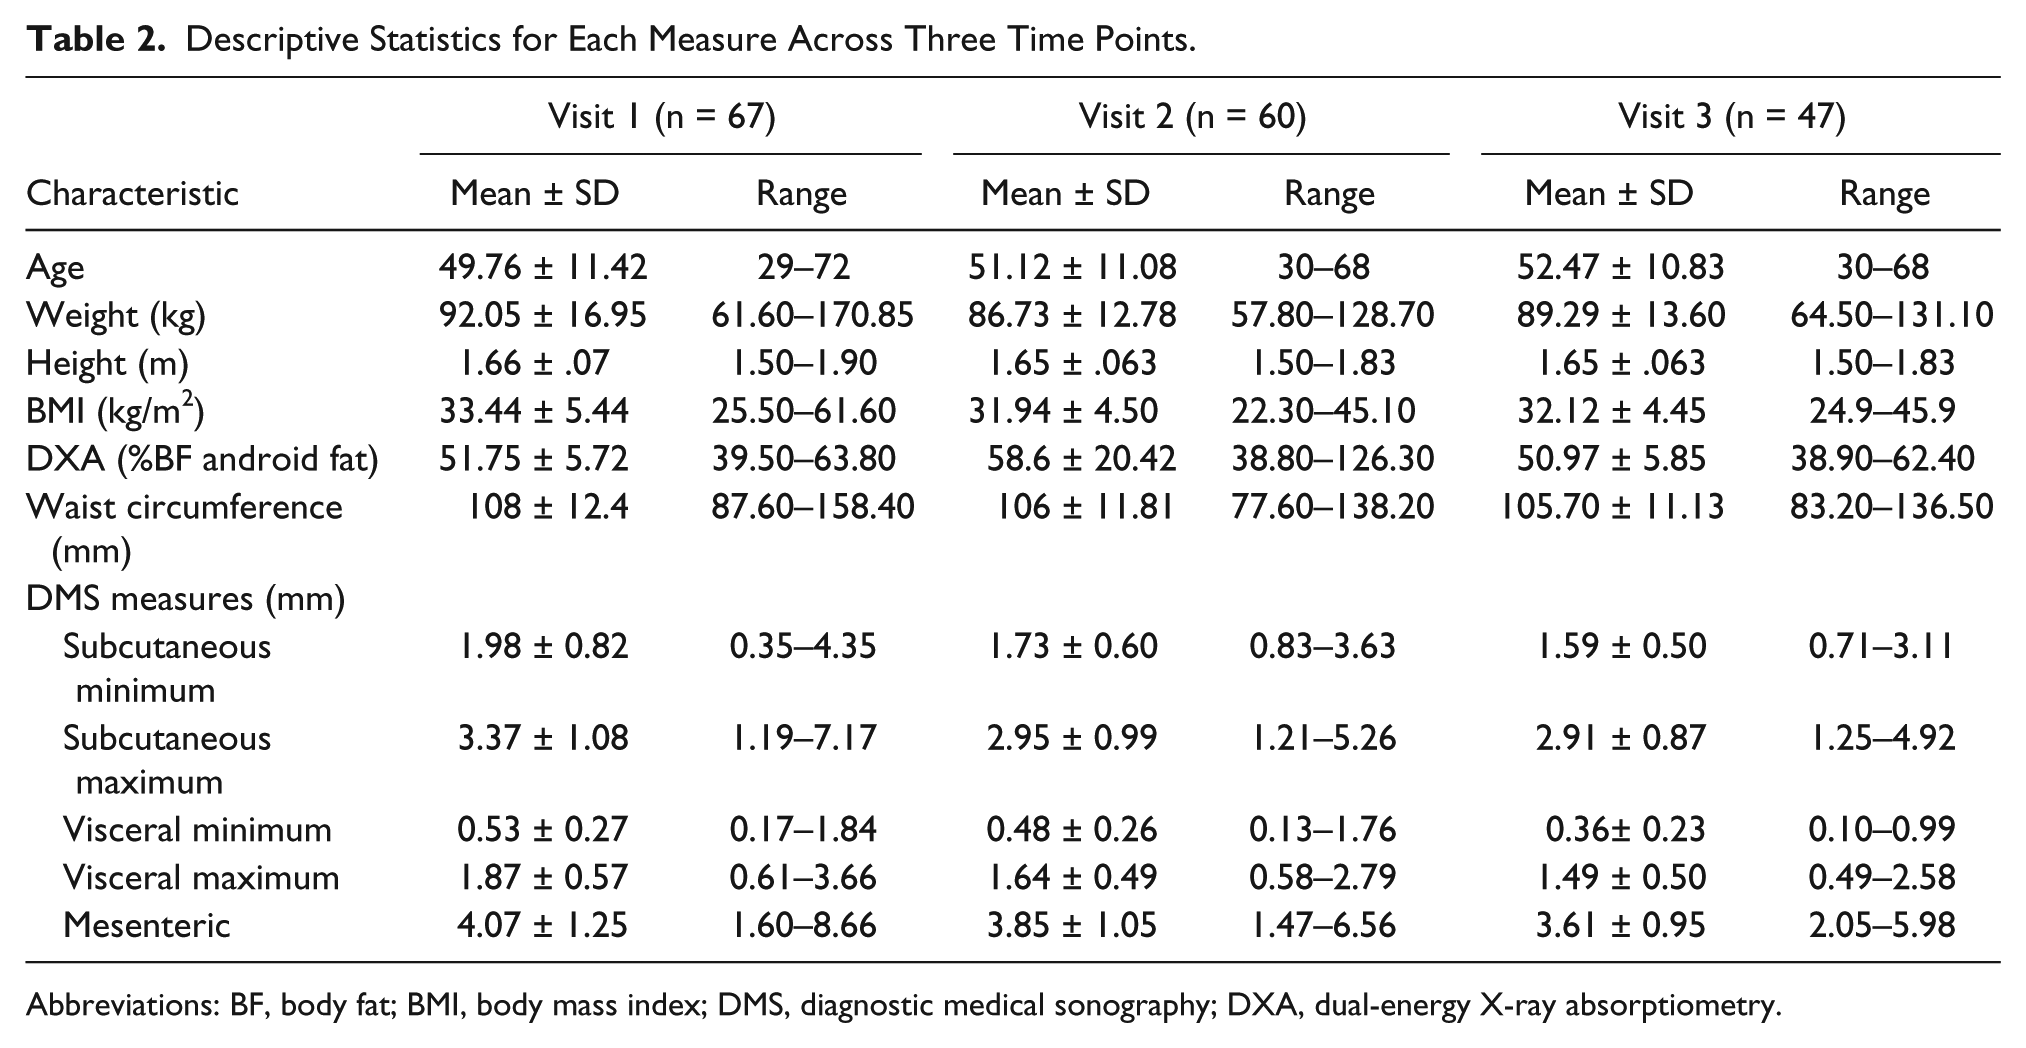
Abbreviations: BF, body fat; BMI, body mass index; DMS, diagnostic medical sonography; DXA, dual-energy X-ray absorptiometry.
Results
Due to scheduling conflicts, 77 of the 80 participants had sonographic images of their abdomen taken during at least one of their three visits. Of those participants, 67 received baseline images. In addition, 53 participants had sonographic images performed at all three visits. However, only 47 of the 53 participants’ data were used for visit 3, due to participants failing to continue to meet the inclusion criteria. Dropouts did occur across all three visits due to cancer remission and severe illness. Descriptive statistics were conducted to compare measures across all three visits. See Table 2.
The trend graphs for waist circumference, BMI, and DMS measures of subcutaneous fat demonstrated similar behavior (see Figures 2 and 3). The trend graphs for the DXA (android % BF subscore), sonographic measures of visceral fat minimum and sonographic measures of mesenteric fat demonstrated behavior similar to each other (see Figures 4 and 5).
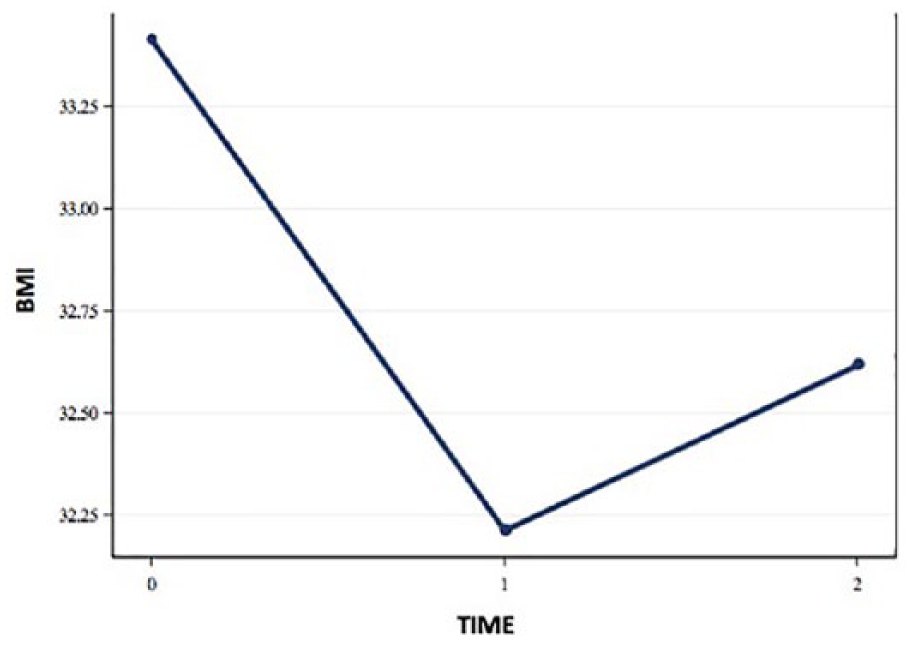
Trend graph representing body mass index (BMI) measures over time.
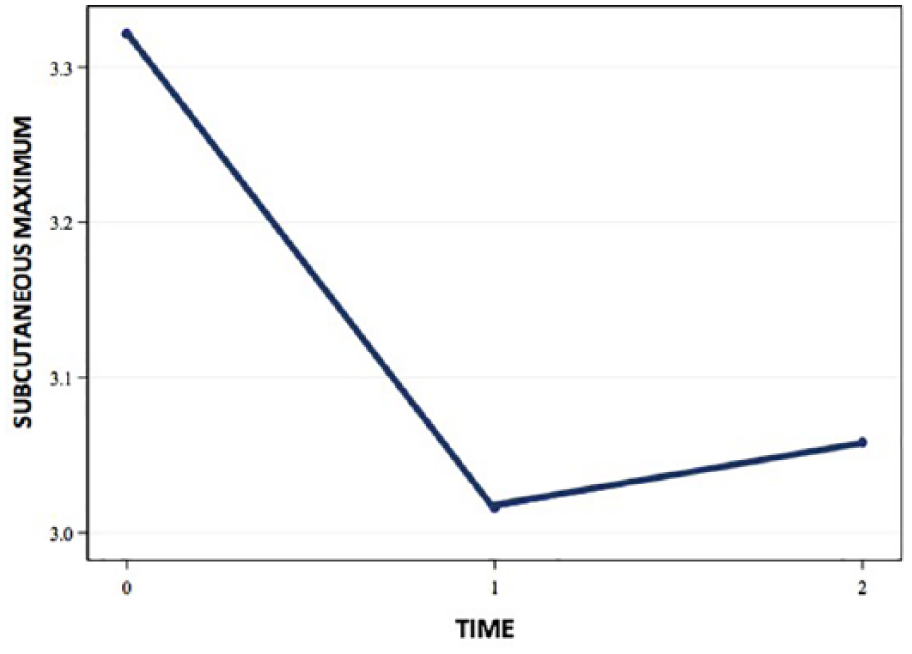
Trend graph representing subcutaneous fat measures over time.
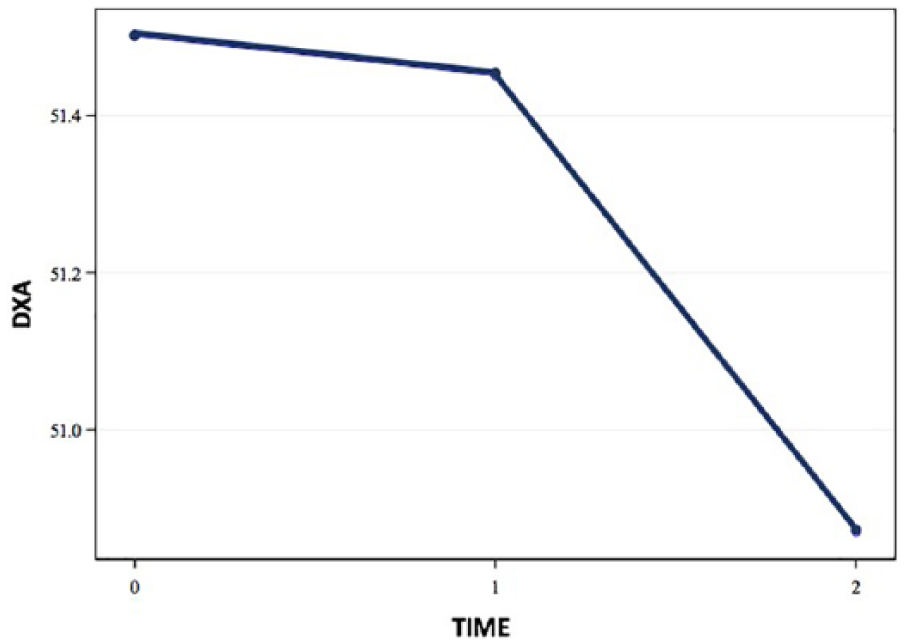
Trend graph representing dual-energy X-ray absorptiometry (DXA) (android % body fat subscore) over time.
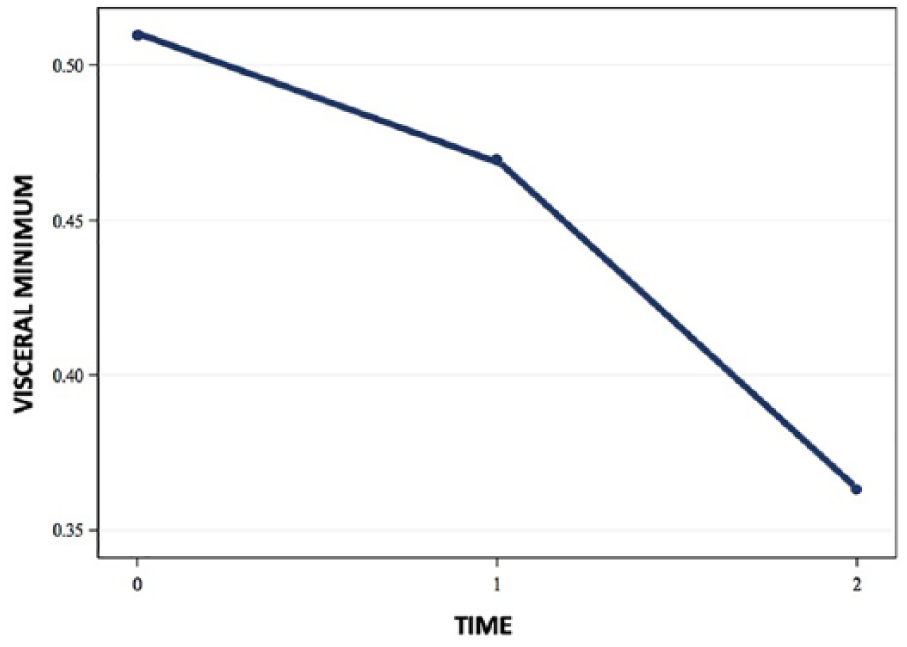
Trend graph representing visceral fat measures over time.
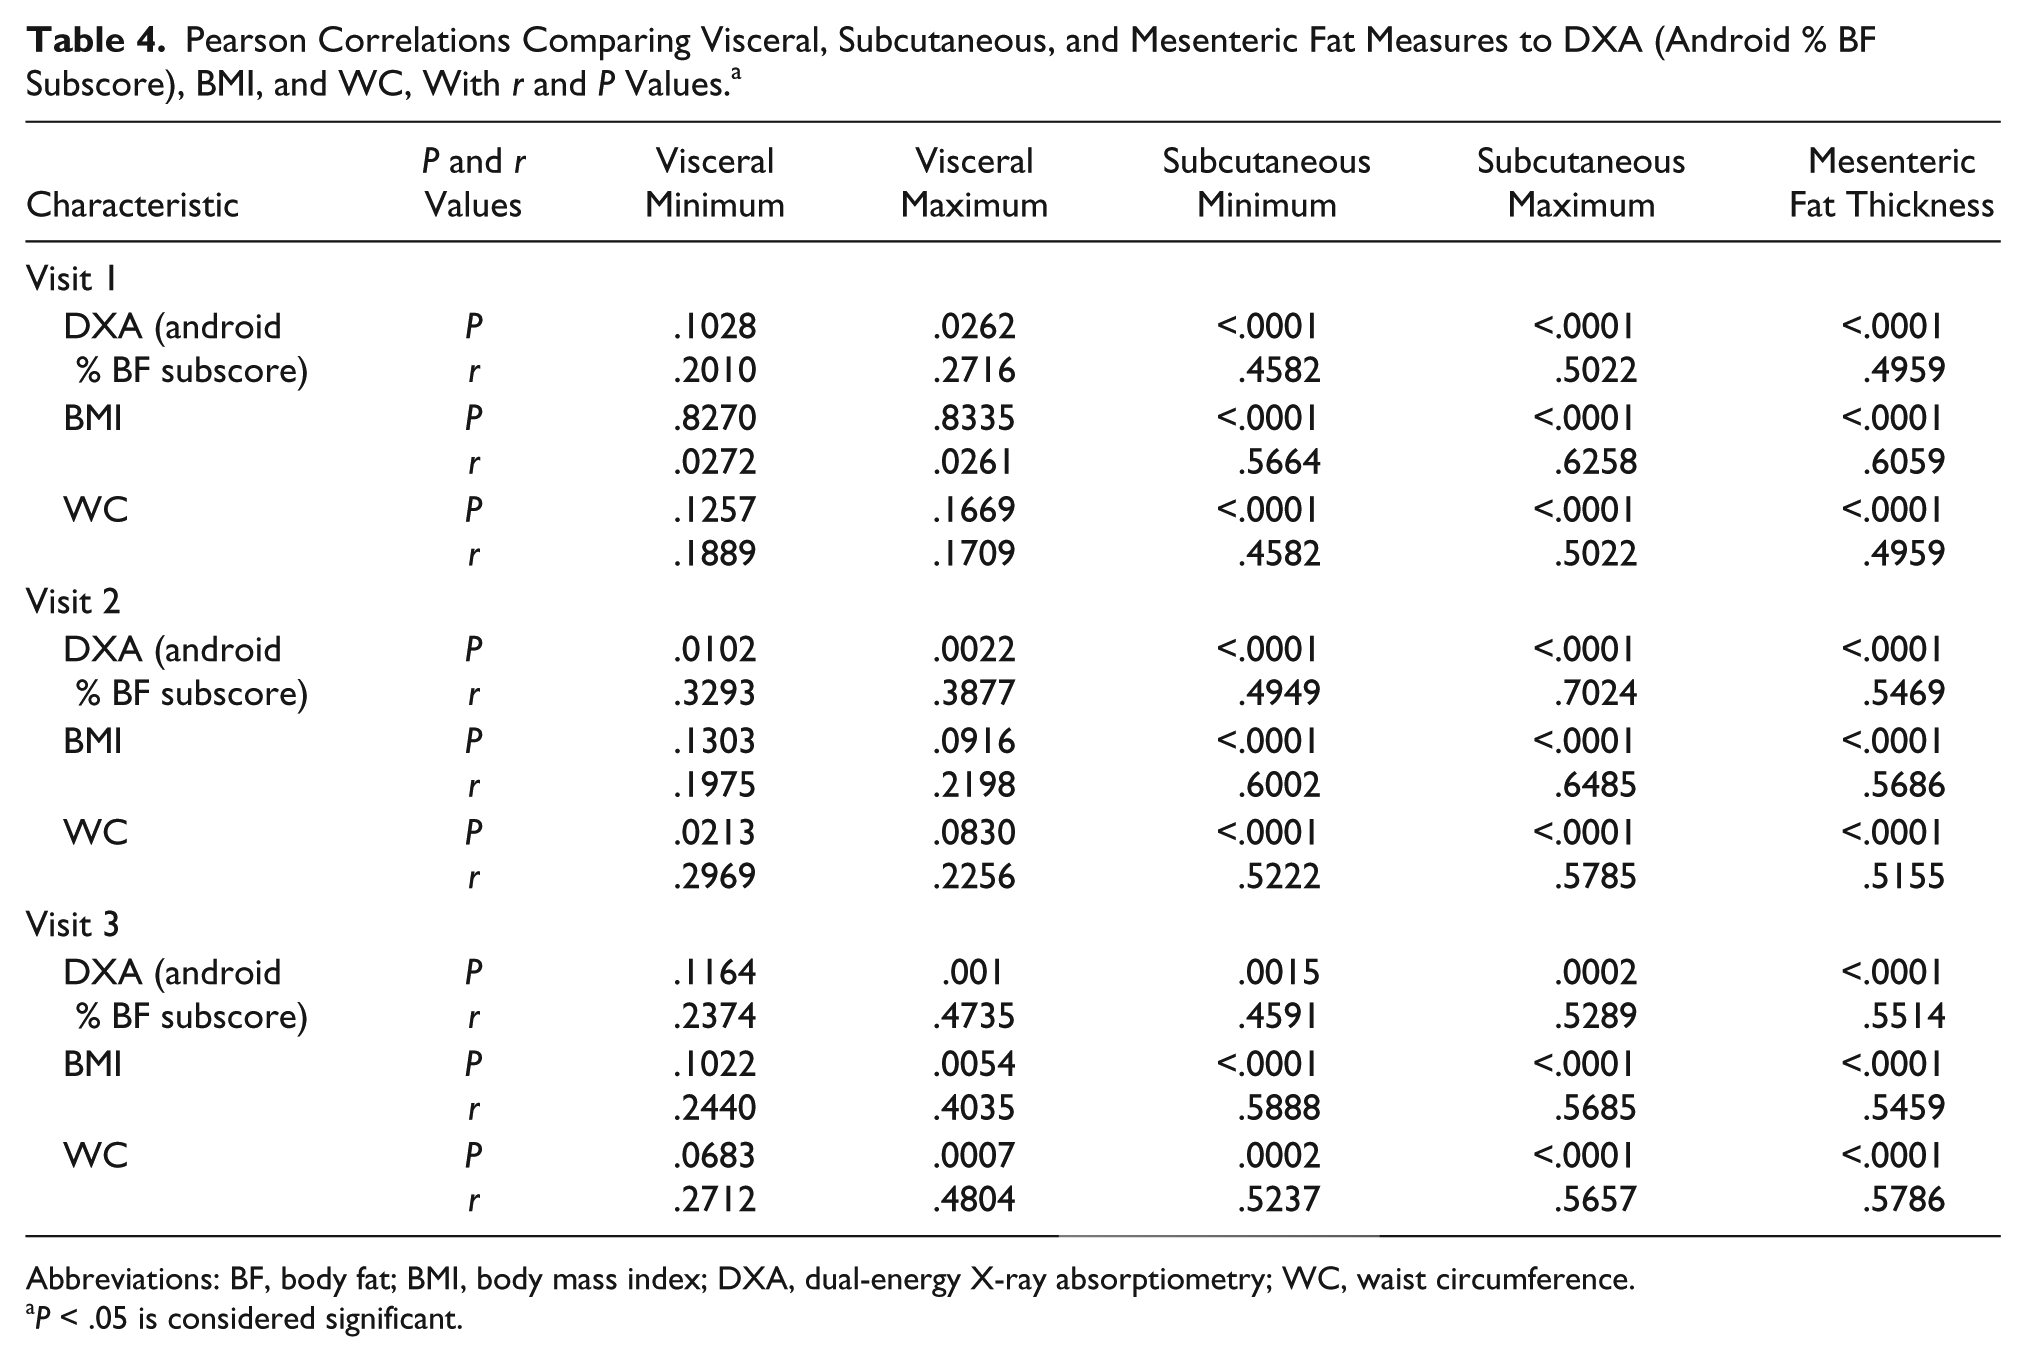
Type III test of fixed effects showed significant change over time for BMI, sonographic measures of subcutaneous fat, sonographic measures of visceral fat, and sonographic measures of mesenteric fat (see Table 3). Waist circumference measures and the DXA (android % BF subscore) demonstrated no significant change over time (see Table 3). Pearson’s correlation coefficients showed significance (P < .0001–.1028) and mostly moderate to high correlations (r value range: 0.1889–0.7024) between the DXA (android % BF subscore) and visceral fat measures, subcutaneous fat measures, and mesenteric fat thickness measures for all three visits (see Table 4). In addition, BMI and waist circumference (WC) showed high correlations to subcutaneous fat and mesenteric fat thickness measures (see Table 4). Visceral minimum measures did not show a high correlation to the DXA (android % BF subscore).
Type III Test of Fixed Effects Where Effect Is Time. a
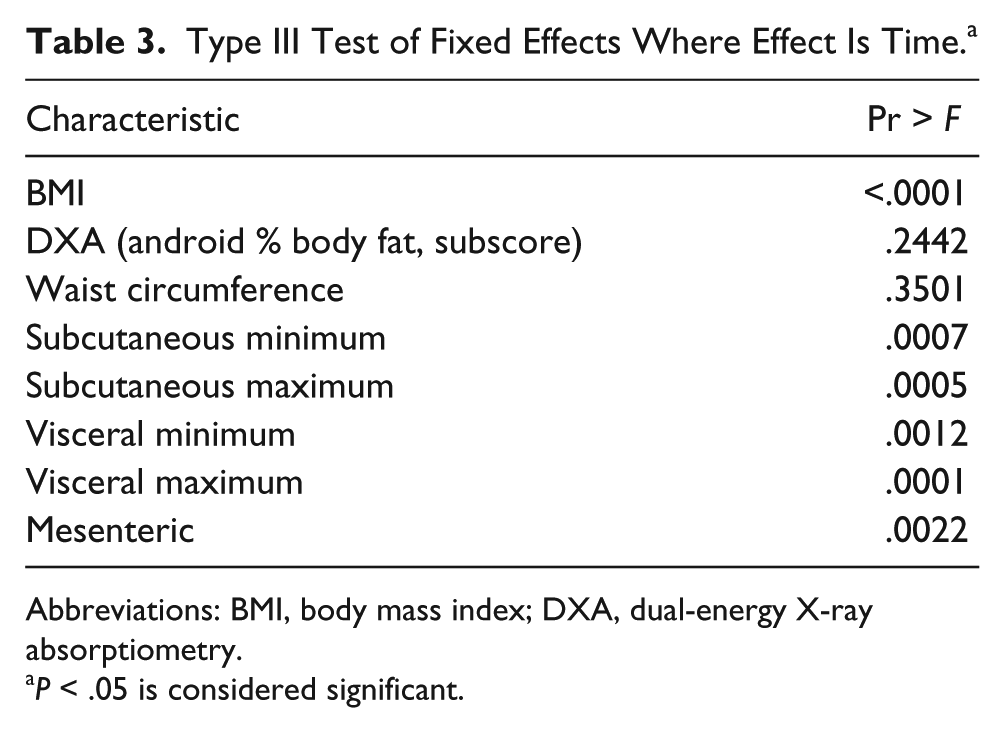
Abbreviations: BMI, body mass index; DXA, dual-energy X-ray absorptiometry.
P < .05 is considered significant.
Pearson Correlations Comparing Visceral, Subcutaneous, and Mesenteric Fat Measures to DXA (Android % BF Subscore), BMI, and WC, With r and P Values. a
Abbreviations: BF, body fat; BMI, body mass index; DXA, dual-energy X-ray absorptiometry; WC, waist circumference.
P < .05 is considered significant.
Discussion
Assessment of abdominal fat accumulation has been investigated previously by researchers, and the most common and simplest measures used consist of BMI and WC measures.6,8,9,10 These methods provide a noninvasive technique to assess abdominal adiposity. 10 However, neither BMI nor WC can quantify variations in visceral or subcutaneous fat and therefore create pitfalls in their practical application. Unfortunately, BMI assesses the total body fat distribution and therefore does not have the ability to estimate specific abdominal adiposity measures. In addition, although insulin resistance and metabolic conditions have been associated with obesity or higher BMI, even lean subjects can be at risk for these conditions due to increased visceral fat accumulation. 11 The intra-abdominal fat measures by DXA and anthropometric measures compared to the visceral adipose tissues measures of single-slice CT have been explored previously by researchers. 10 In a cohort of obese women, DXA and anthropometric data were inaccurate compared to CT. 10 DXA has the ability to identify whole-body fat composition, similar to BMI, but lacks a way to distinguish and quantify visceral adiposity. 10 Although DMS is not currently a method commonly used for quantifying abdominal adipose tissue, this study suggests that DMS may be a useful tool for assessing abdominal adipose tissue in overweight and obese cancer survivors. In this group of participants, the data suggest that all of the measures of BMI as well as the sonographic measures are more sensitive to detecting changes in body composition over time than DXA (android % BF subscore) or the WC measures.
DMS provides comparable measures of abdominal adipose tissues without the use of ionizing radiation. Arguably, obesity must be kept “in check,” maintained, and prevented through weight monitoring and weight loss therapy. 12 Mohan and Anburajan 12 conducted a study to justify the use of an anthropometric empirical indicator (AEI) by chest and pelvic radiographs for quantifying obesity. These researchers found that the use of AEI by pelvic and chest radiographs could precisely and accurately gauge obesity. The authors suggest that this method could replace the expensive and more commonly used method of DXA. Interestingly, in another study, Mauad et al. 13 tested the accuracy and reproducibility of measuring abdominal adiposity by DMS and CT and identified an increased intraobserver reliability in DMS. However, both DMS and CT showed high accuracy and good reproducibility when measuring abdominal adiposity. 13 Although these researchers found an alternative to DXA by using CT and AEI X-ray, these methods still required low doses of ionizing radiation, whereas DMS demonstrated high accuracy and reproducibility without exposing patients to ionizing radiation.
It is important to note that sonographic measures perform in a similar manner to the “gold standard” of DXA and BMI in determining an individual’s risk for disease. Stolk 14 suggests that DMS measures performed on intra-abdominal fat of 600 participants are more reliable than WC measures. Participants’ high abdominal fat measures correlated with higher plasma glucose, total cholesterol, and triglycerides. 14 The associations observed were independent of weight and contrasted with WC, suggesting that DMS measures correlate more closely with the association of abdominal adiposity and increase the risk for metabolic disease than the traditional anthropometric measures. 14 Similarly, in the current study, it was shown that DMS measures were able to more accurately detect changes over time versus WC measures and android % BF subscore of DXA measures (see Table 3). In addition, WC measures correlated higher with subcutaneous fat measures than visceral fat measures. Since subcutaneous fat constitutes the majority of fat distribution within the abdomen, a high correlation with WC measures is suspected. However, as mentioned previously, WC measures cannot differentiate between different fat layers. Overestimation of subcutaneous fat or underestimation of visceral fat is possible, therefore putting patients in jeopardy of incorrectly assessing their increased risk for disease.
DMS provides a tool that can measure visceral fat accumulation that BMI and WC are unable to differentiate from total measures. Interestingly, in a study of 74 adults, DMS was found to be a valid method for assessing abdominal adiposity when measuring visceral and subcutaneous fat with strong correlations to MRI. 15 Furthermore, it was found that DMS measures not only significantly improved predictions of visceral and subcutaneous fat over traditional anthropometric measures, such as BMI and WC measures, but also showed significantly stronger correlations with the MRI visceral/subcutaneous ratio, the index of abdominal adiposity used to predict metabolic conditions, over anthropometric measures. 15
In the current study, BMI was highly correlated with subcutaneous fat during all three visits. This is likely due to the increased amount of subcutaneous fat distribution in individuals. The subcutaneous fat measurements showed higher correlations to the DXA (android % BF subscore) over the correlations of visceral fat. This is likely due to the limitations of measuring the visceral fat minimum. This low correlation could be due to the amount of visceral fat at the umbilicus region. This measurement is the smallest measurement of all the abdominal adiposity measurements ranging from 0.10 to 1.84 cm. Consequently, this measurement can be challenging to correlate with the DXA (android % BF subscore) since DXA measures consider the entire abdominal adiposity and are unable to distinguish between the different fat layers. Most participants demonstrated larger measures of subcutaneous fat versus visceral fat overall. Due to this increase in subcutaneous fat, it is suspected that the android % BF subscore of DXA would correlate higher with this variable, since DXA calculates the total fat distribution within the abdomen, rather than each individual layer of fat. Since the differences in fat accumulation in visceral versus subcutaneous have different health consequences, it is critical to be able to discern the two layers.
Future Implications
This longitudinal data provides an understanding that small changes can be detected in body composition over time with DMS. Therefore, the use of this data could be useful in the implementation of DMS as a screening tool for metabolic disease risk. It is important to note that this particular cohort was a convenience sample that consisted of overweight and obese cancer survivors. Cancer survivors are more susceptible to metabolic conditions and therefore may demonstrate quicker changes in adiposity measures when given an intervention. However, further research in other populations with more consistent participation is warranted. The use of DMS as a screening tool could help to determine the risk for metabolic conditions, ascertain disease recurrence, and prevent the use of added radiation to the patient. This study also provides evidence for a potential method to be used to screen pediatric abdominal adiposity in the future.
Footnotes
Declaration of Conflicting Interests
The authors declared no potential conflicts of interest with respect to the research, authorship, and/or publication of this article.
Funding
The authors received no financial support for the research, authorship, and/or publication of this article.