
Abstract
A preexperimental cohort study was conducted with 67 overweight cancer survivors. This cohort of participants was screened for baseline body composition and anthropometrics based on a variety of techniques, including body mass index (BMI), dual X-ray absorptiometry–percentage body fat (DXA-android %BF), diagnostic medical sonography (DMS), and waist circumference (WC). The combination of subcutaneous fat layer at the xyphoid and umbilicus compared with BMI, WC, and DXA-android %BF. These variables demonstrated moderately positive association and were statistically significant. A total maximum mean score of DMS measures of subcutaneous and visceral fat was also compared with BMI, WC, and DXA-android %BF. The aforementioned comparison had a moderately positive association and was statistically significant. The sonographic measure of mesentery fat was compared with WC and demonstrated a strongly positive strength of association and was statistically significant. Sonography may be an inexpensive, noninvasive, portable, and valid body composition measure for overweight patients.
Keywords
Excessive body fatness is a significant health risk for adults in the United States, and the prevalence of obesity between 2011 and 2014 was estimated to be 36.5%. 1 In addition, overweight and obesity have been linked to deleterious health conditions such as heart disease, stroke, type 2 diabetes, and many types of cancer. 2 Specifically, increased risk for obesity-related diseases can be attributed to the deposit of fat in the adipose layer and can be centered around the abdomen. Abdominal adiposity has extensively been linked to cancers of the breast, endometrium, colorectum, kidney, pancreas, esophagus, gallbladder, ovaries, thyroid, and potentially the prostate. 3 Given the varied health risks and all-cause mortality associated with increased body fatness and specifically abdominal adiposity, it is important to use validated body composition measures to objectively assess adiposity in human studies. Body mass index (BMI) is a noninvasive and widely accepted weight classification system associated with risk of disease. BMI and waist circumference (WC) were the metrics of choice for a study to determine the influence of abdominal adiposity for both cardiovascular disease and cancer, which followed a cohort of 44 636 women over a 16-year period. 4 During that time, 3507 deaths were identified, including 751 deaths attributed to cardiovascular disease and 1748 deaths due to cancer. 4 This linkage between abdominal adiposity and cancer has been carefully researched to determine the biological mechanisms that trigger these varied cancer risks. Several mechanisms have been suggested, but the current evidence seems to point to hormonally stimulated cancers due to stored abdominal fat. 5 It is for this reason that screening techniques have been used to categorize patients with abdominal adiposity and use BMI, WC, and other subjective measures as clinical measures. Table 1 provides an example of BMI categories used to stratify levels of obesity. These levels of obesity could be used as a tool to determine the potential risk for disease. Given that BMI and WC are commonly used clinically, they may not be the best screening tools because of their level of reliability.
Body Fat Classifications for Patients Based on Body Mass Index (BMI). a
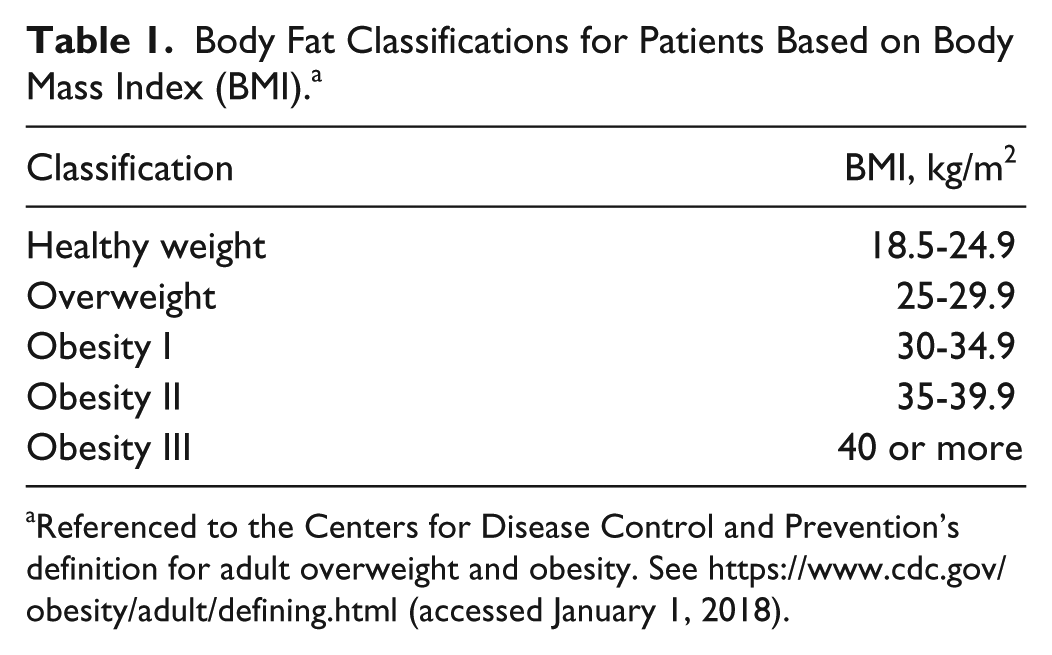
Referenced to the Centers for Disease Control and Prevention’s definition for adult overweight and obesity. See https://www.cdc.gov/obesity/adult/defining.html (accessed January 1, 2018).
Imaging has also been used to provide a more objective and precise means for screening patients for abdominal adiposity. Computed tomography (CT), magnetic resonance imaging (MRI), dual X-ray absorptiometry (DXA), and diagnostic medical sonography (DMS) have all been suggested as more accurate means for measuring the level of abdominal adiposity. 6 In most clinical practices, the use of DXA is considered a quick means for collecting screening data that is more accurate than BMI or WC. 7 Although DXA is a very low dose of ionizing radiation for the patient, other nonionizing radiation techniques are considered advantageous. MRI and DMS represent those nonionizing choices to measure abdominal adiposity; however, some argue that DMS lacks reproducible measures. 6 Nonetheless, studies have been published using DMS for the purpose of measuring abdominal adipose.8–11 Perhaps the Hamagawa et al 11 study was the most seminal as it looked at the ability of sonographically measured visceral fat to predict metabolic syndrome in a cohort of patients. Besides BMI, WC, and other biomarkers, DMS was compared with coronary angiography for predictive value. The use of DMS to measure the visceral fat depth of 185 patients who had undergone coronary angiography was a nonionizing alternative that had significant value. 11 The concern for reproducibility of making sonographic visceral fat depth measures was explored by Bazzocchi et al 12 in a cohort of 45 males and 45 females, with varied ultrasound equipment. In their study, they found that the highest level of precision was associated with patients in a fasting state, holding their breath during imaging, and using the imaging protocol with newer ultrasound equipment. 12
Given the epidemic of obesity and the possible relationship of abdominal adipose to cardiovascular disease or cancer, a nonionizing imaging method is needed to reliably screen patients. Compared with DXA, DMS provides a noninvasive, portable, and relatively less expensive examination that requires less time to complete. The objective of this study was to determine the strength of relationship between DMS measures of subcutaneous and visceral fat with other associated measures of adiposity in a cohort of overweight cancer survivors. The research question was as follows: Which combination of DMS measures was strongly correlated with DXA measures of body fat and nonimaging measures of adiposity? A secondy question was, What was the intrarater reliability of DMS measures of abdominal adiposity? These exploratory studies needed to be completed to confidently proceed with properly screening patients at risk for diseases linked to abdominal adiposity.
Methods
A phase 2 randomized clinical trial design was used to stage a longitudinal study of cancer survivors who were invited to participate in a biobehavioral intervention for 1 year. These phase 2 participants were recruited to the longitudinal study, and the list of participants was 80, 67 of whom would receive DMS measures. Based on the registration list, the statistical power was set a priori at an alpha of 0.05, a moderate effect size of 0.5, and power of 0.598. The inclusion criteria for baseline data measures were having had a diagnosis of cancer and successfully completing a physician-supervised treatment plan. The larger study was approved by the university’s internal review board and was targeted specifically for adults (18 years and older). Patients were invited to come for 1 day of data collection at the university’s sponsored clinical research center. Those patients consented to the study and were asked to report in the morning fasting for biometric and imaging data collection.
Subject Population
DMS and DXA scanning were done concurrently, and at the same appointment, trained research dietitians collected BMI and WC measures on each participant, research nurses completed DXAs. Due to scheduling conflicts, only 67 patients received DMS measures. Selectively, the DMS, DXA, BMI, and WC data were used for this baseline analysis.
DXA Protocol
The participants were also given a DXA examination on a GE Lunar iDXA (Waukesha, WI) with the patient supine on the examination table. The DXA equipment was operated by a registered nurse who was trained to complete DXA examinations. The onboard software, enCORE 2011 (version 13.6), was used to analyze DXA images. A researcher credentialed in bone density and with clinical experience checked the data analysis process. The body fat percentage (%BF) was generated specifically as a specialized report from the enCORE software. The DXA equipment was carefully monitored for quality control and quality assurance as outlined in the literature.13,14
The DXA examination allowed for a series of body fat analyses to be generated. To properly match our sonographic measurements, the android region was chosen. Stults-Kolehmainen et al 15 described the android subscore of %BF, which consists of the area between the ribs and the pelvis and is totally enclosed by the trunk region. 15 For the purposes of this study, the android subscore that comes from DXA is listed as DXA-android %BF.
Sonography Protocol
The patients were all imaged on a GE Logiq 9 ultrasound machine with a 9.0 (6- to 8-MHz) linear transducer. The protocol was standardized using 8 MHz, gain 30, depth 7 cm, and acoustic output power set at 100%. Patients were asked to lay supine on the examination table, and they had to hold their breath for a series of sagittal and transverse images of the abdomen. The images were captured by skilled sonographers according to the Suzuki et al 9 protocol. A cine clip in the sagittal plane was taken in the same manner on all patients for further postexamination analysis. Each cine clip began at the xiphoid process (see Figure 1) and continued down the linea alba and concluded at the umbilicus. In addition, a transverse static sonographic image was taken at the level indicated for the WC. This is adapted from the Bazzocchi et al 10 scanning protocol to assess the layers of adiposity at the same area as the WC (see Figure 2) was taken. The ultrasound equipment was carefully monitored for quality control of the transducers by taking tissue-mimicking phantom measurements for axial and lateral resolution.
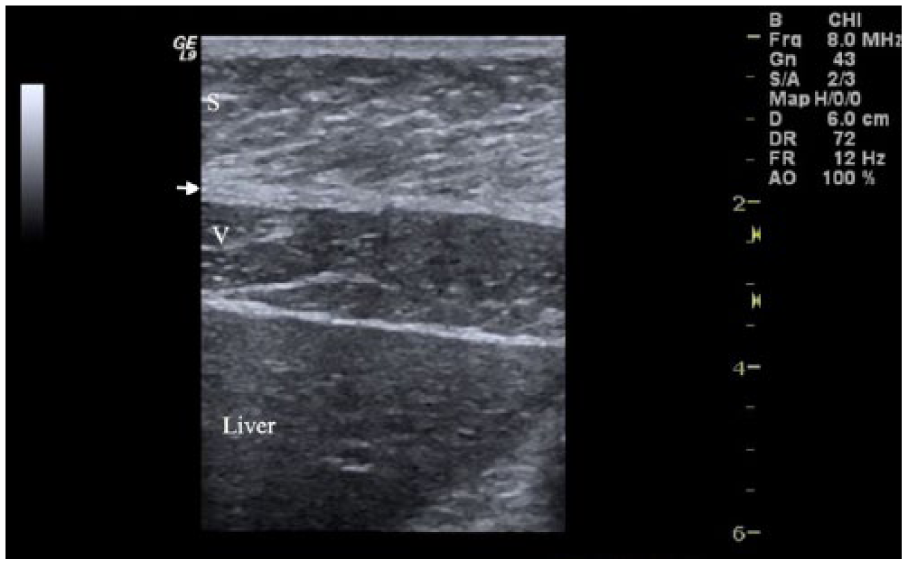
Sonographic image taken in the sagittal plane at the level of the xiphoid process. Subcutaneous fat layer (S), linea alba (arrow), visceral fat layer (V), and the liver.
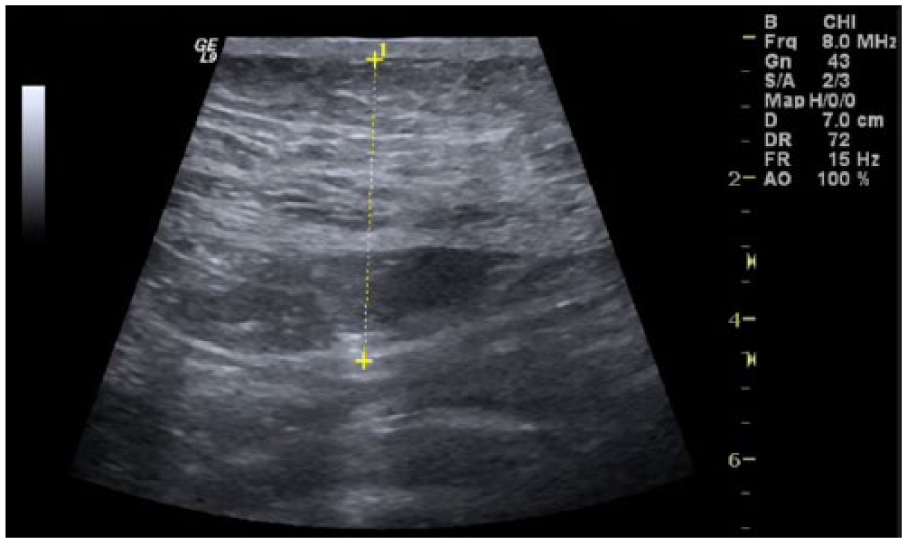
Sonographic image taken in the transverse plane at the level of the iliac crests. The yellow line demonstrates the intra-abdominal fat-thickness measurement.
DMS postexamination measurements were taken at the xiphoid, umbilicus, and the waist to determine the depth of adiposity as outlined by previous investigators.8–12 At each location, subcutaneous fat and visceral fat were measured (see Figures 3 and 4). All image analyses were completed by a credentialed abdominal sonographer with 35 years of experience. The measurements were made on the GE Logiq 9 ultrasound equipment using the onboard measurement system. For all patient DMS cases, five measurements were taken at each location (xiphoid, umbilicus, and waist), eliminating the highest and lowest of the five measurements. An average was calculated for the three remaining measurements to address the issue of measurement error. All the images were stored on the equipment and easily rebooted for subsequent measurements by staff to address interrater reliability.
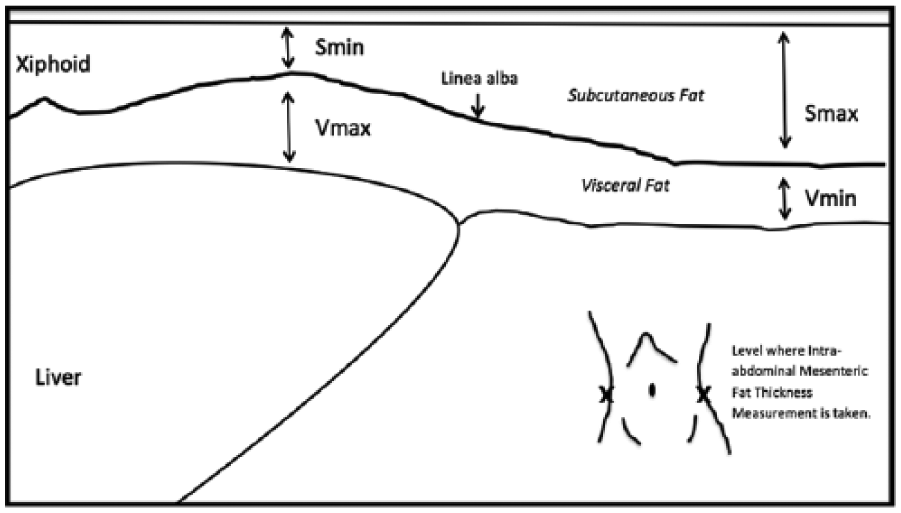
Diagram for sonographic measurements of the subcutaneous minimum (Smin), visceral maximum (Vmax), subcutaneous maximum (Smax), and visceral minimum (Vmin) fat thicknesses.
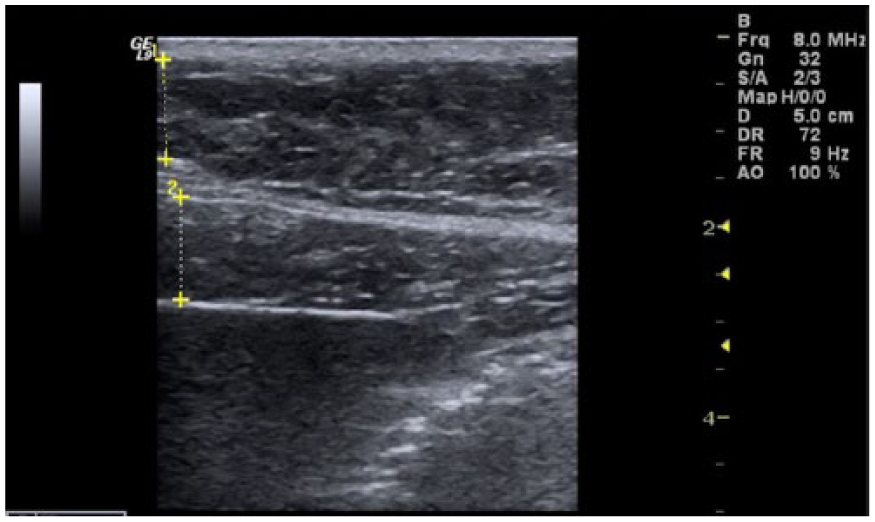
Sonographic image taken in the sagittal plane showing measurements of the subcutaneous (1) and visceral (2) fat layers.
Clinical Evaluation
The BMI (height and weight) as well as WC measurements, taken at the level of the iliac crests, were averaged and reported for further data analysis. Table 1 provides the classification for BMI that was used in this study.
All 67 patients had complete baseline data consisting of WC, BMI, DXA-android %BF, and DMS adiposity depth measurements. Based on the measurement parameters put forward by Suzuki et al., 9 the following measurements were made: subcutaneous minimum (Smin), subcutaneous maximum (Smax), visceral minimum (Vmin), and visceral maximum (Vmax; see Figures 3 and 5). In addition, a fifth measurement depth was taken, as proposed by Bazzocchi et al., 12 which is the intra-abdominal mesenteric fat thickness (IMT; see Figure 2). The IMT measurement was made at approximately the same level that the WC was taken with a cloth tape measurement. The trained clinical research staff placed a marker on the skin so that a transverse sonographic image could be lined up with the WC measurement location as close as possible. Occasionally, the image was taken just superior to the umbilicus due to its shadowing on the sonogram, which makes measurement impossible. These IMT measurements were compared with the other variables of interest using Pearson correlations to determine their strength of association. The sample size of 67 provides 80% power to detect a correlation of 0.334 between two fat measures based on a 2-sided hypothesis test with a significance level of .05 (G*Power, version 3.1.9.2).
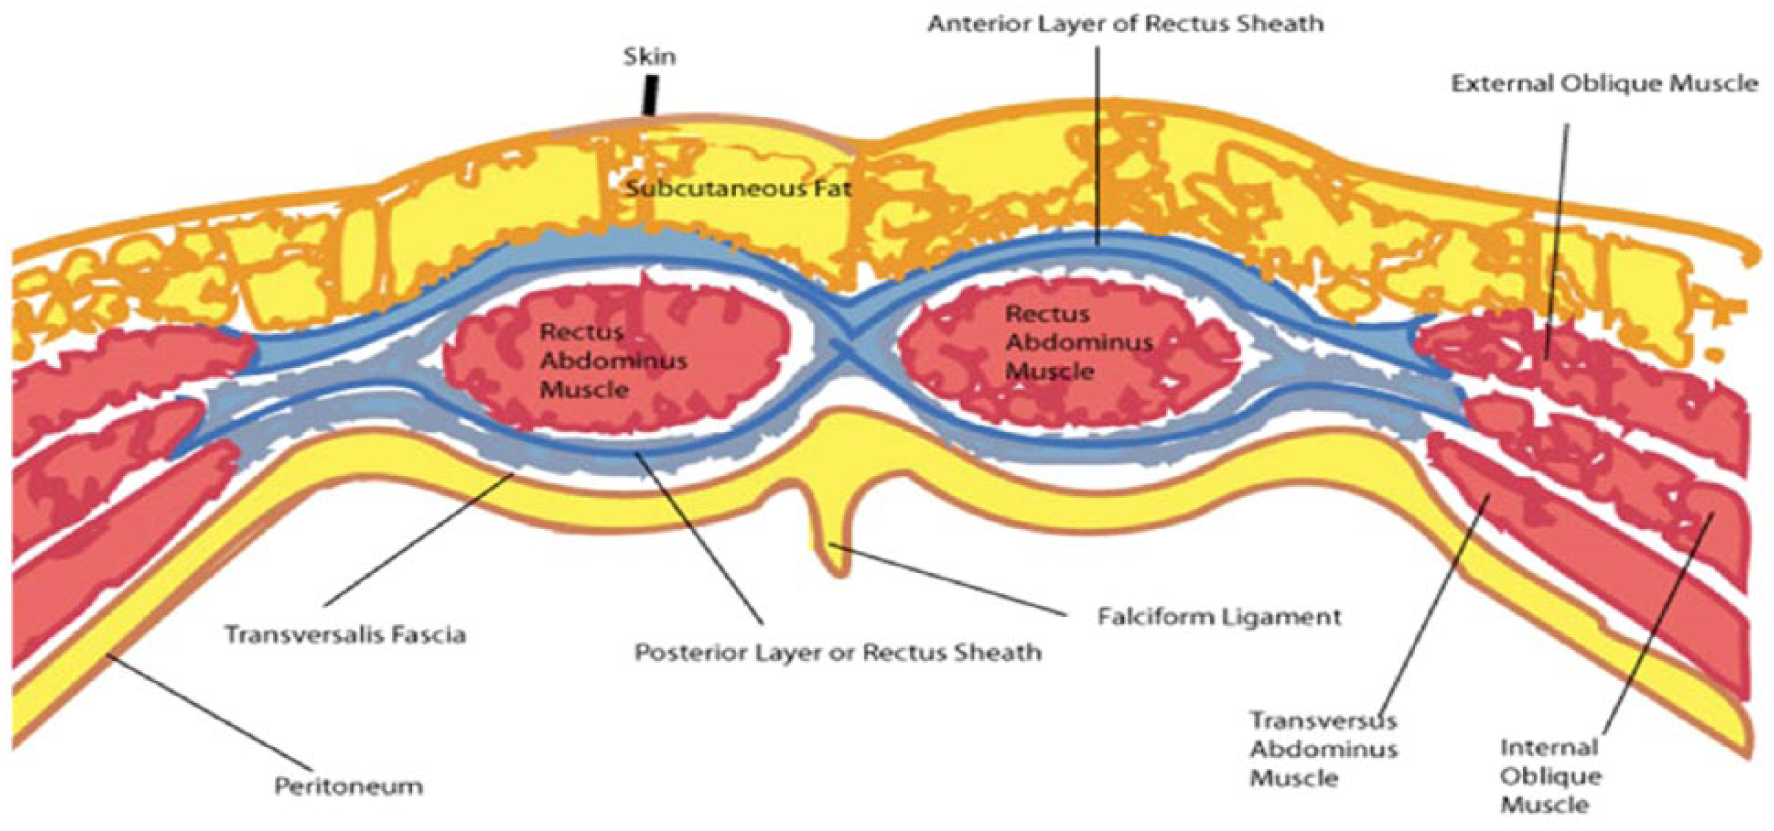
Cross-sectional view of the abdominal wall anatomy.
Data Analysis
Two-way random intraclass correlation coefficients for absolute agreement were calculated to compare measurements made by an expert sonographer (>30 years of experience) with an intermediate sonographer (2 years of experience). The measurements from the expert sonographer were also compared with a novice (no sonography experience). Three measurements (for all five variables of interest) were made on nine (expert vs intermediate) and eight (expert vs novice) images.
Results
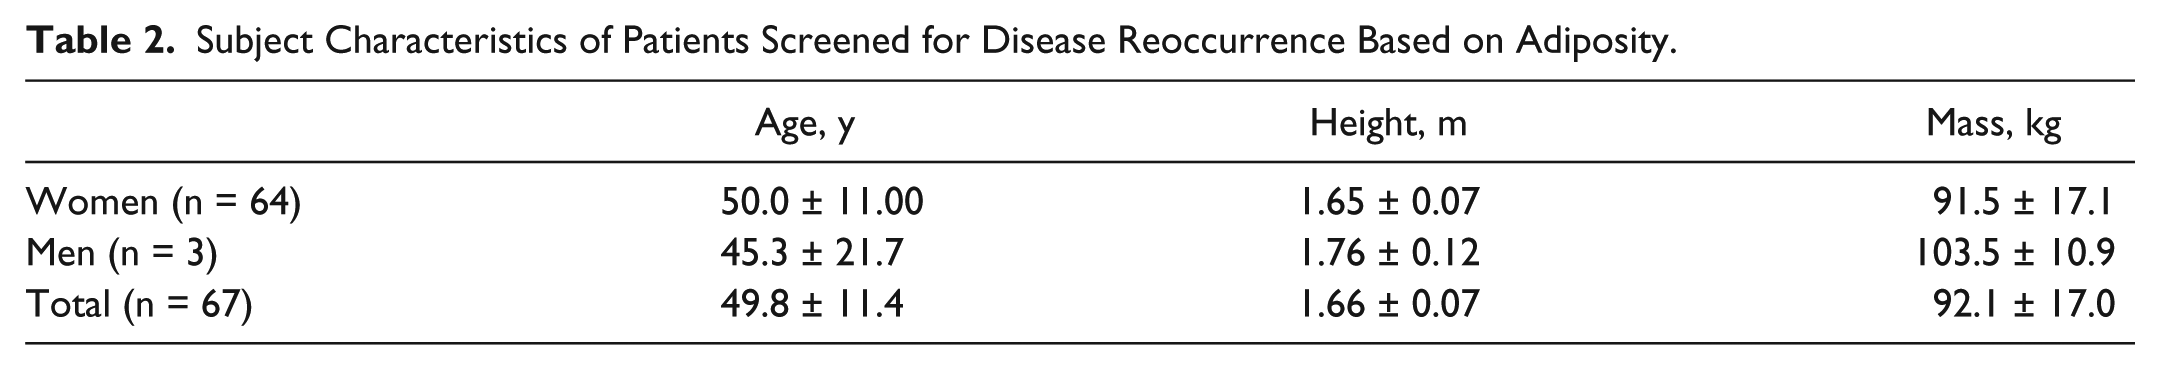
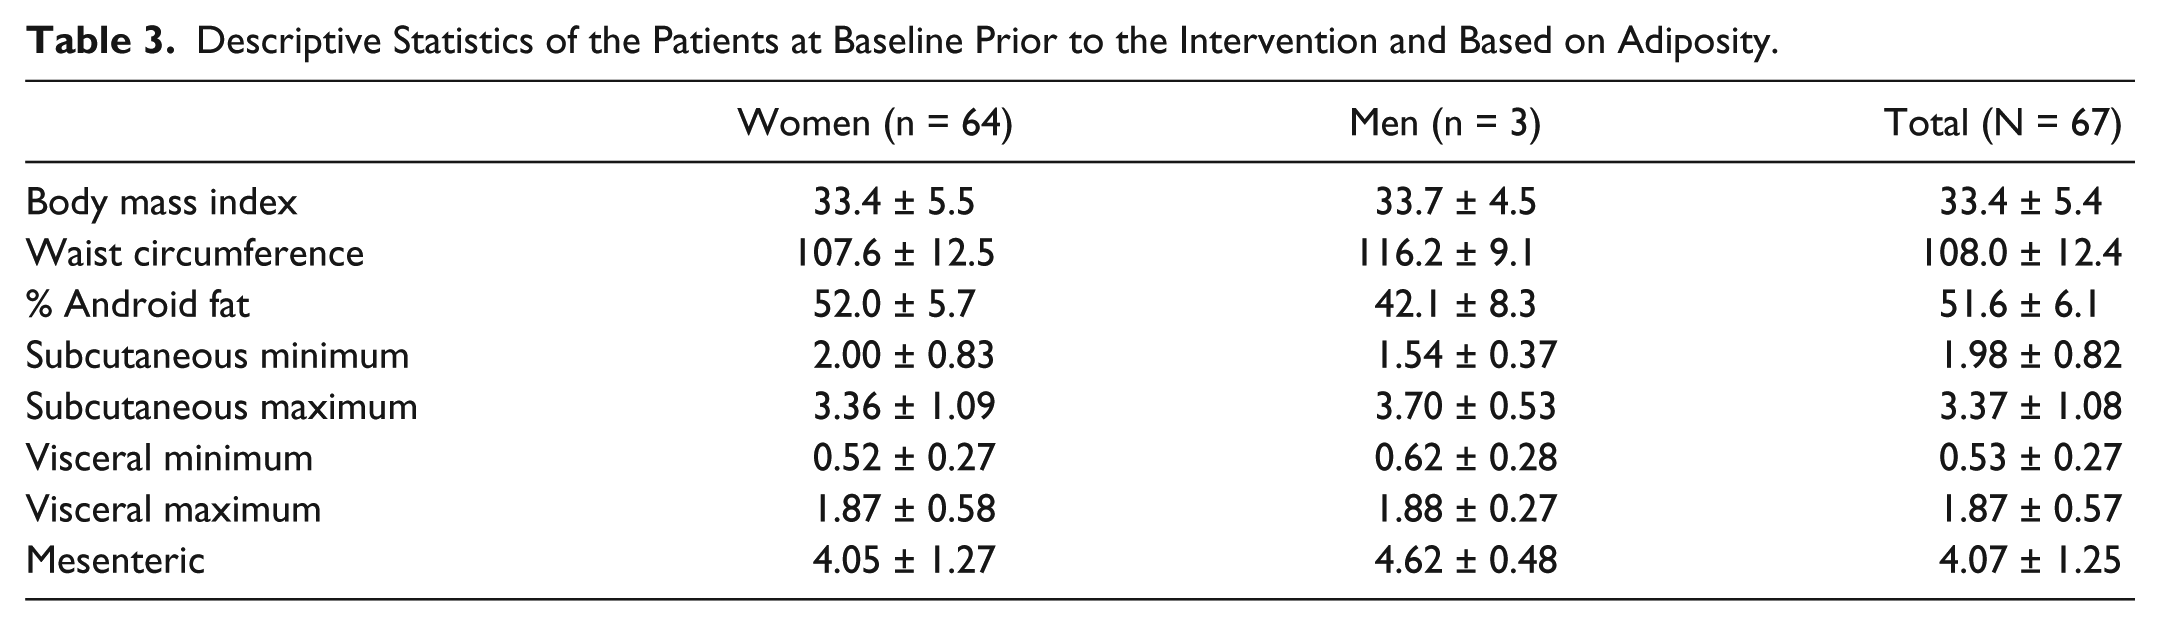
Demographics of the patients who were imaged are included in Table 2. Most patients were women with a mean age of 50.0 years (SD ±11.00). The female cohort had a mean height of 1.65 m (SD ±0.07) and a mean mass of 91.5 kg (SD ±17.1). The cohort had a mean BMI of 33.4 kg/m2 (SD ±5.4) and a mean WC of 108.0 cm (SD ±12.4). Table 2 provides a breakdown of BMI and WC for men and women. The adiposity depth measurements completed from the sonographic images at the xyphoid, umbilicus, and WC are also provided in Table 3. This table also includes descriptive statistics such as, BMI, WC, and percentage android fat of the participants prior to their intervention.
Subject Characteristics of Patients Screened for Disease Reoccurrence Based on Adiposity.
Descriptive Statistics of the Patients at Baseline Prior to the Intervention and Based on Adiposity.
The Pearson correlations between the sonographic depth measurements and BMI, WC, and DXA-android %BF are provided in Table 4. The combination of the subcutaneous fat layer at both Smin and Smax were compared with BMI, WC, and DXA-android %BF and demonstrated moderately positive strength of association and were statistically significant. In addition, the combination of visceral fat layer at both Vmin and Vmax were compared with BMI, WC, and DXA-android %BF and demonstrated only a weakly positive association that was statistically significant. A total maximum mean score with DMS that combined Smax and Vmin was compared with BMI, WC, and DXA-android %BF and demonstrated a moderately positive association that was statistically significant. Lastly, the IMT-DMS mean value was compared with WC, which demonstrated a strong positive association that was statistically significant.
Pearson’s Correlations Comparing Common Measures of Fat in a Sample of Obese Cancer Survivors.
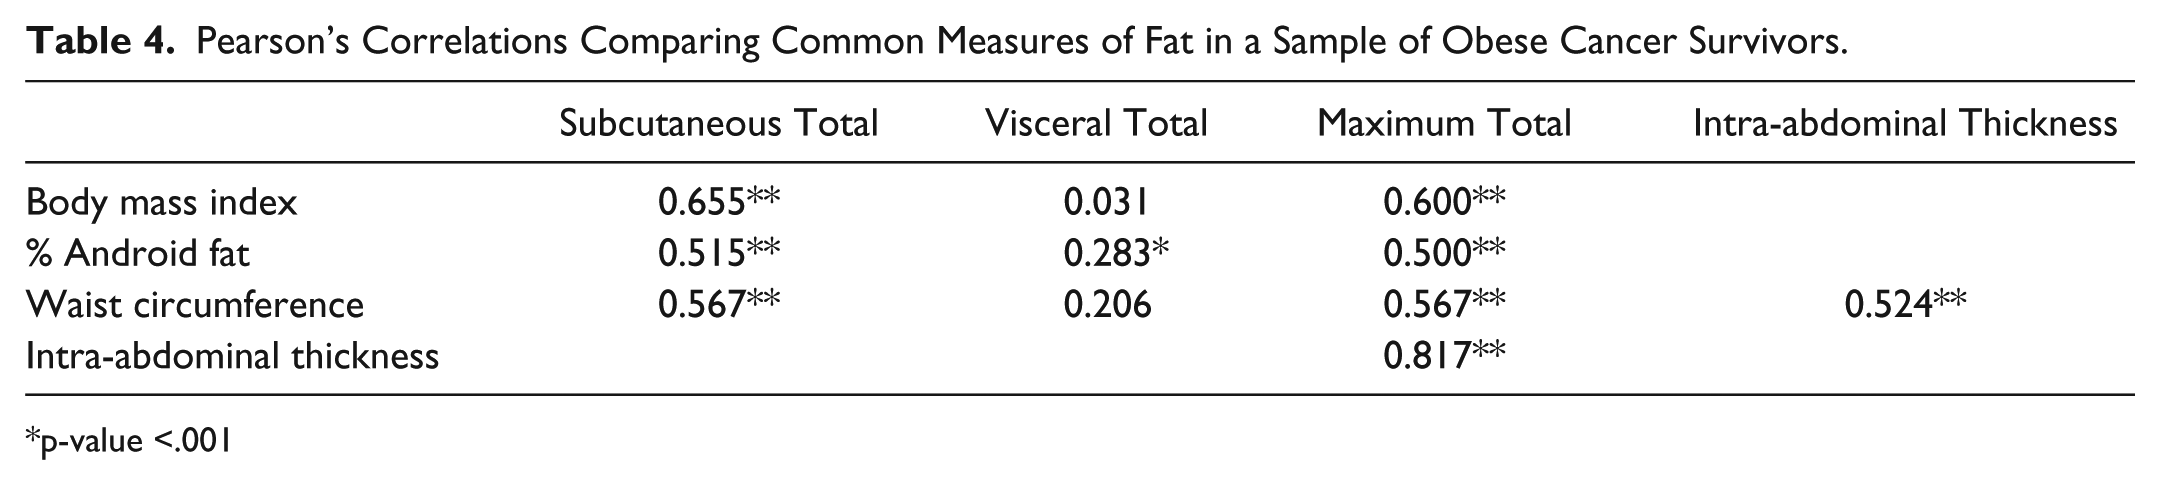
p-value <.001
Overall, both the intermediate and novice sonographers demonstrated high reliability compared with the expert, with the exception of the novice sonographer for the visceral minimum measurement (Table 5).
Two-Way Random Intraclass Correlation Coefficients for Absolute Agreement Between an Expert and an Intermediate Sonographer and an Expert and a Novice Sonographer.
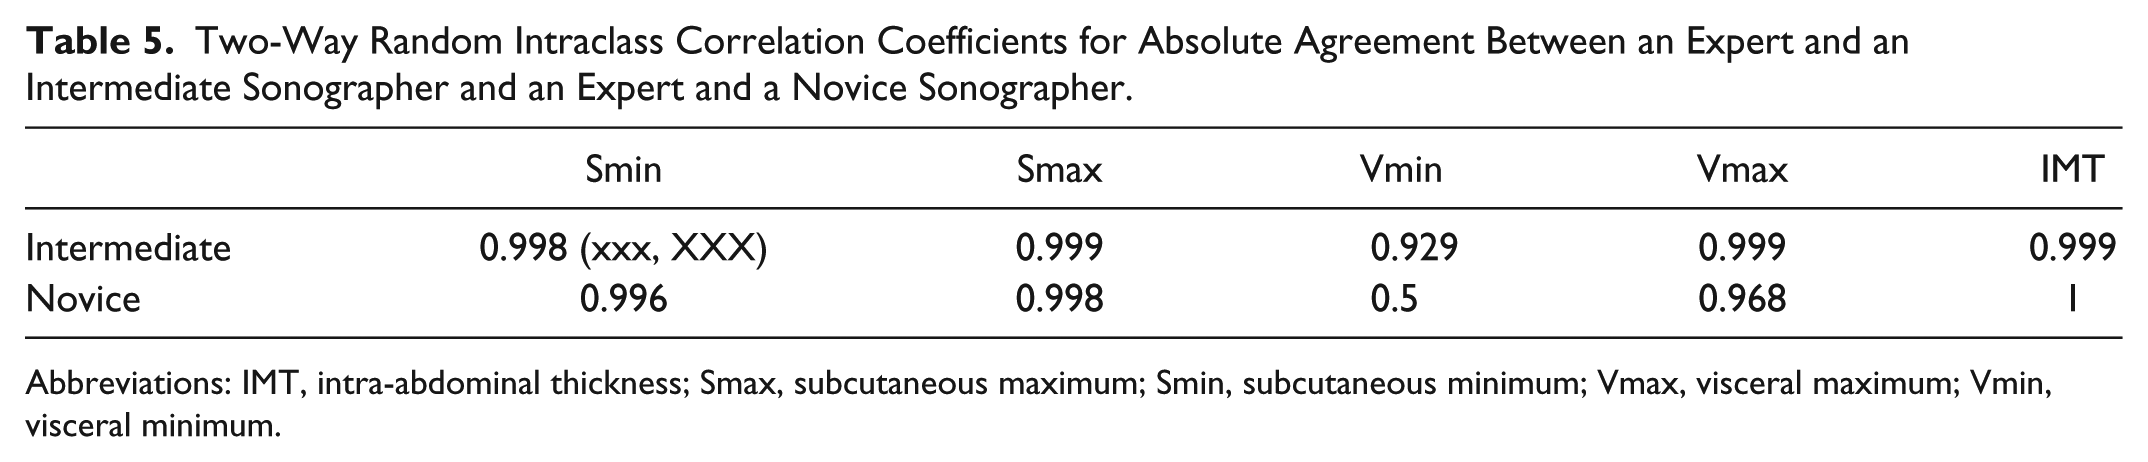
Abbreviations: IMT, intra-abdominal thickness; Smax, subcutaneous maximum; Smin, subcutaneous minimum; Vmax, visceral maximum; Vmin, visceral minimum.
Discussion
Due to the increased trajectory of body fatness across the United States, the obesity epidemic remains the focus of Healthy People 2020 with the goal for Americans to achieve and maintain a healthy body weight. 16 To identify patients with overweight/obesity and increased risk for concomitant diseases, a nonionizing screening tool would be both practical and advantageous. The current study assessed a cohort of cancer survivors who were deemed to be overweight/obese and willing to complete body composition measures. As a group, the patients were on average classified at Obesity I based on a mean BMI of 33.4 (SD ±5.4). Since their abdominal adiposity was made up of both subcutaneous and visceral fat, the use of DXA-android %BF combines the varied layers of fat. In their study, Snijder et al 17 used a Hologic QDR 1500 DXa unit to measure trunk fat; however, this was compared with CT at the same level. Interestingly, in their study, CT was a better predictor of visceral fat than DXA in their group of patients. Similarly, the measurement of visceral fat that was completed with DMS in the current study did not have a strong correlation with the DXA-android %BF. This is likely due to the inability of separating these levels of fat on a DXA, unlike what can be accomplished with CT and DMS. Since DMS is the nonionizing imaging choice compared with both DXA and CT, it has a higher likelihood of being chosen as a screening tool.
The use of intra-abdominal fat to predict obesity makes the current study’s use of IMT an important factor. In a study by Jensen et al., 18 a sample of 21 participants were assessed with BMI, DXA, and CT, and their intra-abdominal fat was specifically analyzed. CT slices taken in the lumbar region were added to DXA values to predict intra-abdominal fat (subcutaneous and visceral fat combined). They found that a single-slice CT or other imaging technique with or without DXA data was the best predictor of intra-abdominal fat. 18 In the current study, we found that in our cohort, that IMT measurement from a sonographic image at the lower abdominal region was moderately correlated and statistical significant compared with WC. This likely helps to support the hypothesis that the IMT measurement represents a nonionizing technique for obtaining a similar predictive measure of intra-abdominal fat. It is important to underscore that in present study, the measurement of IMT was similar to that in the Bazzocchi et al 12 study. Given that L4 is generally at the level of the iliac crests, this would be comparable to the WC measurements that were made. The only exception to this level of measurement was when the scan aligned with the umbilicus, and the transducer was then moved superior to avoid the artifact.
In this study, mean total visceral fat measurement was not correlated with BMI or with the WC measurements. This could indicate a problem with classifying patients strictly by their BMI. Gallagher et al 19 specifically looked at a cohort of patients (N = 1626) and used multiple measures, including DXA, to better classify fat ranges. The concern is that it may take multiple measures to accurately classify patients, especially those who have a BMI ≤35. Certainly, the patients in the current study are very comparable to those in the Gallagher study given they analyzed 1013 women with a mean age of 50 years. 19 Comparing the two study results helps in making the argument that multiple measures are needed for providing healthy body fat ranges, given that visceral fat is a contributor as well as measures of %BF. In the Gallagher et al. study, the resulting model used multiple measures (DXA, BMI, and hydrostatic weighting) to propose a body fat range for women 40 to 59 years of age: BMI ≥30; African American = 39, Asian = 41, Caucasian = 41). 19 The present study suggests that DMS could provide even more specific data, which could improve this model, given the limitations of DXA as an ionizing imaging choice.
Interestingly, the use of WC and Vmax were shown to be very sensitive for predicting the presence and severity of coronary artery disease. Hamagawa et al 11 found that a Vmax of 6.9 cm or higher but not a WC of 84.5 cm or higher did predict the number of diseased vessels. Other variables such as BMI, blood chemistry, medications, and coronary risk factors were not as sensitive a predictor. It is worth noting that sonographic measurements of Smin were also not a significant factor in the regression analysis. 11 It would seem that the use of nonionizing imaging such as DMS could provide important prognostic information for patients at risk for coronary artery disease and is worth further investigation.
Finally, it is important to consider that the present study’s cohort were cancer survivors. The hope is that correctly classifying cancer survivors will set goals for reducing their risk for cancer reoccurrence. Balentine et al 20 followed 61 postsurgical patients who had a pancreatic adenocarcinoma and found that preoperative BMI was not a predictor of survival but that intra-abdominal fat thickness was the best predictor of survival. 20 In the Balentine et al. study, CT was used to measure from the inferior edge of the left kidney to the abdominal wall to obtain the intra-abdominal fat depth. Although intra-abdominal fat thickness was highly correlated to overall survival for these pancreatic cancer patients, the use of ionizing radiation limits the translation of this work for a screening technique.
The use of DMS to objectively measure adiposity has a potential important role to play in screening patients for their risk of cardiovascular disease as well as certain cancers. The current study is limited because of the research design and the statistical power; however, it provides additional low-level evidence of the types of DMS measurements that are feasible to use in screening patients. Continued research is needed to determine what combination of variables and/or ratios might be of importance in screening obese patients for disease. Certainly, BMI continues to be suspect as a means for categorizing patients, as has been discussed in the articles provided, but it proved to be limited in its relationship to visceral fat deposits. The interrater reliability of these measurements would indicate that these DMS imaging metrics can be reliably completed by sonographers of varied experience. It would be important to provide appropriate training for clinicians so that reliable measures could be collected for all five variables of interest.
This cohort study adds to the evidence that DMS has an important potential role in providing nonionizing screening for obesity and informing patients on the need to reduce this risk factor. It also points to the potential for this technique to be used to screen children and adolescents for abdominal adiposity.
Footnotes
Acknowledgements
The research team would like to thank our research interns, Paige Mathewson and Shivatej Dubbaka, who assisted on this project. We also appreciate the statistical support provided by Xueliang (Jeff) Pan, PhD.
Declaration of Conflicting Interests
The authors declared no potential conflicts of interest with respect to the research, authorship, and/or publication of this article.
Funding
The authors received no financial support for the research, authorship, and/or publication of this article.