
Abstract
Focal liver lesions often occur with or without an underlying liver disease. Contrast-enhanced ultrasonography can aid in characterizing liver lesions, potentially avoiding biopsy and computed tomography procedures. Contrast-enhanced ultrasonography has a high sensitivity and specificity for differentiating characteristics of liver lesions compared with noncontrast sonography. The different contrast characteristics aid in differentiating benign and malignant lesions. Malignant lesions tend to have washout of contrast in the venous phases, whereas benign lesions have hyperenhancement during the venous phases. Therefore, contrast-enhanced ultrasonography should be considered an essential component of the diagnostic process for diagnosing and following focal liver lesions.
Introduction
Gray-scale, or B-mode, sonography is the modality of choice when screening for liver disease.1–4 Benign lesions occur in about 20% to 50% of the population on autopsy series. 5 Among all benign lesions, hemangiomas occur the most frequently, in up to 7.3% of the population. 6 Approximately 73% of all benign liver tumors are cavernous hemangiomas. 7 Focal nodular hyperplasia (FNH) is the second most commonly occurring benign liver lesion but is the most common liver tumor without a vascular etiology. 8 Focal nodular hyperplasia occurs in approximately 1% to 3% of the population9,10 and accounts for approximately 8% of all hepatic tumors.1,11 The most frequently occurring primary malignant liver lesions are hepatocellular carcinoma (HCC) and metastasis.1,12 Hepatocellular carcinoma occurs in 9 of 100 000 men and 3 of 100 000 women annually in North America. 13 Patients with cirrhosis and hepatitis B and C are most at risk for developing HCC.9,12 Metastatic disease of the liver is the most common malignant disease of the liver. 14
Conventional gray-scale sonography has a low detection rate of 50% for focal liver lesions (FLLs) and is not particularly sensitive in determining malignant from benign disease.15–17 Furthermore, it can be difficult to determine primary tumors versus metastases, which is an important differentiation because treatment choices depend upon the distinction. Accurate diagnosis is essential for proper treatment and optimal patient outcomes. Because of the low accuracy rate of gray-scale sonography, patients typically need additional imaging such as contrast-enhanced computed tomography (CECT), contrast-enhanced magnetic resonance imaging (CEMRI), or an imaging-guided needle biopsy to confirm the diagnosis.
Currently, CT and liver biopsy (either sonographically or CT guided) are the best ways to obtain the most accurate diagnosis of a liver lesion. However, sonography is the least expensive and safest imaging modality because of the lack of ionizing radiation. A majority of liver lesions are benign, and therefore, efforts to improve sonography’s ability to classify and follow liver lesions are desirable. In Europe and Asia, improved diagnostic accuracy is achieved with contrast-enhanced ultrasonography (CEUS). Contrast-enhanced ultrasonography can help determine the type of lesion by visualizing the blood perfusion patterns in a similar manner to CECT and CEMRI and is used in Europe and Asia successfully to characterize FLLs. Therefore, increased use in the United States could bring improvements in sonography’s ability to characterize FLLs as malignant or benign as well as offer improved overall patient care and disease management. 18
Gray-Scale Ultrasonography of Focal Liver Lesions
Hemangioma
Hemangiomas are highly vascular masses that are composed of tiny vessels and epithelial cells. Hemangiomas typically remain stable in size over time, are usually asymptomatic, and require minimal screening and management. 19 As a result of recent advances in technology, hemangiomas are more frequently found incidentally during liver imaging. 19 Hepatic hemangiomas commonly appear as an isolated hyperechoic mass, and 65% appear with a hyperechoic rim.7,19 Posterior enhancement is associated with liver hemangiomas in 24% of cases.7,19 They are usually located near the portal or hepatic veins 7 and typically measure 9 < 3 cm. If the lesion is large, it may have a complex heterogeneous echogenicity due to necrosis, hemorrhaging, or scarring 19 (Figure 1). Areas of necrosis will appear hypoechoic or anechoic, and scarring will appear as a hyperechoic linear structure. Other varied appearances include mixed echogenicity, hypoechoic, isoechoic to liver, hypoechoic band, and irregular shape. 19 Furthermore, patients can present with multiple or large, > 10 cm hemangiomas, which can confuse the diagnosis with malignant lesions. 7 Color Doppler typically does not detect flow within the lesions due to the microvasculature and slow flow, but blood flow in the central portion of the mass has been reported7,19 (Figure 2). Although sensitivity 7 for detecting hemangiomas has been reported as high as 97%, accuracy rates between 52% and 72% are more frequently reported4,17,20 (Table 1). Given the variations in appearance and the low accuracy rates, gray-scale sonography alone cannot confidently diagnose liver hemangiomas.
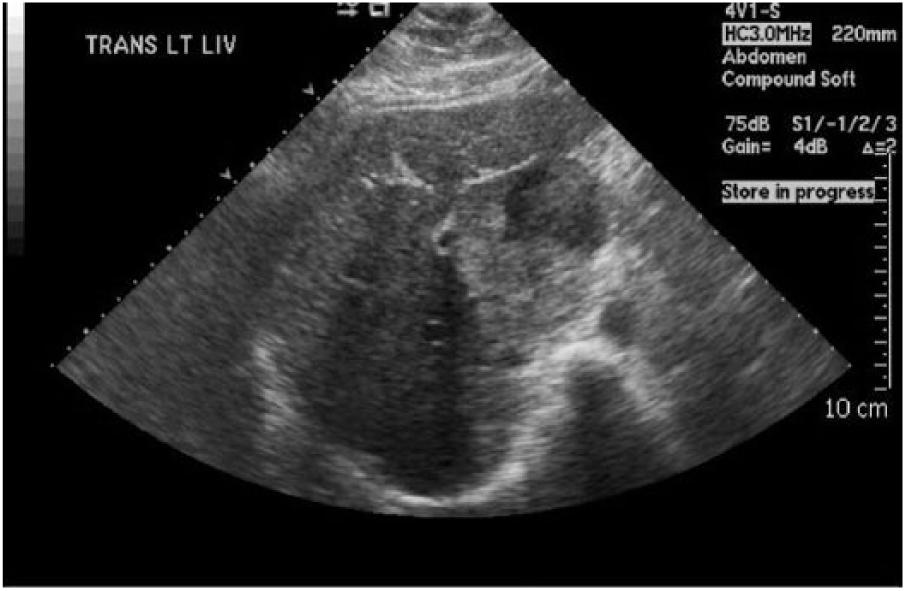
Large hemangioma of mixed echogenicity.
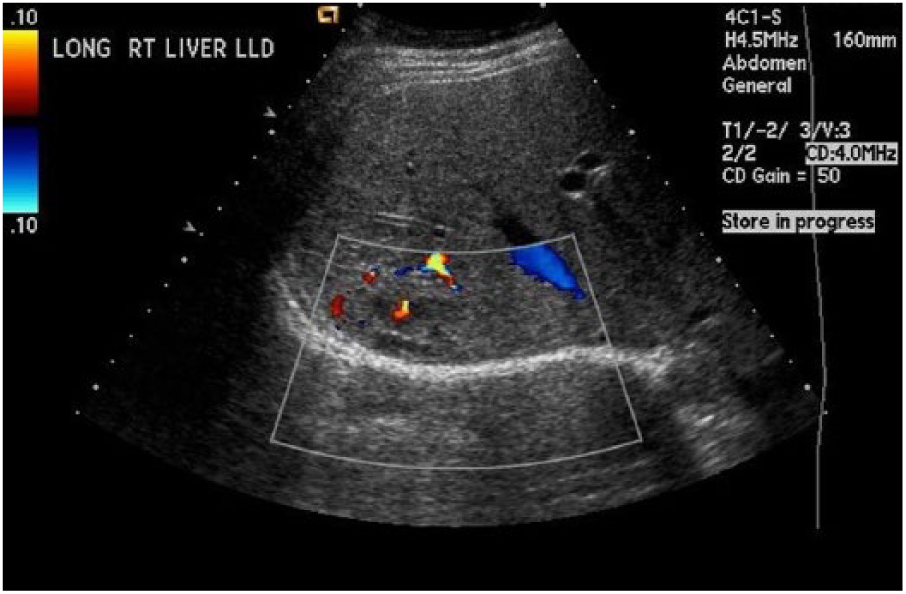
Isoechoic hemangioma demonstrating minimal color flow.
Accuracy Rate for Liver Lesions With 2D Sonography.
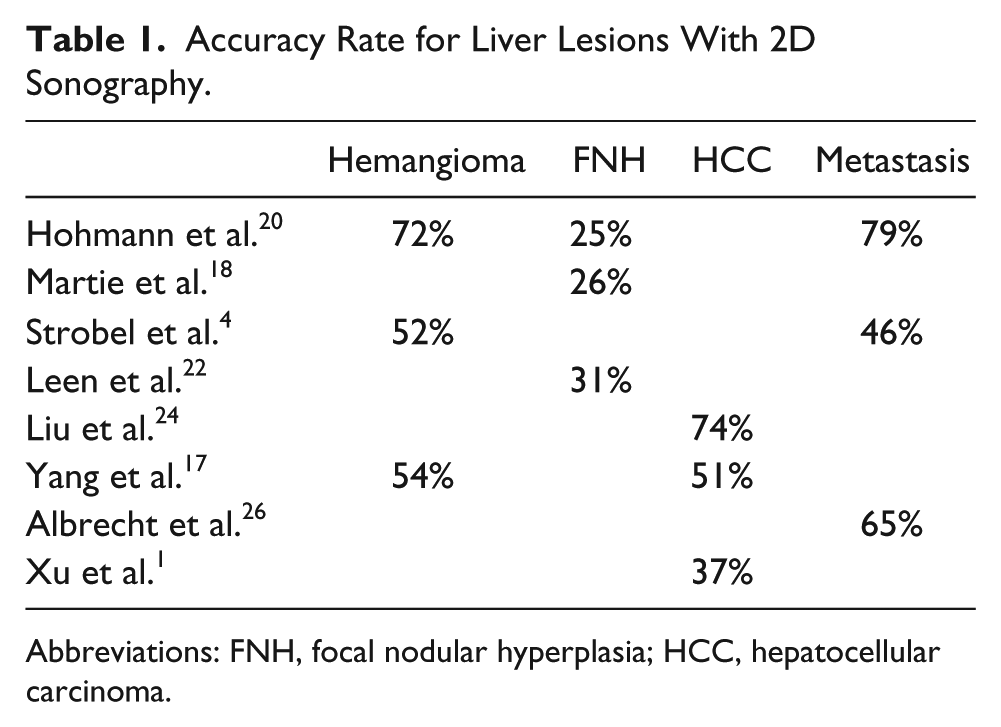
Abbreviations: FNH, focal nodular hyperplasia; HCC, hepatocellular carcinoma.
Focal Nodular Hyperplasia
Solitary FNH lesions are typically located in the right lobe of the liver 76% of the time. 10 The lesion results as a consequence of a hyperplastic process rather than a neoplastic process; therefore, it is considered a benign lesion. 10 The morphology and composition of FNH are varied. 10 Histologically, the most frequent type of FNH is composed of abnormal nodular tissue, malformed vessels, and bile duct proliferation, but the variation in internal structure and composition can make it difficult to diagnose with sonography. 10
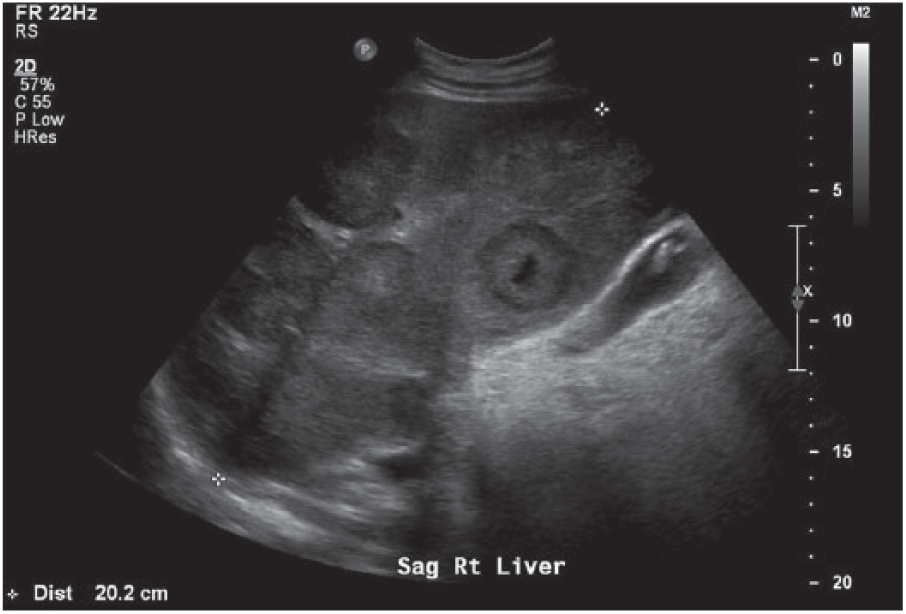
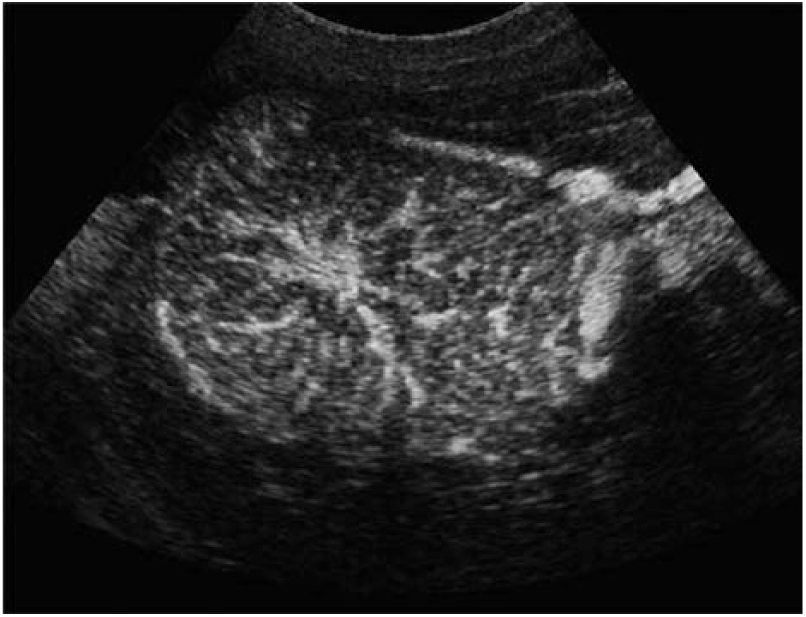
Focal nodular hyperplasia generally appears as a homogeneous, isoechoic, or faintly hyperechoic lesion on gray-scale sonography.9,21 A classic feature of FNH is a hypoechoic central scar, which often represents a central feeding artery 11 (Figure 3). The spoke-wheel pattern is also a common sonographic feature and appears on color Doppler in approximately 35% of lesions. 11 The spoke-wheel pattern is not always visualized with sonography, especially if the lesion is located deep in the liver 11 (Figure 3). A hypoechoic halo around the lesion has been noted in 32% of FNH cases, which can cause the lesion to be misdiagnosed as a liver metastasis. 21 The accuracy rates in diagnosing FNH with gray-scale sonography range from 25% to 31%18,20,22 (Table 1). The low accuracy rates and inconsistent appearances render gray-scale sonography insufficient for diagnosing and following FNH.
2D image of focal nodular hyperplasia 9 (large arrows) appears isoechoic or slightly hyperechoic in texture with a hypoechoic central scar (small arrow).
Hepatocellular Carcinoma
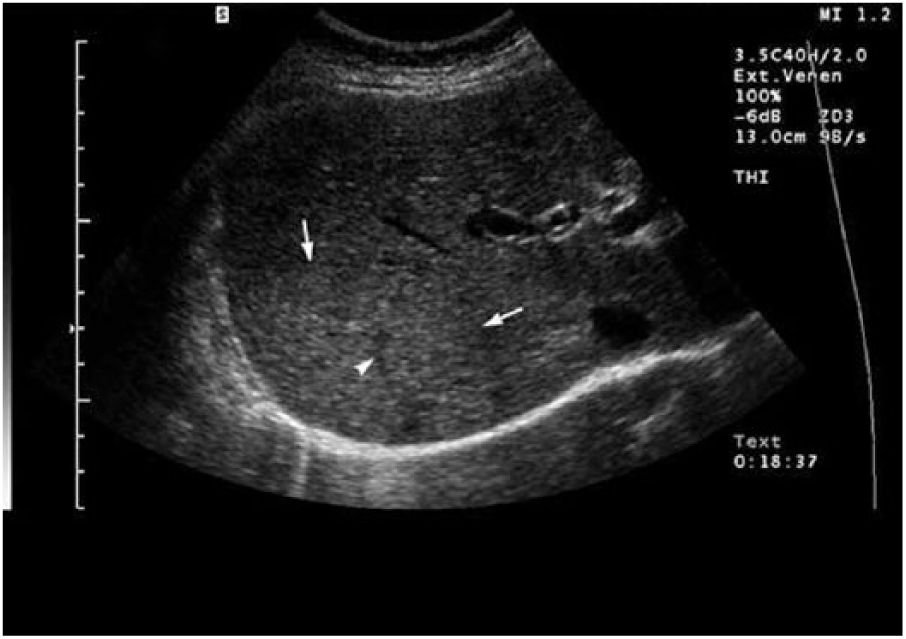
The sonographic appearance of HCC varies with the size of the mass. Large tumors appear as inhomogenous hyperchoic masses. 9 It is common for necrosis, hemorrhaging, and fibrosis to occur in larger tumors. 9 Necrosis usually occurs in the center of the lesion. 9 The fibrotic and hemorrhagic changes that occur within a large HCC can contribute to the lesion eventually becoming echogenic. 9 Small lesions often appear echogenic with a hypoechoic halo sign around the tumor, making it difficult to distinguish from large regenerative nodules (> 2 cm).9,23 Furthermore, these sonographic findings are also seen with atypical hemangiomas and with FNH lesions.
Hepatocellular carcinoma tumors typically have arteriovenous shunts within the tumor that connect the arterial supply to the venous drainage. 12 With Doppler sonography, HCC appears hypervascular with chaotic blood flow, often appearing in a “basket pattern” with color Doppler. 9 Accuracy rates1,17,24 for the detection of HCC range from 37% to 74% (Table 1). Gray-scale sonography alone is insufficient to confidently diagnose HCC (Figure 4). When used in conjunction with alpha-fetoprotein screening, gray-scale sonography can improve the ability to detect and diagnose HCC, but the increased detection rate is not justified by the cost of approximately $8400 per case of HCC detected. 25 Therefore, CECT or CEMRI may be preferred as the screening imaging modality over gray-scale sonography.
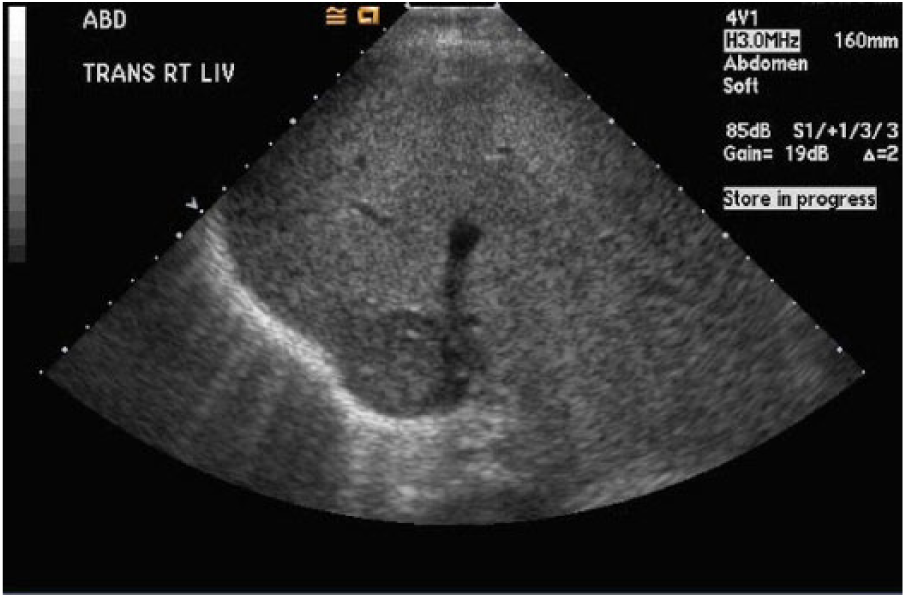
Hepatocellular carcinoma hypoechoic lesions with hypoechoic halo causing inferior vena cava compression and thrombus.
Metastasis
Metastatic disease to the liver is common due to the dual blood supply from the portal vein and the hepatic artery. The liver’s role in metabolism and waste removal creates an optimal environment for rapid tumor growth. 26 In patients with a known cancer, 20% to 25% will have metastasis to the liver. 9 The most common origin is in the colon, followed by gastric, pancreatic, breast, and lung.9,26
The gray-scale appearance of metastases can vary depending on the location of the primary tumor. Metastases typically appear as multiple or solitary iso- or hyperechoic masses and often are accompanied by a hypoechoic halo in the liver 9 (Figure 5). Primary tumors from colon, neuroendocrine, renal, and choriocarcinoma cancers typically appear echogenic. 9 Primary tumors originating from the breasts, lungs, lymphatic system, or pancreas usually appear hypoechoic. 9 Liver metastases could also appear to have cystic or calcium components, and this appearance is typically associated with colon, stomach, and breast cancers. 9 Accuracy rates3,20,26 for the diagnosis of liver metastases by gray-scale range from 46% to 79% (Table 1). Given the varied sonographic appearance and low detection rates, gray-scale sonography alone cannot definitively diagnose metastatic lesions in the liver.
Liver metastasis: colon cancer primary tumor; multiple hypoechoic lesions with hypoechoic halo.
Contrast-Enhanced Ultrasonography for Liver Imaging
Microbubble Characteristics
Sonographic contrast agents are microbubbles that consist of high molecular weight gases that are encased in a stabilized, elastic shell. 3 The microbubbles interact with the ultrasound wave at low pressures (low mechanical index [MI]), creating a nonlinear or harmonic response that can be imaged by the ultrasound system when using contrast detection settings. 27 Although current generation ultrasound contrast agents are formulated to operate across a very wide range of transducer transmit frequencies, the strongest returning signals are typically within lower frequency ranges.
The microbubbles are small enough to pass through the pulmonary system and can be distributed through the entire vascular system. The microbubbles are introduced intravenously by either slow infusion or bolus injection and will be taken up by the microcirculation in the liver.3,27 In comparison with CT and MRI contrast agents, which rapidly move into the extravascular spaces and are expelled via the kidneys, these microbubbles remain in the vascular spaces and are expelled primarily via respiration. 27 They have the additional advantage that they are retained in the liver spaces for longer periods, thus enabling longer imaging times, as much as 3 minutes or more over a single lesion. 27 The microbubbles are safe and offer no risk of nephrotoxicity as well as a low rate of adverse effects.3,27 The primary risk with ultrasound contrast agent 28 in the liver includes anaphylaxis, which occurs at a rate of less than 0.0001. The safety of the ultrasound contrast agent is an advantage for patients who have contraindications for CT or MRI contrast agents, such as decreased kidney function or allergies.3,27
Sonographic Features of Contrast Enhancement
Contrast-enhanced ultrasonography has the ability to characterize liver lesions as benign or malignant, similar to the way CECT and CEMRI characterize liver lesions. However, CECT and CEMRI provide static images of the lesions as they uptake the contrast agents, in comparison with sonography, which can image lesion contrast uptake in real time. Thus, a diagnosis can be rendered quicker with CEUS. The primary limitations with CEUS are similar to those with gray-scale imaging, including liver lesions less than 2 cm, the presence of fatty liver disease, lesions that are obscured by intercostal imaging, and large patient body habitus. 28
The sonographic patterns of the contrast agent imaging are identified in Table 2 and include hyperen-hancement, isoenhancement, and hypoenhancement. 28 Hyperenhancement is caused by an increase of blood perfusion to the FLL, making it appear brighter than the surrounding liver tissue. 27 Isoenhancement occurs when the FLL has enhancement properties similar to liver tissue. 8 Hypoenhancement occurs when less contrast is perfused in the FLL compared with the normal liver tissue; therefore, it will appear darker than liver tissue. 28
Contrast-Enhanced Ultrasonography Characteristics of Focal Liver Lesions.
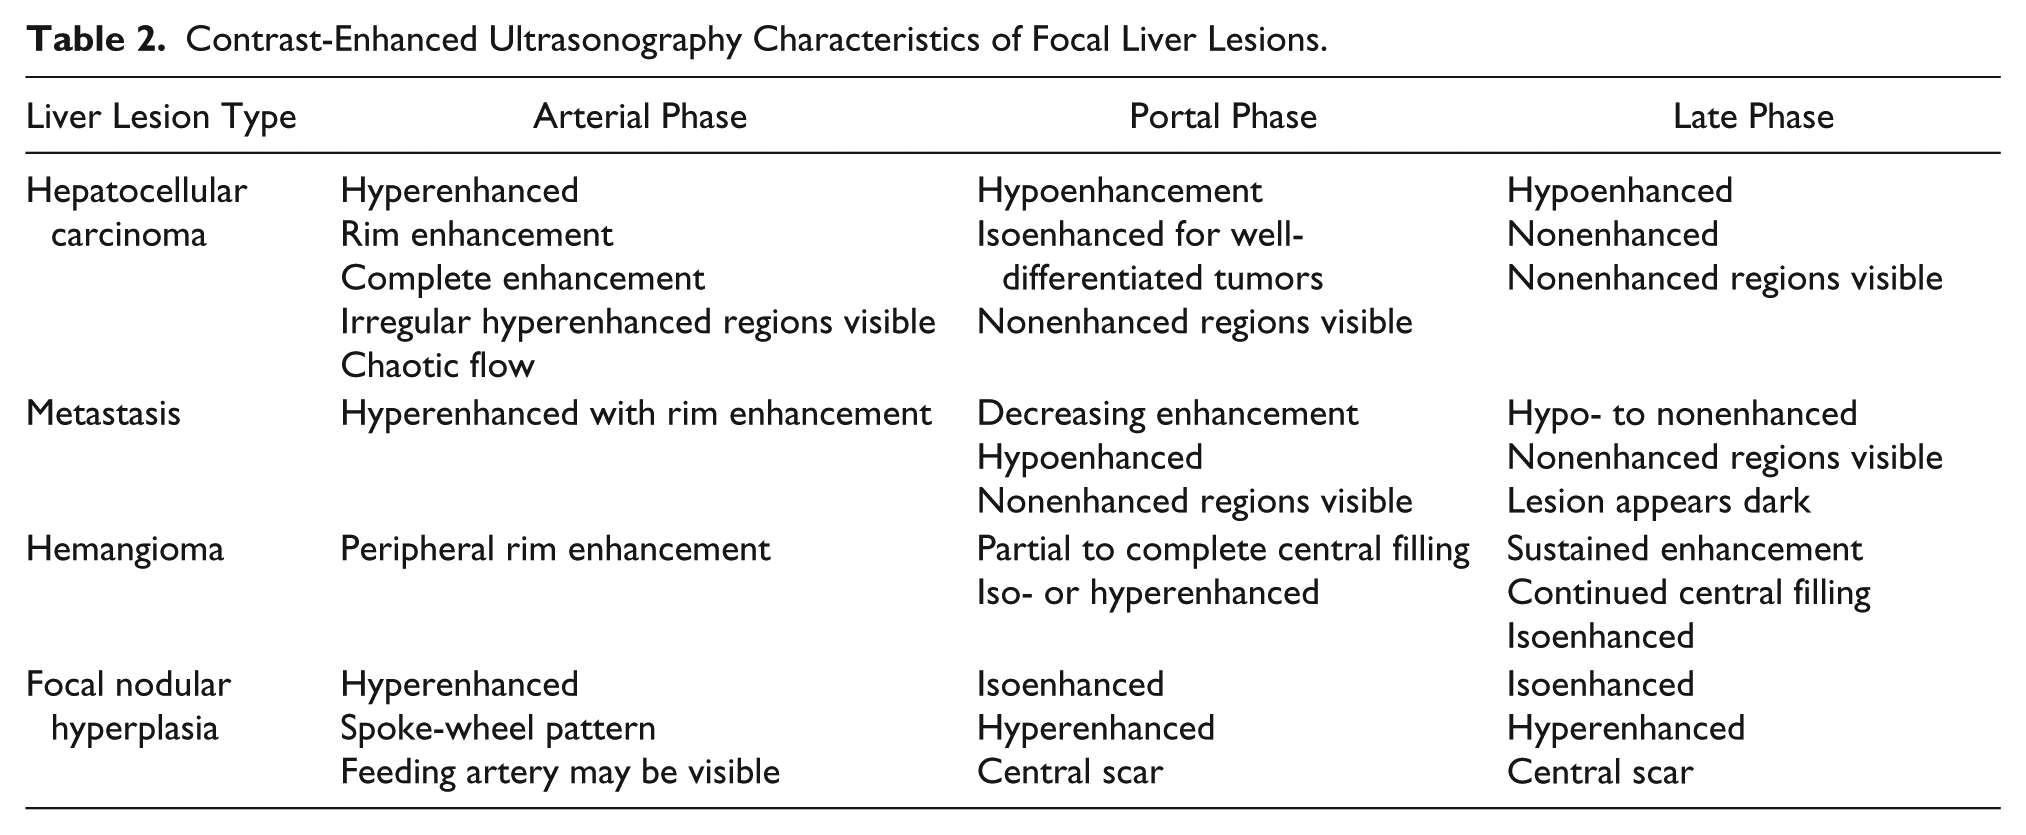
When contrast is injected into the vascular system, the liver lesions are perfused in three phases: arterial, portal, and late venous phases (Table 2). The arterial phase occurs within 20 to 45 seconds after injection, and times may vary depending on the patient’s circulatory status. 28 In this phase, the contrast enters the liver via the hepatic artery and provides information about the degree of arterial vascularity within a liver lesion. 28 The contrast characteristics that occur during the arterial phase are used to further determine the specific type of lesion.2–4,28
The second phase is called the portal phase. During this phase, the contrast will continue through the arterial system into the portal system within approximately 46 seconds to 2 minutes postinjection. 28 This phase is important because lesions comprising normal liver tissue tend to be connected to the portal system, whereas abnormal lesions such as carcinomas and metastases are more typically connected to the arterial system. The late venous phase is usually described as 4 to 6 minutes after the contrast is injected. 28 During the late venous phase, the contrast will gradually diffuse throughout the liver parenchyma. 28 Both venous phases are important because information is provided about whether a lesion is malignant or benign; in particular, lesions that maintain contrast enhancement during these phases are more likely to be benign.2–4,20,28 In addition, some contrast agents may allow for a postvascular phase that begins 10 minutes postinjection and can last up to 1 hour. 28
Most lesions have a predictable contrast uptake pattern that aids in characterizing the type of lesion. Most lesions, whether benign or malignant, have some contrast uptake in the arterial phase that includes rim enhancement or enhancement toward the center of the lesion. 3 However, observation throughout the portal and late venous phases allows for the differentiation between malignant and benign lesions. In general, benign lesions have iso- or hyperenhancement during the portal and late venous phases, whereas malignant lesions have noticeable washout (contrast leaving the lesion) or lack of enhancement during the portal and late venous phases 28 (Table 2).
Lesion Characteristics With CEUS
Hemangioma
Hemangiomas typically show peripheral rim enhancement during the arterial phase3,17,26,28 (Table 2) (Figure 6), and during the venous phases, the contrast will slowly begin to fill centrally. Xu et al. 1 reported that up to 95% of hemangiomas have peripheral rim enhancement in the arterial phase. They will typically appear hyperenhanced or isoenhanced in comparison with the liver after approximately 1.5 minutes postinjection and may have sustained enhancement through the late venous phase 28 (Figure 7). Xu et al. 1 reported 100% of lesions having hyperenhancement in the portal phase. From the portal to the late venous phase, hemangiomas typically show continued central filling.1,22 However, the size of the lesion may impact how rapidly filling occurs, with smaller lesions filling faster and some large lesions requiring 10 minutes or more to completely fill. 26 Leen et al. 22 reported that approximately 96% of hemangiomas appear completely filled with contrast and hyperenhanced in the late venous phase, and a lesion with late phase enhancement has a 95% probability of being benign. The accuracy rates2,4,17,20 for the diagnosis of hemangiomas with CEUS range from 82% to 95% (Table 3). The diagnostic accuracy for CEUS is improved over gray-scale sonography.
Left: Hemangioma with contrast-enhanced ultrasonography image representing the global peripheral enhancement during the arterial phase. Right: Echogenic hemangioma with 2D ultrasound.
Left: Sonographic image of echogenic hemangioma with associated contrast-enhanced ultrasonography representing the partial/complete fill in during the portal and late venous phases. Right: Echogenic hemangioma with 2D ultrasound. Image courtesy of Serra & Cipollini. 31
Accuracy Rate for Liver Lesions With Contrast-Enhanced Ultrasonography.
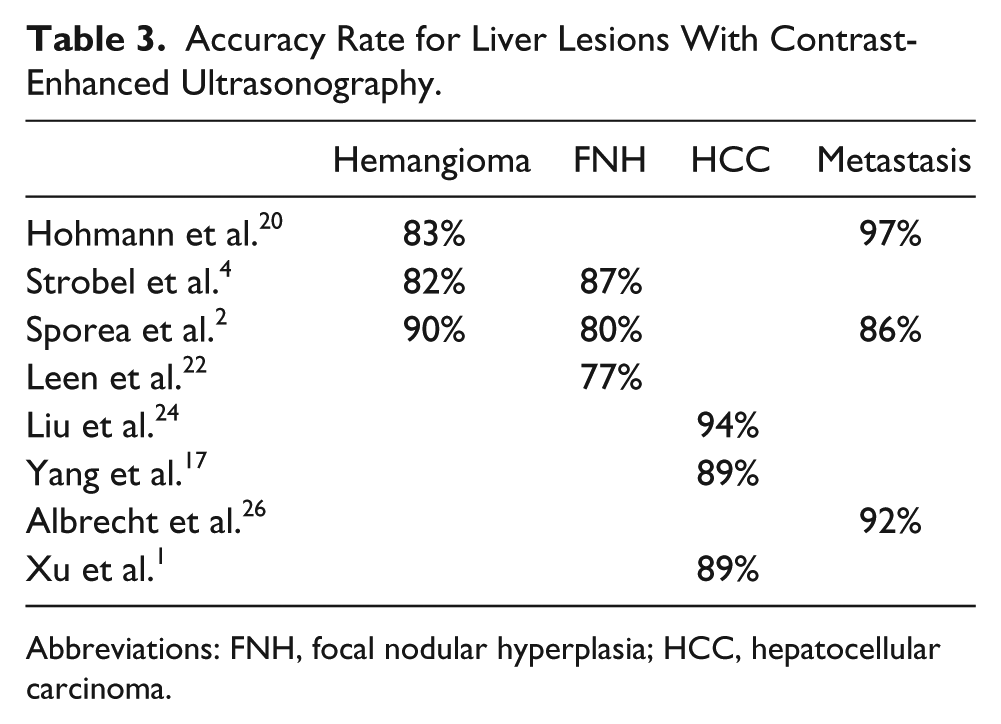
Abbreviations: FNH, focal nodular hyperplasia; HCC, hepatocellular carcinoma.
Focal Nodular Hyperplasia: Contrast Sonography
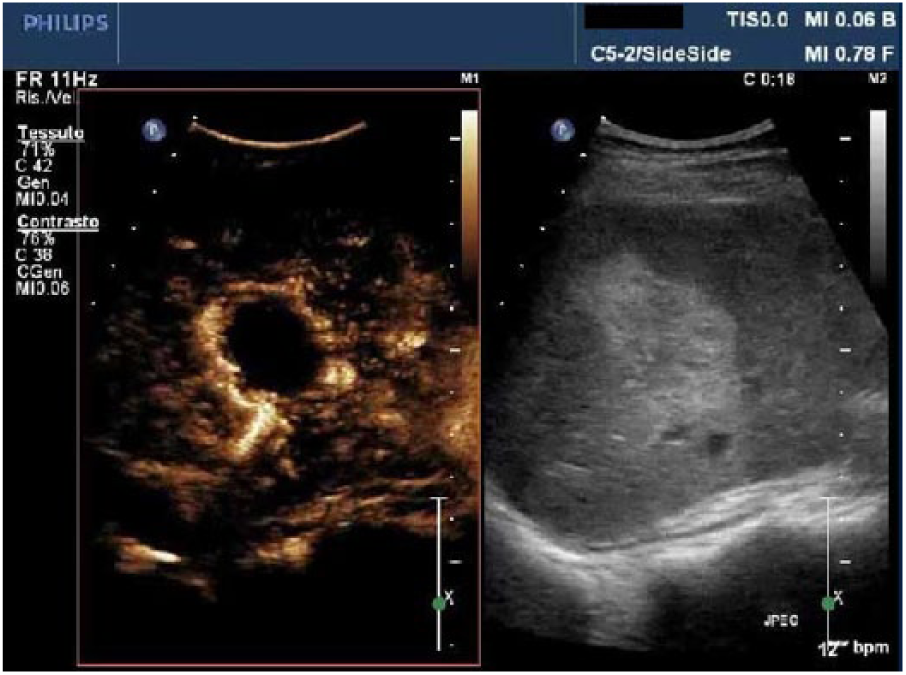
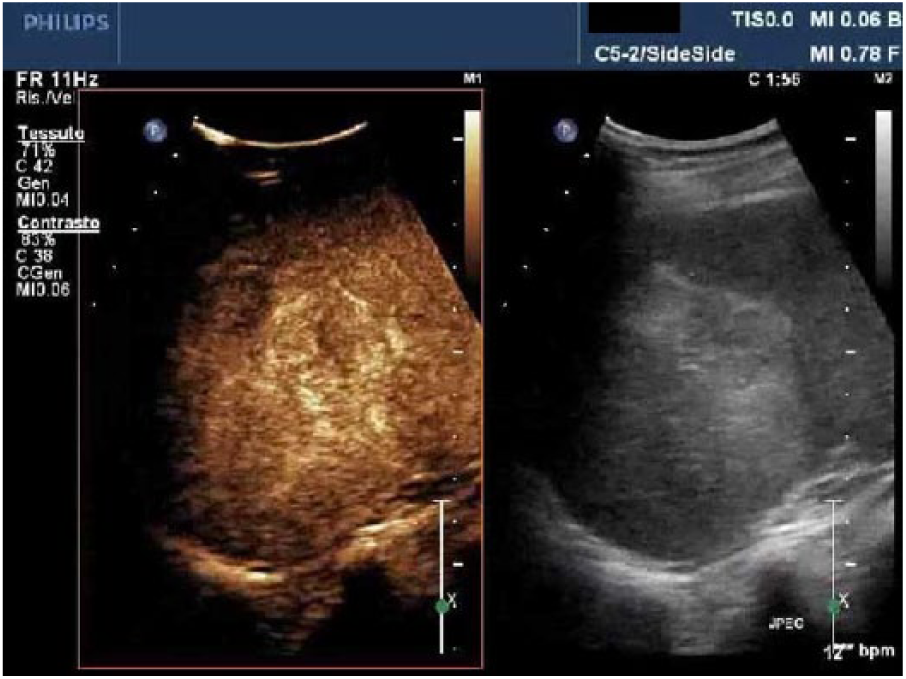
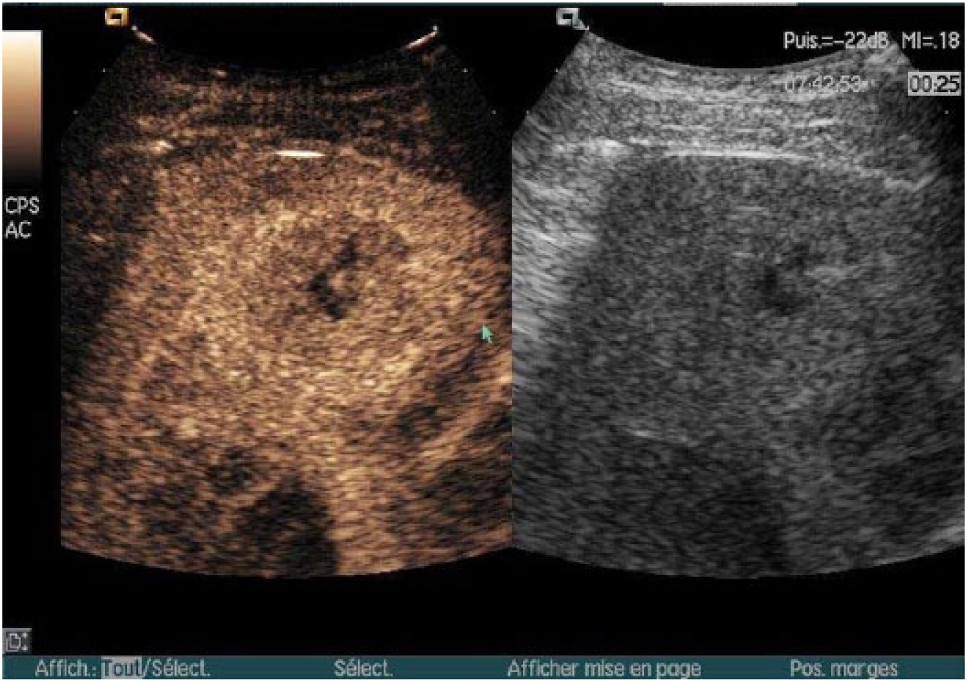
The typical enhancement pattern of FNH with CEUS is an early hyperenhancement with a spoke-wheel pattern during the arterial phase. 28 The spoke-wheel pattern during the arterial phase has been reported in 50% to 87% of FNHs.3,26 Strobel et al. 4 noted that 66% of FNHs appear with a central feeding artery (Figure 8). There may be an iso- or hyperenhanced central scar throughout the portal and late venous phases 28 (Table 2). The late venous phase is useful in diagnosing FNH because the lesion will be isoenhanced compared with liver tissue, and the central scar may appear more prominent, thus allowing it to be differentiated confidently from a metastasis. 26 Accuracy rates ranging from 77% to 87% have been reported for the diagnosis of FNH with CEUS, demonstrating that the use of CEUS offers improved ability to diagnose FNH2,3,22 (Table 3).
Contrast-enhanced ultrasonography image of focal nodular hyperplasia representing the spoke-wheel sign with a central feeding artery during the arterial phase. 9
Hepatocellular carcinoma
The typical contrast pattern of HCC is chaotic hyperenhancement during the arterial phase, and in some cases, there can be rim enhancement 28 (Figure 9). Irregular vascularization in the arterial phase occurs between 50% and 95% of the time.1,3,23 The chaotic arterial flow is due to arteriovenous shunts that are frequently present within HCC tumors. 4 During the portal phase, HCC most frequently presents with hypoenhancement. Xu et al. 1 reported hypoenhancement in the portal phase at a rate of 80.4%. In the late venous phase, HCCs are most frequently hypoenhanced or nonenhancing.1,3,28 Additional potential appearances include nonenhancing regions and inhomogeneous enhancement. 28
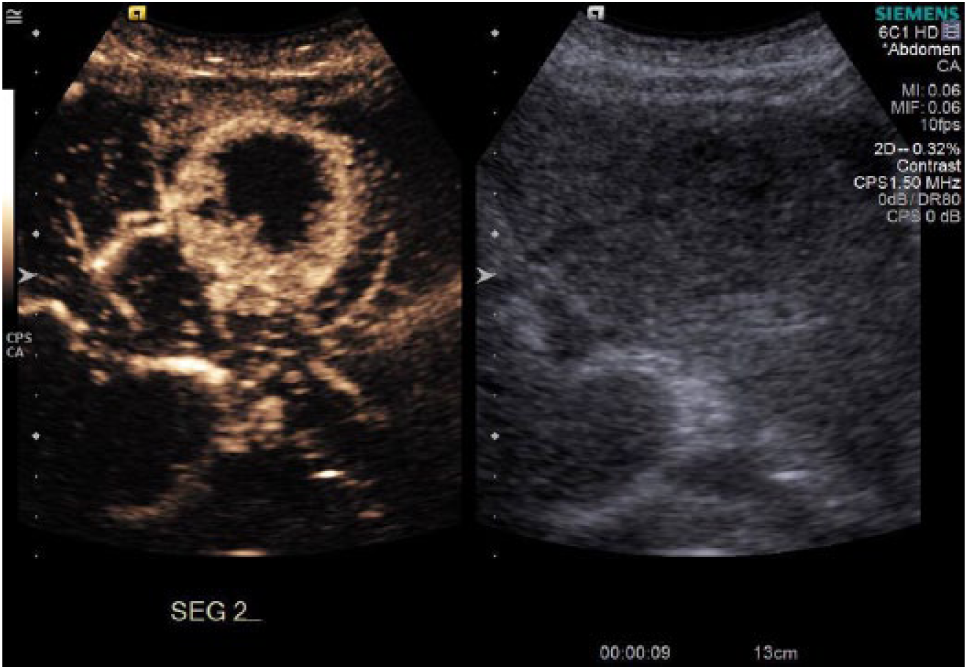
Live dual contrast-tissue display obtained 9 seconds after injection. Contrast demonstrates hyperenhanced irregular hepatocellular carcinoma rim in arterial phase.
Isoenhancement can sometimes occur in the portal venous and late venous phases but typically only when the HCC is well differentiated. 4 Due to the cells being more mature, the contrast does not wash out of the tumor as fast during the venous phases. 23 Hepatocellular carcinomas are subject to having areas of necrosis that appear anechoic with no contrast agent uptake. 2 The reported accuracy rates1,17,24 for CEUS in diagnosing HCC range from 89% to 94% (Table 3).
Metastasis
The contrast enhancement pattern of metastases can vary during the arterial phase based on the original tumor type. 3 The most common enhancement characteristics are hyperenhancement earlier than the liver parenchyma and an irregular and chaotic vascular pattern with enhancement of the peripheral rim during the arterial phase3,24,28 (Table 2) (Figure 10). Strobel et al. 3 reported irregular vascularization occurring 50% of the time in metastatic lesions. Xu et al. 1 noted that peripheral rim enhancement in the arterial phase occurred in approximately 52% of cases, whereas Strobel et al. 3 noted this finding in 25% of cases. Albrecht et al. 26 found that rim enhancement occurred mostly with metastases from colorectal and bronchogenic cancer. Primary cancers that appear hyperenhanced with chaotic flow in the arterial phase include melanoma, small cell lung cancer, thyroid carcinoma, neuroendocrine carcinoma, and breast cancer. 26
Sonographic image of liver metastasis showing hyperenhancement and rim-like enhancement during the arterial phase. Image courtesy of Lucidarme. 29
The portal and late venous phases must be assessed to differentiate metastases from benign lesions.3,4,26 Between 76% and 95% of metastatic lesions will have hypoenhancement or no enhancement during the early portal to late venous phases1,3 (Figure 11). Albrecht et al., 26 Hohmann et al., 20 and Yang et al. 17 found an accuracy rate of 92%, 97%, and 91%, respectively, for correctly diagnosing liver metastases with CEUS. Sporea et al. 2 found a lower accuracy rate of 86% for CEUS (Table 3).
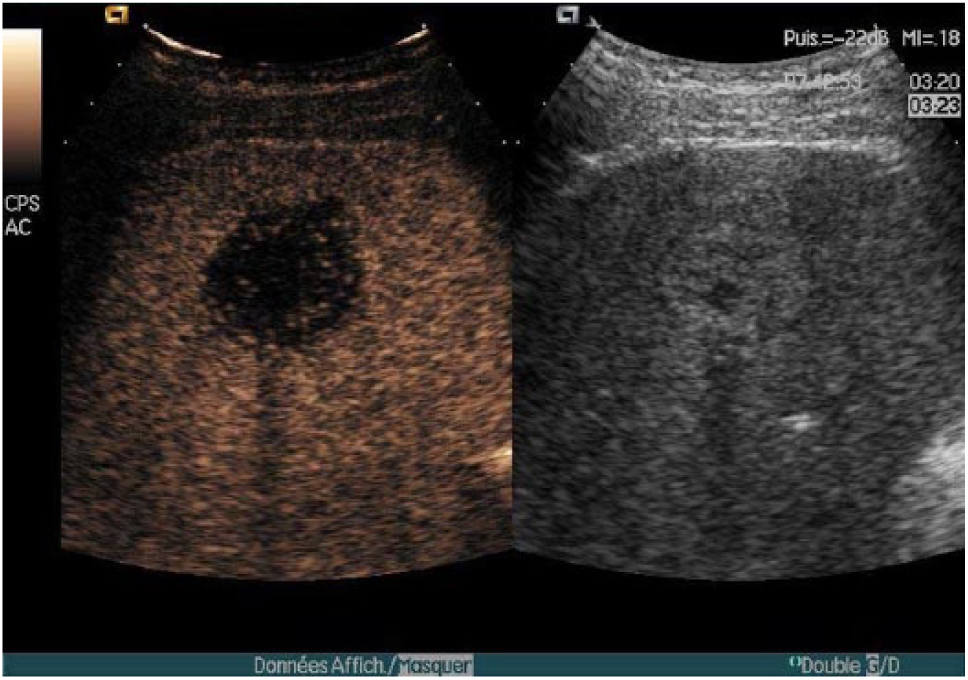
Sonographic image of liver metastasis showing hypoenhancement during the portal and late phases. Image courtesy of Lucidarme. 29
Overall diagnostic accuracy3,17,18,20,24 of CEUS to identify and classify FLLs ranges from 83% to 97%. Sporea et al. 2 reported a 90% diagnostic accuracy rate when classifying lesions as malignant or benign, whereas Strobel et al. 3 were able to accurately classify malignant lesions 95% of the time. Strobel et al. 3 and Yang et al. 17 accurately classified hemangiomas, respectively, 82% and 95% of the time and HCC 85% and 93% of the time, and both accurately diagnosed metastases 91% of the time. Strobel et al. 3 reported diagnostic accuracy for FNH at 87%. Leen et al. 22 determined that the number of indeterminate diagnoses was reduced by 67%. Hohmann et al. 20 determined that the sensitivity of diagnosing FLLs could be improved from 66% to 96% with the addition of CEUS, whereas Bartolotta et al. 11 noted that with the addition of CEUS, readers’ sensitivity was 100% and specificity was between 96% and 97%. The diagnostic accuracy rates and improvements in sensitivity and specificity observed with CEUS are greater than those associated with gray-scale sonography alone. Therefore, the addition of CEUS after gray-scale sonography can improve FLL characterization. Contrast-enhanced ultrasonography is an excellent addition to liver imaging and could become the standard protocol for liver imaging in the sonography department.
Preparations for Performing Contrast-Enhanced Ultrasonography
Ultrasound Equipment and Transducers
It is important that the ultrasound system used for liver contrast imaging is equipped with the manufacturer’s latest contrast agent imaging package. The specific packages may include specialized software, hardware, or both. The contrast agent package will typically include specialized contrast-specific pulsing schemes, unique display modes such as live dual or contrast side-by-side displays, contrast timer functions, capability for extended clip capture and display (usually 3-5 minutes), and optimized liver contrast imaging presets. It is necessary for the sonographer to be familiar with the user controls, especially those controls that are used only during a contrast agent study. Once the contrast agent dose is administered, there is no opportunity to consider scanner control locations because the agent courses through the patient’s body immediately after injection.
Certain transducers are identified as contrast agent capable, depending on the system model and the version of software that is installed. Be certain that the transducers intended for contrast imaging have contrast mode capabilities. Continual quality assurance on transducers is essential, as the examination quality will depend on fully functioning transducer elements. A poorly functioning transducer may show only minimal artifact in standard imaging modes but may have significant operational shortcomings when in contrast agent imaging mode. Consultation with the system manufacturer service representatives to ensure that the ultrasound system and transducers are in proper working order is advisable prior to beginning a contrast imaging program in the department.
Pharmaceutical Administration Considerations
Consultation with the pharmaceutical representative should occur well before introducing contrast imaging into the department. The local contrast agent pharmaceutical representative should provide details of the agent properties, activation procedure, agent duration, injection needle size, number of injections per study, rate of administration, and so on. Although dosing is specific to the agent being used, a typical dose for adult liver lesion characterization is 2.4 mL of contrast agent, followed by a 5-mL saline flush. 28 Pediatric liver lesion characterization dosing is based on the patient’s weight: 0.03 mL per kg per injection. 28
Internationally, there are approximately four commercially available, approved contrast agents for liver imaging, but at this time, the only ultrasound contrast agent approved by the US Food and Drug Administration for characterization of FLLs in adults and pediatrics in the United States is Lumason® (also known as SonoVue® outside of the United States). It is provided in a kit form and is easy to activate for injection. The pharmaceutical company provides detailed step-by-step instructions for preparation of the agent, and these instructions should be followed precisely.
Team Development and Responsibilities
The introduction of contrast-enhanced liver imaging into one’s practice is not a difficult approach, especially given the overall benefits of diagnostic speed, reduction of radiation, and potential reduction of cost to provide valuable diagnostic information. A smooth introduction to sonographic liver contrast imaging may be best when a small team is developed within the imaging department. Although the responsibilities for contrast activation and administration may vary from institution to institution, key team members at a minimum should include an experienced sonographer and the radiologist/sonologist responsible for reading and interpreting sonograms. Depending on the organizational structure, a department nurse with experience in intravenous line insertion and contrast agent administration could be a valuable addition to the team to facilitate contrast injection. In the absence of an available nurse, many sites develop a team of two individuals: the person scanning and the person administering the agent. Intravenous line insertion and contrast administration is included in the sonographer’s scope of practice. 30 Becoming proficient in intravenous line insertion and contrast may be advisable. It is optimal for the intravenous line to be placed in the left arm antecubital vein so the sonographer has full access to the patient’s right side for scanning.
Verbal communication is important for the contrast team members. The imaging sonographer must state when the targeted lesion is in the field of view, and the team member responsible for injecting the contrast agent must verbally state when the agent has been administered and when the flush has been administered. The timing of communication is important because the sonographer who is imaging must know when to activate the contrast controls on the system. When communication is clear and concise, the subsequent timing events related to lesion characterization and phases are easily recognized at this point since the contrast timer will be recorded along with the imaging data. The team must also be aware of dosing strategies, which may include the potential for multiple injections, speed of injection, and the potential for adverse reactions (although rare). The contrast agent product data sheet will detail the adverse event history and what symptoms to be aware of during the examination.
The Contrast Examination Procedure
The contrast liver lesion characterization study typically begins with a standard evaluation of the liver to identify the lesion to be characterized. Sometimes, this portion of the study may be referred to as preinjection. At this time, the sonographer should decide on the transducer and patient positions to be used when the contrast agent dose is injected and the lesion uptake patterns are recorded. During preinjection, the sonographer should carefully observe the movement and directionality of the lesion within the image field of view while the patient is in normal respiration. If possible, adjust the transducer position so that the lesion is continuously visible as the patient is breathing. Because clip data are best recorded over minutes, a single breath hold or deep inspiration is impractical. Therefore, the goal will be to have the lesion continuously within the field of view even while the patient is breathing. As opposed to the gray-scale examination, a specific transverse or longitudinal scanning position will be less important for the contrast portion of the study.
Having the patient in a decubitus position is acceptable and is often preferred for liver lesion imaging. Current generation contrast imaging is typically best recorded at a depth not greater than approximately 10 cm. Considerations during the preinjection scanning portion of the study include turning the patient on his or her side, deciding if an intercostal or a subcostal approach is best to visualize the lesion, and deciding the best transducer position that will minimize the depth from the transducer face to the lesion. After a few contrast studies are completed, the sonographer will routinely incorporate these techniques.
It is recommended to provide a unified approach to the various contrast agent timing events as follows:
A team member inserts a 20-gauge needle, for adults, for access to the left arm antecubital vein.
The imaging sonographer completes the preinjection scanning process and selects the ideal patient position and transducer placement.
The imaging sonographer maintains the transducer position over the liver lesion to be characterized.
The imaging sonographer activates the contrast-specific imaging mode and the live dual contrast side-by-side display (often automatically activated) (Figure 12A, B).
A team member injects the appropriate dose of Lumason (adult liver: 2.4 mL over 2 seconds) and follows the injection with a 5-mL saline flush.
The team member who is injecting should clearly verbalize to signal when the flush has been completed.
With this verbal signal, the imaging sonographer activates the clip store function and then immediately starts the contrast timer (Note: Some ultrasound systems require that this sequence be reversed—contrast timer and then clip store) (Figure 12A, B).
The imaging sonographer maintains the transducer position while the contrast agent arrival and enhancement patterns are recorded.
When the study is completed, the data are safely archived for review and subsequent comparison.
The patient is observed for adverse events throughout the procedure.
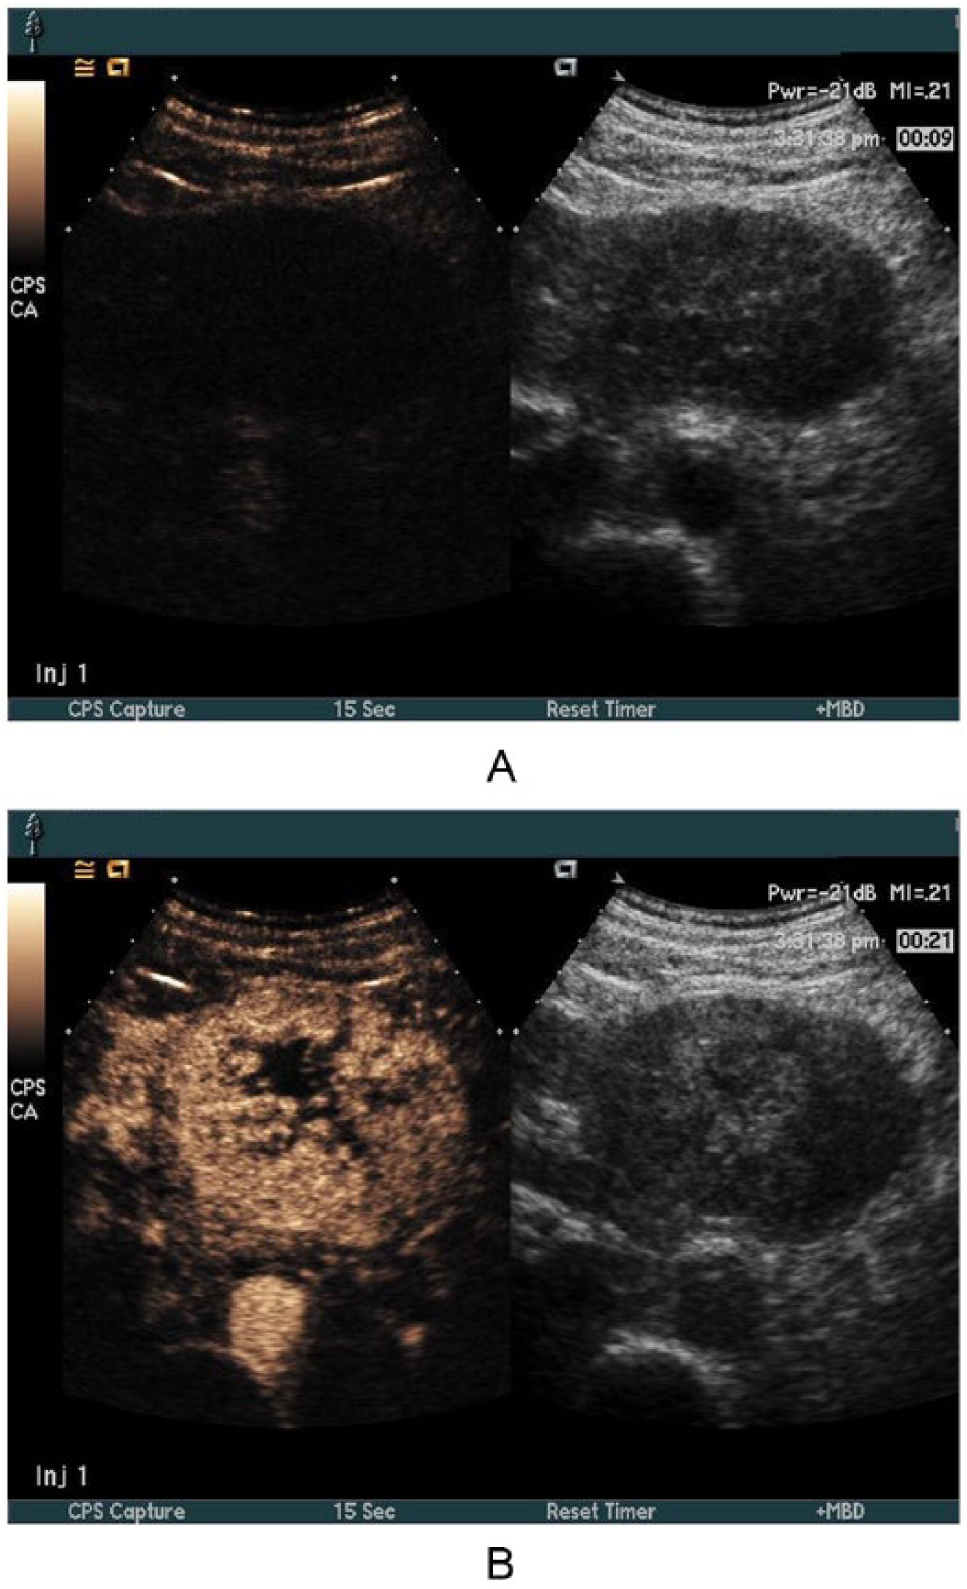
(A) Lesion 9 seconds after injection. The right-side image is used for scanning orientation and the left is used to observe the contrast as it is taken up in the lesion. (B) Contrast-enhanced lesion 21 seconds after injection. Note that the contrast timer appears in the inverse text fields displayed in the upper right.
Additional Considerations
Data archiving and picture archiving system considerations
The sonographer and radiologist will want to discuss data archiving prior to performing the liver contrast ultrasonography. If the ultrasound system is connected to a picture archiving system (PACS), it is necessary to confirm that the PACS device is capable of managing the extended length dynamic clips that will be generated. One recommendation is to record the long contrast agent imaging clips and save them only locally on the ultrasound system during the study. Which diagnostic clip segments should be sent to the PACS device for permanent storage can be decided after the study is complete. Additional storage options include storing all images and clips on a DVD or flash drive. Data archiving strategies should be decided prior to performing the first contrast study.
System control considerations
Certain user controls on the ultrasound system are set or interact differently when a contrast agent study is being performed. Contacting the manufacturer’s representative to identify specific functions is important because some user controls are used only for contrast agent studies and may be unknown to the sonographer prior to performing contrast agent studies. Since ultrasound equipment is updated frequently, the comments presented in this article may change as new ultrasound devices become available. A small number of user selectable controls can have a significant impact on the sonographer’s performance of a contrast liver study and are presented here.
Mechanical index/output power considerations
Although the MI value is often automatically selected for ideal contrast agent imaging when the user invokes the liver contrast agent preset, it is important that the sonographer be familiar with where the MI value is displayed on the image screen. Specifically, the sonographer should know the system controls that automatically influence the MI value, namely, acoustic output power, imaging depth, and transducer and transmit focus position. Some ultrasound systems may automatically adjust the acoustic power output to maintain the MI selected. Other scanners calculate the MI in real time and show the calculation result as one or all of these impacting controls are varied. The sonographer must be aware of the interactions and how they are controlled on the ultrasound system. For adult liver contrast characterization studies with Lumason, the MI value is typically set between 0.02 and 0.22, depending on the ultrasound scanner and transducer used. Mechanical index values that are too high can cause bubble destruction and can interfere with the enhancement patterns, thus leading to possible misdiagnosis.
Transmit focus considerations
Most ultrasound system transmit focus functionalities operate the same way in contrast imaging mode as in standard conventional B-mode. If a system has the ability to vary the position of the transmit focus, it is often best to position the focus at or slightly below the region of interest. However, some systems perform best in contrast mode with the transmit focus positioned deep in the image field, regardless of the location of the lesion.
Transmit zoom considerations
Care should be taken when using a “write zoom” function or using a zoom feature that increases transmit pulsing in order to maximize the number of real data lines within a zoomed region of interest. Increasing the number of transmit data lines may result in increased contrast agent destruction, thereby reducing the enhancement time of the agent. Thus, the potential for misdiagnosis can occur. The determination of whether the zoom feature will impact the image should be discussed with the manufacturer’s representative prior to the introduction of contrast agent imaging into the department.
Live Dual/Contrast Side-by-Side Display Considerations
The live dual display in contrast imaging should provide separation of agent and tissue (Figure 12A, B). The agent side should be nearly void of a signal prior to injection, and it should display a signal as the agent enters the field of view. The tissue side of the display is used only as a reference image for the sonographer to keep the region of interest in the field of view. The sonographer should use the tissue image as a guide as the agent appears and enhances the area of interest.
Conclusion
Overall, CEUS improves the diagnostic accuracy of sonography when characterizing a FLL as malignant or benign. When the proper technique is used, CEUS has a higher accuracy for making the correct diagnosis compared with conventional gray-scale sonography. A correct diagnosis is important for all patients, but especially for those patients with an increased risk for malignancy. The sonographic contrast uptake patterns associated with FLLs are similar to those seen on CT and MRI, with the added benefits of quicker examination time, lowered cost, and better patient safety. With the recent approval for use in the United States, CEUS should be considered part of the standard sonographic protocol when liver lesions are suspected.
Footnotes
Declaration of Conflicting Interests
The authors declared no potential conflicts of interest with respect to the research, authorship, and/or publication of this article.
Funding
The authors received no financial support for the research, authorship, and/or publication of this article.