
Abstract
This preclinical study was conducted to develop discrete sonographic instrumentation settings and also safe contrast dosing that would consistently demonstrate perineural vascularity along the median nerve. This set of imaging studies was conducted with a convenience cohort of young adult female monkeys (Macaca fascicularis). Sonographic equipment settings and dosing were refined throughout the imaging series to ensure consistent contrast-enhanced ultrasound imaging. A mechanical index of 0.13 was consistently used for imaging. Perineural vessels were imaged with a suspension solution of 0.04 mL Definity/0.96 mL saline introduced over 5 minutes for a total dose of 0.8 mL of contrast solution. Blinded studies of high and low dose contrast, along with saline injections, were correctly identified by two experienced sonographers. This preclinical study established adequate equipment settings and dosing that allowed for a valid demonstration of vascularity surrounding the median nerve.
Introduction
Sonographic detection of nerve entrapment has been largely based on the ability to resolve large nerves that demonstrate a hypoechoic appearance and increased dimension due to endoneural edema. 1 The swelling and associated edema that develops due to entrapment and compression are a result of the disruption of the microvasculature at the point of insult. The nerve’s reaction to this microvascular insult is increased blood flow to the perineural and intraneural branches that penetrate the epineurium and serve the endoneurium and underlying fascicles.2–5 Often, the swelling occurs proximal to the site of entrapment and focal point of compression. 6 Unfortunately, some of these vascular physiologic changes resulting from nerve entrapment are often not sonographically evident among patients with chronic nerve entrapment syndromes.
The detection of hyperemia associated with large nerves that have focal compression can be elusive along the course of the nerve. It has been recommended that color Doppler (CD) and power Doppler (PD) imaging be used to detect hyperemic vascularity in the longitudinal perineural plexus and in the intraneural branches3,7 (Figure 1). To this end, researchers have attempted to refine techniques and advocate for the use of CD, PD, and spectral Doppler (SD) for the detection of microvascular disruption along the length of the nerve and at the point of entrapment/compression.8–15 The technical difficulties adversely affecting the ability to detect the perineural plexus and intraneural branches along the nerve with Doppler are related to both equipment sensitivity and the ability to accurately record the direction and speed of blood flow.
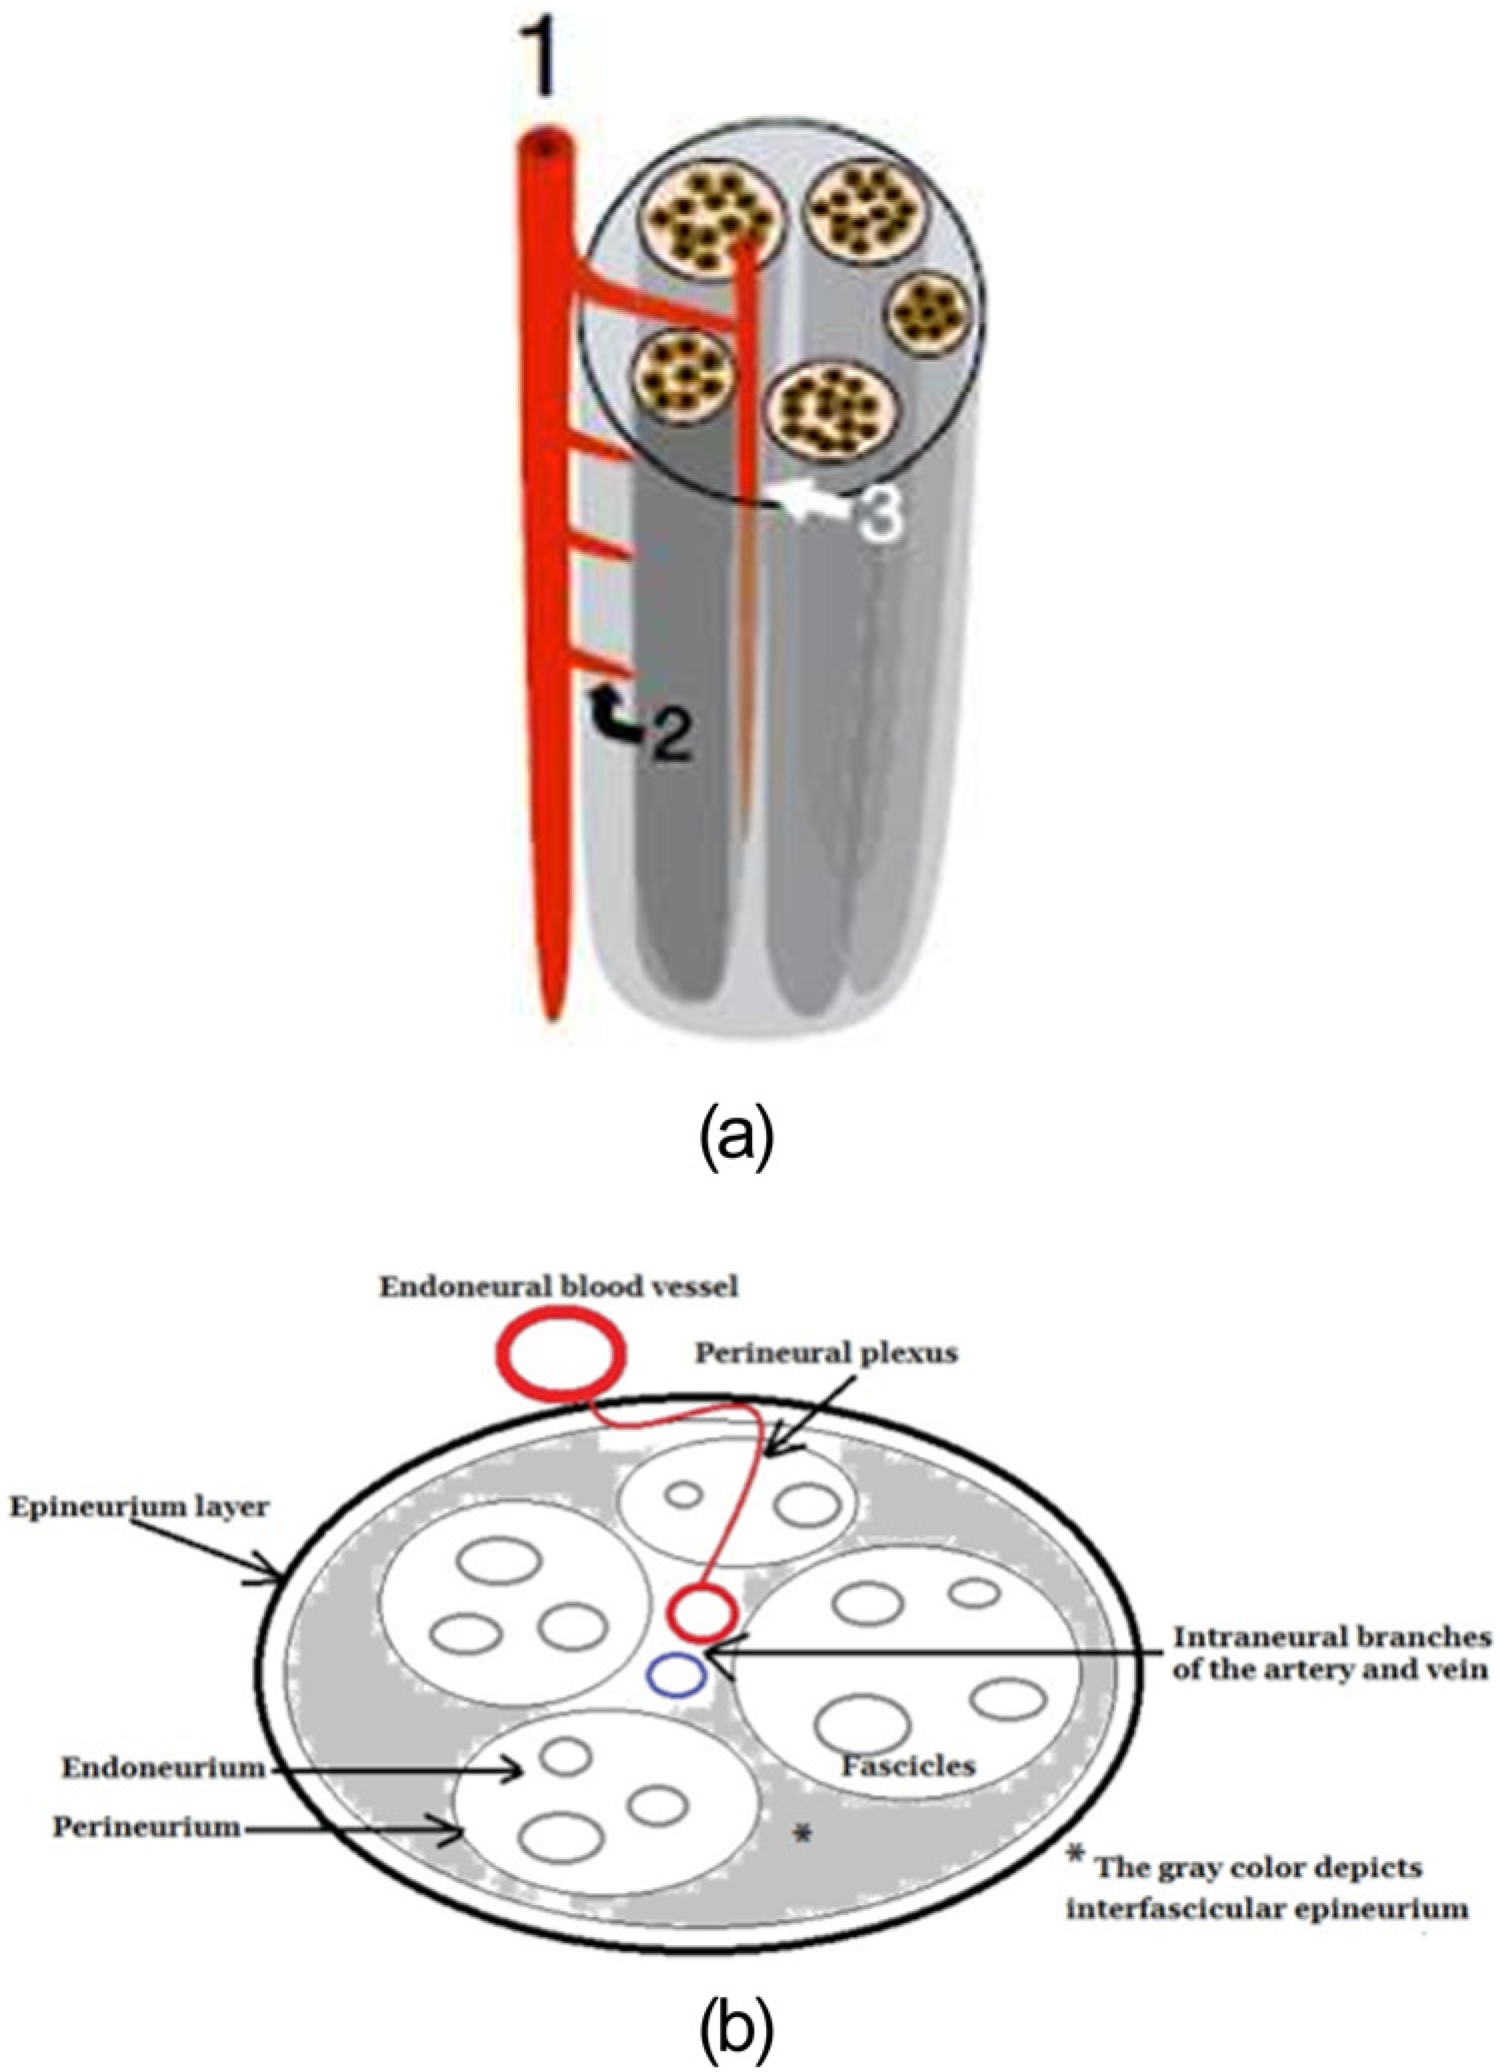
(a) Illustration of the median nerve’s vascularity with (1) representing the endoneural blood vessel, (2) the perineural plexus, and (3) the intraneural branches. (Reproduced with permission by Springer-Verlag, Heidelberg, Germany.) (b) Line diagram of the axial view of the median nerve, associated tissue layers, and vascularity.
The appearance of CD or PD pixels is the current methodology for detecting microcirculation around the median nerve.4,16–20 However, conflicting evidence exists for the use of PD and SD to document hyperemia related to carpal tunnel syndrome (CTS). In a cohort of patients with either CTS or rheumatoid arthritis, PD pixel presence was not discriminating for CTS or disease activity. 21 In contrast, other studies using PD and SD have combined angle correction with identified pixels to measure the blood flow. Using this combined methodology, angle correction has been demonstrated for all SD measurements in the proximal portion of the median nerve for a series of pixels that were associated with vascularity from hands of patients highly likely to have CTS. 22
With conflicting evidence for various methods for the detection of hypervascularity in the nerve, continued research is needed to test current technologies and identify new methodologies for the detection and measurement of inflammation in the nerve. It is imperative not only to identify changes in vascularity at the site of entrapment but to evaluate the entire length of the nerve. Furthermore, increased detection specificity is required to determine if the detected microcirculation is within the perineural plexus versus intraneural vessels.
To address the need to increase diagnostic visualization of the vascularity surrounding the nerve tissue, a preclinical study was devised to establish imaging parameters for the use of contrast-enhanced ultrasound (CEUS). A pre-experimental study that utilized a convenience sample of young adult female monkeys (Macaca fascicularis) was composed to address these research questions: (1) What adjustments are needed to optimize the sonographic instrumentation so that consistent CEUS imaging could be recorded along the course of the median nerve? (2) What is an appropriate contrast media dose that would consistently demonstrate the perineural plexus and intraneural vessels along the median nerve of M fascicularis?
Materials & Methods
Subjects
This study was designed not only to provide empirical evidence but also to gather preclinical safety information and determine the efficacy of CEUS for detection of median nerve vascularity. Eleven young adult female monkeys (M fascicularis) were made available for this series of imaging studies. During data collection, all subjects were anesthetized with ketamine and maintained with isofluorine gas provided from a mask. The body temperature of each subject was monitored with a rectal probe and warm rice bags were placed around the subject to maintain overall body temperature at approximately 97°F. Vital signs were monitored by a veterinary technician. Each subject had a 22-gauge catheter placed in a hind leg vein for direct injection. Eleven M fasciculari were injected and tolerated a series of injections to ascertain the proper dose to image the radial artery and median nerve. At the onset of the imaging series, subjects were intubated to be able to quickly assist them with breathing and also to prevent a reaction that might cause constriction of their airway. No difficulties were encountered with breathing during the early dosing trials; therefore, intubation was discontinued in the latter part of the study in order to make the subjects more comfortable. The subjects were managed in accordance with the protocols approved by The Ohio State University’s Institutional Animal Care and Use Committee.
Equipment
The sonographic equipment utilized was a GE Logiq 9 (GE Healthcare, Inc.; Milwaukee, WI) complete with contrast settings. A 9.0 MHz linear broadband transducer was used with the GE Logiq 9, and the transmit frequency was downshifted to preserve the contrast. The output power was reduced to 4% in order to also preserve the activity of the contrast. Throughout this imaging series, quality control was maintained on the Logiq 9 units and transducers with weekly checks based on imaging of a tissue mimicking phantom.
This imaging series required that the sonographic equipment be optimized to record consistent imaging data. The first attempt to regulate the contrast dosing regimen coupled with optimizing the equipment was centered on the radial artery, at the level of the distal radius (proximal to the carpal tunnel inlet) of a subject. Once the high dose was consistently imaged using the preset musculoskeletal imaging parameters, further optimization was completed by the researchers prior to imaging the median nerve. At the end of each CEUS session, the output power was increased to 100% for 1 minute to clear any residual contrast, and a saline flush was also applied. This was done to create a baseline image prior to the start of the next imaging session.
Contrast Dosing
The first imaging study in the series used Definity (Lantheus Medical Imaging; Billerica, MA) as the contrast agent because it possesses the smallest microspheres (1.1–1.3 μm), has a stability of < 10 minutes, and resonates at 4 MHz. 23 These unique features of Definity made it ideal for this particular imaging application. The dosing protocol was developed in consultation with the manufacturer and with cardiac sonographers who had experience using the product for human studies. A nurse practitioner graduate student managed the preparation of the doses designed to increase visualization of selective anatomic structures. The contrast was activated according to the instructions provided by the manufacturer and was also vigorously agitated in the syringes prior to being injected. 24 A diary was kept that contained quantitative and qualitative data relating to the injection of contrast for each session and subject.
A second study was devised that utilized the optimum contrast dose that was established for sonographic visualization of the radial artery and median nerve vasculature. This particular imaging study was devised and modeled after the work of Schmiedl et al. 25 Eleven subjects were imaged with a series of random injections (high, low, and saline). Research sonographers (KDE and KRV) were blinded to the dosing series, and the injections were concealed so that all immediate CEUS data were collected and evaluated without knowledge of the injection type or the order in which they were administered.
Statistical Analysis
Descriptive data were collected during the equipment optimizing trials, and logs of equipment setup were used to record settings and resulting subjective image quality. Descriptive data were also charted on injection quantity, contrast activity beginning and ending times, and subject physiologic response. Frequencies and means were generated for the 11 subjects who provided data. The blinded trials for saline, low dose, and high dose contrast were also charted for retrospective analysis.
Results
Animal Model
Although some reactions have been associated with the use of Definity as the contrast agent used for cardiac imaging, our subjects exhibited no reactions and tolerated multiple injections without incident. Five subjects were imaged with CEUS to standardize the dosing and imaging technique. All 11 subjects were imaged with CEUS to determine the vascularity associated with the median nerve. The median weight of the subjects was 3.86 kg with a range between 5.35 kg (Subject C) and 2.6 kg (Subject A). The imaging parameters and dosing remained the same throughout the imaging sessions for all subjects.
CEUS Imaging Technique
The first research question was posed to determine what adjustments were needed to optimize the sonographic instrumentation, for consistent CEUS imaging along the course of the median nerve. These early dosing trials used the radial artery of Subjects A through D to achieve consistent CEUS imaging. The contrast dosing amounts began at 0.02 mL of Definity and 0.98 mL of saline, but due to difficulty in visualization, this dose was increased to 0.04 mL of Definity and 0.96 mL of saline. In addition, it was recommended by a senior systems engineer of the equipment manufacturer during these early trials that the output power be increased from 1% to as high as 8% for adequate CEUS imaging of the radial artery. Translating these early results with the radial artery to imaging the median nerve, it was determined that 4% output power and a mechanical index (MI) of 0.13 was the best setting for imaging of the median nerve. The 9.0 MHz linear transducer was also downshifted to a transmit frequency of 6.0 MHz. Our final imaging technique was set with a depth of 2 cm, gain at 66, dynamic range at 90, compression 1, line density 3, suppression 1, frame average 2, edge enhancement 3, and rejection at 0.
Dosing Trials
The second research question was designed to find an appropriate contrast dose that would consistently demonstrate the perineural plexus and intraneural vascularity along the course of the median nerve in a cohort of M fasciculari. We devised a system of having three syringes drawn up; two contained a suspension solution of 0.04 mL of Definity perflutren lipid microspheres to 0.96 mL saline and a third contained a saline solution, designated as a control. All injections were introduced via a venous catheter at a primary Definity injection rate of 0.1 mL every 15 seconds over 1 minute. This was followed by booster injections that were given at a rate of 0.05 mL every 30 seconds over 4 minutes. This was deemed the high contrast dose: 0.8 mL injected over 5 minutes. The low dose was introduced at the primary injection rate as indicated earlier; however, no booster injections were given. All dosing trials were followed by a saline flush of the venous catheter.
The descriptive result for recording the median start time in detecting CEUS vascular flow in the radial artery was 1:15 minutes after the primary injection of contrast was given. Once consistency was established with conducting the injection doses and imaging technique, the subjects were all imaged over 7 minutes to detect the vascularity within the median nerve.
All 11 subjects were examined following the Schmiedl et al. 25 blinded investigator imaging protocol. The doses given were as follows: (1) High—0.04 mL Definity to 0.96 mL saline concentration followed by eight booster injections, totaling 0.8 mL of Definity solution injected over 5 minutes. (2) Low—0.04 mL Definity to 0.96 mL saline concentration with no booster injections, totaling 0.4 mL of Definity solution injected over 5 minutes. (3) Saline—saline injections were given according to the high dose protocol. Imaging sessions were consistently completed with the aforementioned power settings yielding 100% agreement on dose recognition for 33 blinded imaging trials.
The subjective start time for detecting Definity within the median nerve was 30 seconds for 11 high dose trials. The subjective extent of vascular filling was still evident at the end of the 7-minute imaging trial (Figure 2).
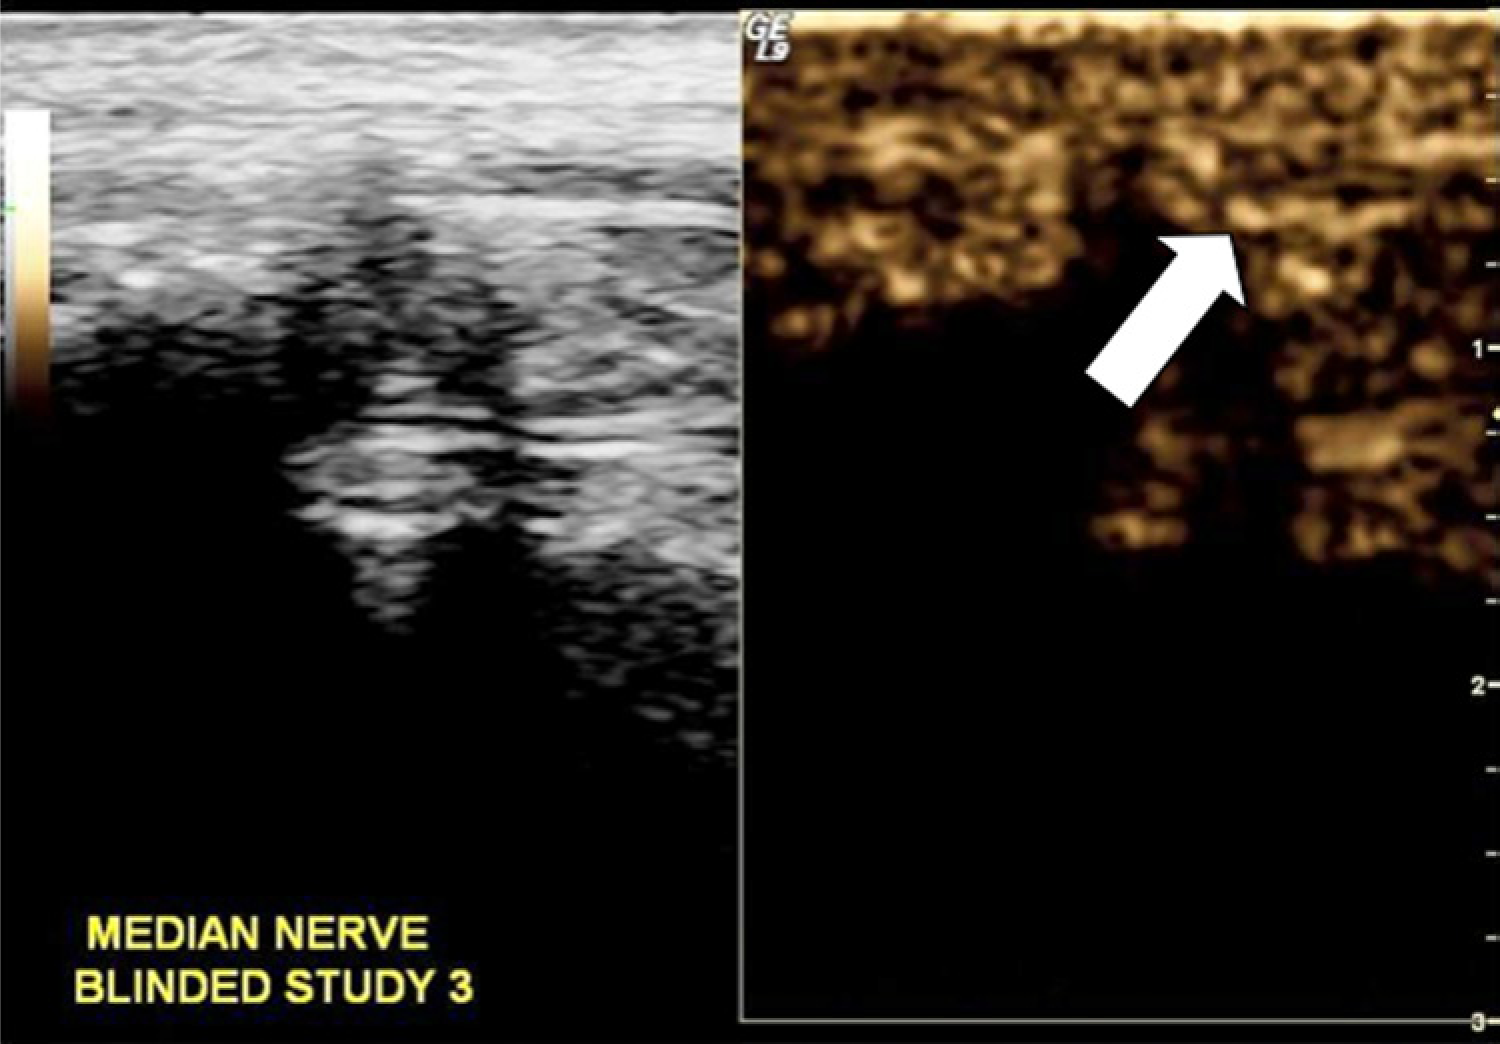
Split screen images using the equipment’s contrast setting to demonstrate contrast bubbles traveling from the deep anatomic structures anteriorly to the underneath side of this sagittal section of the median nerve. The arrow points to the pathway of bubbles traveling around the nerve.
Discussion
This study was conducted to find the sonographic instrumentation settings that would consistently provide CEUS imaging along the course of the median nerve as well as suggest an appropriate contrast dose that would consistently demonstrate vascularity along the median nerve in a cohort of M fasciculari. Prior to this study, Definity has been infrequently used in published musculoskeletal imaging studies 26 ; it is hoped that this work will set the stage for further investigation of perineural vascularity. The success of this study was predicated on the hypothesis of the ability to demonstrate diagnostic quality and ultimate safety while injecting Definity in this cohort of M fasciculari. This successful, safe use of CEUS to demonstrate the vascularity of the median nerve with repeatable instrument settings and dosing should support further studies of nerve perfusion.
To ensure successful future replication for the measurement of contrast-enhanced nerve perfusion, detailed information has been provided regarding important sonographic instrumentation settings. The primary focus was to evaluate the appropriate MI setting that would allow maximum identification of the contrast material without causing over-attenuation of the signal or early, rapid destruction of the microbubbles. In a recently published systematic review, it was confirmed that by slowly adjusting the MI from 0.1 to 0.5, the harmonic signal from the contrast agent can be successfully separated from the incident ultrasonic beam. 26 Through an iterative process, we were able to evaluate various MI settings within this range, and we identified an MI of 0.13 as being the most sensitive for this study.
The secondary factor requiring calibration was an appropriate dose of Definity. A high cumulative dose at a concentration of 0.04 mL of Definity to 0.96 mL of saline contrast solution was established to achieve sustained visualization of the perineural vasculature over 7 minutes. This is very similar to previous work that determined that a Levovist dose of 0.5 mL was appropriate to provide maximum visualization of placental flow in a group of M fasciculari. 25 In contrast, Ragavendra and Tarantal 27 were able to visualize placental vascularity within rhesus monkey using a 0.1-mL dose of Aerosome contrast. Aerosome has a mean microbubble size that ranges from 1.03 μm to 4.62 μm, 27 whereas Definity ranges from 1.1 μm to 3.3 μm. Definity’s smaller mean radius provides less scattering of the incident energy compared to a microbubble with a larger radius. 23 Diminished scattering of the incident ultrasonic energy increases stability of the microbubble and contributes to a prolonged imaging time, which could equate to up to 10 minutes of enhanced imaging when using Definity. 23 In the current study, a 0.8-mL dose of contrast given over 5 minutes’ injection time provided high quality visualization from 30 seconds until the end of the 7-minute imaging session.
This study demonstrated the safe and effective use of Definity. More work is required in the field to ensure that these preclinical study results are reliable and can be reproduced for human screening and clinical diagnostic protocols. Although progress has been made to provide more objective CEUS results, few publications report the reliability of their measures for assessing inflammation of joints and tendons.28,29 To ensure smooth transition to human in vivo use, continued studies that explore, develop, and document sonographic instrumentation protocols are necessary. This will ensure that qualitative and quantitative measurement techniques can be developed and can be widely implemented in clinical practice.
Limitations
These results should be considered specific to this type of sonographic instrumentation and this contrast media product. The data and results certainly are specific to the use of Definity and its unique microsphere size compared to other available contrast agents. However, as was previously noted, the current results were very similar to those obtained using different sonographic instrumentation and contrast media. Temperature of the distal upper extremity was monitored throughout the evaluation of our anesthetized subjects. Although only slight fluctuations were noted, these fluctuations could have influenced vascular flow. This limitation would be minimized in human studies that do not require anesthesia. As a preclinical study to determine equipment settings and safe contrast dosing, these results are limited and require further replication and validation.
Conclusion
This study documented successful implementation of sonographic instrumentation and a safe dosing protocol for the evaluation of nerve vascularity in an animal model. Despite the inherent limitations of a preclinical study, it provides evidence that can be used to replicate these qualitative results and work toward taking quantitative spectral Doppler measurements. The results should encourage continued research into the most reliable and valid techniques for measuring vascularity associated with nerve pathology. This study underscores the need to continue to research the use of sonography and CEUS as a diagnostic assessment of nerve pathology.
Footnotes
Declaration of Conflicting Interests
The authors declared no potential conflicts of interest with respect to the research, authorship, and/or publication of this article.
Funding
The authors disclosed receipt of the following financial support for the research, authorship, and/or publication of this article: The authors would like to thank Lantheus Medical Imaging for providing product support throughout the experiment. They are also grateful to have received funding through NIH-NIOSH R21OH009907-01.