
Abstract
A novel diagnostic test, named the PREW© score, was formulated to predict the known liver disease status of a purposive sample of 500 patients (304 cases and 196 controls) referred for abdominal sonograms. The score was defined by (P R E)/W, where P = portal vein pressure gradient (mm Hg), R = ratio between the observed mean portal vein diameter in the patient (mm) and the mean diameter in healthy subjects (mm), E = echogenicity of liver parenchyma (ECHO grade scale), and W = hepatic venous waveform (1 = monophasic to 3 = triphasic). Cases with PREW scores >50 were about 480 times more likely than the controls to be diagnosed with cirrhosis/ascites. Cases with PREW scores of 16 to 50 were about 6 to 15 times more likely than the controls to be diagnosed with hepatitis and about 15 to 120 times more likely to be diagnosed with cirrhosis/ascites. It was not possible to clearly discriminate between a diagnosis of hepatitis and cirrhosis/ascites if the PREW score was less than 50. The likelihoods of patients with PREW scores >25 being diagnosed with nonalcoholic fatty liver disease/steatohepatitis (NAFLD/NASH) or gallbladder (GB) disease were not statistically significant. A PREW score greater than 25 identified cases diagnosed with hepatitis/cirrhosis/ascites but eliminated diagnoses of NAFLD/NASH/GB. The clinical implication is that a PREW score >50 may help to facilitate the diagnosis of cirrhosis without confirmation by liver biopsy.
Although biopsy remains the gold standard for the diagnosis of liver disease status, significant and potentially fatal complications may develop following invasive procedures. 1 Furthermore, because hepatic pathology, particularly fibrosis, is not uniformly distributed, sampling errors may occur. 2 Attention has consequently focused on the development and practice of noninvasive screening procedures to detect hepatocellular damage, of which sonographic and Doppler-derived measures predominate.3–5 These measures, however, when interpreted independently, are not highly sensitive or specific for a known liver disease status. A recent review of data on the use of Doppler sonography to detect liver fibrosis revealed that the results lacked reproducibility and were contradictory. 6
Conventional sonographic imaging has traditionally been practiced to detect diffuse parenchymal damage in the liver. 7 Although the echogenicity of the liver was once considered a reliable predictor of hepatocellular damage, the increasing prevalence of patient obesity reduces the sensitivity of the ECHO grade scale. The elevation of echogenicity due to intrahepatic fat infiltration may cause false positives in the absence of hepatopathology. A fat-infiltrated liver mimics fibrosis, appearing more echogenic (i.e., whiter than a normal liver) on the image.4,8–10 Adipose tissue also attenuates the elastic wave, increasing liver stiffness and decreasing the sensitivity of sonographic elastography. 11
Another fundamental component of the sonographic examination of the liver is the interpretation of the spectral Doppler tracing of the hepatic venous waveform 12 ; however, an abnormal biphasic or monophasic waveform is common in the absence of hepatopathology13,14 and intrahepatic fat deposition may dampen the waveform.15,16 It has been suggested that the hepatic venous waveform may have limited diagnostic value because there is little correlation between liver dysfunction and waveform patterns.17,18 Conflicting opinions regarding the interpretation of hepatic venous waveforms are common.19,20 One reason for this is that false positives may be attributed to respiratory maneuvers when collecting the data. Respiratory motion damping the waveform is a potential cause of discrepancies. To obtain accurate results, waveforms must be acquired during quiet normal respiration. 21
Portal hypertension, with a concomitant change in the morphometry of the hepatic portal vein, is a known symptom of chronic liver damage.22–25 The procedures of choice to evaluate the portal vein diameter and pressure gradient are duplex ultrasonography and Doppler-derived measures.4,5 Standardized abdominal Doppler examinations use velocity measurements, but by adapting the software to include cardiac presets, the velocities can be converted to pressure gradients using a modified Bernoulli equation. 26
The mean ± standard deviation (SD) of the portal vein diameter measured by sonographic evaluation in healthy subjects is widely variable. Published measurements include 11.45 ± 1.49, 22 10.35 ± 1.57, 27 6.3 ± 2.3, 28 and 11.0 ± 2.0. 29 In patients with known liver disease (cirrhosis and nonalcoholic steatohepatitis [NASH]), the reported portal vein diameters were 13.52 ± 2.48 18 and 10.77 ± 15.1, 27 respectively. The threshold portal vein diameters beyond which a clinician may diagnose portal hypertension are reported to range from 10 mm30 to 13 mm. 4 Attenuation of the portal vein diameter to <10 mm, possibly linked to hepatofugal blood flow, is reputed to be diagnostic of cirrhosis. 24 The nonpathological reasons for the wide variability in the portal vein diameter, which may confound its use as a diagnostic indicator of portal hypertension, include race, sex, and age, as well as the posture of the subjects, different types of instrumentation, and sites of portal venous measurement.22,31 Because the portal vein is bifurcated, with multiple branches, and its inlet and outlet diameters are unequal, the site of measurement is critical. Patient obesity may also mask diameter measurements. The portal vein is easily visualized when liver texture is homogeneous but becomes difficult to see with advanced fat infiltration. 10 There also is no consensus on exactly what the portal vein pressure gradient should be to diagnose hypertension. The normal pressure is between 5 and 10 mm Hg, and thresholds to diagnose portal hypertension of between 10 and 13 mm Hg have been suggested.4,32
Previous studies have demonstrated that morphometric and/or physiological measures of the portal venous system derived by sonographic and Doppler imaging, when interpreted independently, may not be very reliable or universal indicators of liver disease status. This is because of their very high variability and the confounding overlaps that exist between observations on healthy and diseased subjects and patients with different types of liver disease. No previous studies have focused on the statistical and clinical significance of combining the results of multiple noninvasive screening procedures to potentially discriminate between different types of liver disease. The lack of available evidence provided the rationale for this study, which aimed to test the hypothesis that a mathematical combination of the portal vein pressure gradient, the portal vein diameter, the echogenicity of liver parenchyma, and the hepatic venous waveform could be used in practice to predict the known liver disease status of a patient. According to measurement theory, 33 a score based on composite measures may reinforce the reliable components that consistently reflect what the clinician is searching for (i.e., liver disease status) but cancel out the inconsistent components (i.e., measurement errors, including the results of false-positive or false-negative tests). Measurement theory provides a statistical justification for devising a novel diagnostic test, named the PREW© score and formulated from composite screening measures, to predict the liver disease status of a patient. The PREW score was defined by

where P = the portal vein pressure gradient, R = the ratio between the observed mean portal vein diameter in the patient and the mean portal vein diameter in healthy subjects, E = the echogenicity of liver parenchyma, and W = the hepatic venous waveform. The hypothesis that the PREW score could be used in practice to predict liver disease status was tested by means of a case-control study. It was not possible using this research design to estimate the relative risk of patients being tested positive rather than negative for a known liver disease status because the sampling fraction of the population was unknown. 34 Odds ratios computed with a multinomial logistic regression (logit) model were therefore estimated in this study to infer the capabilities of the PREW score to predict a known liver disease status. An odds ratio estimated the likelihood of predicting a patient as a case (i.e., diagnosed with a known liver disease, coded as 1 = gallbladder [GB], 2 = nonalcoholic fatty liver disease [NAFLD]/NASH, 3 = hepatitis, 4 = cirrhosis/ascites) for each given level of the PREW score, relative to predicting a patient as a control (i.e., with no measurable symptoms of liver damage, coded with 0 as the reference value).
Patients and Methods
Patients
Hospital institutional review board (IRB) approval was obtained prior to collection of data or statistical analysis. Patient referral, self-reported health symptoms, history of alcohol abuse, and medical records were used to identify liver disease status among a purposive sample of 500 (50% male and 50% female) patients referred for abdominal sonograms at a Western regional medical center between March 2010 and December 2010. Imaging and Doppler-derived measures of portal vein diameter, portal vein pressure gradient, and the hepatic venous waveform were simultaneously collected for each patient. Their liver disease status was identified as negative (i.e., no measureable symptoms of hepatocellular damage), GB disease, NAFLD/NASH, hepatitis, or cirrhosis/ascites. The diagnosis was based on (a) elevated serum biomarkers, including alanine aminotransferase (ALT) and aspartate aminotransferase (AST); (b) a second-generation enzyme-linked immunosorbent assay antibody to hepatitis C (anti-HCV); and (c) liver biopsy to identify cirrhosis. Patients who had known hepatocellular carcinoma, congestive heart failure, or blood-clotting disorders 35 were excluded. Patients with morbid obesity (body mass index [BMI] >35) were included because it was necessary to determine if the PREW scores were significantly elevated by hepatic fat infiltration.
PREW Scores
The PREW score was defined by (P R E)/W, where P = the portal vein pressure gradient (mm Hg); R = the ratio between the observed mean portal vein diameter in the patient (mm) and the mean portal vein diameter in healthy subjects (mm); E = the echogenicity of liver parenchyma, measured using the ordinal ECHO grade scale (in which 0 = normal [not echogenic]; 1 = grainy liver, vessels and diaphragm seen; 2 = fatty liver, vessels seen but diaphragm not seen; and 3 = fatty liver, vessels and diaphragm not seen), 4 and W = the hepatic venous waveform, coded for the purposes of this study by 1 = monophasic (continuous flow due to increased liver resistance or cardiac overload), 2 = biphasic (some resistance to flow), and 3 = triphasic (normal). The lowest PREW scores, between 0 and 10, were observed in patients with normal portal vein pressure gradients (<10 mm Hg), normal-sized portal veins (R ≈ 1), zero or slightly elevated echogenicity (E = 0 or 1), and biphasic or triphasic waveforms (W = 2 or 3). The highest PREW scores, >25, were observed in patients with elevated portal vein pressure gradients (>10 mm Hg), dilated portal veins (R > 1), elevated echogenicity (E = 2 or 3), and abnormal monophasic waveforms (W = 1).
Statistical Analysis
The empirical relationships between the PREW scores and the known liver disease status of each patient were analyzed. The mean PREW scores, with respect to liver disease status, sex, and BMI, were compared using multifactorial analysis of variance. The scores were classified into five ordinal levels, coded as 0 = 0–10, 1 = 11–16, 2 = 16–25, 3 = 26–50, and 4 >50. Correspondence analysis and multinomial logistic regression analysis were performed to explore the extent to which the five ordinal levels of the PREW score could be applied in practice to predict liver disease status. Correspondence analysis is commonly used in medical research to study the relationships between disease and risk factors, as a screening method for indicants in clinical diagnosis, in studies of disease etiologies, and to identify patterns in clinical data. 36 A window is opened to visualize categorical relationships in a simplified graphical representation. The multidimensional information in the cross-tabulation is broken down into two lower dimensions such that each category is plotted as a point on two constructed axes (dimension 1 and dimension 2). The geometric orientation of the points indicates their relative similarities. Correspondence analysis has not, however, been used before to identify the relationships between liver disease status and sonographic or Doppler-derived measures. A multinomial logit model was used to estimate the odds ratios, predicting the likelihood of a known liver disease status for each ordinal level of the PREW score. The model assumed (a) the data were case specific (i.e., each case had a single PREW score) and (b) there were no irrelevant alternatives (i.e., the odds did not depend on measures that did not predict liver disease status). 37
Results
Patients
A characteristic feature of the sample was the high proportion of overweight and obese subjects, reflected by their BMI distribution (<25 [normal], 30.2%; 25–30 [overweight], 31.0%; 31–35 [obese], 27.4%; and >35 [morbidly obese], 11.4%). Their racial profile was representative of the population in the geographic region of the CRMC—specifically, Hispanic (46.4%), white (28.8%), Asian/other (14.0%), and African American (10.8%). A total of 196 controls, representing 39.2% of the sample, were classified as negative with no measurable symptoms of liver disease. A total of 304 cases, representing 60.8% of the sample, were diagnosed with a known liver disease: GB disease (n = 94; 30.9%), NAFLD/NASH (n = 64; 21.0%), hepatitis (n = 89; 29.3%), and cirrhosis/ascites (n = 57; 18.8%). The sample did not fulfill the criteria necessary to estimate a population-based prevalence of liver disease status or positive and negative predictive values for the PREW scores. 38
PREW Scores
The trends in the variability of the mean PREW scores (±95% confidence intervals) across the 500 patients with different types of liver disease status, stratified with respect to sex and BMI, are illustrated in Figures 1 and 2. The lowest PREW scores, between 0 and 10, were observed among those patients identified as negative for liver disease. Higher scores, between 10 and 25, were characteristic of patients diagnosed with GB disease, NAFLD/NASH, or hepatitis. The highest PREW scores, those exceeding 25, were observed in patients diagnosed with cirrhosis/ascites. Multifactorial analysis of variance indicated that liver disease status had a statistically and clinically significant effect on the mean PREW scores (F = 584.7, P < .001, η2 = 34.16%). Neither sex (Figure 1, F = 1.58, P = .210) nor BMI (Figure 2, F = .200, P = .657) had any statistically significant effect on the mean PREW scores. Tukey’s post hoc tests indicated that patients with no liver disease (negative), hepatitis, cirrhosis/ascites, or GB/NAFLD/NASH had significantly different (P < .05) mean PREW scores. The mean PREW scores were not significantly different with respect to GB disease and NAFLD/NASH. These findings support the recommendation that in future studies, GB disease should be excluded from the analysis as it has been proven insignificant.
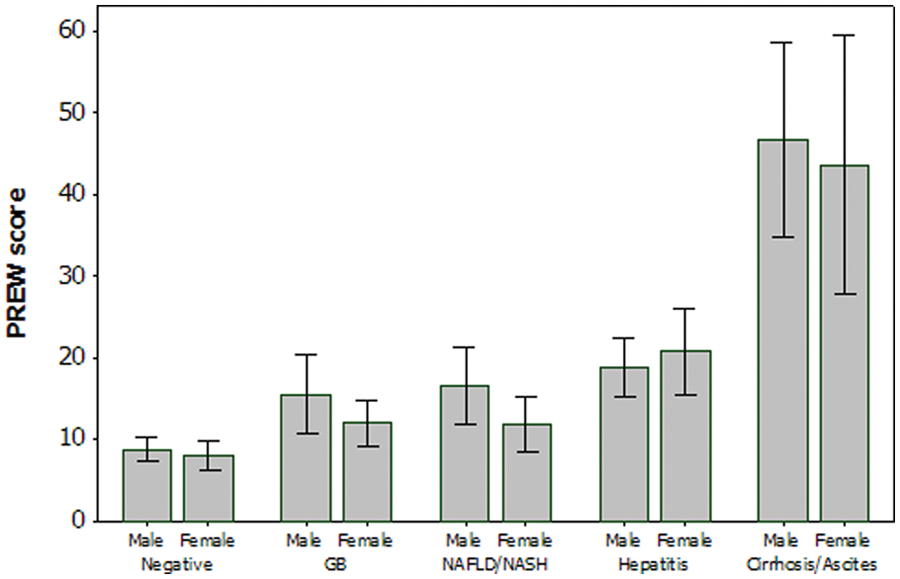
PREW score by disease status, stratified by sex. GB, gallbladder; NAFLD, nonalcoholic fatty liver disease; NASH, nonalcoholic steatohepatitis.
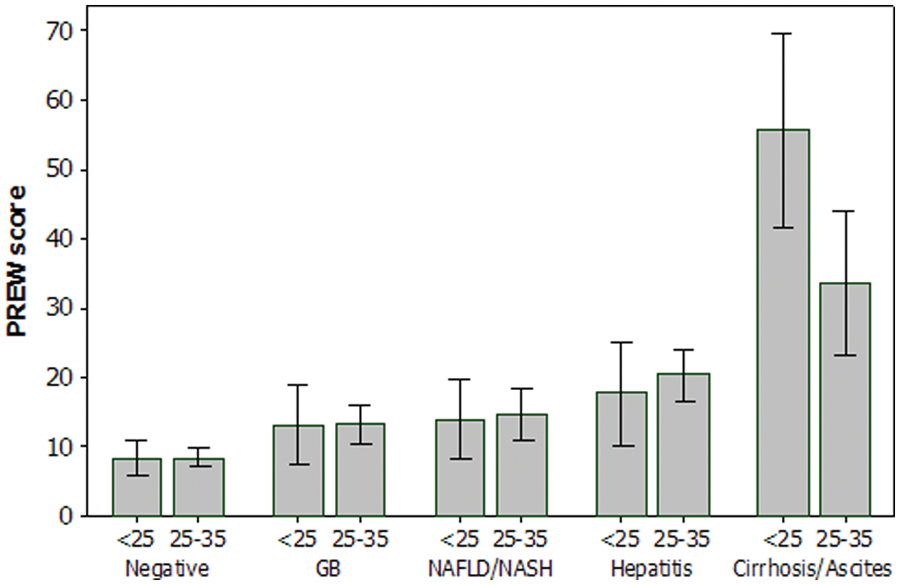
PREW score by disease status, stratified by body mass index. GB, gallbladder; NAFLD, nonalcoholic fatty liver disease; NASH, nonalcoholic steatohepatitis.
Correspondence Analysis
The 2D map constructed by simple correspondence analysis (Figure 3) illustrated that PREW scores of 0 to 10 corresponded with patients having no symptoms of liver disease (negative), scores of 11 to 15 corresponded with GB and NAFLD/NASH, scores of 16 to 25 corresponded with hepatitis, and scores >25 corresponded with cirrhosis/ascites. Correspondence analysis, however, is not designed to test hypotheses; it can only generate them. 36 Multinomial logistic regression was therefore an essential tool to objectively test the hypothesis that a mathematical combination of the portal vein pressure gradient, the portal vein diameter, the echogenicity of liver parenchyma, and the hepatic venous waveform could be used in practice to predict the known liver disease status of a patient.
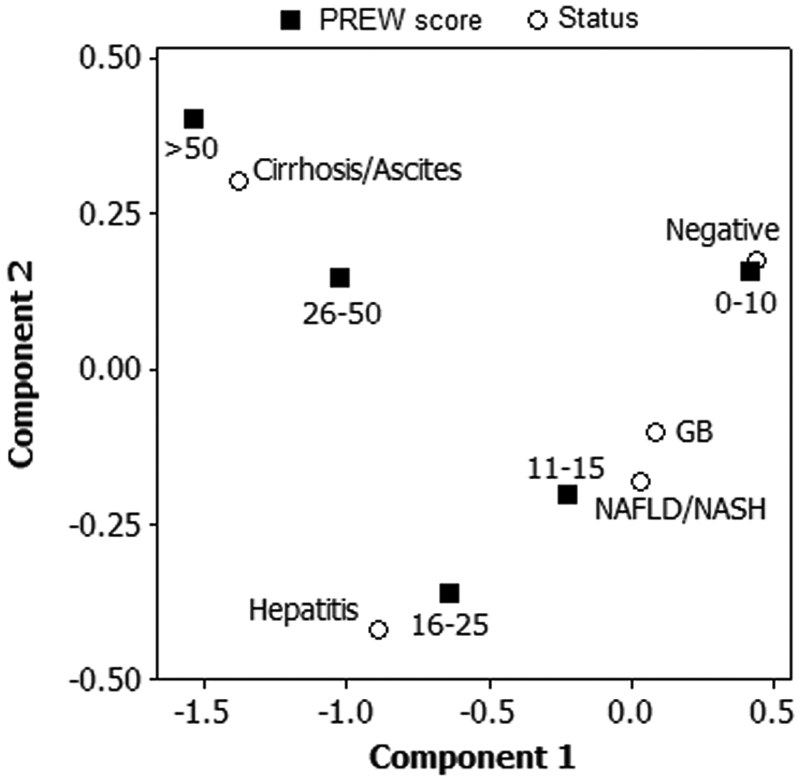
Correspondence analysis between PREW scores and disease status. GB, gallbladder; NAFLD, nonalcoholic fatty liver disease; NASH, nonalcoholic steatohepatitis.
Logistic Regression
The results of multinomial logistic regression analysis are presented in Table 1. Cases with PREW scores <16 were unlikely to be diagnosed with cirrhosis/ascites or hepatitis, relative to the controls (P > .05), indicated by the lower limit of the 95% confidence interval for the odds ratios less than or equal to 1.0. Consequently, a PREW score <16 was found to eliminate the possibility of a diagnosis of cirrhosis/ascites or hepatitis. Cases with PREW scores >50 were about 480 times more likely than the controls to be diagnosed with cirrhosis/ascites. Cases with PREW scores of 16 to 50 were about 6 to 15 times more likely than the controls to be diagnosed with hepatitis and about 15 to 120 times more likely to be diagnosed with cirrhosis/ascites. Consequently, it was not possible to clearly discriminate between a diagnosis of hepatitis and cirrhosis/ascites if the PREW scores were between 16 and 50. The likelihood of patients with PREW scores >25 being diagnosed with NAFLD/NASH or GB disease was not significant (P > .05), with the lower limit of the 95% confidence interval for the odds ratios less than 1.0. Consequently, a PREW score greater than 25 identified cases diagnosed with hepatitis/cirrhosis/ascites but eliminated cases diagnosed with NAFLD/NASH/GB.
Odds Ratios to Predict Liver Disease Status Using PREW Scores
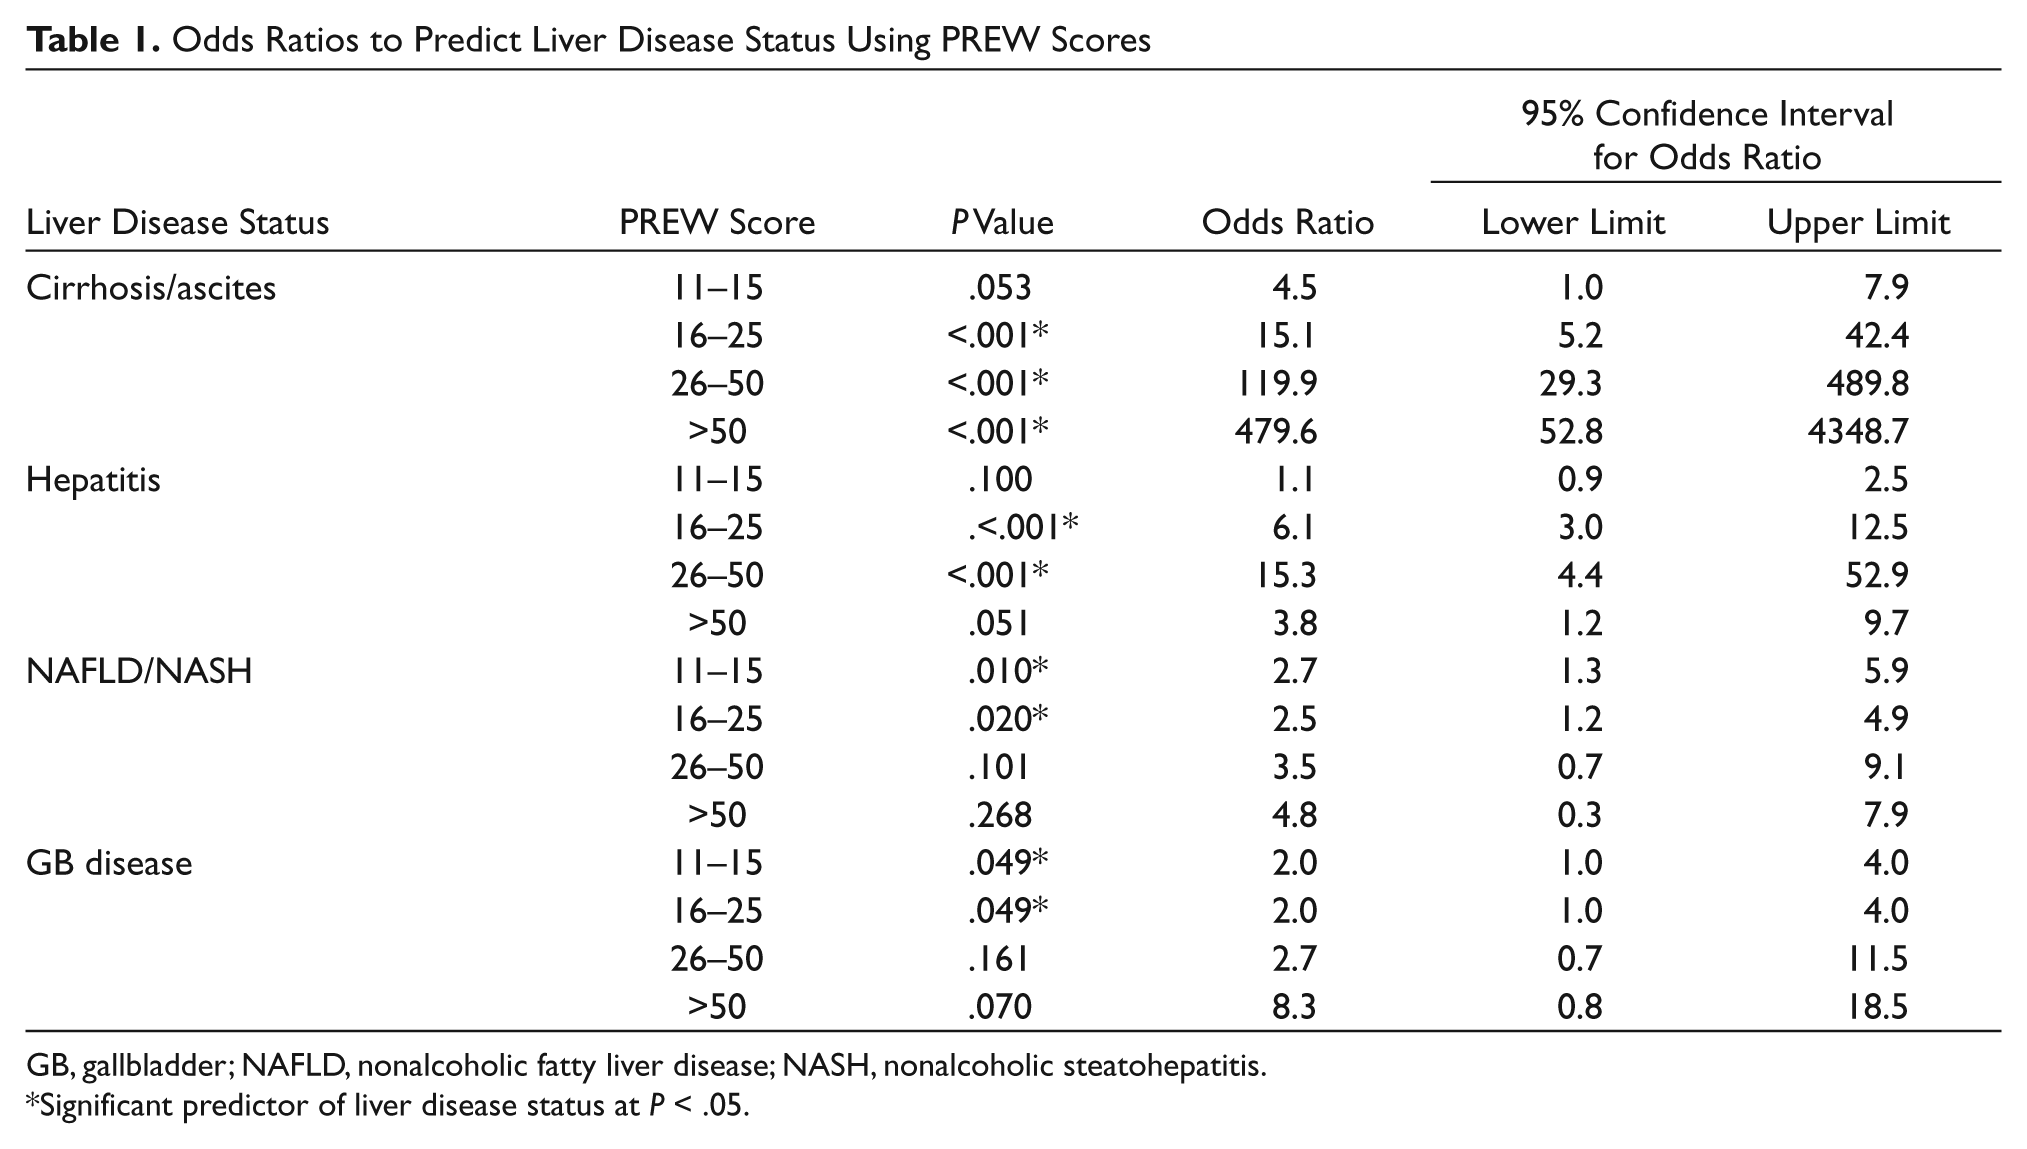
GB, gallbladder; NAFLD, nonalcoholic fatty liver disease; NASH, nonalcoholic steatohepatitis.
Significant predictor of liver disease status at P < .05.
Discussion
A very simple mathematical combination of sonographic and Doppler-derived measures to formulate a composite score to predict the known liver disease status of a patient was statistically and clinically justified. A PREW score in excess of 50, irrespective of sex or BMI, significantly identified the existence of cirrhosis/ascites and ruled out the diagnosis of an alternative liver disease status. It is recommended that the PREW score should be applied in clinical practice as an alternative screening measure to diagnose cirrhosis/ascites without resorting to biopsy. In future studies, cirrhosis should be differentiated from ascites, and other biochemical markers should be included to further define liver status. In addition, GB disease should be removed from future studies related to the PREW score. The availability of a noninvasive alternative is imperative because many patients experience anxiety, about 30% report substantial pain, and about 2% experience fatal complications, including pneumothorax, bleeding, or puncture of the biliary tree after liver biopsy. 1 PREW scores between 16 and 50, however, were found to be less efficacious as diagnostic indices, because their interpretation was confounded by overlaps between the scores across different types of liver disease. It is feasible, however, that low PREW scores between 11 and 15 could be applied with caution to provide clinical evidence to potentially eliminate a diagnosis of cirrhosis/ascites.
A mathematical combination of noninvasive sonographic and Doppler-derived measures to diagnose cirrhosis/ascites was justified not only by its statistical and clinical significance but also for physiological reasons. The morphometric and physiological components of the PREW score emphasize that blood flow through the portal vein is inextricably linked to the size and pressure gradients of the portal system, as described conceptually by Poiseuille’s classical model:

where Q = blood flow (mm3/s), r = radius of vessel (mm), ΔP = pressure gradient between the two ends of the vessel (Pa), L = length of vessel (mm), and η = dynamic viscosity of blood (Pa s). The portal vein is valveless, so ΔP is theoretically proportional to the product of the input of blood from the portal vein and the hepatic resistance to outflow. Consequently, any events causing a change in the blood flow and/or an increase in hepatic resistance could develop into portal hypertension, potentially associated with a damping of the hepatic venous waveform. Substituting diameter (d) for radius and assuming that hepatic resistance is proportional to the extent of hepatocellular damage, and hence echogenicity (E), then portal hypertension may be conceptually described by

This simple model highlights the dominating effects of portal vein morphometry on blood flow and hypertension, as well as the associated echogenic resistance. It focuses attention on classical concepts, derived from cardiac physiology, to highlight the inextricable links that may exist between sonographic and Doppler-derived predictors of liver diseases. Poiseuille’s model, however, has no predictive validity because it simplistically assumes a long straight tube with constant morphometry, a Newtonian fluid, and steady laminar flow. Interpolation of the equations with clinical measurements is invalid because blood is not a Newtonian fluid, venous flow is not steady, the dynamic viscosity of blood is not constant, and the portal vein is bifurcated, with multiple branches, varying in size between the inlets and the outlets. In reality, the portal vein will not continue to dilate or attenuate indefinitely, nor will more blood flow through the liver over time than the elastic properties of the vessels and hepatic resistance will allow. Consequently, the term r4 ΔP is not necessarily correlated with blood flow through the portal vein. Furthermore, echogenicity and hepatic resistance may not always be directly correlated because intracellular fat infiltration rather than hepatocellular damage may elevate the ECHO grade score.4,8–10
In reality, dilation of the portal vein is a compensatory mechanism to enhance blood flow in the face of increasingly nodular lesions blocking flow through the liver. As the nodularity increases, the blood takes the path of least resistance. It is easier for the blood to follow collateral channels rather than course through a nodular liver. As collateral venous flow increases, the amount of blood traversing the liver is reduced, portal hypertension develops, and the probability of significant cirrhosis becomes a function of a change in the portal vein velocity. 39 It is possible that the PREW score reflects these combined physiological processes, because the highest PREW scores were found to be significantly diagnostic of cirrhosis.
The limitations of this case-control study were that it was underpinned by a simplistic conceptual framework, the predictive modeling was empirical, the sampling was purposive, and the results were not definitive. It was not found possible to discriminate positively between all types of liver disease status using the PREW scores. It is evident that more sophisticated models are essential to simulate blood flow through the portal vein and to predict its potential impact on liver disease status.40,41 It was determined that GB disease should be removed from future research when using PREW scores as it is not clinically relevant. A combination of the PREW score with biochemical markers will be helpful to further refine this novel noninvasive method. In addition, future analysis should divide cirrhosis from ascites and test them independently. The parameterization of such models with sonographic and Doppler-derived screening measures obtained from cross-sectional population studies could potentially be used to simulate the effects of hepatocellular damage on portal blood flow and hypertension, possibly helping to enable clinicians in predicting the risks of liver failure and mortality in individual patients.
Footnotes
Declaration of Conflicting Interests
The author declared no potential conflicts of interest with respect to the research, authorship, and/or publication of this article.
Funding
The author received no financial support for the research, authorship, and/or publication of this article.