
Abstract
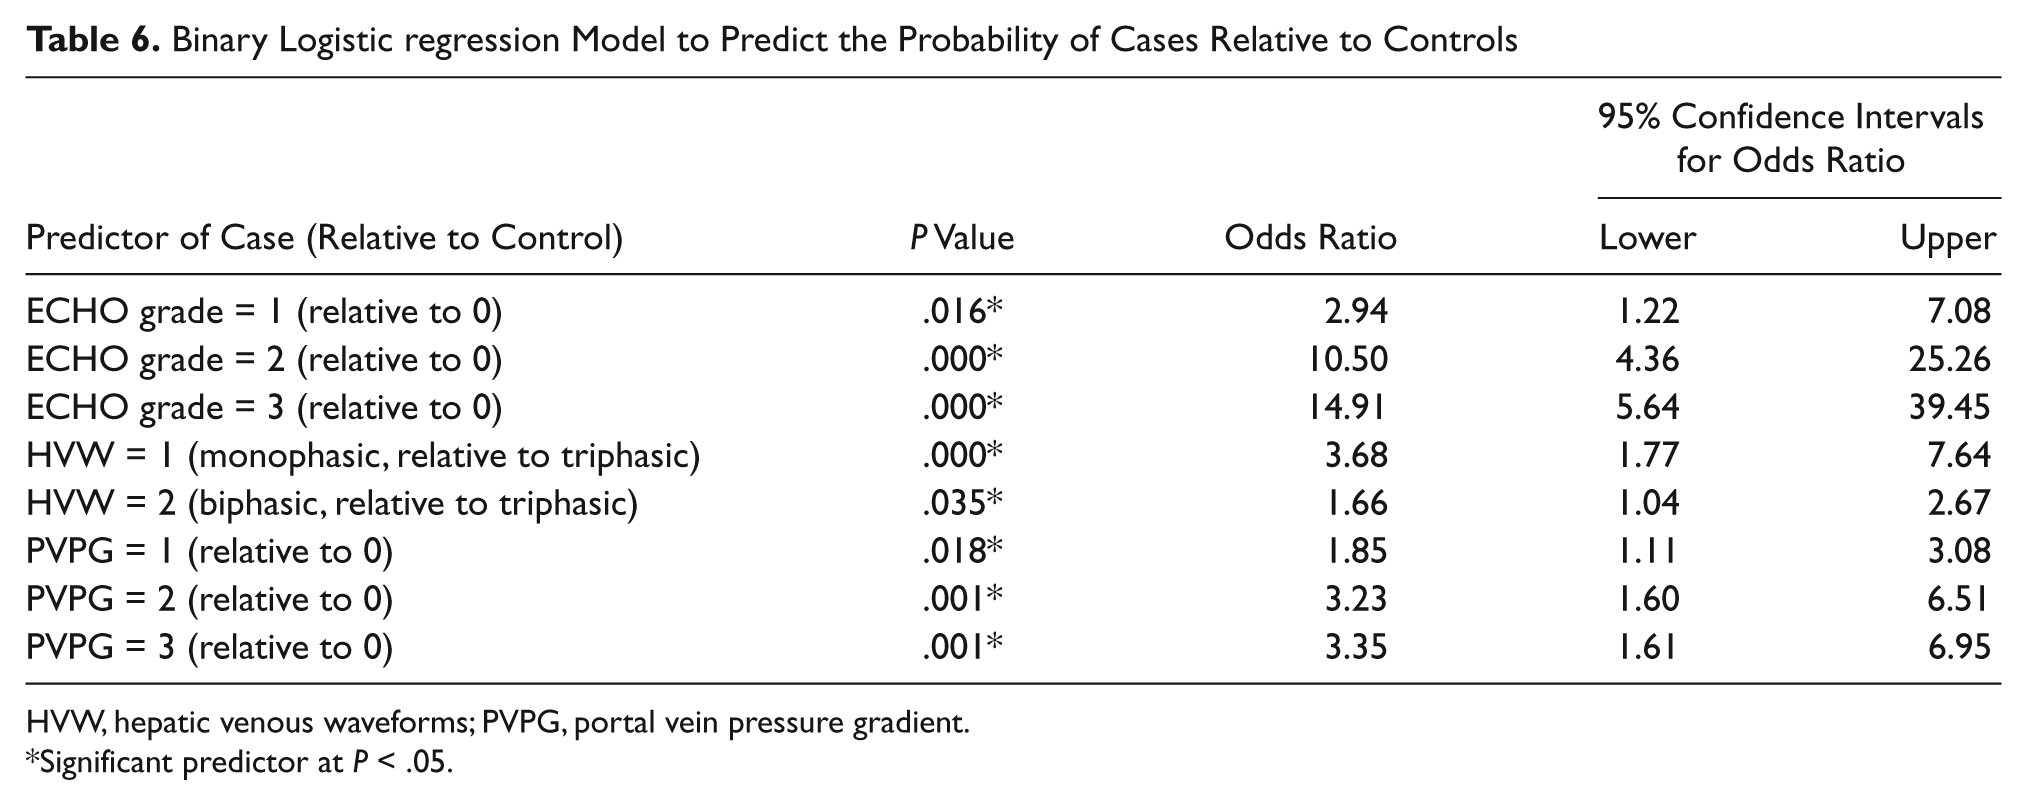
A case-control study based on the records of 465 adult patients receiving abdominal sonograms predicted the likelihood of liver damage, as detected by serum biomarkers, biopsy, and/or endoscopy, to increase systematically with respect to (a) an increase in echogenicity from grade 1 (odds ratio [OR] = 2.94) through 2 (OR = 10.50) to 3 (OR = 14.91) coincident with (b) a dampening of the hepatic venous waveform (HVW) from biphasic (OR = 1.66) to monophasic (OR = 3.68) and (c) a simultaneous elevation in the portal vein pressure gradient, adjusted for portal vein diameter (PVPG) from level 1 (OR = 1.85) through 2 (OR = 3.23) to 3 (OR = 3.35). Echogenicity consistently exhibited higher sensitivities but lower specificities than the HVW and PVPG. The lowest specificities were found among patients with a body mass index >25, proposed to be associated with intrahepatic fat infiltration causing false positives in the absence of hepatopathology.
Much recent attention has focused on the development and practice of noninvasive screening for the detection of chronic liver disorders, specifically for hepatocellular damage, as evidenced by fibrosis, a precursor of cirrhosis. Detecting fibrosis before the development of potentially fatal esophageal varices, ascites, and hepatic encephalopathy allows for earlier treatment options. 1 The following three measurements are routinely used: (1) screening for serum biomarkers that specify hepatocyte damage, (2) sonographic measures of the echogenicity or elasticity of liver tissue, and (3) Doppler-derived measures of portal vein hypertension in conjunction with portal vein diameter and hepatic
venous waveforms. 2 The reason for focusing on noninvasive tests is that significant complications may develop following invasive procedures. 3 Many patients experience anxiety, about 30% report substantial pain, and about 2% experience fatal complications, including pneumothorax, bleeding, or puncture of the biliary tree after liver biopsy. Furthermore, because hepatic pathology, particularly fibrosis, is not uniformly distributed, sampling errors may occur. 4
The relative efficacies of sonographic measures of liver echogenicity and Doppler-derived measures of hepatic venous blood flow to detect liver disorders have not been compared previously. A recent review of published data on the use of Doppler sonography to detect liver fibrosis 5 revealed that the results lacked reproducibility and were contradictory. Consequently, this study was designed to determine statistically whether portal venous pressure gradients were more sensitive and/or specific predictors of liver disorders than either echogenicity or hepatic venous waveforms.
The cases included in this study comprised patients referred for abdominal sonograms who had elevated alanine aminotransferase (ALT) and aspartate aminotransferase (AST) levels, liver biopsies to confirm fibrosis or cirrhosis, and/or endoscopy to confirm esophageal varices. In the absence of biopsy or endoscopy data, the serum biomarkers constituted the gold standard, against which the results of sonographic and Doppler-derived tests could be compared. Serum ALT and AST levels are considered very sensitive and fairly specific biomarkers of hepatocyte damage because liver injury, including necrosis and fibrosis, results in the leakage of these enzymes into the circulation 6 ; however, since they have specificity beyond the liver, AST levels may be abnormally elevated in patients with other conditions. These may include congestive heart failure, cancer, skeletal muscle injury, and morbid obesity, risking false-positive results in the absence of corroborating clinical evidence for liver damage.7,8 Consequently, to avoid including false positives in this study, it was essential to exclude patients with nonhepatic sources of serum biomarker activity.
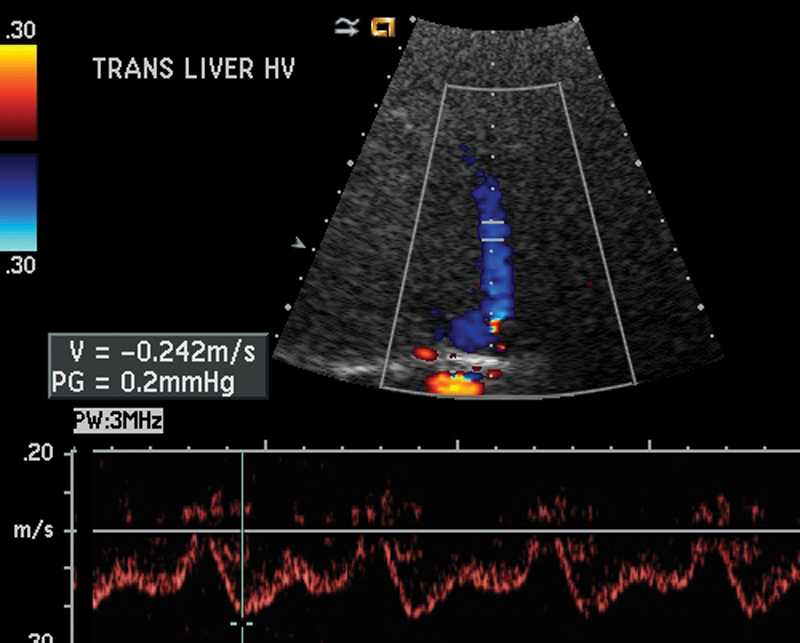
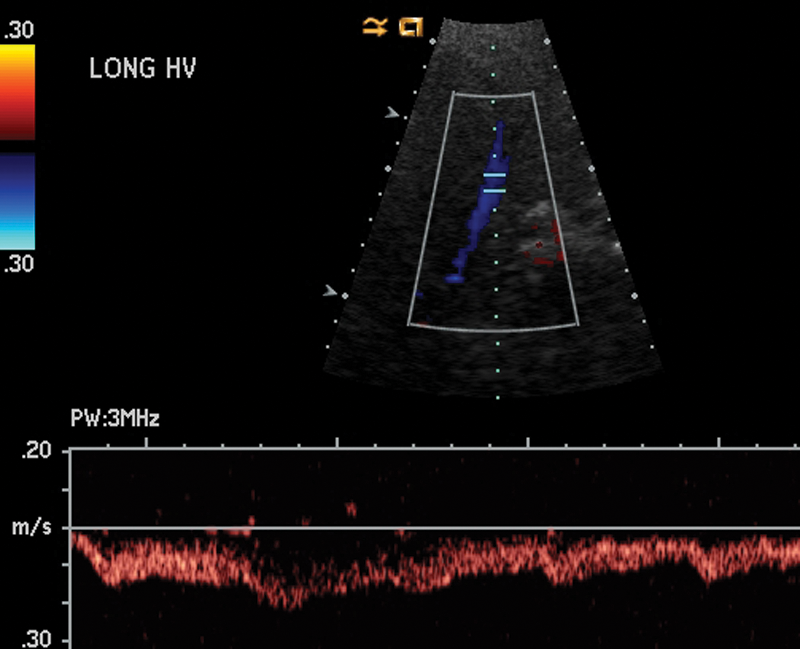
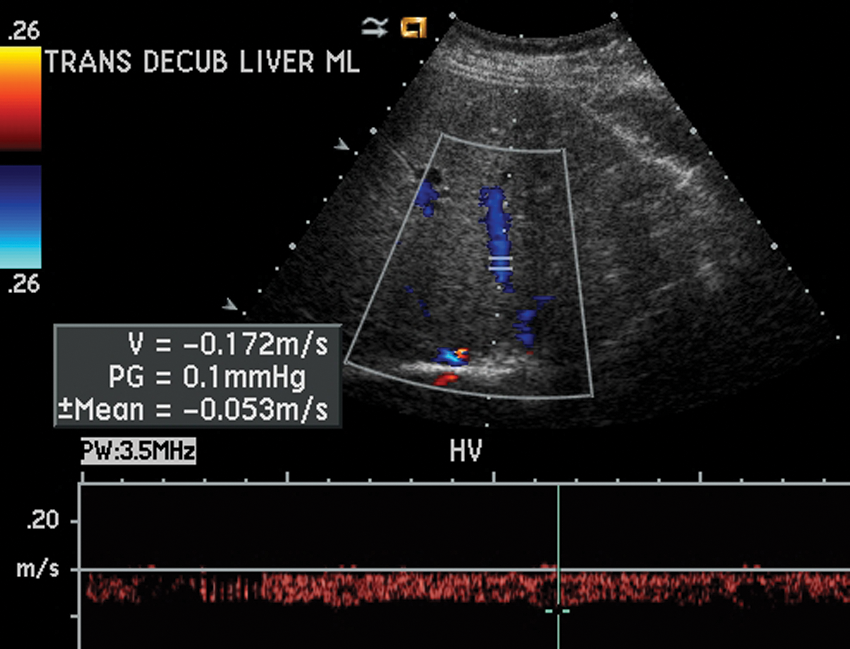
Conventional sonographic imaging has been used for more than 30 years to detect diffuse parenchymal damage in the liver. 9 Although the echogenicity of the liver was once considered a reliable predictor of fibrosis, the efficacy of the 4-point ECHO grade scale is currently declining, due to the increasing prevalence of patient obesity (Figures 1–4). 10 Fat infiltration of the liver may be responsible for the elevation of echogenicity, causing false positives in the absence of hepatopathology.10–13 Sonographic elastography is also less effective in detecting fibrosis in overweight and obese patients because adipose tissue attenuates the elastic wave, increasing measured liver stiffness and decreasing sensitivity. 14 The interpretation of the spectral Doppler tracing of the hepatic venous waveform (HVW) is another fundamental component of the ultrasonographic examination of the liver. Healthy individuals, irrespective of age or gender, normally exhibit a triphasic waveform, ascribed to the variations in pressure caused by the cardiac cycle (Figure 5). An abnormal dampened waveform (biphasic or monophasic) may be correlated with hepatocellular damage (Figures 6 and 7), including increased stiffness of liver parenchyma around the vein.15,16 An abnormal hepatic venous waveform is also common in the absence of hepatopathology, 17 and intrahepatic fat deposition is known to dampen the HVW. 18 Consequently, the specificity of the HVW to detect liver damage also may be compromised by false positives. Portal hypertension, typically defined as a 10–mm Hg difference in pressure between the portal and hepatic veins, is a common symptom of liver disorders. 19 A consequence of portal hypertension is a concomitant change in the diameter of the portal vein.20–25 Prehepatic causes of portal hypertension include thrombosis, providing the rationale for excluding patients with blood-clotting disorders from this study. Duplex ultrasonography and Doppler are the procedures of choice to evaluate portal vein hypertension and diameter because they are relatively inexpensive, simple, and rapid compared with portal venography. 11 A standardized abdominal Doppler examination uses velocity measurements, but by adapting the software to include cardiac presets, the velocity measurements can be converted to pressure gradients, using a modified Bernoulli equation (the change in pressure is equal to 4 multiplied by the velocity squared). 26 No previous studies have focused on the statistical and clinical significance of the relationships between the portal vein pressure gradient, the morphometry of the portal vein (Figures 8 and 9), the HVW, and the echogenicity of liver parenchyma. This study hypothesized that these measures would be simultaneous predictors of hepatopathology. Doppler-derived observations of the portal vein pressure gradient and the measurement of the portal vein diameter were linked together (1) to avoid the violation of the theoretical assumptions of logistic regression analysis, with respect to multicollinearity, 27 and (2) to acknowledge that blood flow through the portal vein is inextricably linked to the morphometry and pressure gradients of the portal system, as described conceptually by Poiseuille’s classical equation:

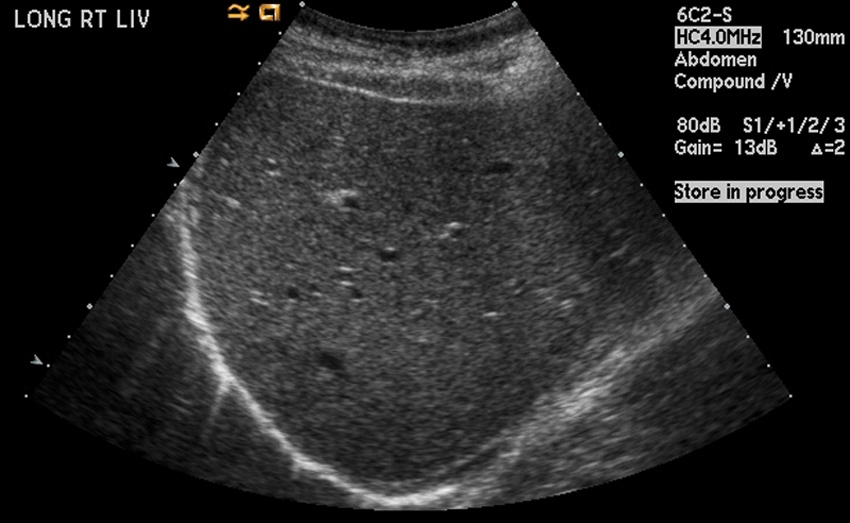
Grade 0 liver. Smooth, homogeneous liver pattern. Vessels and diaphragm are well seen.
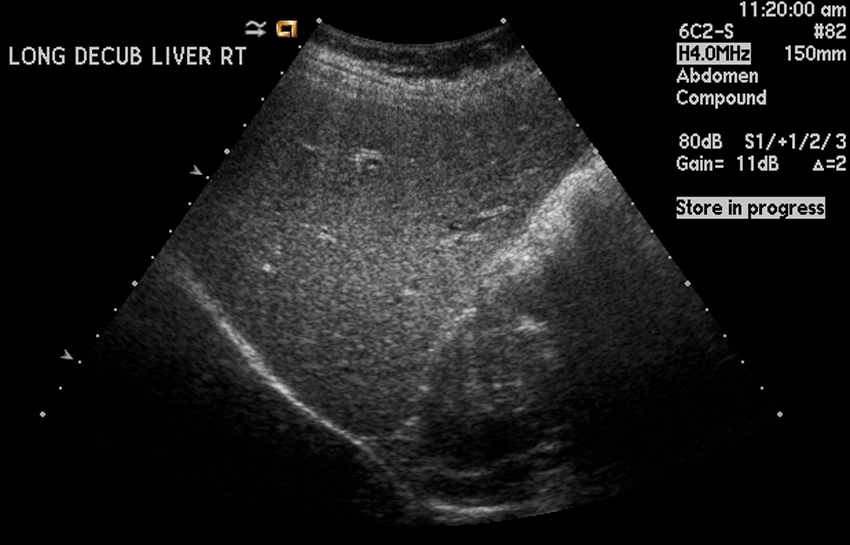
Grade 1 fatty infiltration. Mildly coarse echogenic pattern. Vessels and diaphragm are well seen.
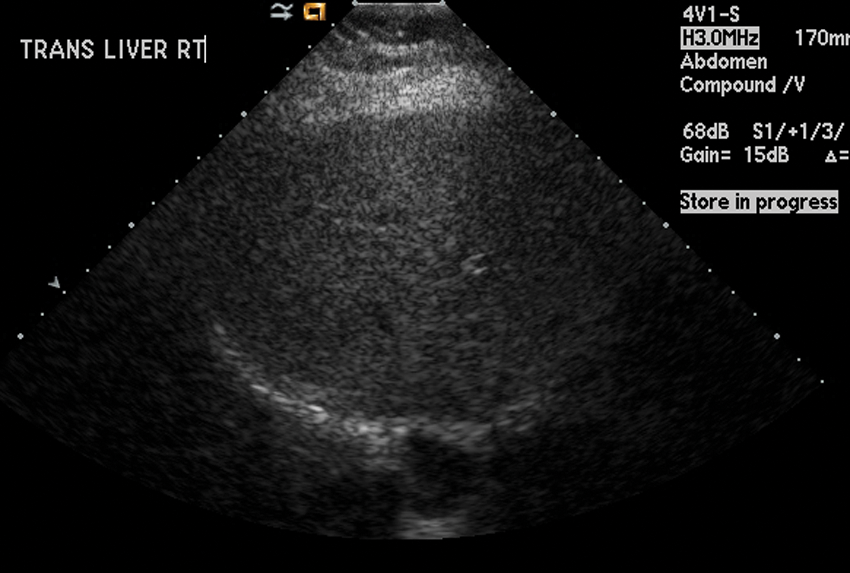
Grade 2 fatty infiltration. Coarse liver parenchymal pattern. Vessels are not well seen; diaphragm is still well seen.
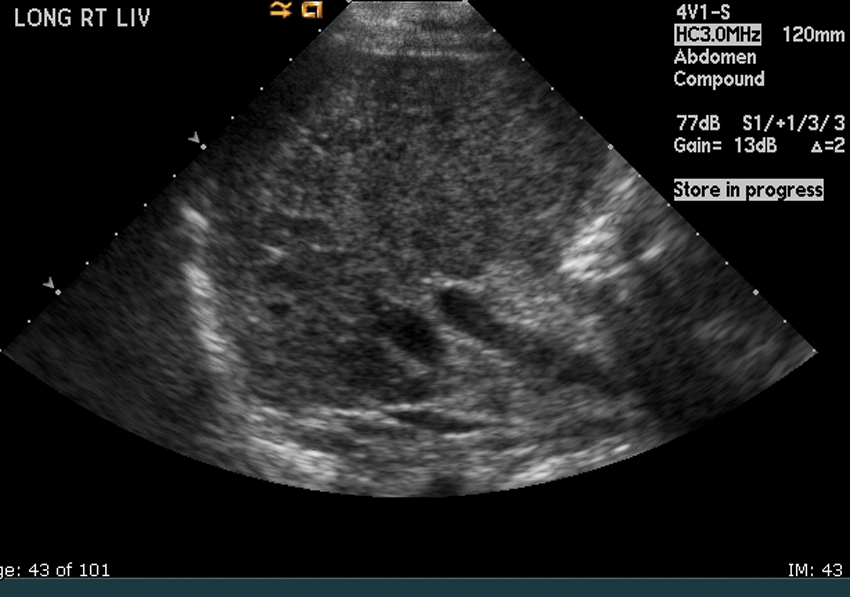
Grade 3 fatty infiltration leading to cirrhosis. Very coarse liver parenchyma.
Normal triphasic hepatic venous waveform.
Biphasic hepatic venous waveform.
Abnormal, monophasic waveform of hepatic vein.
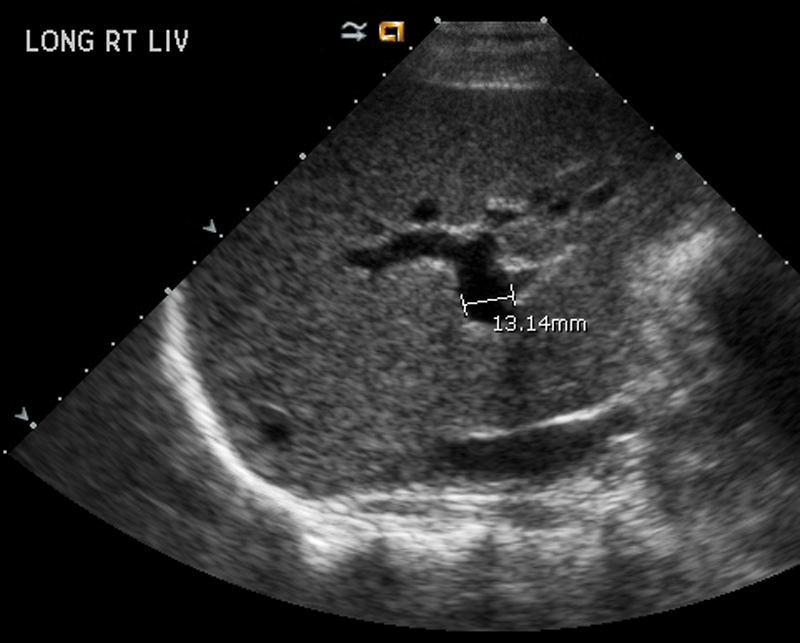
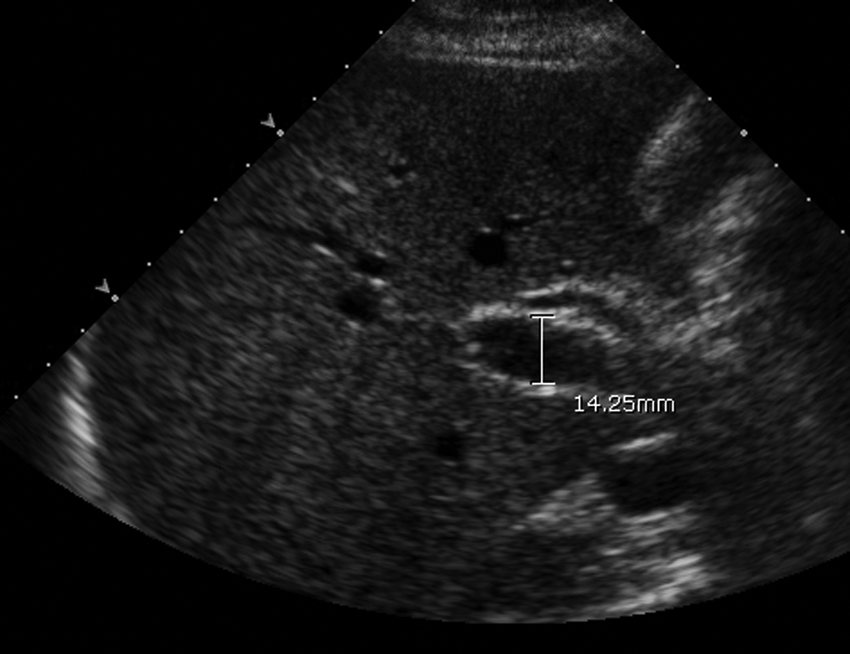
Portal vein diameter measurement.
Portal vein dilatation.
where Q = blood flow (mm3/s), r = radius of the vessel (mm), ΔP = pressure gradient between the two ends of the vessel (Pa), L = length of the vessel (mm), and η = dynamic viscosity of blood (Pa s). The portal vein is valveless, so ΔP is theoretically proportional to the product of the volume of blood flow from the portal vein and the hepatic resistance to outflow. Consequently, any events causing an increase in the blood flow and/or an increase in hepatic resistance could develop into portal hypertension, potentially associated with a dampening of the HVW. Substituting diameter (d) for radius and assuming that hepatic resistance is proportional to the extent of hepatocellular damage, which is directly related to echogenicity (E), then portal hypertension may be conceptually described by the following:

This equation highlights the dominating effects of portal vein morphometry on blood flow and hypertension, as well as the associated echogenic resistance. It focuses attention on classical concepts, derived from cardiac physiology, to help hepatologists understand the inextricable links that may exist between sonographic and Doppler-derived predictors of liver disorders. Such an equation, however, may have limited predictive ability because Poiseuille’s model simplistically assumes a long straight tube with constant morphometry, a Newtonian fluid, and steady laminar flow. These assumptions are not valid for clinical measurements because blood is not a Newtonian fluid, venous flow is not steady, the dynamic viscosity of blood is not constant, and the portal vein is bifurcated, with multiple branches, varying in size between the inlets and the outlets. The portal vein will not continue to dilate or attenuate indefinitely, nor will more blood flow through the liver over time than the elastic properties of the vessels and hepatic resistance will allow. Consequently, the term r 4 ΔP is not always correlated with blood flow through the portal vein. Furthermore, because echogenicity may be elevated by intrahepatic fat deposition rather than hepatocyte damage, ECHO grade levels do not necessarily predict hepatic resistance. Nevertheless, the equation serves as a conceptual framework to justify the modeling of coincident morphometric and physiological measures on the portal venous system to predict the probability of liver disorders.
It is possible that measures related to the portal vein pressure gradient are not significantly influenced by fat infiltration of the liver, and they may provide improved sensitivity and/or specificity compared with alternative screening methods 23 ; however, at the present time, there is no clinical evidence to support this suggestion (Figure 10). Further research is therefore warranted to determine the relative efficacy of portal vein pressure gradients relative to hepatic venous waveforms and echogenicity as predictors of liver disorders.
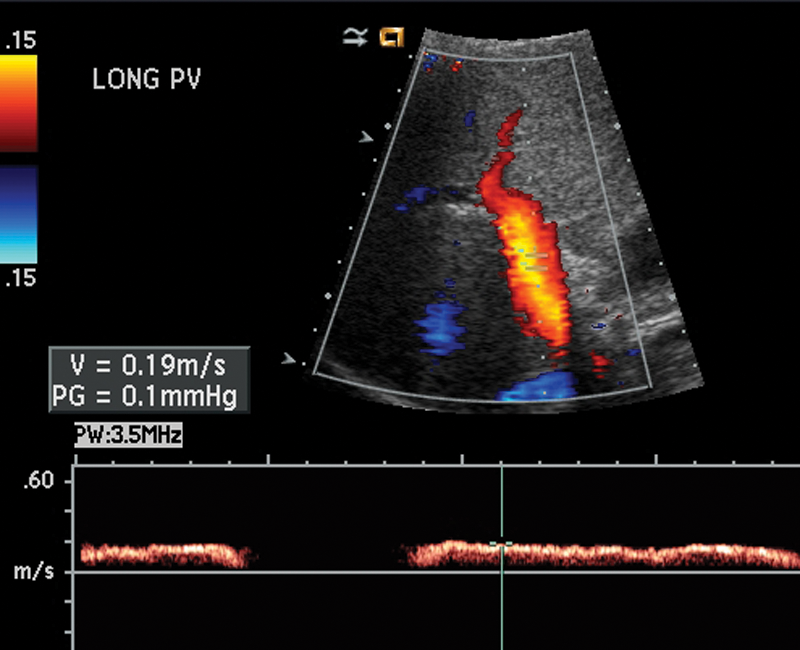
Normal hepatopetal flow in portal vein.
Methods
Sample
The data were extracted from the records of 465 adult (18- to 70-year-old) patients (n = 229 [49.2%] women and n = 236 [50.8%] men), all of whom received abdominal sonograms at a western regional medical center between March 2010 and December 2010. Both hospital and university institutional review board (IRB) approval was obtained prior to the collection and analysis of the data. The exclusion criteria were patients referred with known carcinoma, congestive heart failure, blood-clotting disorders, and/or morbid obesity (body mass index [BMI] ≥35). Positive test results for serum biomarkers, liver biopsies, and/or endoscopies were recorded for 293 cases. The 172 controls comprised patients with negative test results. The frequency distributions of the cases and controls, cross-classified with respect to gender, race, BMI, Doppler-derived portal venous pressure gradients (PVPG), HVW, and the echogenicity of liver parenchyma (ECHO grade), were analyzed. Binary logistic regression analysis 27 was used to determine if sonographic and Doppler-derived observations could predict the likelihood of hepatocellular damage in the cases relative to the controls. The logistic model was defined by

where p is the probability of a patient being classified as a case (coded as 1) relative to being classified as a control (coded as 0), C is a constant, and
It is not possible using a case-control design to estimate the relative risk of patients being tested positive rather than negative for a specified disease because the sampling fraction of the population is unknown. Consequently, in this study, an odds ratio (OR) was estimated to predict the probability of a patient being classified as a case for a given ordinal level of a predictor, relative to being a control, assuming that the levels of the other predictors were constant. An OR significantly greater than 1.0 at the .05 level of significance inferred that the probability of hepatocellular damage in a case was, on average, more than one times greater than the probability of no hepatocellular damage in a control. The odds ratios were compared with the sensitivities and specificities extracted from 2 × 2 cross-tabulations partitioned into two categories of BMI (normal, <25; overweight and obese, 25–35). 28
Results
Demographics
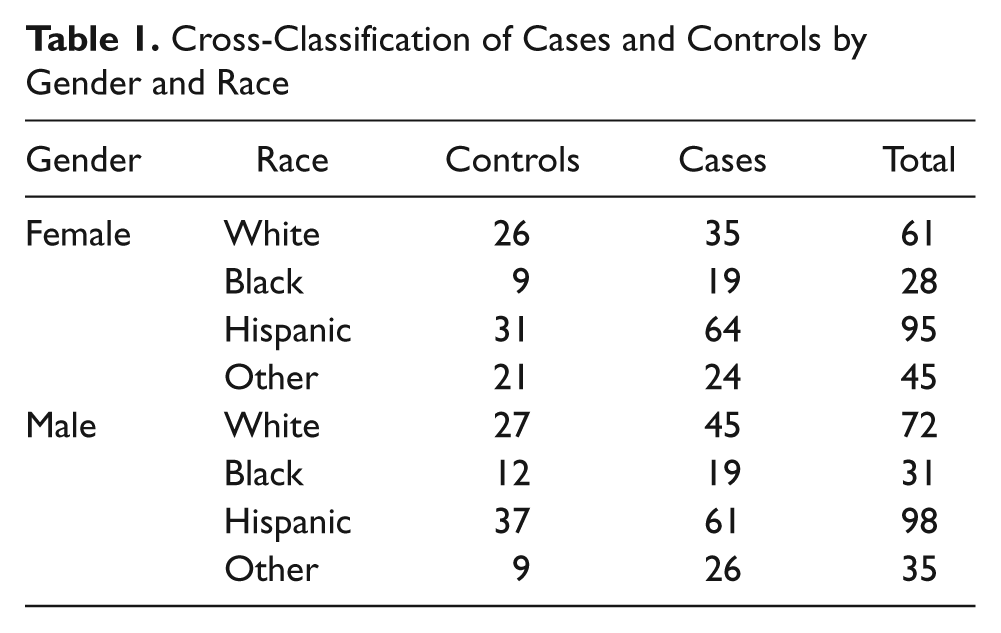
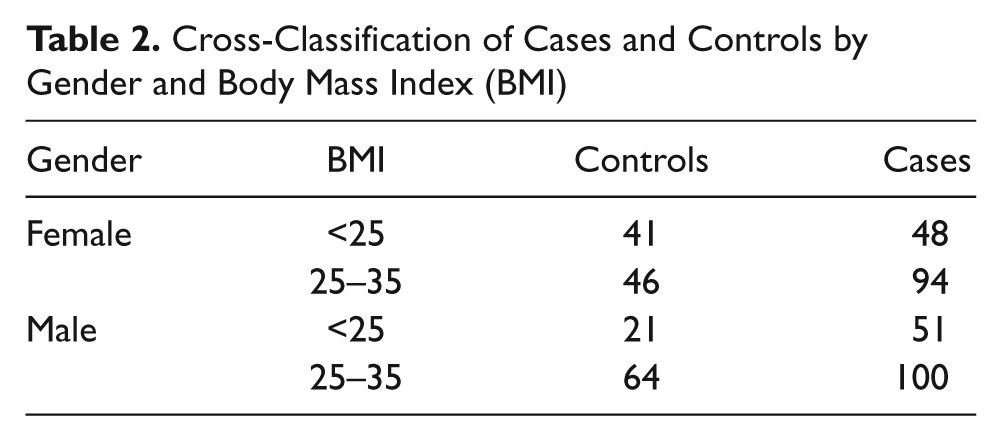
The frequency distributions of the 465 patients, classified into cases and controls, as well as cross-classified by race and gender, are presented in Table 1. Since the sample was purposive, it did not fulfill the random sampling criterion to estimate a population-based prevalence for liver disease. 29 The 293 cases, representing 63.0% of the sample, included 142 women and 151 men. Their disease status was gallbladder disease, 28.3%; nonalcoholic steatohepatitis (NASH) and nonalcoholic fatty liver disease (NAFLD), 21.2%; hepatitis, 29.4%; and cirrhosis and ascites (confirmed by biopsy), 21.2%. The 172 controls representing 37.0% of the patients included 87 women and 85 men. The proportions of racial groups and genders were equivalent to their relative proportions in the geographic region. No statistically significant associations were found between the cases and the controls with respect to gender (χ2 = 3.588, P = .313) or race (χ2 = 0.781, P = .941). Although morbidly obese patients (BMI >35) were excluded, 304 overweight and obese patients (BMI 25–35) representing 65.4% of the sample were included, comprising 23.7% of the controls and 41.7% of the cases. The cross-classification of two categories of BMI versus gender (Table 2) indicated that a significant association existed between the cases and the controls among the female patients (χ2 = 4.031, P = .045) but not among male patients (χ2 = 2.110, P = .146). Because the observed frequency of overweight and obese female patients among the cases was significantly higher than expected, the possibility of a gender effect was eliminated by controlling for BMI in the logistic regression.
Cross-Classification of Cases and Controls by Gender and Race
Cross-Classification of Cases and Controls by Gender and Body Mass Index (BMI)
Sonographic and Doppler-Derived Measures
The mean (SD) portal vein diameter in the controls was D– = 8.17 (2.08) mm and was used to calculate the modified portal vein pressure gradient, resulting in a multiplication factor ranging from 0.37 to 2.45 and implying both attenuation and dilation relative to the norm. The mean (SD) portal vein diameter in the cases was 9.61 (2.86) mm, which, in terms of both statistical and clinical significance, was higher than in the controls (t = 5.77, P < .001, Cohen’s d = .55).
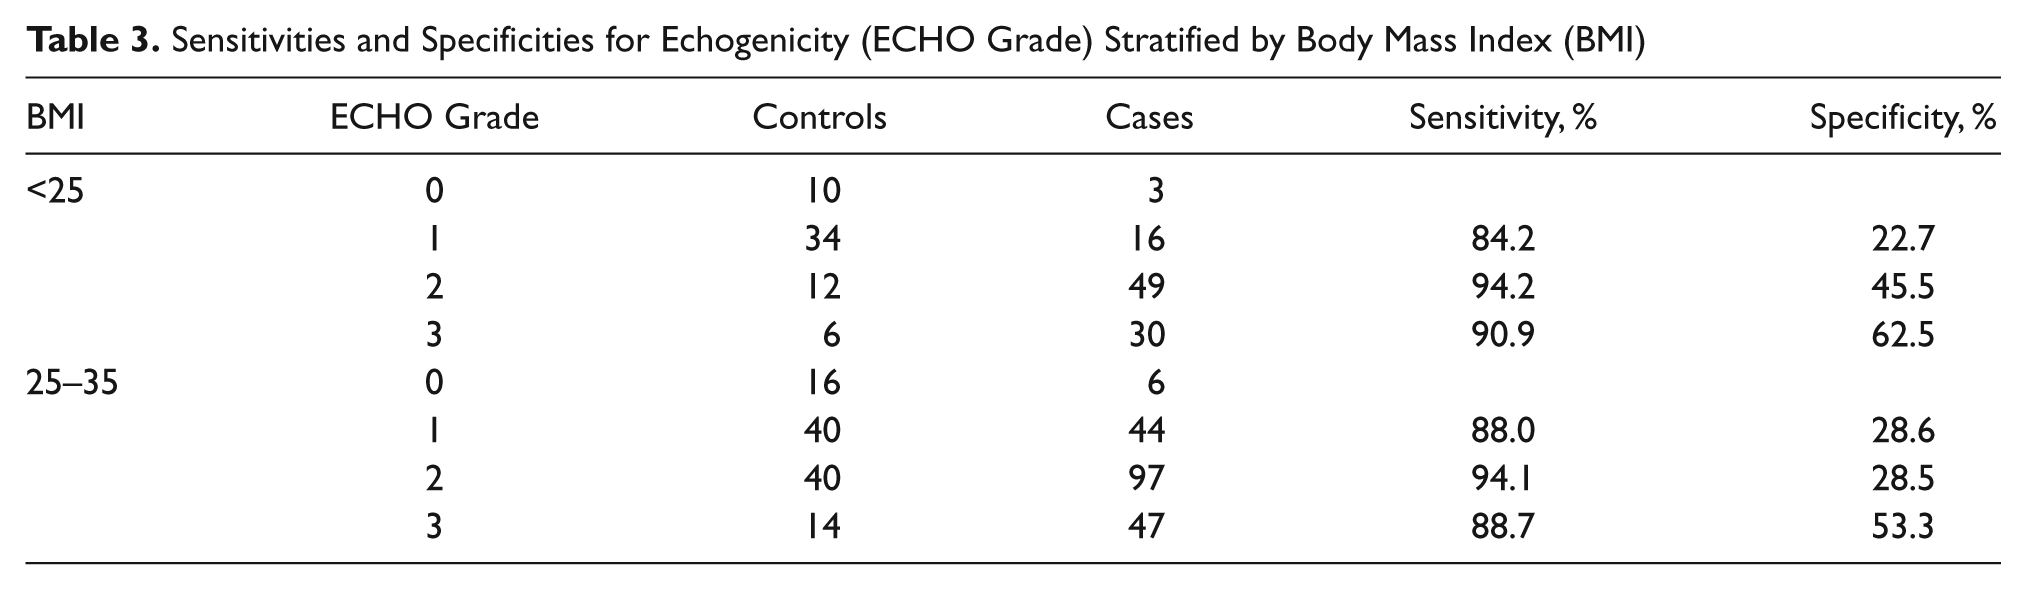
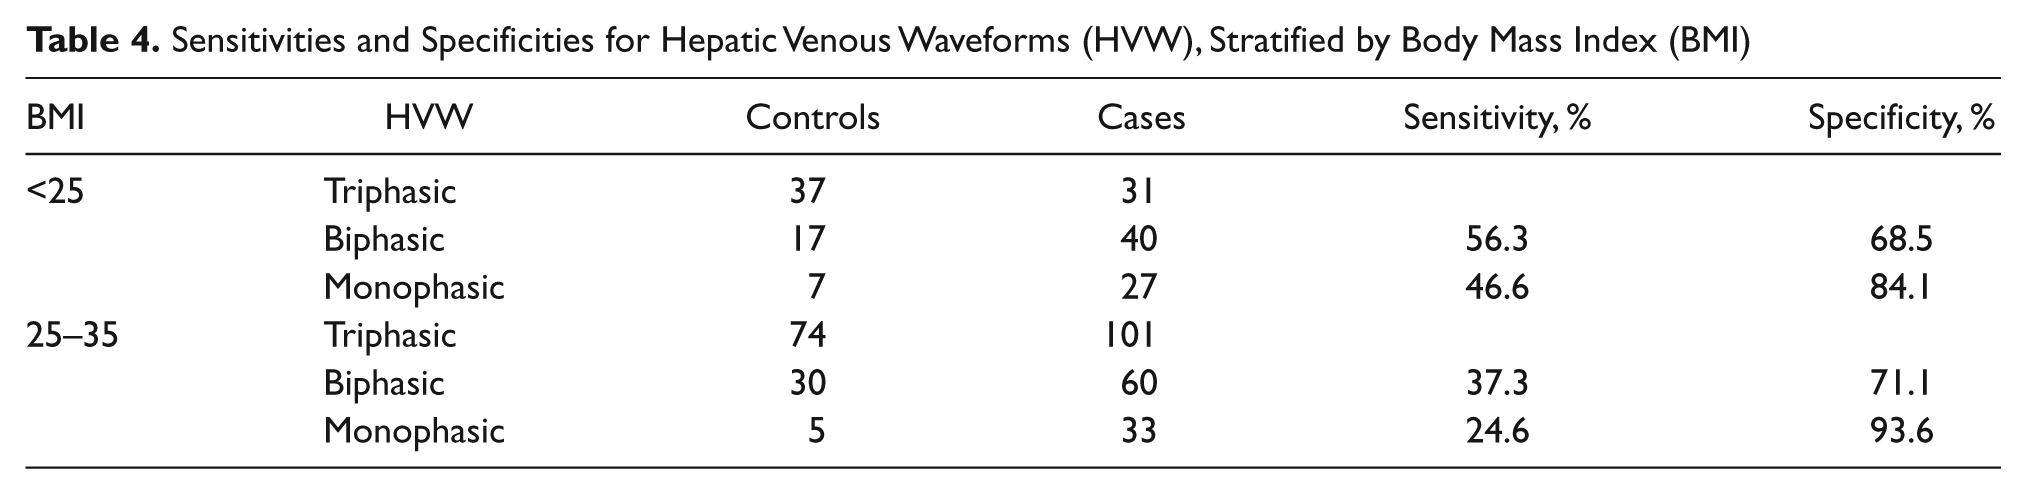
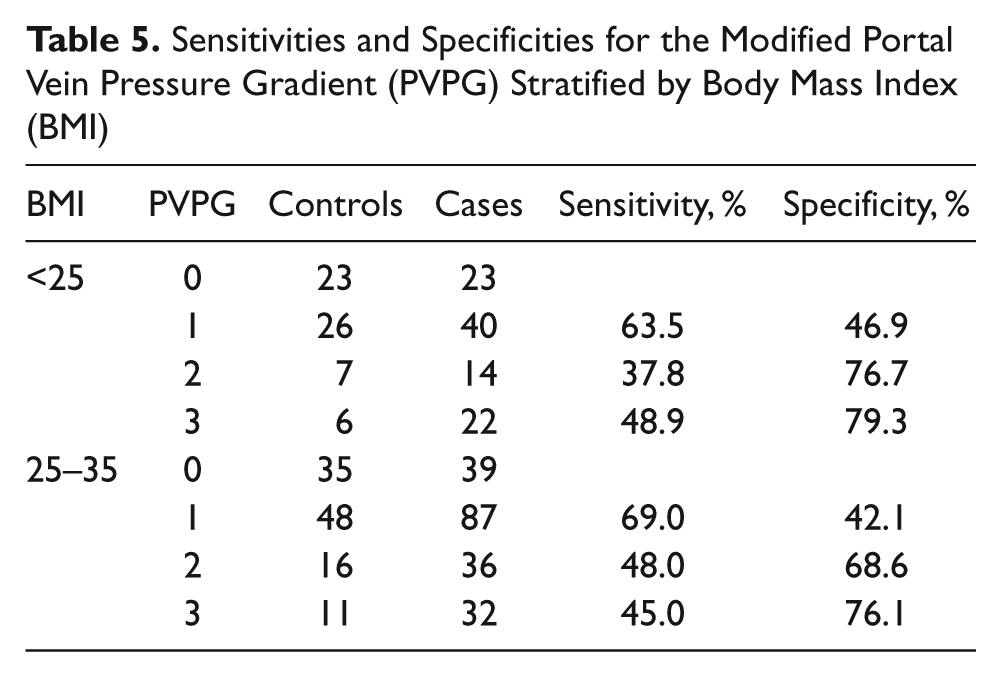
The frequency distributions of the cases and the controls were cross-tabulated with respect to the ordinal levels of ECHO grade (Table 3), HVW (Table 4), and PVPG (Table 5) to estimate sensitivities and specificities. The sensitivities for the three levels of echogenicity were high (84.2%–94.2%) and varied little between the two levels of BMI. In contrast, the specificity for ECHO grade levels 1 and 2 was very low for the overweight and obese patients (28.6% and 28.5%, respectively). The sensitivities for the two levels of HVW were consistently moderate in the normal-weight group (46.6%–56.3%) but very low among the overweight and obese patients (24.6%–27.3%). The specificities for the monophasic and biphasic waveforms were high among both levels of BMI (68.5%–93.6%). The sensitivities for the two highest levels of PVPG were consistently moderate in both the normal-weight group (37.8%–48.9%) and the overweight and obese group (45.0%–48.0%). In contrast, the specificities for the two highest levels of PVPG were consistently high for both levels of BMI (68.6%–76.1%). The inferences from these data were that the conditional probabilities of detecting potential hepatocellular damage in the cases were consistently higher for echogenicity and relatively moderate for the HVW and PVPG. On the other hand, the conditional probabilities of not detecting potential hepatocellular damage in the controls were consistently the lowest for the ECHO grade levels, particularly for the overweight and obese patients. The specificities were consistently higher for the HVW and PVPG, irrespective of BMI.
Sensitivities and Specificities for Echogenicity (ECHO Grade) Stratified by Body Mass Index (BMI)
Sensitivities and Specificities for Hepatic Venous Waveforms (HVW), Stratified by Body Mass Index (BMI)
Sensitivities and Specificities for the Modified Portal Vein Pressure Gradient (PVPG) Stratified by Body Mass Index (BMI)
Logistic Regression
The binary logistic regression model is presented in Table 6. All the odds ratios for the predictor variables were statistically significant (P < .05) and greater than 1.0 (indicated by 95% confidence limits). The likelihood of hepatocellular damage was predicted to increase systematically with respect to (1) a stepwise increase in the ECHO grade level from 1 (OR = 2.94) through 2 (OR = 10.50) to 3 (OR = 14.91) relative to 0 (normal), coincident with (2) a stepwise change in the HVW from biphasic (OR = 1.66) to monophasic (OR = 3.68), and (3) a simultaneous stepwise elevation in the PVPG from 1 (OR = 1.85) through 2 (OR = 3.23) to 3 (OR = 3.35). The odds ratios were consistently higher for the three ECHO grade levels, compared with the odds ratios for the dampening of the HVW and the elevation in the PVPG. The odds ratios for each predictor of hepatocellular damage tended to increase nonlinearly with respect to an increase in the sensitivities but not to the specificities.
Binary Logistic regression Model to Predict the Probability of Cases Relative to Controls
HVW, hepatic venous waveforms; PVPG, portal vein pressure gradient.
Significant predictor at P < .05.
Discussion
Echogenicity
Echogenicity was found in this study to provide the most sensitive method of screening for potential hepatocellular damage. The odds of predicting a patient as a case relative to a control was up to about 15 times greater when the echogenicity levels of the liver parenchyma were elevated, but only about 3 to 4 times greater when dampening of the HVW and portal hypertension were detected. Elevated echogenicity also provided the highest sensitivities, reflected by observing the abnormal ECHO grades 1, 2, and 3 in 97% of the cases. This finding does not, however, imply that echogenicity was the most efficacious screening procedure. Echogenicity also exhibited low specificity, risking false positives in patients with no underlying hepatopathology, indicated by observing ECHO grade 0 in only 5.6% of the controls. A possible reason for the high frequency of false positives was that 65.4% of the patients in the sample were overweight or obese. Elevated echogenicity was observed in 92.7% of these patients, including 85.5% of the controls, whose livers theoretically should not be classified as echogenic. Consequently, the exclusion criterion of BMI >35 did not filter out the false positives with respect to echogenicity. A fat-infiltrated liver mimics fibrosis, appearing more echogenic (i.e., whiter than a normal liver) on the image.10–13 The low conditional probability to not detect hepatocellular damage in the controls was therefore assumed to be associated with fat infiltration causing structural and hence echogenic changes in the livers of a substantial proportion of the overweight and obese patients.
Hepatic Venous Waveforms
The results of this study validated other observations15,24 by confirming the existence of a statistically significant relationship between the dampening of the hepatic venous waveform and hepatocellular damage. Compared with echogenicity, however, the HVW displayed relatively low sensitivity. The abnormal monophasic waveform was observed in only 34.2% of the cases. In contrast, the HVW was fairly specific. Normal triphasic waveforms were observed in 65.3% of the controls.
The finding that 34.7% of the controls exhibited abnormal hepatic venous waveforms was consistent with the suggestions that dampened waveforms are common in patients without liver disease. 30 However, assertions that the HVW has no diagnostic value, because there is no correlation between liver dysfunction and waveform patterns,25,31 were not confirmed. The evidence provided in this study for the existence of such a correlation is that the logistic regression model predicted that a dampening of the HVW from triphasic to monophasic would increase the odds of hepatocyte damage by a factor of about 4. Conflicting conclusions regarding the interpretation of hepatic venous waveforms are common, 5 possibly because false-positive tests may be attributed to various respiratory maneuvers when collecting the data. Respiratory motion that influences the HVW is a potential reason for the discrepancies. 32 To obtain accurate results, waveforms must be acquired during quiet normal respiration. 13 Intrahepatic fat deposition may also dampen the HVW, 18 providing a possible explanation for observing abnormal waveforms in more than half of the overweight and obese patients in this study. The exclusion criterion of BMI >35 did not filter out all the false positives. Consequently, various etiologies, including obesity, imply that it is more difficult to correctly predict hepatopathology using Doppler-derived tracings of the HVW than by use of echogenicity.
Portal Vein Diameter
The mean portal vein diameter in the cases was 9.61 mm, significantly larger by 1.44 mm than in the controls. In comparison, the mean (SD) portal vein diameters reported by other researchers using sonographic evaluation in healthy individuals or cadavers were 11.45 (1.49), 20 10.35 (1.57), 24 6.3 (2.3), 33 and 11.0 (2.0). 34 In patients with known liver diseases (NAFLD and cirrhosis), the mean (SD) portal vein diameters were 10.77 (15.1) 24 and 13.52 (2.48), 25 respectively. Many possible sources of variability may confound the interpretation of portal vein diameter, including race, gender, and age, as well as the posture of the subjects, different types of instrumentation, and sites of venous measurement.20,35 Because the portal vein is bifurcated, with multiple branches, and its inlet and outlet diameters are unequal, the site of measurement is critical. Patient obesity may also mask diameter measurements. The portal vein is easily visualized when liver texture is homogeneous but becomes difficult to see with advanced fat infiltration of the liver. 13 Although Doppler-derived measures of portal vein diameter do not always detect the presence of liver disease, 36 the findings of this study were consistent with others34,37 that the portal vein diameter, hepatocellular damage, and portal hypertension are linked. Vasodilation is a compensatory mechanism to improve the blood flow in the face of increasingly nodular lesions blocking flow through the liver. As the nodularity increases, the blood takes the path of least resistance. It is easier for the blood to follow collateral channels rather than course through a nodular liver. As collateral venous flow increases, the amount of flow traversing the liver is reduced, and the probability of patients having significant hepatic fibrosis and cirrhosis becomes a function of decreased portal vein velocity. 38 Ultimately, hepatofugal or reversed flow develops, which could explain why the portal vein can shrink in response to cirrhosis. 21
The threshold portal vein diameters beyond which a clinician may diagnose portal hypertension are reported to be 10 to 13 mm.11,39 Attenuation of the portal vein to a diameter of less than 10 mm, however, is also reputed to be diagnostic of cirrhosis. 21 It is evident that the very high variability and overlaps in the measurements of the portal vein diameter in healthy and diseased patients observed in this and other studies imply that the use of a single threshold value as a universal diagnostic measure is too simplistic. Considered in isolation, the clinical significance of a threshold portal vein diameter to diagnose liver disorders appears to be very limited. When considered in combination with the portal vein pressure gradient, as applied in this study, however, the morphometry of the portal vein may have a more precise and useful diagnostic value.
Portal Vein Pressure Gradient
There is no consensus on exactly what the portal vein pressure gradient should be to diagnose portal hypertension. The normal pressure in the portal vein is between 5 and 10 mm Hg, classified as 0 on the ordinal scale for the PVPG used in this study. Thresholds to indicate portal hypertension of between 10 and 13 mm Hg (classified as 1 on the ordinal scale used in this study) have been suggested.11,40 An increase in the modified portal vein pressure gradient scale from 0 to 3 was found to increase the probability of identifying a case rather than a control by a factor of approximately 3, similar to the OR of about 4 for a dampened HVW, but substantively less than the OR of nearly 15 for the elevated echogenicity of liver parenchyma. Consequently, although the results of this study failed to confirm that the portal venous pressure gradient is a more sensitive predictor of hepatocellular damage than echogenicity, the results were not consistent with the assertion that Doppler-derived pressure gradients have little or no clinical significance to detect liver fibrosis. 41 The main problem with the PVPG was that it exhibited relatively low sensitivity compared with the echogenicity. Only 35.5% of the cases were classified in levels 2 and 3 of elevated PVPG. Nevertheless, its specificity was higher, with only 8.6% of the controls classified in levels 2 and 3. The high specificity may be because the risk of false positives due to fat infiltration of the liver in overweight and obese patients is reduced.
There are a number of limitations of this study. The conceptual framework underpinning the study was intentionally relatively simplistic to allow a starting point for data collection and analysis. The modeling was empirical, and it is clear that more sophisticated mechanistic models are necessary for further research on blood flow through the portal vein. 42 Ultimately, the parameterization of such models with sonographic and Doppler-derived screening measures could be used to simulate the effects of hepatocellular damage on portal hypertension and to predict the risks of liver failure and mortality in individual patients. 43 Another limitation was that the screening measures compared in this study might reliably predict a defined status of liver disease but may be less sensitive and/or specific when all types of hepatopathology are combined into a single outcome. It is recommended that future case-control studies separate the outcomes of the cases into multiple liver disease states to construct a multinomial logistic regression model.
Conclusions
Echogenicity, hepatic venous waveforms, and the multiplicative combination of portal vein pressure gradients and portal vein diameters were all statistically significant (P < .05) predictors of hepatocellular damage in this case-control study. As the ECHO grade of the parenchyma increased, so did the odds of liver disease. As the venous waveform dampened from triphasic to monophasic and the modified pressure gradients increased, so did the odds ratios, but not as much as for an increase in echogenicity. Echogenicity was by far the most sensitive of the screening procedures; however, its specificity was low, assumed to be associated with fat infiltration of the liver, resulting in false positives among overweight and obese patients in the absence of hepatopathology. The specificity of the HVW and modified portal vein pressure gradient was higher than for echogenicity, irrespective of BMI, possibly because intrahepatic fat produces less false positives when these measures are practiced. This study introduced two novel methods. One method involved applying the cardiac presets to the abdominal sonogram to change velocity measurements to pressure gradients. This method might encourage referring hepatologists, who generally work with pressure gradients in their clinical practice, to correlate clinical findings with recorded venous pressure gradients. A new mathematical modifier was also used, which took into account the multiplicative interaction between the change in the diameter of the portal vein and the pressure gradient. Since extreme variability in the portal vein morphometry appears to preclude the value using a universal threshold size as a diagnostic measure, such a mathematical modifier might provide a pathway for additional research to model the dynamics of blood flow in the hepatic venous system, ultimately leading to more sophisticated methods of screening for liver disorders.
Footnotes
Acknowledgements
I thank Dr Shana Morrell, Dr Diane Neal, and Dr William Barkley for their guidance through my dissertation. I would also like to acknowledge the sonography staff at Community Regional Medical Center for their assistance in obtaining the raw data for this research study.
Declaration of Conflicting Interests
The authors declared no potential conflicts of interest with respect to the research, authorship, and/or publication of this article.
Funding
The authors received no financial support for the research, authorship, and/or publication of this article.