
Abstract
We present a model for Valley of Mexico site response that is referenced to a 30 m time-averaged shear wave velocity (V S 30) of 760 m/s. This reference condition ensures compatibility with regional ground motion models (GMM) for Central America and Mexico (CAM), which were developed from an expanded version of the NGA-Subduction (NGA-Sub) database as described in a companion paper. The site response model is derived using ground motion data from 89 sites within the Valley of Mexico and uses V S 30 and soft soil depth as independent variables, the former of which was evaluated using shear wave velocity from literature for 56 sites (10 co-located with ground motion stations). As a consequence of the unique Lake Texcoco geology, the model predicts far greater levels of site response than those provided by global ergodic models, and notably, larger site response than prior models for the Valley of Mexico that had utilized a reference site approach using a medium-stiff soil site as the reference site. Linear amplification increases with decreasing V S 30 in a period-dependent manner that captures strong resonance effects associated with variable depths of soft lacustrine soils. Site period is found to not appreciably improve predictions, due to strong negative correlation with V S 30. Differential depth (depth minus V S 30-conditioned mean depth) produces repeatable trends of reduced short period amplification and increased long period amplification for especially deep sites, the effects of which are modeled. We identify nonlinear site response for high-frequency ground motions using variable-amplitude reference site ground motions. The provided models improve upon current practice for Mexico because the reference GMM applies across CAM, V S 30 and soft soil depth are used in lieu of site classes, and nonlinearity is incorporated.
Introduction
Site response is fundamentally a ground motion difference between two site conditions. One is a reference condition, generally involving relatively competent materials, while the other is the site condition at a particular site of interest. Reference site and non-reference site approaches can be used to measure these ground motion differences (Field and Jacob, 1995). Site response in the Valley of Mexico, which contains Mexico City, has typically been evaluated in past work using reference site approaches (Borcherdt, 1970, 1994), in which ground motions on various site conditions are normalized by ground motions from reference sites. The site amplification that is derived depends on the attributes of the reference site or sites, which have usually been taken (for applications outside of the Valley of Mexico) as bedrock sites. Non-reference site approaches define the reference condition not for a single site, but for a parameterized site condition as derived from seismological inversions or as used in ground motion models (GMMs); large values of time-averaged 30 m shear wave velocity (V S 30 = 760–1000 m/s) are typically selected.
Current practice is that ground motion estimations for sites in the Valley of Mexico are based on a reference site approach having two basic steps (e.g. Ordaz et al., 2024; Ordaz et al., 1994; Reinoso and Ordaz, 1999). The first step pertains to the estimation of reference site ground motions, which are for a specific location on the UNAM campus in the hill zone adjacent to the Valley of Mexico lakebed (referred to as the CU site). The second step estimates site response for various locations in the Valley of Mexico relative to the reference site. There are several drawbacks to this traditionally applied approach, including the need for a GMM for a single reference site, which necessarily produces data sampling problems (the available data for a single site are limited) and divorces the ground motion estimation for the Valley of Mexico from locations elsewhere in Mexico, which use GMMs derived from much larger databases.
We revisit the well-studied problem of Valley of Mexico site response using a non-reference site approach, which to our knowledge has not been applied previously for this important locale where site response has produced structural damage (e.g. Mayoral et al., 2019a; Singh et al., 2018). The benefit of this alternative approach is that it can produce site factors that are consistent with regional GMMs, thus avoiding the need for distinct ground motion estimation procedures in Mexico City and the remainder of Mexico. Such approaches have been applied elsewhere to derive regional (e.g. Parker and Stewart, 2022) and local (Wang et al., 2022) site response models in subduction zone regions. We first review the lakebed geology and zonation procedures used to characterize spatial variations in site conditions. We then synthesize site data for the purpose of developing site parameters for ground motion stations and for estimating values of site parameters in geotechnical zones. We describe current procedures used for ground motion estimation in the Valley of Mexico and provide example results. We then describe the application of a non-reference site approach with available ground motion data, from which a subregional site response model (i.e. model specific to the Valley of Mexico) is developed that is conditional on V
S
30. The model is compared to site response estimated using currently applied reference site procedures—large differences are observed that are related to appreciable site response at the reference site—and is validated against a testing data set from the 1985
Geology and zonation
Mexico City is located within the eastern sector of the Trans-Mexican Volcanic Belt, north of the volcanic front (i.e. on the backarc side). Figure 1 depicts the geology of the subregion, as adapted from Flores-Estrella et al. (2007) and Arce et al. (2019). Zones delineating different geotechnical conditions are shown in Figure 2. These zones were originally derived from geologic maps and geotechnical logs (Marsal and Mazari, 1969; Romo et al., 1988). As indicated by Lermo et al. (2020), the zones were refined by Normas Técnicas Complementarias para el diseño por Sismos (NTCS) (2004) in consideration of site period maps by Lermo et al. (1988) and Lermo and Chávez-García (1993, 1994a, 1994b) and have been used for site classification purposes.
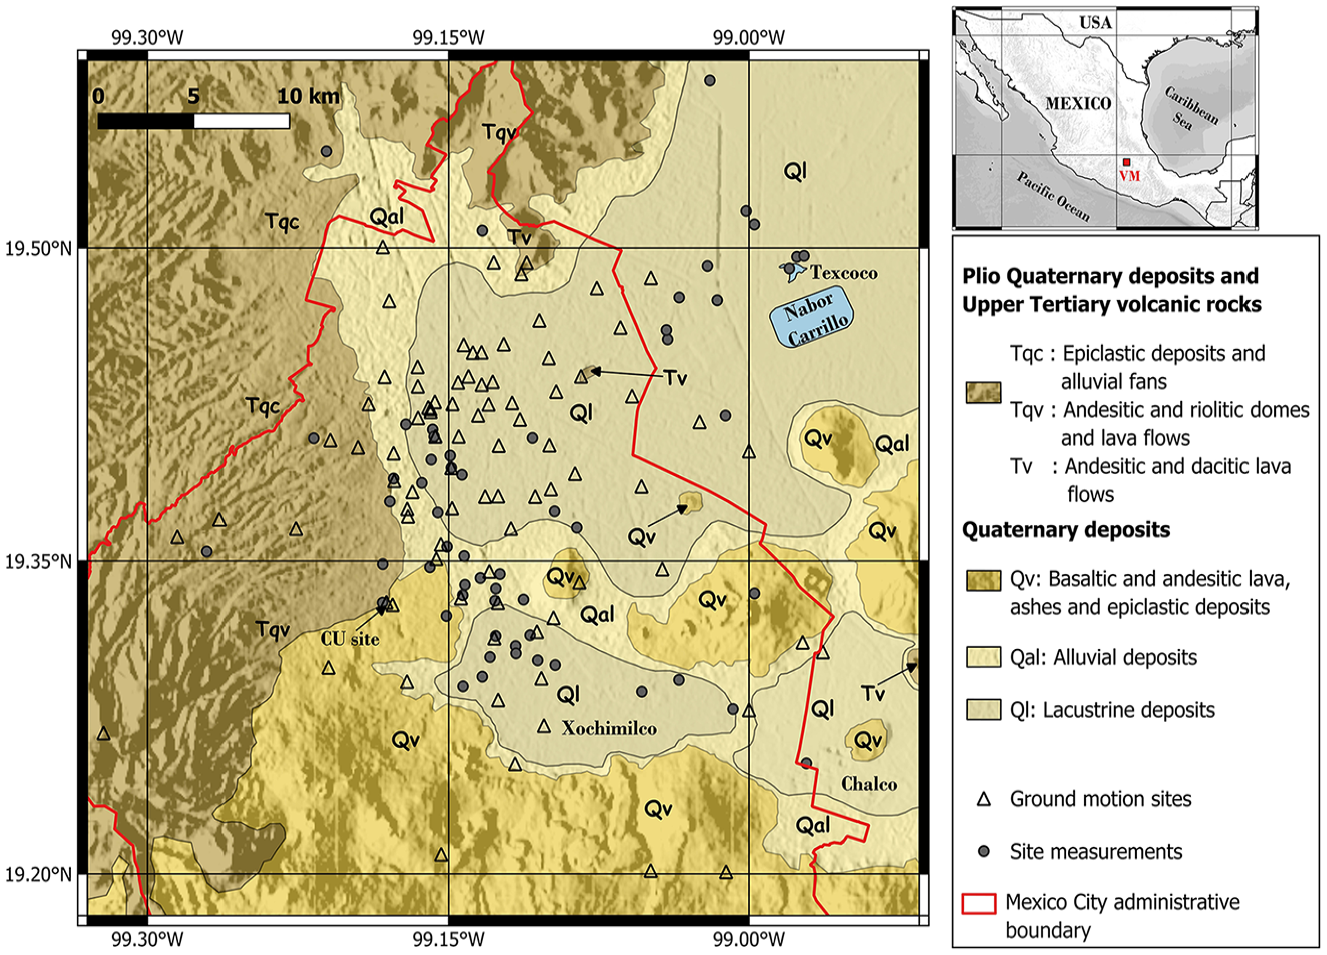
Map showing Valley of Mexico (VM) region including surface geology (adapted from Flores-Estrella et al., 2007 and Arce et al., 2019) and locations of ground motion stations and seismic velocity profiles considered in this research. The location of the reference CU site is shown.
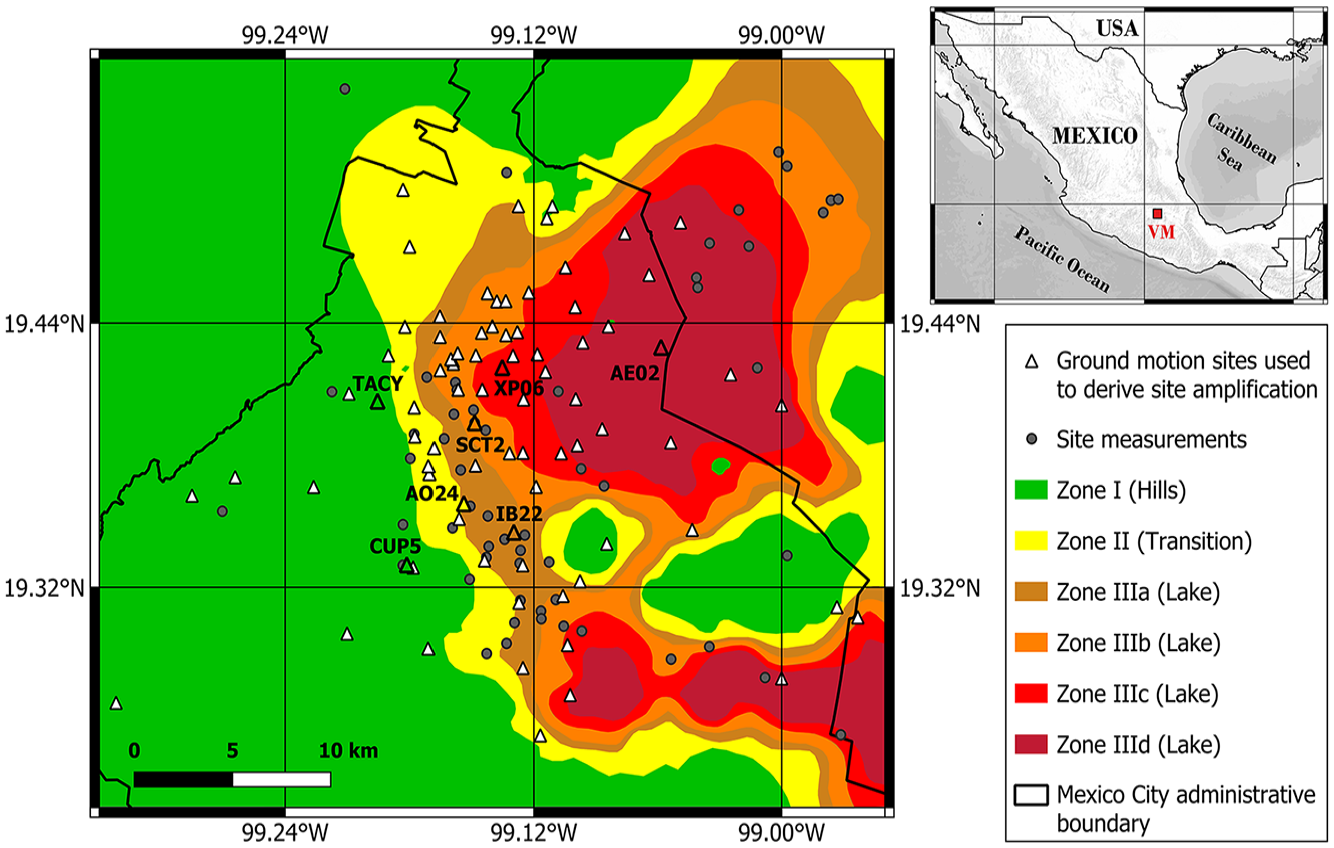
Map of Valley of Mexico (VM) showing zones used for site classification per NTCS (2004). Also shown are locations of selected recording sites used to analyze site response. Locations of seven sites located in six different zones are indicated, which are subsequently used to provide example results.
Within the Valley of Mexico, the lakebed contains lacustrine sediments that are remnants of ancient Lake Texcoco. The lake occupied the entire Valley of Mexico between the Pleistocene epoch and the last glacial period (about 11,000 years ago). The lake zone is indicated in Figure 1 by the Ql unit and includes the Texcoco Lake (while this was once encompassing the entire Valley of Mexico, as used here it refers to a smaller lake in the post-Aztec era), Xochimilco Lake, and Chalco Lake (Romo et al., 1988). These smaller lakes existed as recently as 1245 (upon arrival of the Aztecs), after which the lakes were impacted by human activity (Alcocer and Williams, 1996). Geotechnical conditions in these lake zones consist of a surface layer of desiccated alluvial deposits overlying thick and soft lacustrine clay interbedded with thin seams of sands, silty sands, volcanic glass, and fossils, which is locally known as the Upper Clay formation. Underlying this formation are hard deposits of silty, weakly cemented sands, a deeper clay stratum known as the Lower Clay formation, and compact lacustrine cemented silty sands and gravels. The Xochimilco–Chalco Lake consists of a clay deposit (somewhat stiffer than the Upper Clay formation in Texcoco) with interbedded seams of silty sands, silts, and sands. This clayey deposit is underlain by a basalt layer (lava flow). The lakebed area has four subzones (IIIa–IIId in Figure 2) that are differentiated in part by the period of the soil column (1.0–1.5 s, 1.5–2.5 s, 2.5–3.5 s, >3.5 s, respectively) (NTCS, 2004).
As shown in Figure 1, Quaternary alluvium occurs between the lake deposits and hill areas to the west and south, producing a geotechnical transition zone (denoted Zone II by NTCS, 2004; shown in yellow in Figure 2). These alluvial deposits have variable sequences of firm soils, sands, silty sands, and soft clays. The hill areas west of Lake Texcoco consist of Tertiary age epiclastic rock and alluvial fans (Flores-Estrella et al., 2007). Geotechnical materials encountered near the surface generally consist of silty sands with gravels and cemented tuffs. To the west and south of Xochimilco–Chalco Lake, Quaternary basaltic, andesitic, and epiclastic deposits up to 20 m in thickness overlie these formations (Flores-Estrella et al., 2007; Arce et al., 2019). These volcanic deposits were derived from a series of volcanoes in the region, including Iztaccíhuatl, Popocatépetl, La Malinche, Ajusco, and Nevado de Toluca. As shown in Figure 2, the hill zone is denoted as Zone I by NTCS (2004).
Site parameters
Data compilation
We have compiled available information on shear wave velocity (V
S
) profiles, site periods (T
S
), and depths to a firm horizon (Lower Coarse Grain layer,
Velocity data come from invasive (downhole, crosshole, suspension logging, seismic cone penetration) and noninvasive methods (Multi-channel Analysis of Surface Waves—MASW, Microtremor Array Measurements—MAM, Modified microtremor seismic method using SPatial AutoCorrelation—MSPAC, seismic interferometry—SI, seismic refraction). Site period data are derived from microtremor-based measurements of Horizontal-to-Vertical Spectral Ratios (mHVSR), the lowest frequency peaks of which reveal the fundamental mode site period (Nogoshi and Igarashi, 1970, 1971; Field and Jacob, 1993, 1995; Bonilla et al., 1997, 2002; Cadet et al., 2012; Satoh et al., 2001; Theodulidis et al., 1996). With the exception of 23 sites from Wood et al. (2019, 2024, 2023), site periods are provided without the source mHVSR curves, which means that the procedures used to select site periods may be inconsistent and other parameters (such as the height of peaks) are not available. For sites with V
S
profiles that reach a large impedance contrast (i.e. below the lower clay formation in Texcoco Lake or the basalt layer in Xochimilco–Chalco Lake), site period was also derived from V
S
profiles using the Simplified Rayleigh Method as given in Urzúa et al. (2017) using soil layers generally down to
Table A1 in the electronic supplement materials presents the compiled information for sites with a V
S
profile, including the measurement locations, zones (from Figure 2), V
S
30 values, derived site periods co-located with the V
S
profile where available, testing methods,
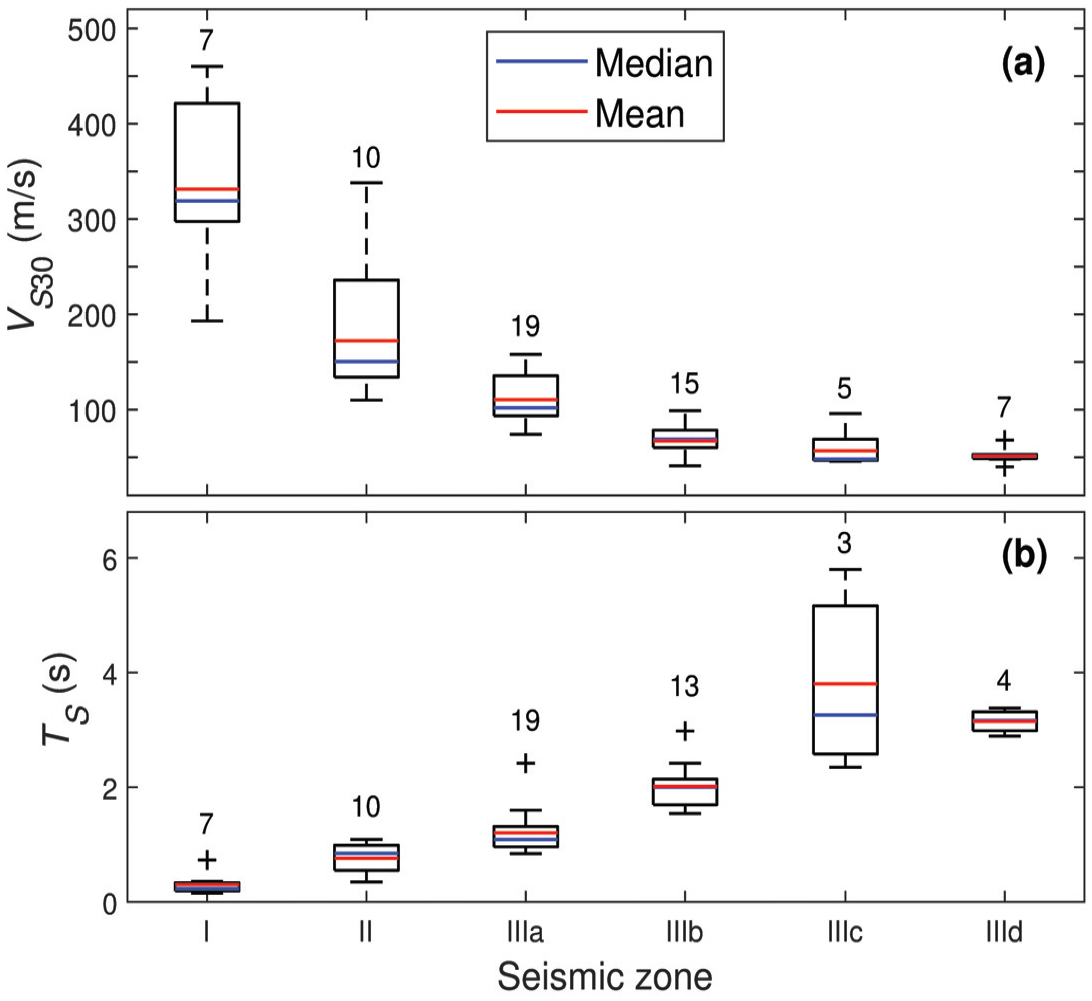
Figure 3 shows box and whisker plots of V S 30 and site period by zone. Both sources of site period (measured and derived from the V S profile) are used; for sites with both types of site period, the mHVSR result was used. Where an mHVSR measurement is not co-located with the ground motion site, we used values of site period from the large compilation of Lermo and Chávez-García (1994a) (409 sites within the Valley of Mexico). Median and mean values of V S 30 and site period are indicated by the blue and red lines in Figure 3, respectively. The lower and upper quartiles are indicated by the boxes and the extremes are indicated by the whiskers (extreme horizontal lines). Results in Figure 3 show that, on average, the three main zones (i.e. Zone I-Hills, Zone II-Transition, and Zone III-Lake) have statistically distinct values of V S 30, as judged by non-overlapping boxes. The subdivision of Zone III shows significant differences between V S 30 values in Zone IIIa and in the other zones (IIIb, c, d); however, the differences between these latter zones are lower and not necessarily significant. In the case of site periods, the zones have statistically distinct site periods. An exception is Zones IIIc–d, which present a similar median. Zone IIIc shows a large variability in comparison with the other zones, which may reflect natural variability or may be a consequence of data quality; further research would be needed to assess and potentially improve site period characterization in this area.
Box and whisker plots of (a) V
S
30 and (b) site period (
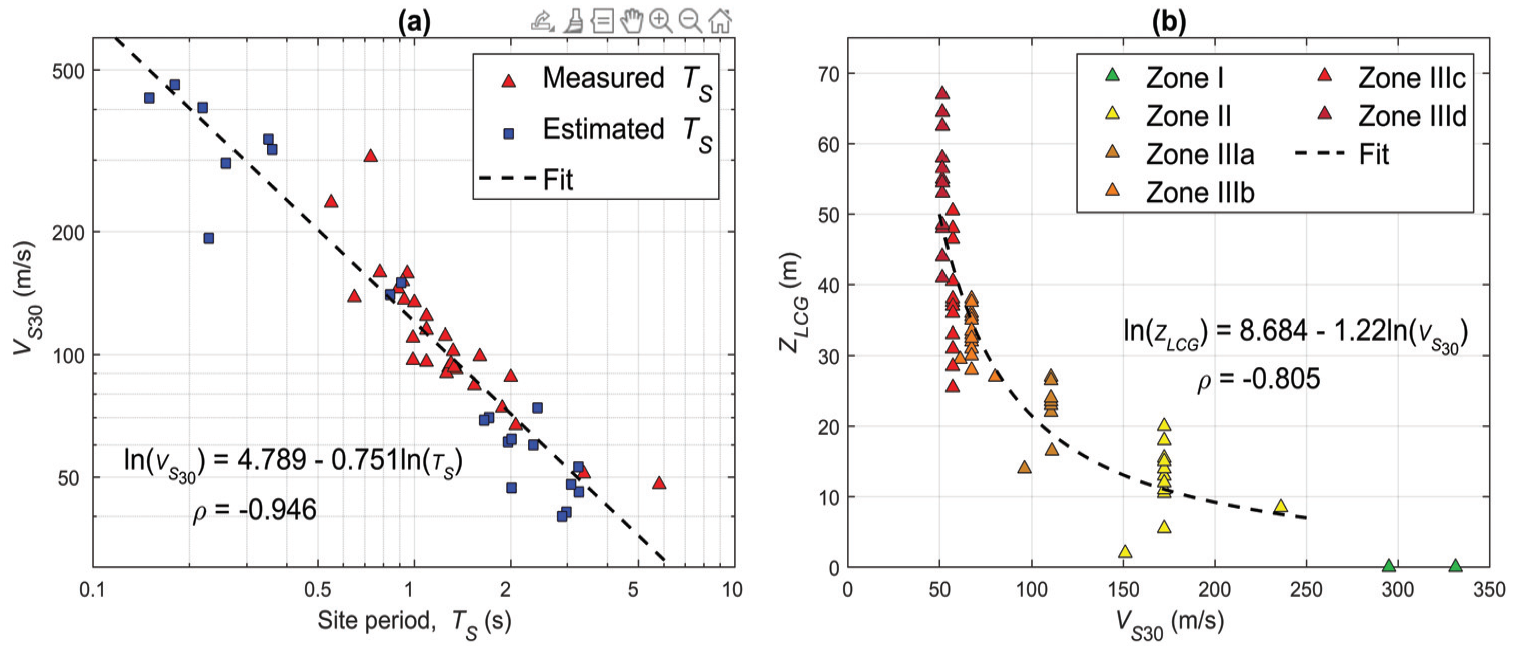
Figure 4a shows the relationship between V
S
30 and site period. The negative correlation is strong, with short-period sites having high V
S
30, and V
S
30 decreasing with increasing
Correlation between V
S
30 and (a) site period (
VS30 assignments
We apply protocols for characterizing V S 30 for ground motion sites as described by Ahdi et al. (2022). That study classified different methods of V S 30 prediction for sites without seismic velocity measurements. The data compilation in Table A1 was not available at the time the NGA-Sub database was assembled. Hence, while the general approach is the same as given by Ahdi et al. (2022), the assigned site parameters are different for sites that were already in the database, and many new sites have been added to the database.
The database contains 97 ground motion sites in the Valley of Mexico. Of these, 17 are Code 0 sites per Ahdi et al. (2022; their Table 5), meaning that V
S
30 was computed from a V
S
profile, which is taken as the exponent of the mean of the log values (
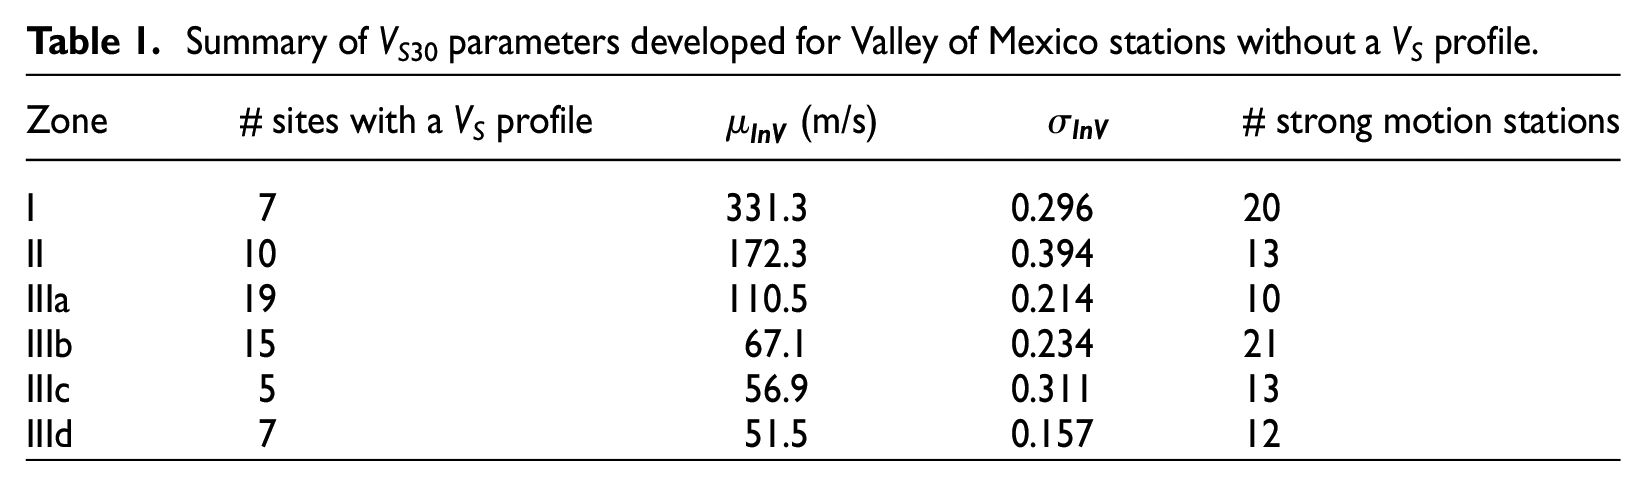
For the 80 sites without a V
S
profile, we assigned
Summary of V S 30 parameters developed for Valley of Mexico stations without a V S profile.
State of practice for ground motion prediction
Current seismic design in Mexico City uses response spectra that are derived using a two-step procedure:
Fourier amplitude spectra (FAS) are derived for a reference site in the hill zone (Ciudad Universitaria, CU site).
Reference site FAS are then modified using transfer functions for different locations and the resulting site FAS are converted to response spectra using random vibration theory.
These procedures are implemented for applications in an online software package, SASID (System of Seismic Actions for Design; https://sasid.unam.mx, last accessed October 2022, registration is required).
Four GMMs have been developed for the CU reference site (Arroyo et al., 2024; Jaimes et al., 2015; Jaimes et al., 2006; Ordaz et al., 1994). The number of recordings that are considered are equal to the number events and range from 21 to 23 for the first three models and 67 for the fourth (40 for “coastal” events, mainly interface, and 27 for intermediate depth events). These GMMs are referred to here as “single-site GMMs” to differentiate them from conventional GMMs that are derived considering data from many sites. It is currently unclear whether the GMM that is applied in the SASID software is a modified version of Ordaz et al. (1994) or the newer Arroyo et al. (2024) model. Contreras et al. (2023a) provided further details on the single-site GMMs and how they are applied to derive reference site spectra.
The transfer functions applied to modify the reference site FAS use data from recording sites in the Valley of Mexico and the CU reference site. The precise manner in which these calculations are performed in the current version of SASID is not well documented. The available documentation is provided by Reinoso and Ordaz (1999) and Ordaz et al. (2024), who describe procedures, whereby transfer functions are developed for a series of sites within each of the zones defined in Figure 2 (hill, transition, lakebed). As described by Reinoso and Ordaz (1999) and Ordaz et al. (2024), transfer functions are computed for each instrument location, and for locations between instruments, an interpolation procedure is applied.
Issues with these procedures that are addressed in the remainder of this article include:
The amount of data used to constrain the single-site GMM is small, which does not allow for the evaluation of important effects such as magnitude–scaling relationships that include region-specific break points, near-source saturation effects, region-specific anelastic attenuation effects that distinguish forearc and backarc attenuation, and differences between event types (interface vs intraslab).
The single-site GMM produces different ground motion estimates for the CU site than would be provided by regional models (e.g. Contreras et al., 2025; García-Soto and Jaimes, 2017; Jaimes and García-Soto, 2020; Kuehn et al., 2023), producing an artificial discontinuity in seismic hazard around the margins of Mexico City.
The site transfer function does not use site information (other than location) from the site of interest. As a result, the site information is assumed to be adequately represented by the averaging of transfer functions from neighboring sites. This does not allow for a local deviation of site condition, for example, from a filled stream channel or similar.
Nonlinearity in site response is not considered.
Due to limited documentation, the procedure is not reproducible. Analysts can apply the procedure through the SASID software but cannot independently apply or check it.
We illustrate site responses derived using the reference site approach as provided by the SASID software for 65 sites in the Valley of Mexico at the locations shown in Figure 2 that recorded three large events in 2017–2018. The SASID program requires only location as input. Effects of site period are implicit to the interpolation procedure. Nonlinearity is not considered, so parameters related to the strength of shaking are not required. As shown in Figure 5, response spectra amplification for sites in each of the five zones relative to Zone I follow a consistent pattern, whereby amplification decreases slightly from 0.1 s to about 0.2–0.3 s, increases to a peak that is variable in amplitude and peak period by zone, and then decreases at longer periods. The peak amplification values range, on average, from 1.0 in ln units (∼2.7) for Zone II to approximately 1.9–2.5 in ln units for lakebed zones (∼7–12). The period of the peaks increases with zone number, being about 0.8 s for Zone II and ranging from 1.5 to 3.0 s for Zone III. Within-zone dispersion across sites is modest.
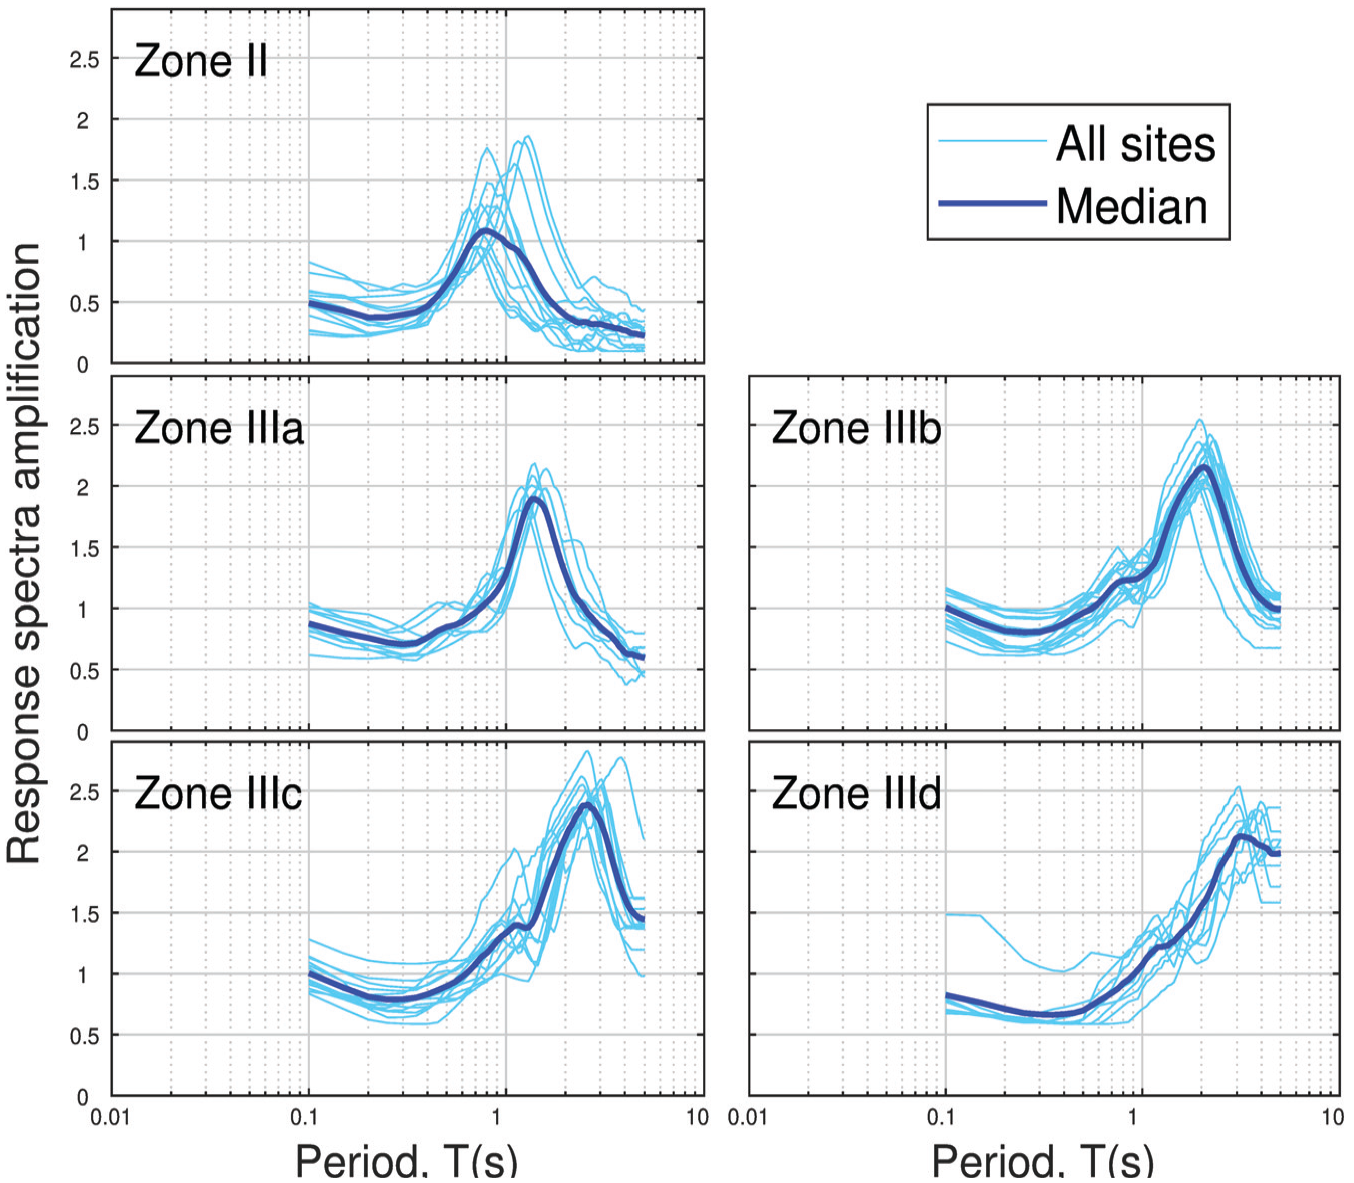
Response spectra amplification in natural log units for various locations in five Valley of Mexico zones using the methodology in SASID.
Analysis of Valley of Mexico site response
In this section, we first apply a non-reference site approach to estimate site response at ground motion recording sites in the Valley of Mexico. The estimated site responses are then used to develop a sub-regional site response model.
Ground motion analysis
The ground motion data used in this study are free-field acceleration recordings that include both body and surface waves, each of which contributes to the spectral accelerations used to infer site response. The analysis of ground motion data to evaluate site response effects follows a non-reference site approach (adapted from Field and Jacob (1995)). In this approach, residuals are computed between recorded data and a GMM, which are then partitioned to evaluate site effects. By using a GMM to develop the comparison spectra, our application of the non-reference site approach differs from Field and Jacob (1995), who used an inverted Fourier amplitude spectrum, although at a conceptual level, the approaches align. The GMM-based application of the non-reference site approach used here has extensive precedent (e.g. Parker and Stewart, 2022; Seyhan and Stewart, 2014). The data considered in this investigation are an expanded version of the NGA-Sub database—the expansion is to include additional events that had not originally been considered, including three large events in 2017–2018. Information on the expanded database is provided in Contreras et al. (2023a) and in a companion paper (Contreras et al., 2025) and is not repeated here. The GMM that is applied is the Parker et al. (2022) model developed in the NGA-Sub project with adjustments to account for additional anelastic attenuation in the backarc region (Contreras et al., 2023a, 2025).
The total (unpartitioned) residuals are computed as the difference between data and model,
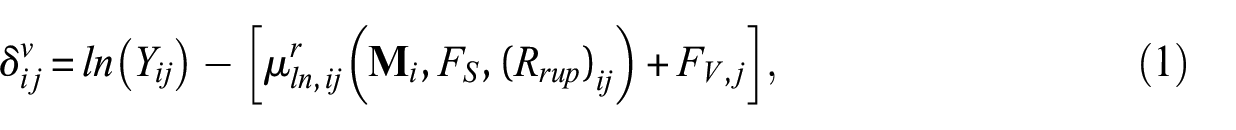
where (

The superscript

The mixed-effects analyses were performed in MATLAB using the fitlme command (documentation available at https://www.mathworks.com/help/stats/linear-mixed-effects-models.html).
For the investigation of site response nonlinearity in the next section, it is useful to consider within-event residuals relative to a reference rock condition,

where
The addition of the ergodic site amplification model in the
Site response nonlinearity
Figure 6 shows example plots of
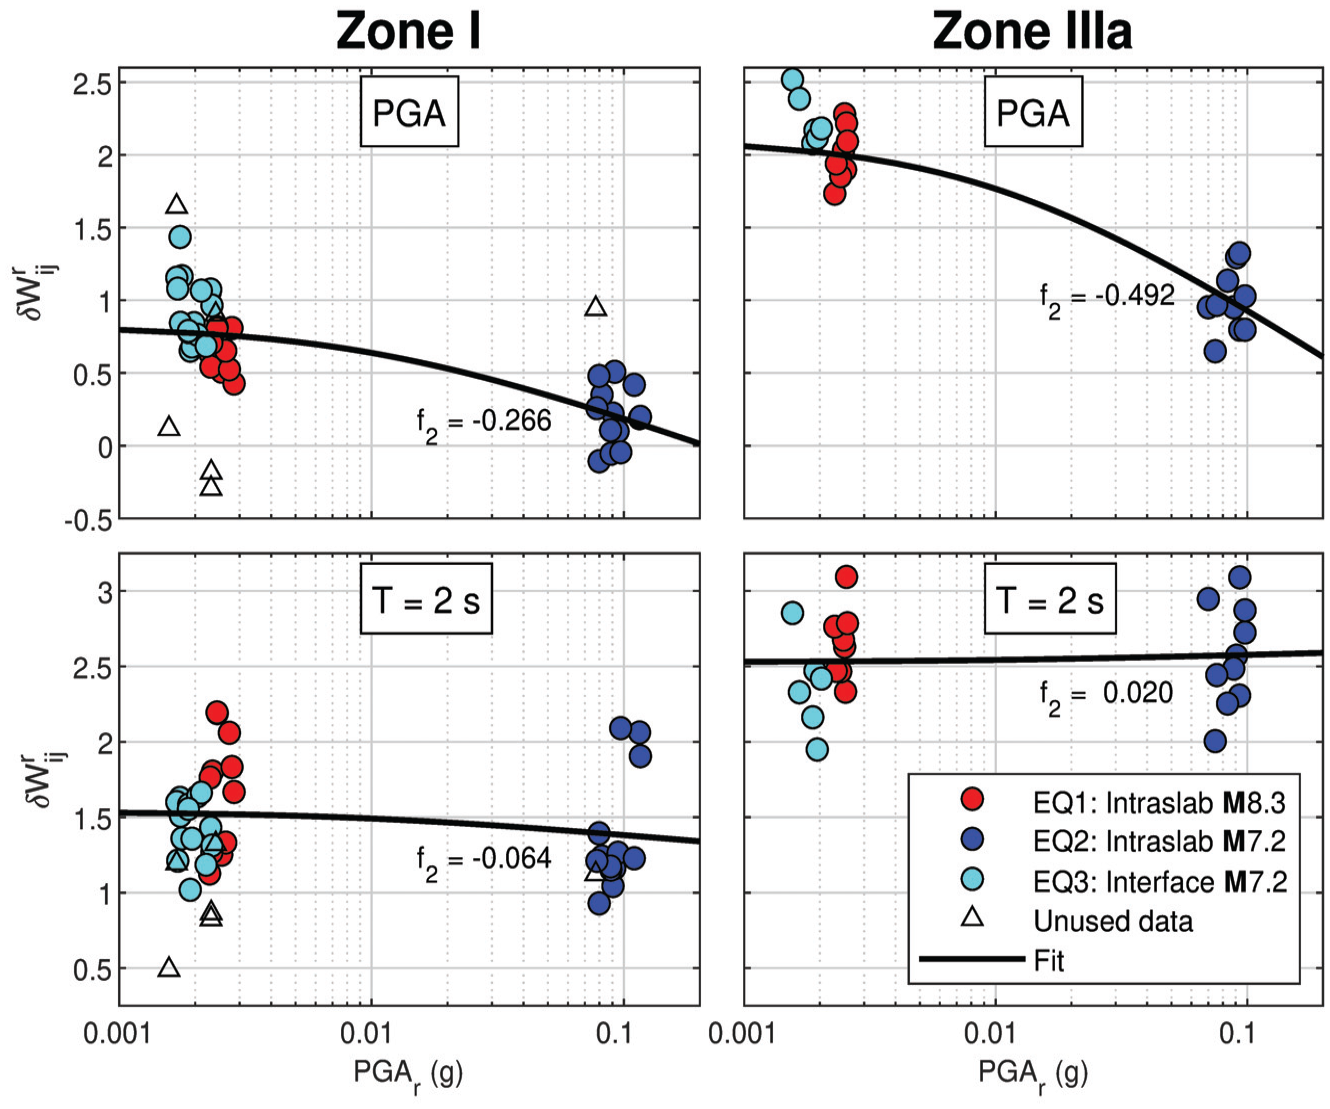
Reference rock within-event residuals for sites in Valley of Mexico Zones I and IIIa for the intensity measures of PGA and PSA (2.0 s).
The evidence for nonlinearity shown in Figure 6 was derived from response spectral ordinates, which have some dependence on spectral shape. As shown by Stafford et al. (2017), spectral shape effects are important for small magnitudes (generally < 4) for which linear site response in Fourier amplitudes can appear to be nonlinear in PSA due to sensitivities of earthquake corner frequencies to magnitude within the frequency range of oscillator response saturation. However, given the
For Zone I (hills), most of the recording stations (15) are located to the southwest of Mexico City (Figures 1 and 2). However, there are five stations in other areas of the city mapped as hills, three of which presented significant differences in site response. One of these stations is located on the slopes of an isolated hill within the lake zone (Cerro del Peñón) and two are located on the slopes of hills located in the north of the city (Cerro Tepeyac and Cerro de Guerrero). Site responses for these three stations are shown in Figure 6 with hollow triangles. The Cerro del Peñón station shows higher within-event residuals than the average for Zone I (possibly influenced by the lakebed), whereas Cerro Tepeyac and Cerro de Guerrero present lower within-event residuals than average for Zone I. Due to this anomalous behavior, the data from these three stations were not used to evaluate the overall nonlinear site response of Zone I.
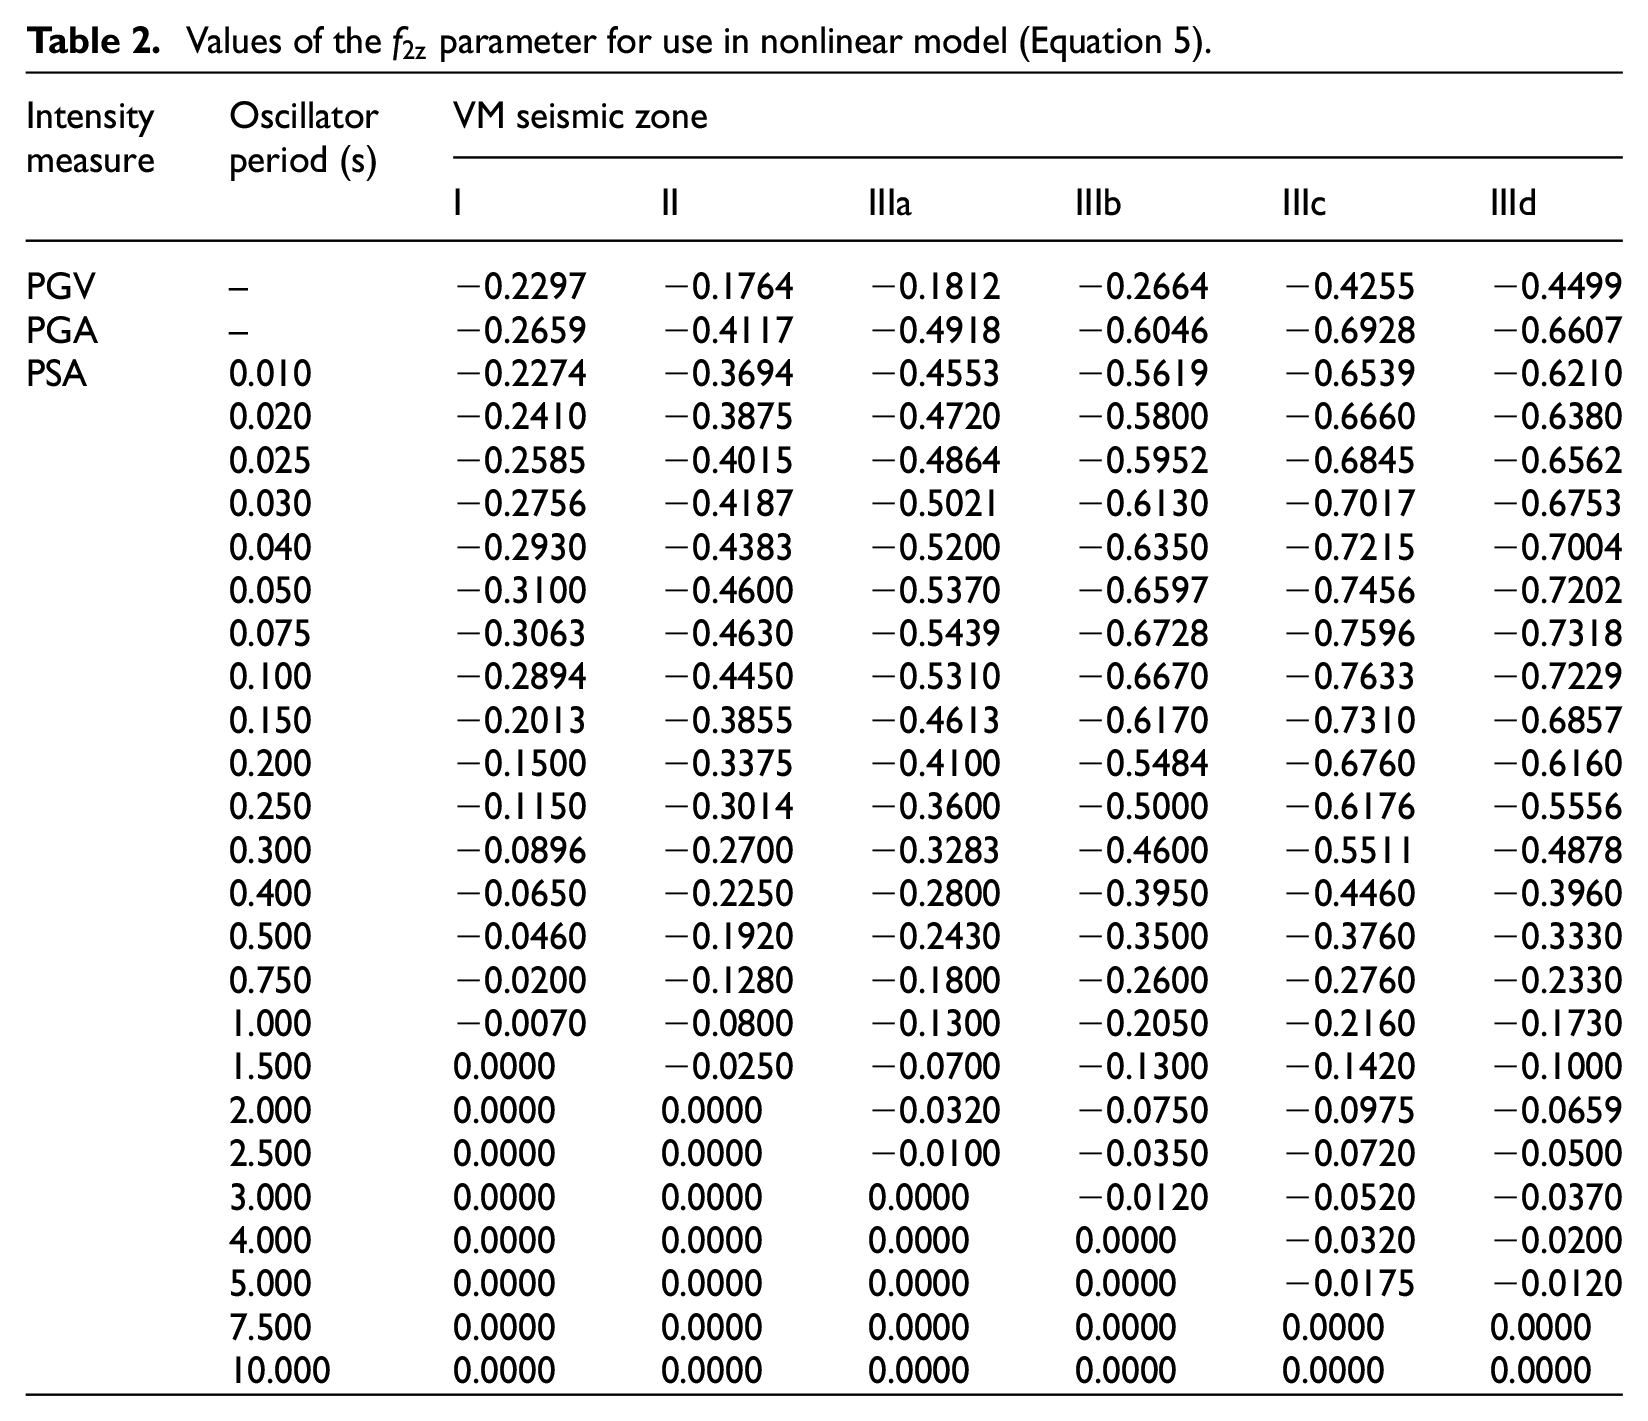
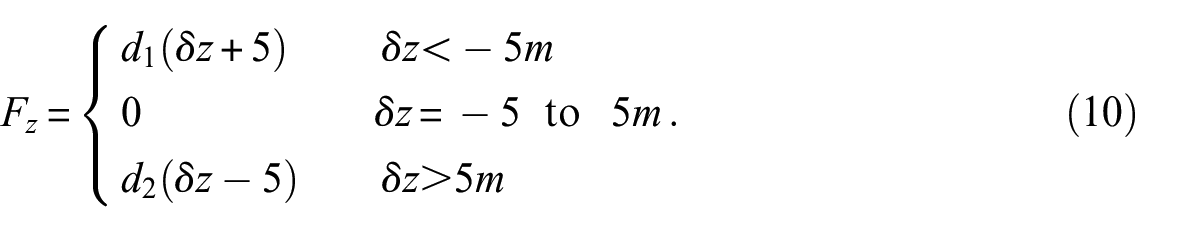
To model the nonlinear components of site response, we fit the data in Figure 6 using Equation 5,
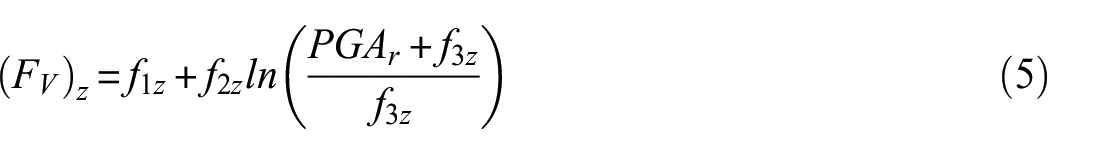
where f1,z to f3,z are coefficients for zone
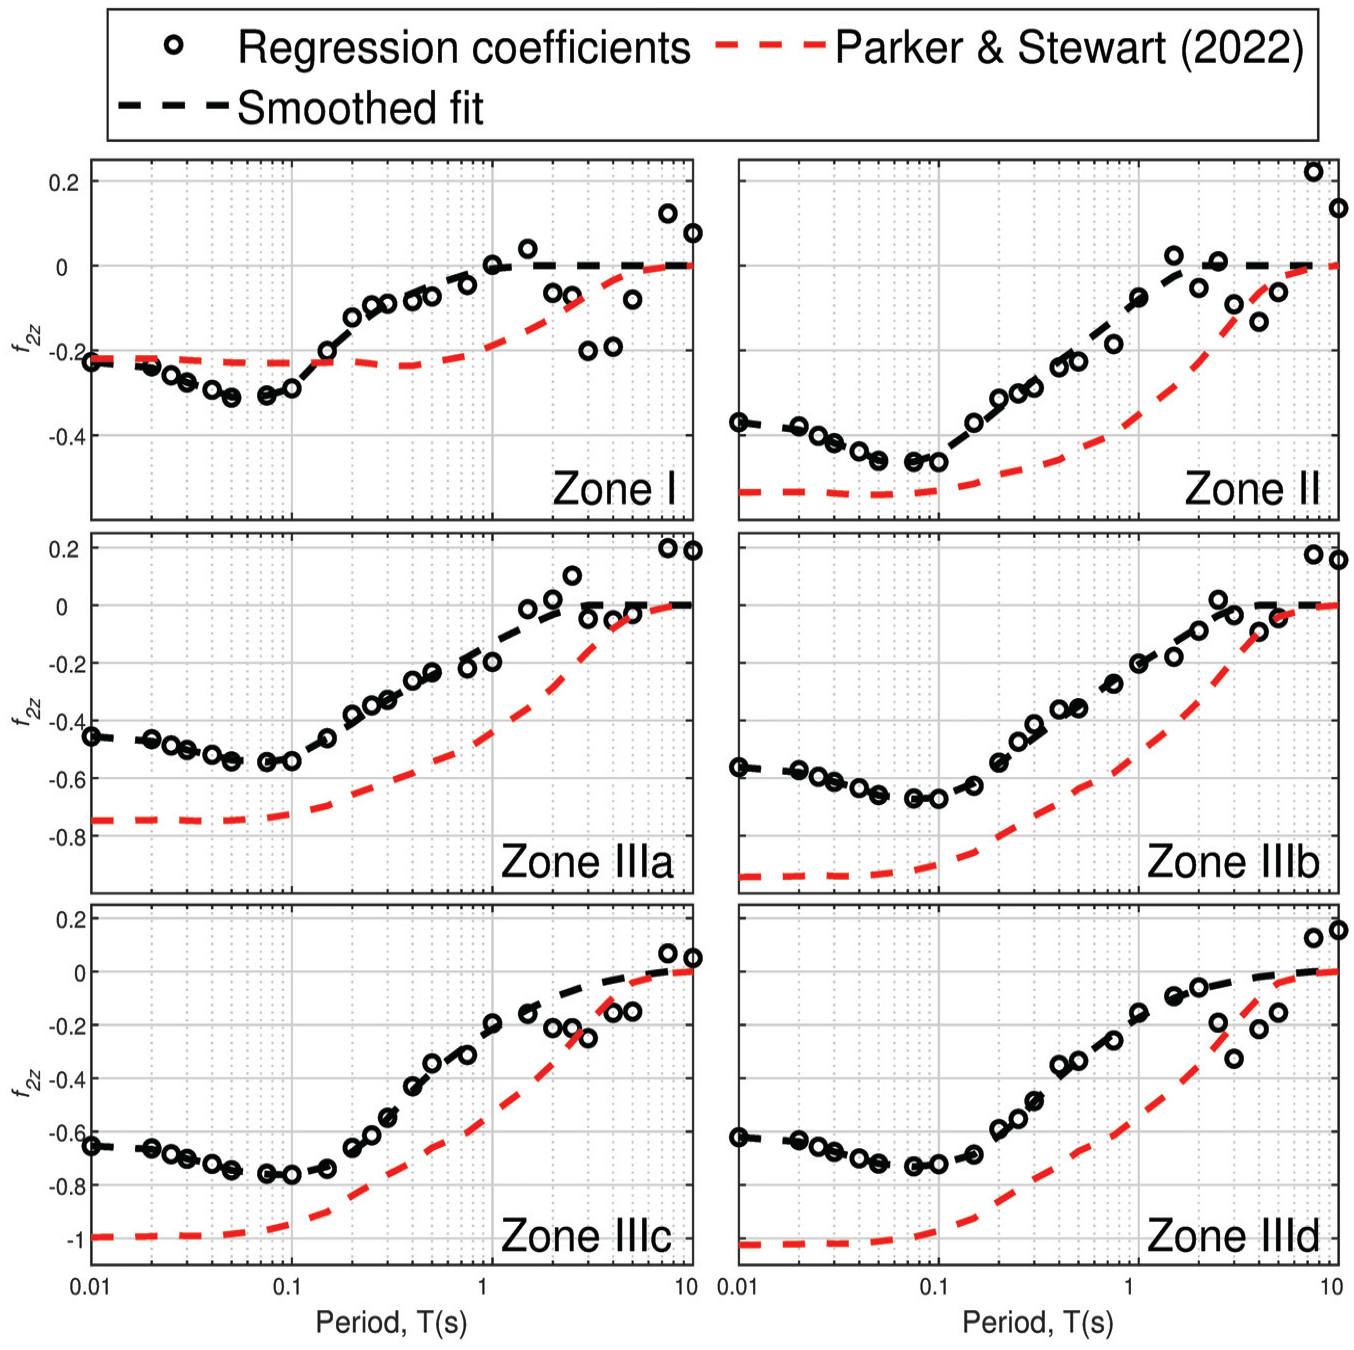
Values of parameter f2 estimated using the Valley of Mexico data for each zone along with a smoothed fit and model predictions from Parker and Stewart (2022) using the median V S 30 for each zone.
The results in Figure 7 show strongly negative values of
Values of the
Linear site responses at recordings sites
To model the linear component of site response, it is necessary to correct within-event residuals for nonlinearity. This adjustment is made using Equation 6,
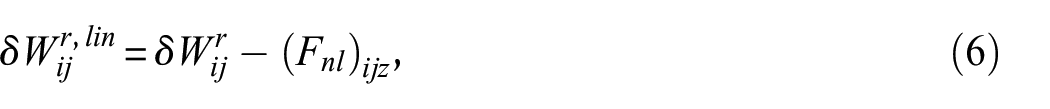
where
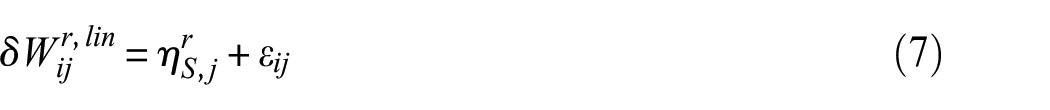
Equation 7 does not include a constant term, which forces all of the site response bias into the
Typical characteristics of Valley of Mexico site responses are illustrated with example results for seven sites from different zones (site locations in Figure 2). The linear site responses for these seven sites are shown in Figure 8. The Zone I site (CUP5; this is the modern station code associated with the traditional CU site) has appreciable amplification, ranging from 0.5 to 1.7 (natural log units), with the maximum amplification being essentially constant for T = 1.5–5s. The Zone II site (AO24) has higher amplification for PGA and PSA, with a peaked response at 0.8 s that is much stronger than for CUP5 (∼2.5), which then decays sharply for T > 1 s. The Zone III sites (IIIa, IB22; IIIb, SCT2; IIIc, XP06; IIId, AE02) also have larger amplification than CUP5 for PGA and PSA. At the longer periods, the site responses are peaked at amplitudes ranging from 3.2 to 3.9 (factors of 25–50 approximately) at periods of 1.5 s for IIIa, 1.5–2 s for IIIb, 2.5 s for IIIc, and 4–5 s for IIId.
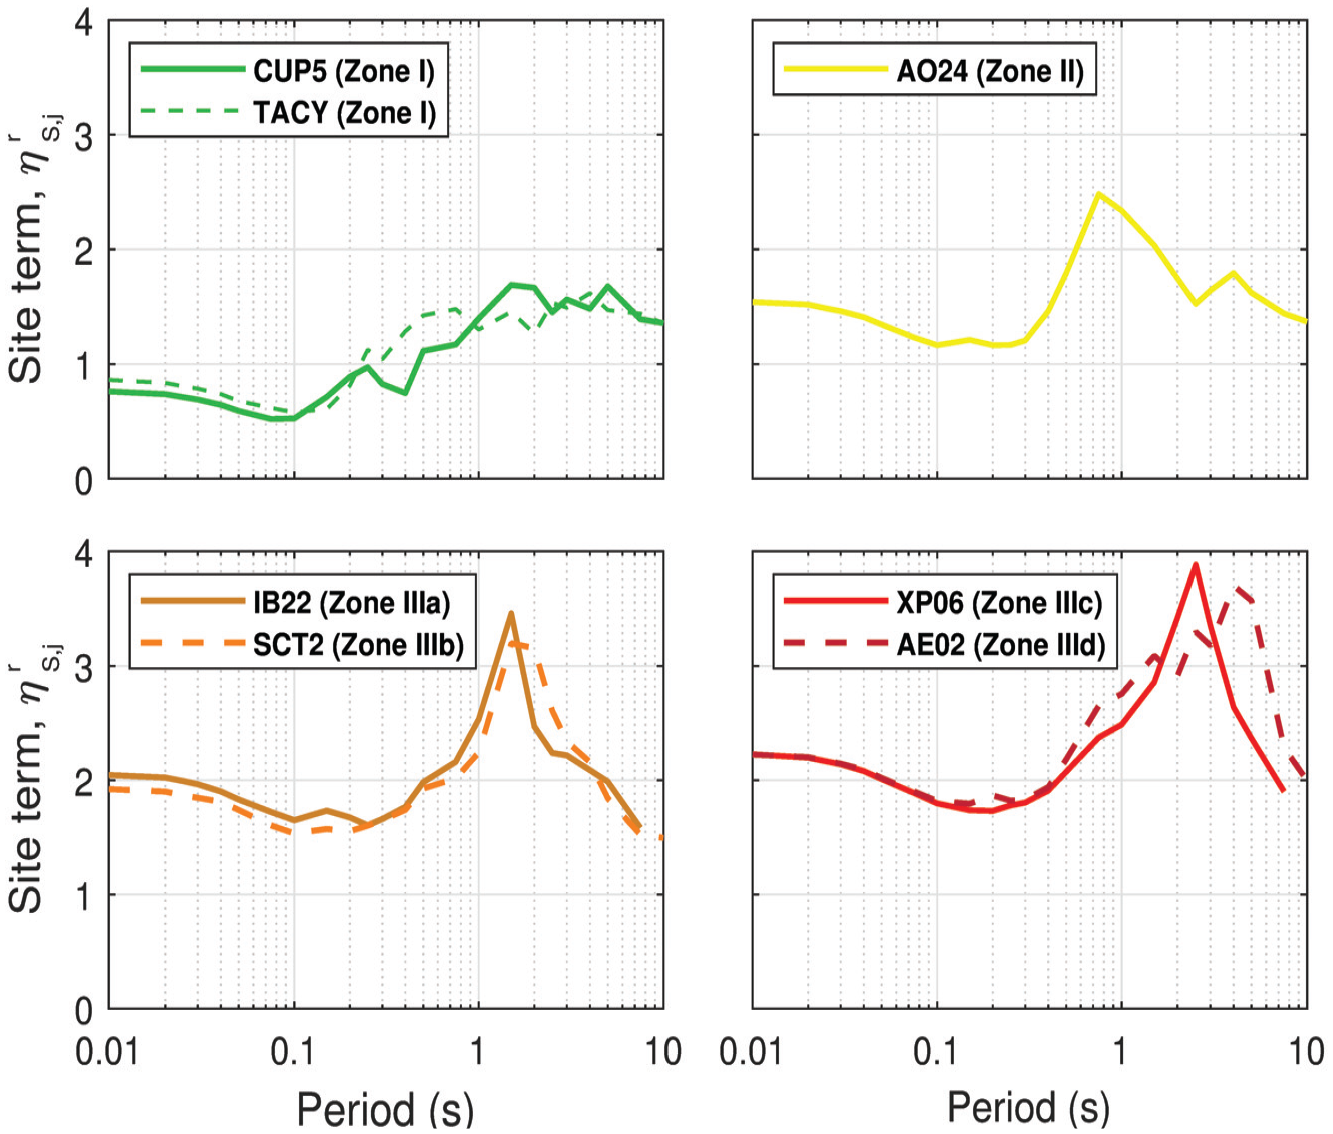
Period-dependent linear site response as derived from non-reference site approach for seven sites in Mexico City (locations in Figure 2).
Results in Figure 8 for the CUP5 site are particularly notable, because that site has been widely used as a reference site in prior studie of Valley of Mexico site response (e.g. Reinoso and Ordaz, 1999). The V S 30 for this site is 295 m/s (Table A1, see ID#7) and its site response is appreciable. Strong site response at the CUP5 site was previously recognized by Singh et al. (1995) and attributed to complex shallow structure. Reference sites used in other regions have generally had much stiffer geologic conditions (e.g. 750–1000 m/s; Borcherdt, 1994, 2002).
Site responses relative to a 760 m/s condition are compared to those derived using SASID in Figure 9. The patterns of site responses between zones and across periods are broadly consistent, although the present site responses are larger by amounts ranging from 0.7 to 1.4 in natural log units (factors of 2.0–4.0) due to the different reference site conditions. These substantial differences are largely a consequence of the significant site response at the CU site. This is illustrated by the “adjusted median” lines in Figure 9, which are computed as the sum of the SASID medians and the CU site response. These adjusted medians approximately convert the SASID site response from the CU reference condition to a 760 m/s reference condition. The results are much closer to the median non-reference site response, but are generally somewhat higher (∼0.1–0.5, or factors of ∼1.1–1.6) for T > 1.0 s and lower for T < 1.0 s.
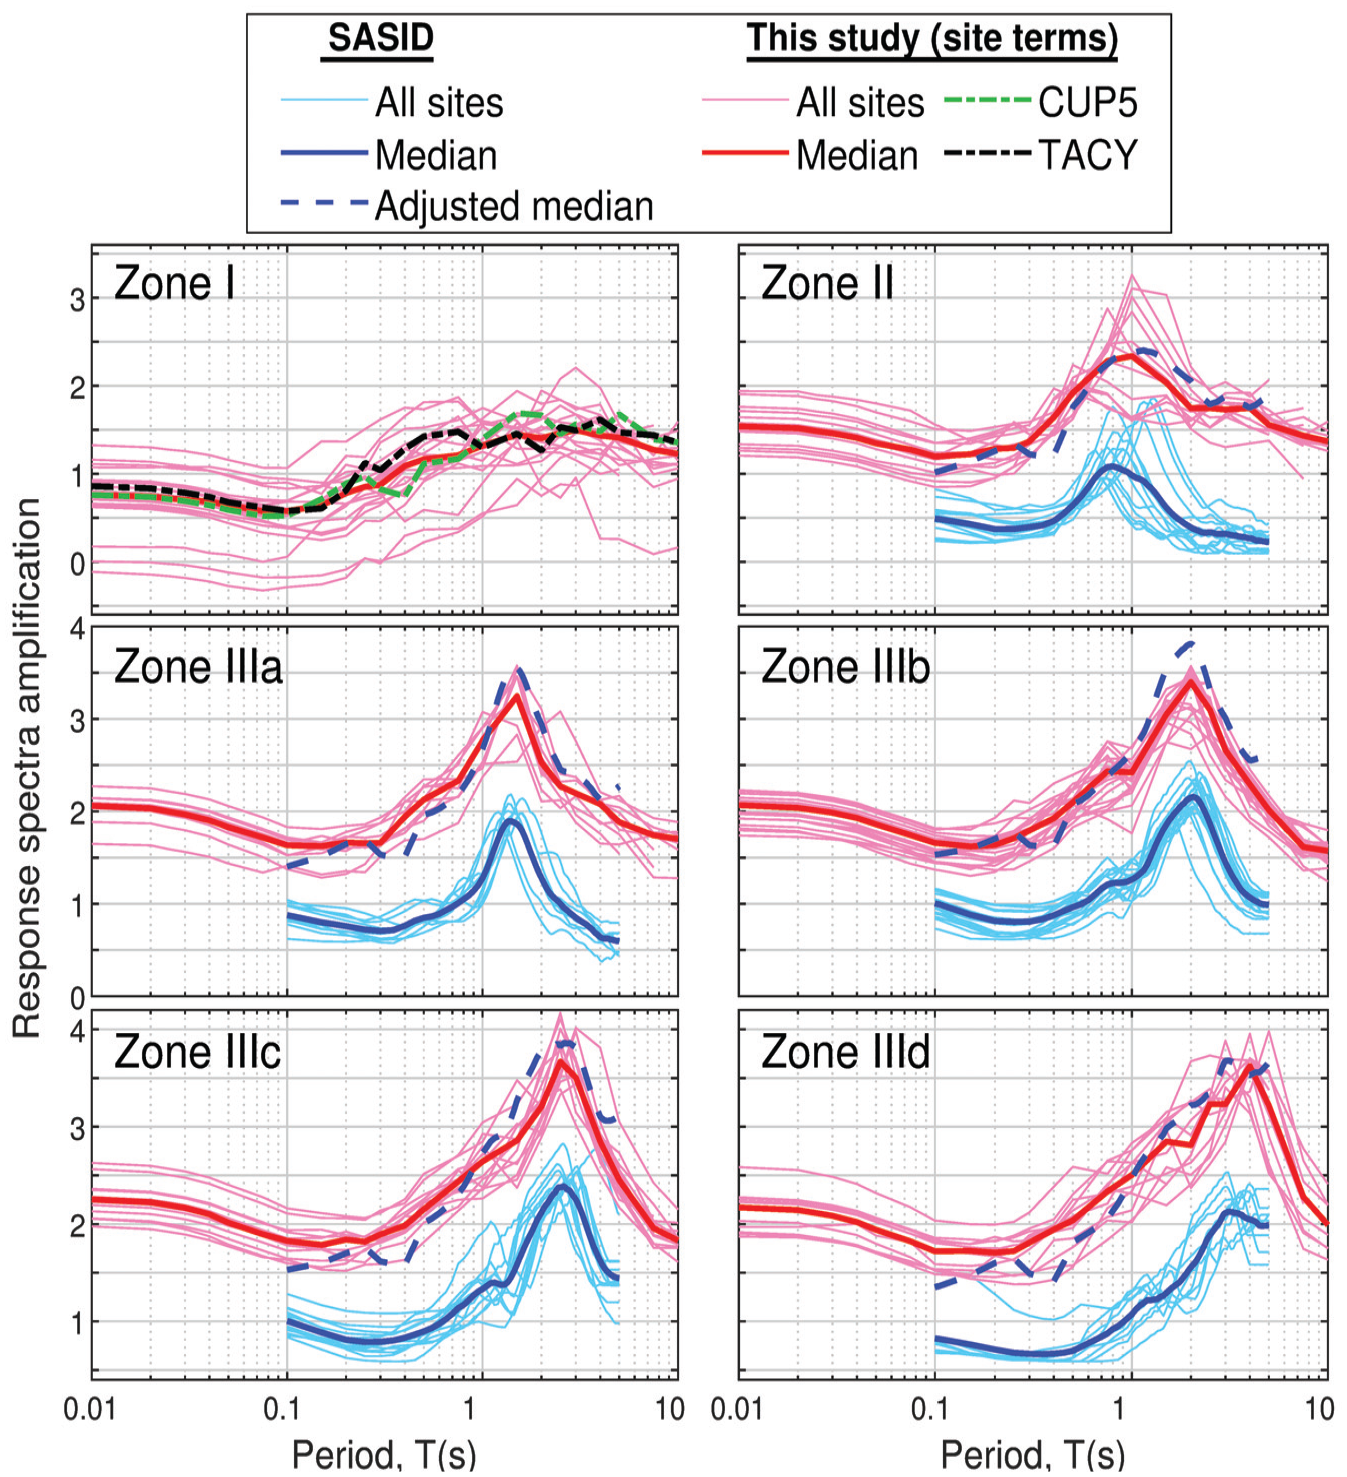
Period-dependent linear site response as derived from reference and non-reference site approaches for six zones in the Valley of Mexico (Figure 2). The different levels of site amplification within a zone are related to different reference conditions.
Linear amplification model
Due to the strong correlation of V
S
30 with depth and site period T
S
(Figure 4), our model development approach begins by modeling amplification trends based solely on V
S
30 and subsequently checking dependencies on
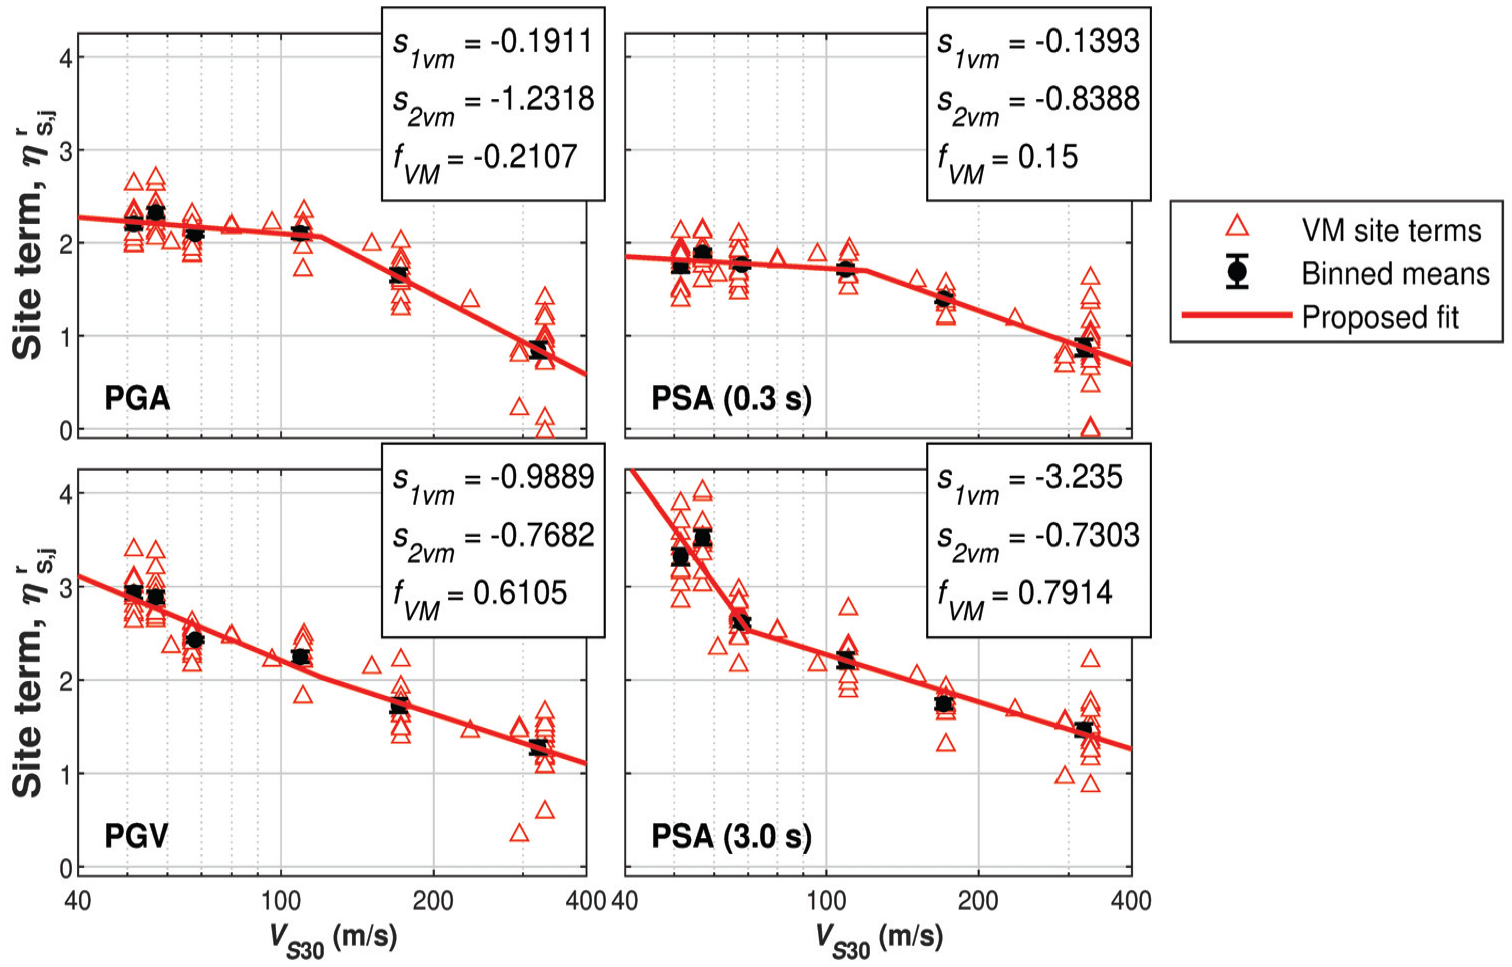
Fit of Valley of Mexico model to site amplification data for peak acceleration, peak velocity, PSA (0.3 s), and PSA (3.0 s). Model coefficients are indicated.
To capture the subregional response, the following model is applied:
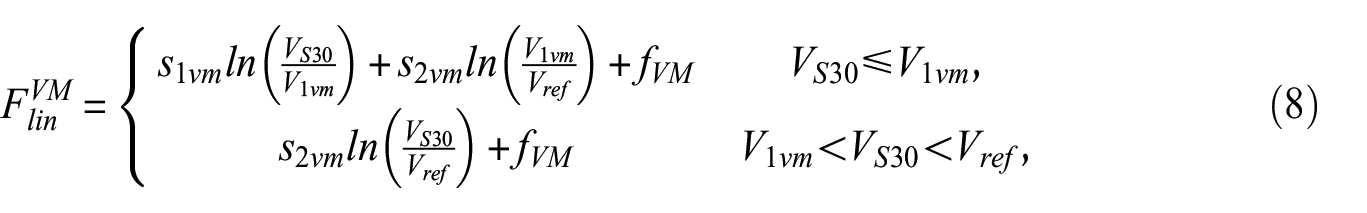
where the VM superscript indicates it is a Valley of Mexico model, the
Figure 11 shows the period-variations of model coefficients. Negative values of slope parameters indicate that amplification increases as V
S
30 decreases. For short periods (0.01–0.2 s), the slope parameters have relatively little change with period, with
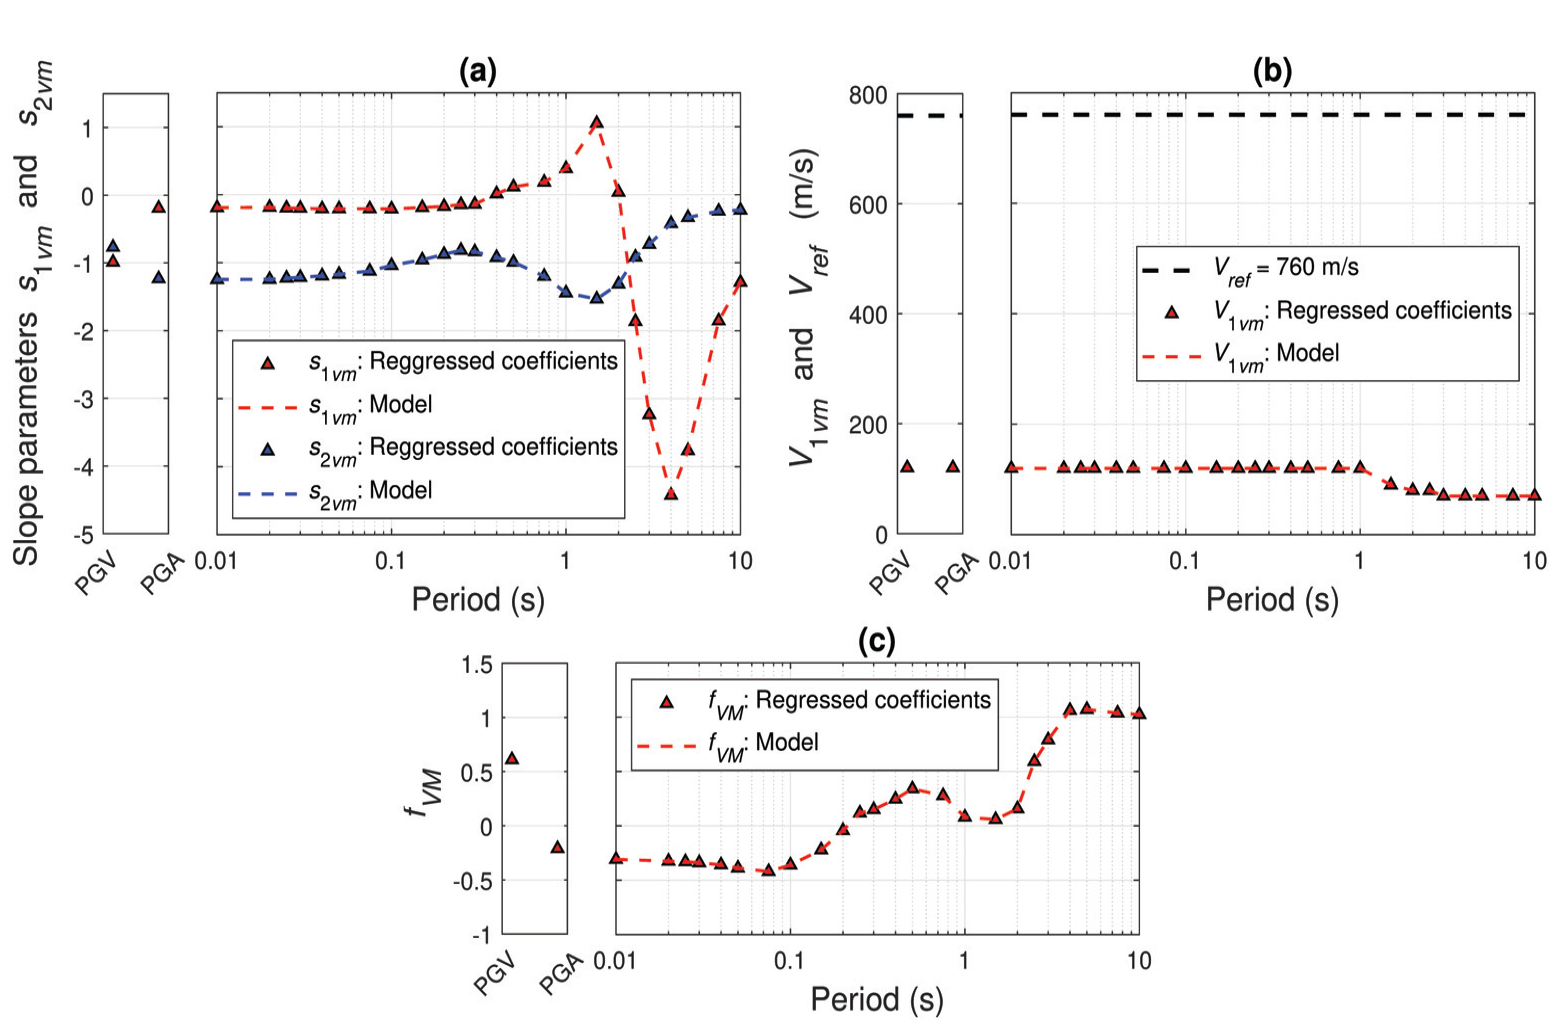
Period dependence of coefficients for Valley of Mexico subregional linear site response model in Equation 8: (a) V S 30-scaling gradients, (b) reference velocity V ref and corner velocity V1vm, and(c) amplification shift parameter f VM .
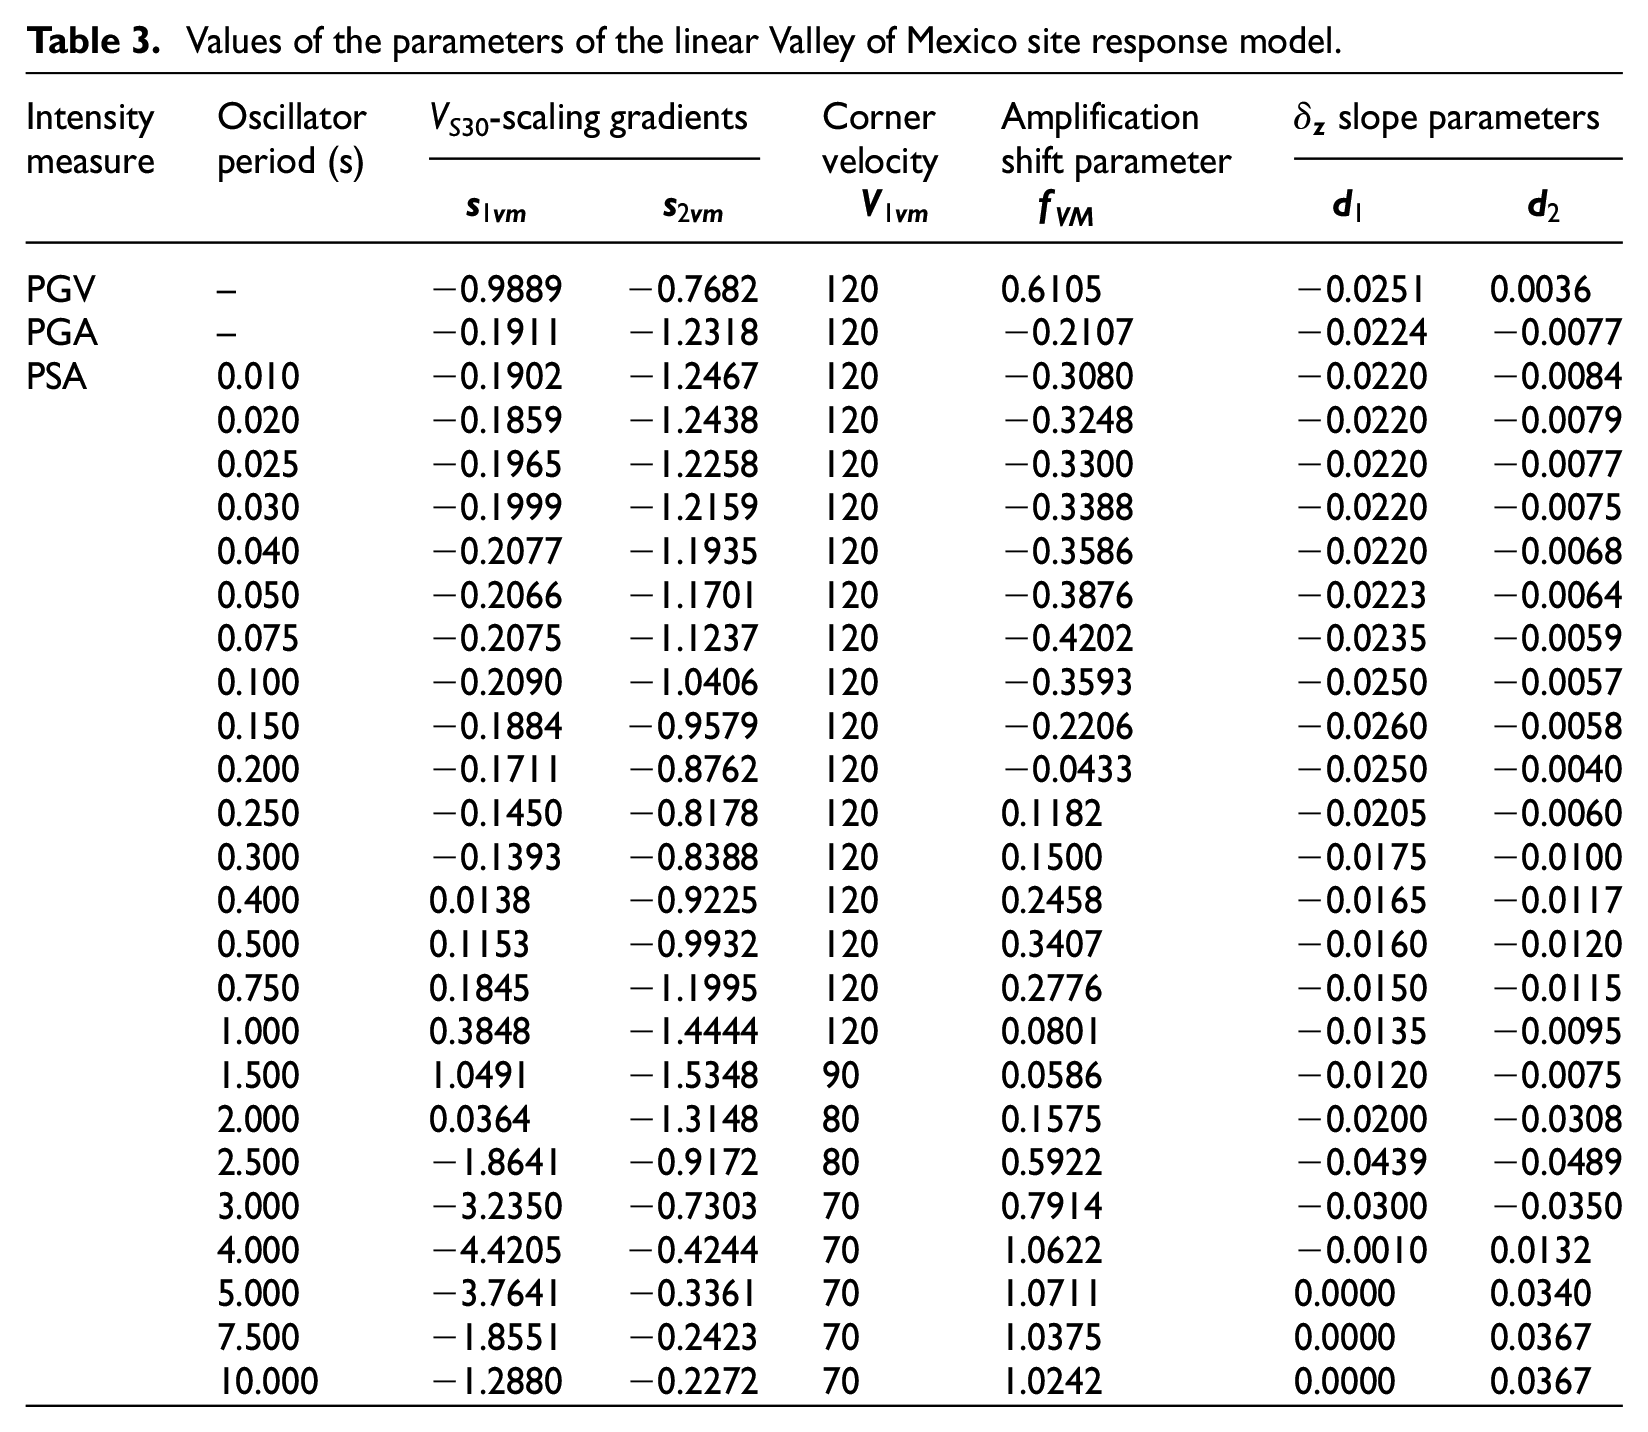
Values of the parameters of the linear Valley of Mexico site response model.
Residuals analyses
In this subsection, we evaluate the performance of the V S 30-scaling model proposed for the linear site response of the Valley of Mexico, extend the model to consider effects of sediment depth based on trends observed in residuals analyses, check the sensitivity of residuals to site period T S , and develop models for within-event components of aleatory variability.
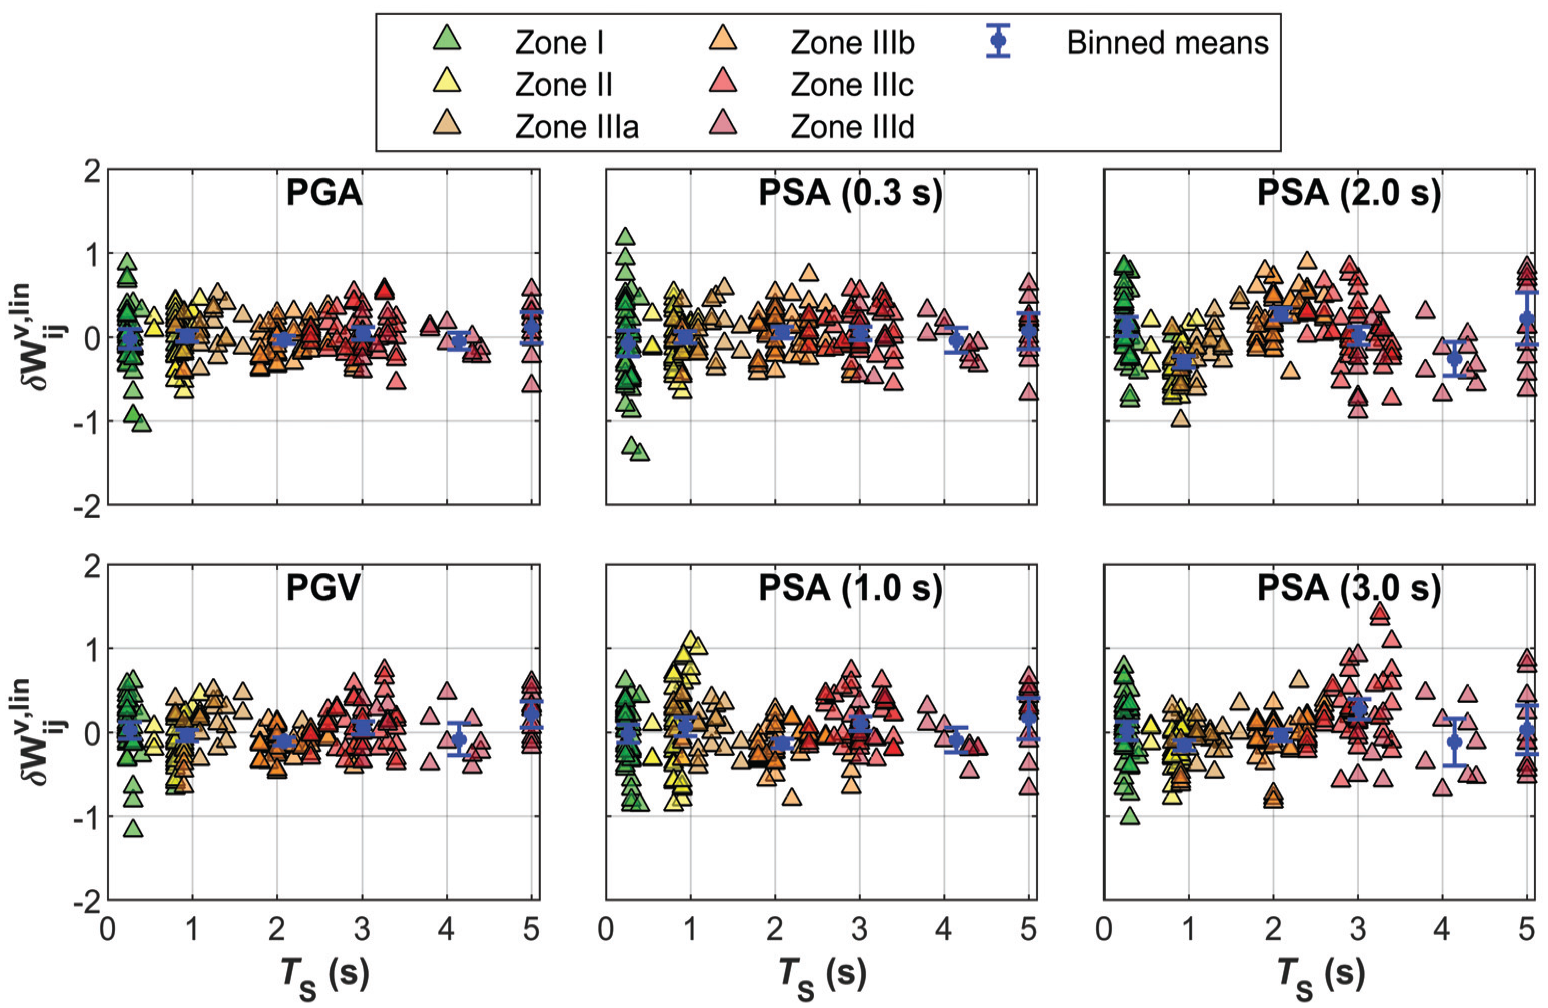
To evaluate model performance, we take the linearized within-event rock residuals from Equation 6 as “data” and subtract the proposed model prediction (Equation 8) to evaluate within-event residual
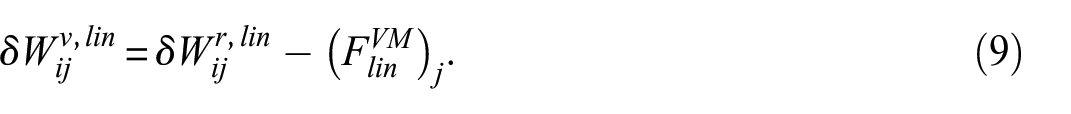
Figure 12 shows that the model removes the principle trends of within-event residuals with V
S
30 for PGA, PGV and PSA at 0.3, 1.0, 2.0, and 3.0 s. This is evident from the binned means of these residuals generally being nearly zero and not exhibiting a trend with V
S
30. Some non-zero binned means (
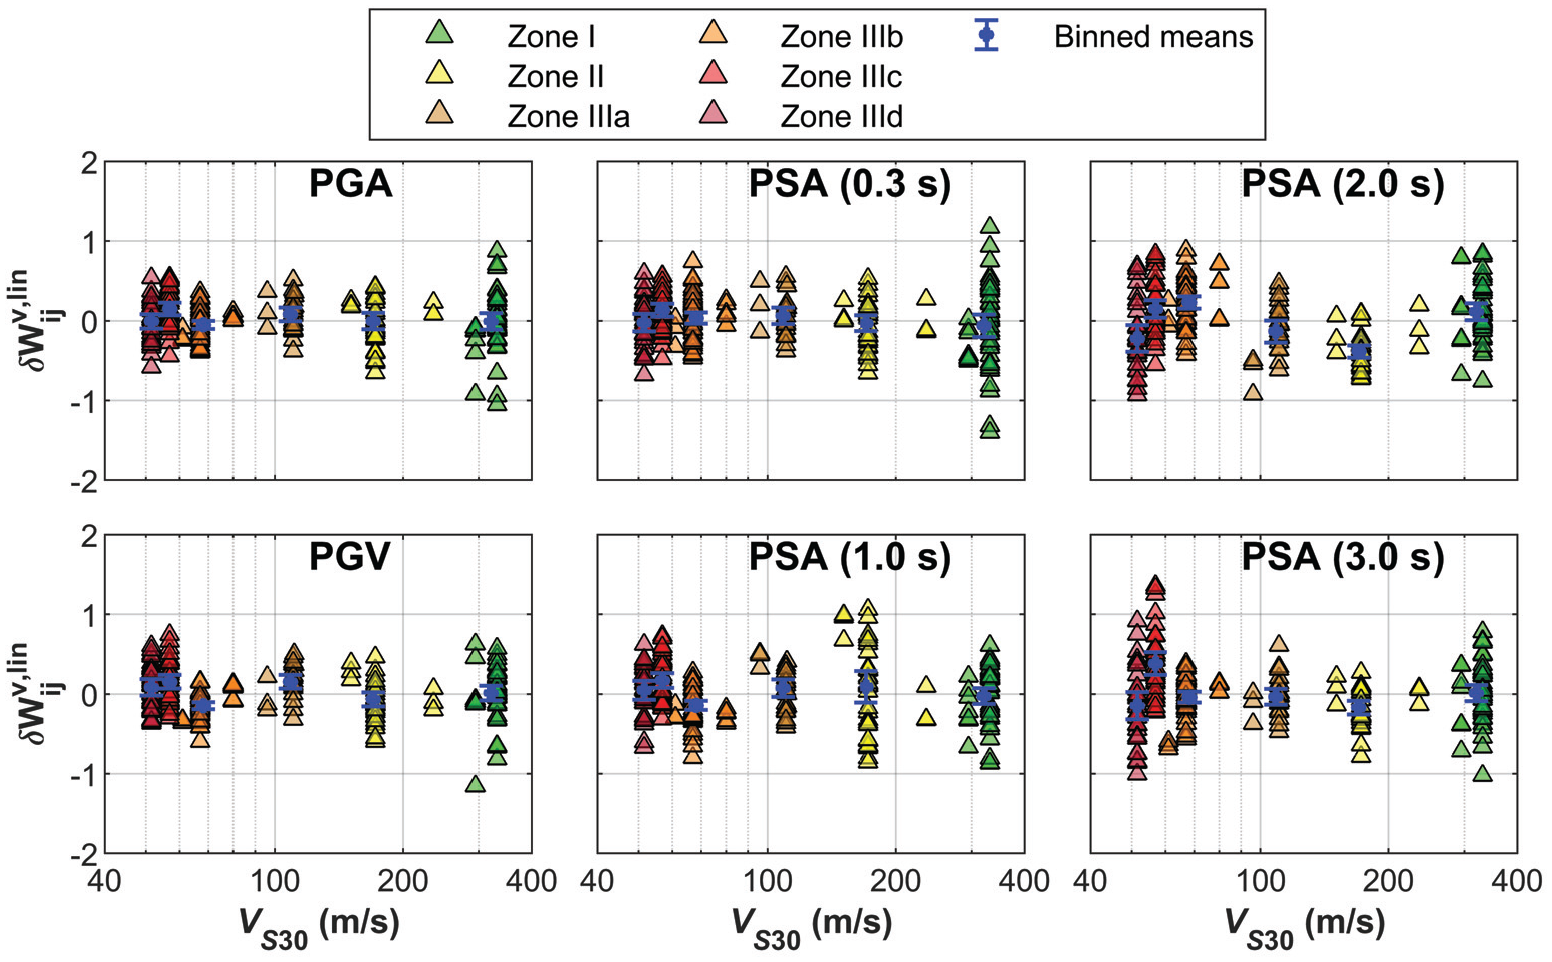
Trend of linearized within-event residuals with V S 30 for sites in the Valley of Mexico for PGA, PGV, and PSA at T = 0.3, 1.0, 2.0, and 3.0 s. Error bars are 95% confidence intervals.
Sediment depth has been found for multiple regions to have predictive capacity for site response beyond that provided by V
S
30 (e.g. Day et al., 2008; Nweke et al., 2022). Figure 4b shows that depth to the Lower Coarse Grain layer is negatively correlated with V
S
30, which makes it poorly suited as an additional predictive parameter. To avoid this problem, we define a model for mean depth conditioned on V
S
30 (
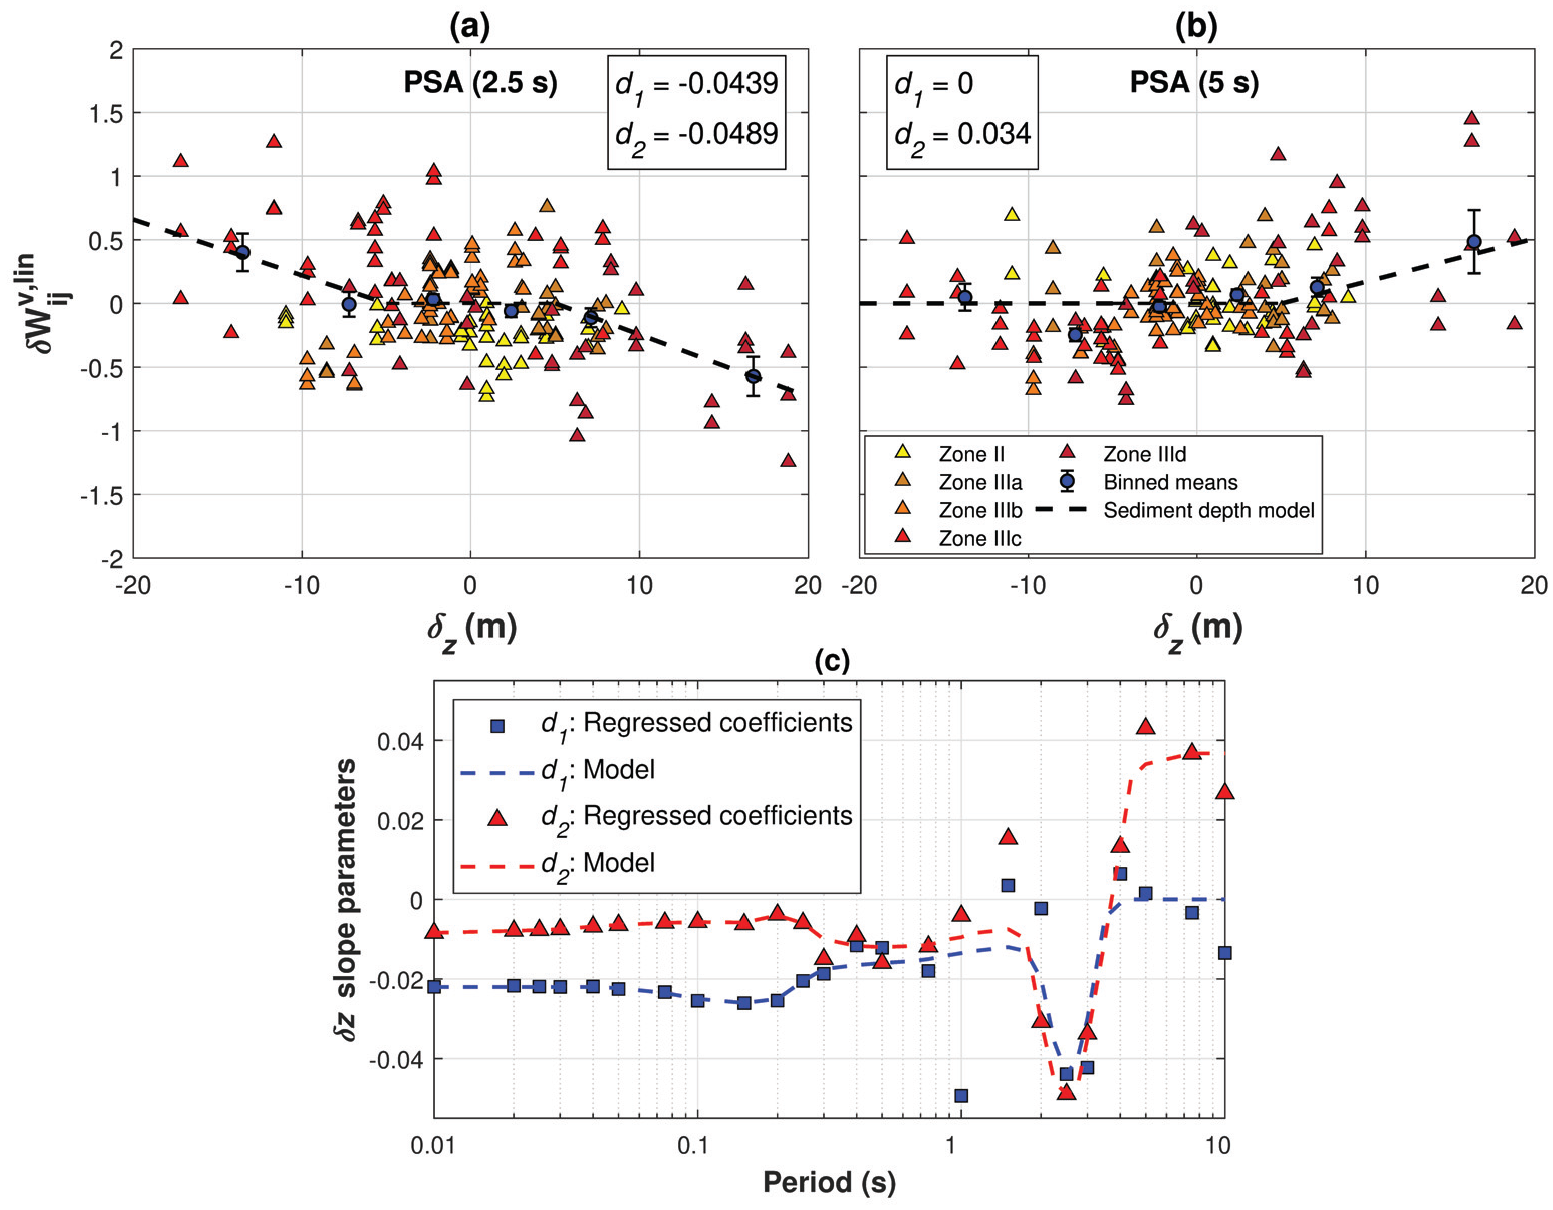
Trend of linearized within-event residuals with differential depth
Figure 13c shows the trends with period of
Although V
S
30 is used as the primary site parameter in the proposed model (equation 8), the site parameter traditionally associated with the different Valley of Mexico zones is site period,
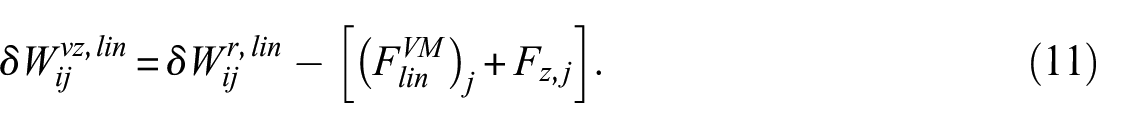
Residuals from Equation 11 are plotted against
Trend of linearized within-event residuals with T S for sites in the Valley of Mexico for PGA, PGV, and PSA at T = 0.3, 1.0, 2.0, and 3.0 s. Error bars are 95% confidence intervals.
At longer periods, the residuals patterns in Figure 14 illustrate site resonance effects that are not captured by the V
S
30-scaling model. Before discussing the results, it is useful to recall the median values of site period in the different zones (e.g. ∼1 s for Zone II and IIIa, ∼2 s for IIIb, and ∼3 s for IIIc). Residuals plots for a given oscillator period often have peaks when that period aligns with the zone median site period; for example, a peak occurs at
Residuals analyses using the Valley of Mexico data along with the recommended model (i.e. reference site regional GMM from Contreras et al. (2025), which is modified from Parker et al. (2022); linear site response from Equation 8; nonlinear site response from Equation 5) provides within-event residuals that can be partitioned using mixed-effects analysis into site terms (
Figure 15 shows subregional
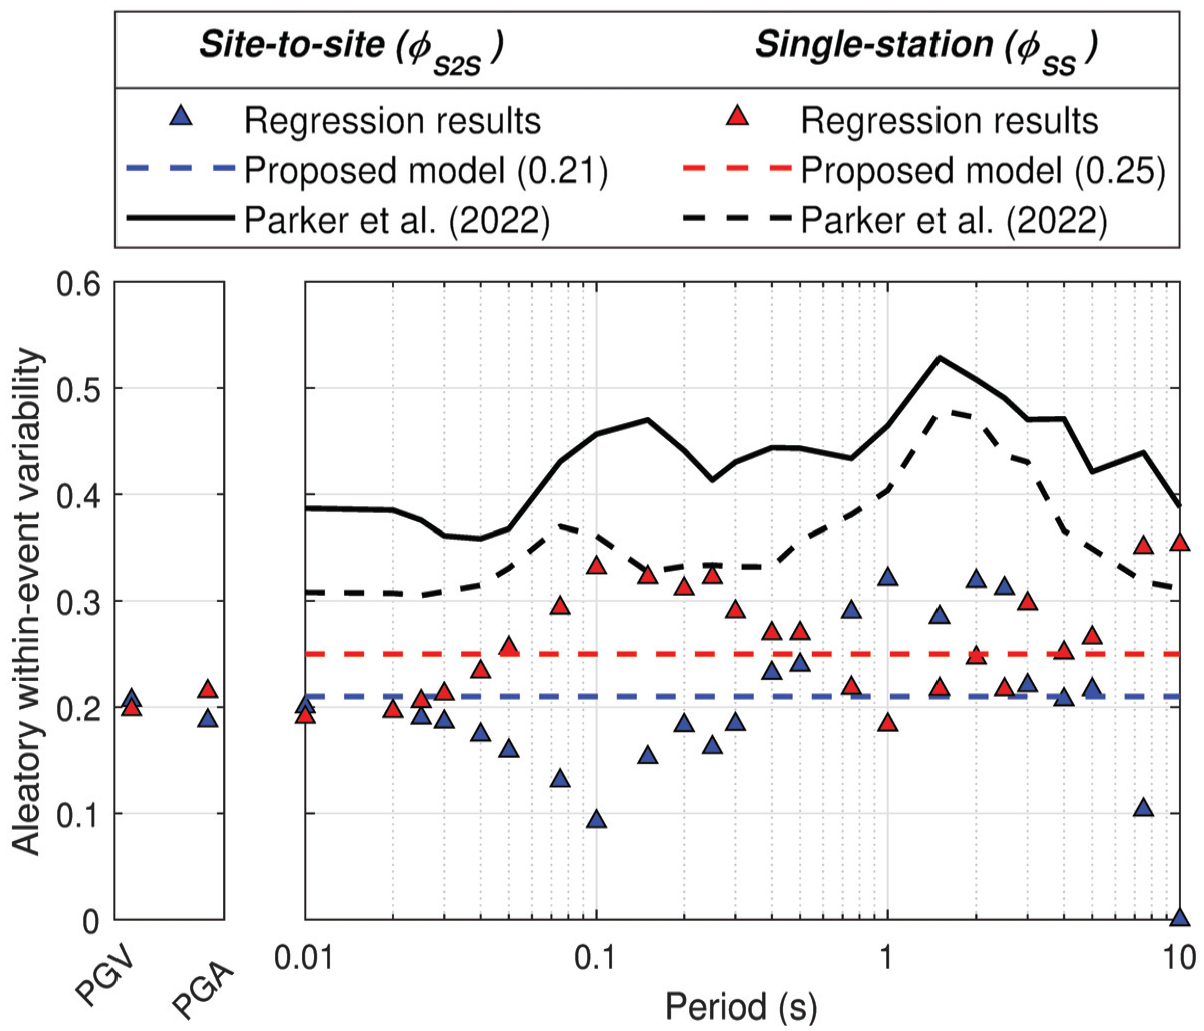
Site-to-site and single-station dispersion terms derived for Valley of Mexico sites. Larger values from global model of Parker et al. (2022) shown for comparison.
Validation of the site response model
In this subsection, we validate the site response model for the Valley of Mexico presented in the previous section. The validation uses a data set from the 1985
While the elimination of the Mexico City data was necessary in order to maintain consistent data selection criteria, the strong subregional site response likely causes the amplitudes to exceed noise levels to a sufficient degree that the recordings are representative of the ground shaking that was experienced. Instead of making a “one-time” exception to the screening criteria, we chose to use the data as an independent testing data set for model validation. Because data from the Michoacán event at closer distances (not in the Valley of Mexico) were used by Contreras et al. (2023a, 2025) in the development of the Parker et al. (2022) GMM adjustments, event terms (
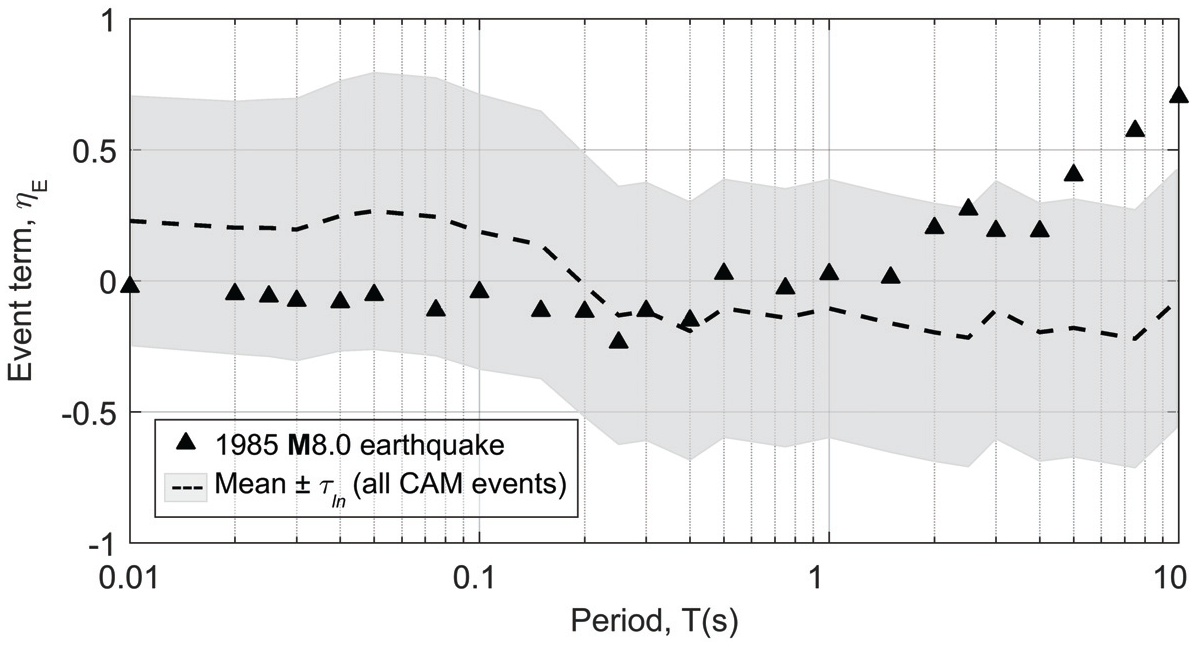
Period dependence of event terms for the 1985
The validation is performed by summing (in natural log units) the adjusted reference rock GMM, the event terms from Figure 16, and the site amplification models (V
S
30-scaling only and combined model that includes differential depth effects).
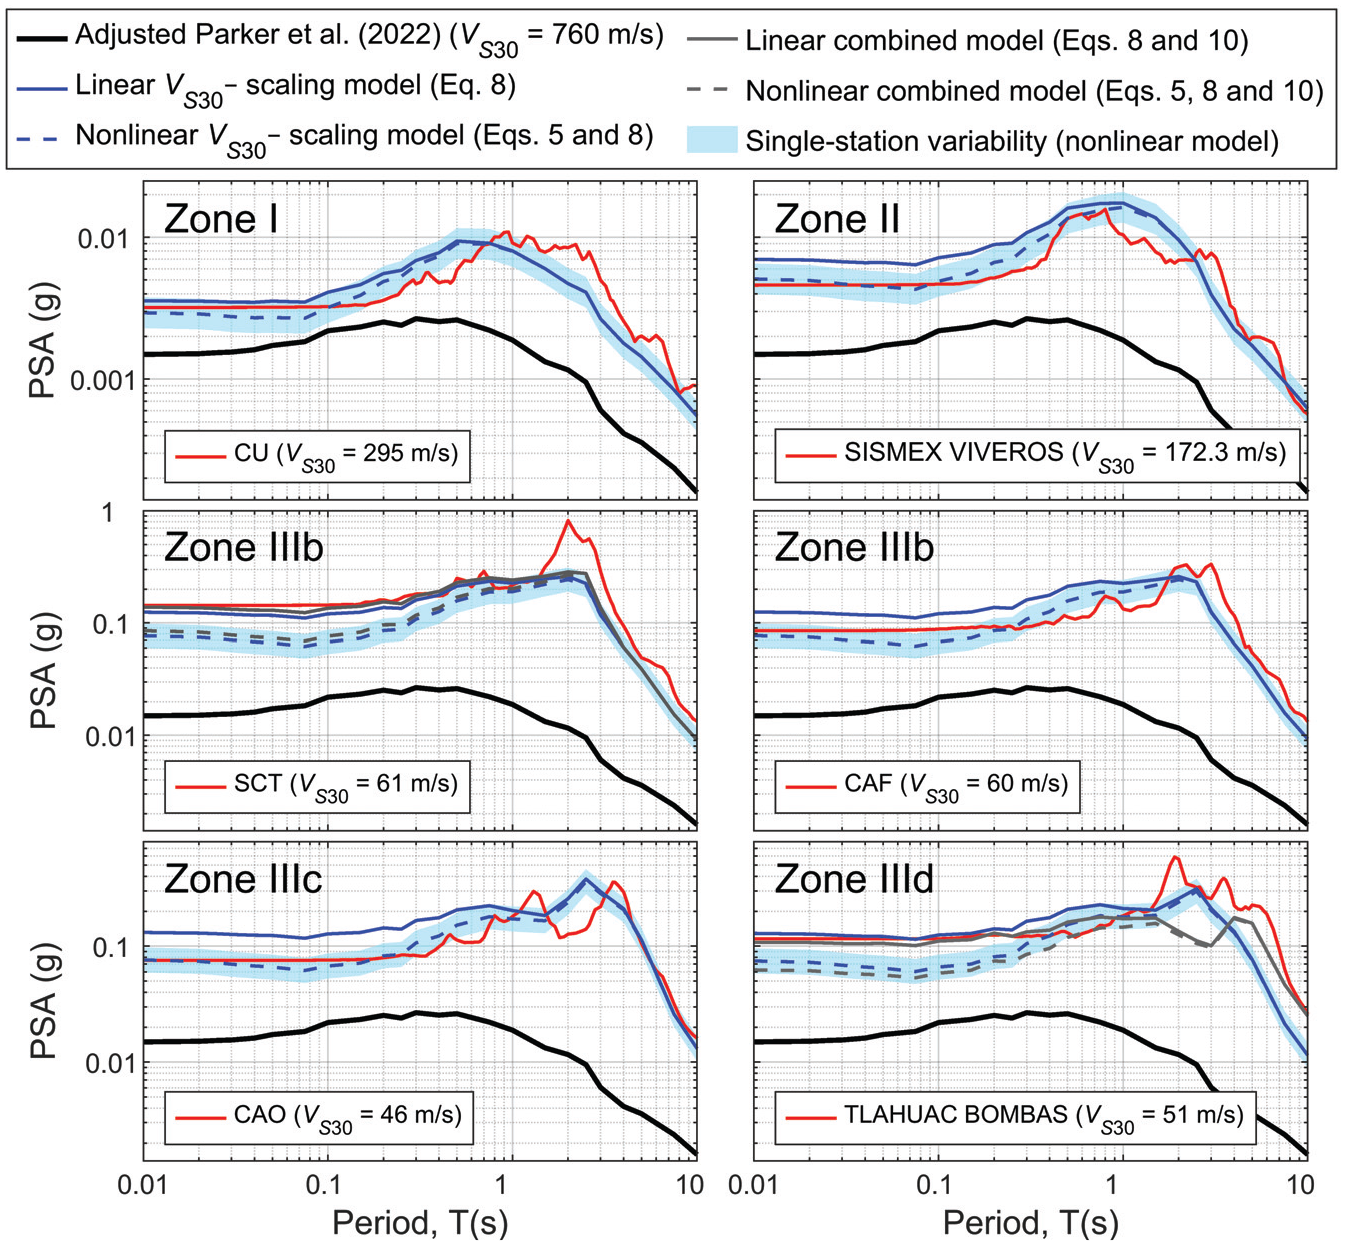
Comparison of observed PSA at six stations that recorded the 1985 event (red lines) with predicted PSA for engineering-rock conditions, and after applying the Valley of Mexico site response model (full and linear-only).
Summary and discussion
This research examined site response within the Valley of Mexico, which contains Mexico City, using a non-reference site approach. The work presented here on site response is part of a broader study of ground motions from subduction earthquakes in CAM. The extension of the NGA-Sub project database (Mazzoni et al., 2022) to include additional events and stations in Mexico is presented in a companion paper (Contreras et al., 2025). The supplemented database provides multiple ground motion recordings at sites across the Valley of Mexico that enabled the present application of non-reference site analyses to measure site response and its uncertainty.
We have summarized the unique geotechnical conditions in the Valley of Mexico and compiled available site parameters (V
S
30, T
S
,
We have shown that the CU site, commonly used as a reference, has an appreciable level of site response across a broad period range (based on data from the CUP5 station). The site response results presented in this article are broadly similar to previous findings with regard to relative amplification levels between lakebed zones and the period ranges where these amplifications are maximized. However, there are two notable aspects of our findings: (1) amplification levels are higher due to the referencing of amplification to V ref = 760 m/s in this work, and (2) by examining data from multiple events, we find short period site amplifications exhibit nonlinearity. The use of the non-reference site approach for the derivation of amplifications is particularly significant from a ground motion modeling perspective, because it removes the need to derive single-station reference GMMs for the CU site as has been done in prior work (Arroyo et al., 2024; Jaimes et al., 2015; Jaimes et al., 2006; Ordaz et al., 1994). Doing so substantially increases the level of rigor with which the reference site GMM can be defined.
A nonlinear model conditioned on V
S
30 is presented for site response in the Valley of Mexico. The linear portion of the model is able to capture the main trends of site response variations across the lakebed. The linear model includes the option of applying a differential depth parameter derived from
The proposed modeling approach for sites in the Valley of Mexico involves the use of a regionally customized GMM and a subregional site amplification model. The GMM is an adaptation of the Parker et al. (2022) model for CAM, with the modifications being solely related to backarc attenuation effects. The site amplification model has linear and nonlinear components (Equation 2). The V
S
30 portion of the linear component is given by Equation 8 with the coefficients in Table 3. The optional modification based on δz is given by Equation 10 with coefficients in Table 3. The nonlinear component is given by Equation 5 with the coefficients in Table 2. Corresponding values for the two components of within-event variability (
The findings and recommendations presented here provide an opportunity to improve ground motion hazard analyses in Mexico due to the following factors:
Ground motion estimation in the Valley of Mexico (Mexico City) and elsewhere in Mexico is developed using consistent approaches.
The models are transparent, thus allowing for future research where individual components can more readily be interrogated and improved.
Site response is conditioned upon the site-specific V S 30 parameter—this encourages site characterization and avoids ambiguities that can arise for sites near zone boundaries.
Nonlinearity in site response is considered.
The next steps are to evaluate the impact of these models on seismic hazards across Mexico and see whether consensus can be developed regarding their introduction into national and regional seismic design standards. Such analyses have not been undertaken in the present work.
Supplemental Material
sj-docx-1-eqs-10.1177_87552930251316816 – Supplemental material for Valley of Mexico site response from non-reference site approach
Supplemental material, sj-docx-1-eqs-10.1177_87552930251316816 for Valley of Mexico site response from non-reference site approach by Victor Contreras, Jonathan P Stewart, Juan M Mayoral and Xyoli Pérez-Campos in Earthquake Spectra
Supplemental Material
sj-docx-2-eqs-10.1177_87552930251316816 – Supplemental material for Valley of Mexico site response from non-reference site approach
Supplemental material, sj-docx-2-eqs-10.1177_87552930251316816 for Valley of Mexico site response from non-reference site approach by Victor Contreras, Jonathan P Stewart, Juan M Mayoral and Xyoli Pérez-Campos in Earthquake Spectra
Footnotes
Acknowledgements
The authors are grateful to the NGA-Sub project for providing the database and models from which this project was developed. SSN data was obtained by the Servicio Sismológico Nacional (México); station maintenance, data acquisition, and distribution are possible thanks to its personnel. The views expressed herein are those of the authors and do not necessarily reflect the views of the CTBTO Preparatory Commission. Daniel De La Rosa assisted with data collection for sites in Mexico, particularly geologic maps. We appreciate the helpful feedback from the Associate Editor and two anonymous reviewers, which improved the paper.
Declaration of conflicting interests
The author(s) declared no potential conflicts of interest with respect to the research, authorship, and/or publication of this article.
Funding
The author(s) disclosed receipt of the following financial support for the research, authorship, and/or publication of this article: Financial support for the first author was provided by the Chilean National Agency for Research and Development (ANID) through the grant ANID BECAS CHILE-DOCTORADO EN EL EXTRANJERO 72180625 and the Civil and Environmental Engineering Department at UCLA.
Data resources
Raw ground-motion recordings from the RAII-UNAM network, managed by the Institute of Engineering at UNAM, was accessed through the RAII-UNAM network website: http://aplicaciones.iingen.unam.mx/AcelerogramasRSM/Inicio.aspx (last accessed April 2022). Raw ground motions from the RACM network, managed by CIRES (Instrumentation and Seismic Recording Center), were requested from the CIRES website: http://www.cires.org.mx/racm_historico_es.php (last accessed April 2022). Our requests made in September 2017 and April 2020 were granted. Raw data from the IG (Pérez-Campos et al., 2018; SSN, 2020), VM (Quintanar et al., 2018), and UV (Córdoba-Montiel et al., 2018) networks, which are distributed by the National Seismological Service of Mexico (SSN), are accessible through a client called SSNstp upon request (![]() ). Our request made on 7 June 2020 was granted.
). Our request made on 7 June 2020 was granted.
Supplemental material
Supplemental material for this article is available online.
References
Supplementary Material
Please find the following supplemental material available below.
For Open Access articles published under a Creative Commons License, all supplemental material carries the same license as the article it is associated with.
For non-Open Access articles published, all supplemental material carries a non-exclusive license, and permission requests for re-use of supplemental material or any part of supplemental material shall be sent directly to the copyright owner as specified in the copyright notice associated with the article.