
Abstract
This study develops a method for estimating site amplification that combines instrumentally observed site-specific amplification factors with adjustment factors from nonlinear site-response analyses. This approach provides estimates of site response for large-strain motions based on observations and sophisticated nonlinear modeling. A database of weak-to-moderate intensity ground motions recorded in three basins of Wellington, New Zealand is used to study the observed site amplification. A subset of nine strong-motion stations was selected to perform nonlinear site-response analyses with scaled strong ground motions to assess the influence of nonlinearity on site amplification factors and demonstrate the approach. Different shear-wave velocity (VS) profiles, constitutive models, and modeling approaches (e.g. one-dimensional (1D) site-response analyses vs empirical
Keywords
Introduction
Observations from past earthquakes have shown that sedimentary basins and soft surficial soils can cause large amplification of seismic waves (e.g. Bradley et al., 2018; Frankel et al., 2002), producing strong shaking at the ground surface. With increasing density of seismic instrumentation, it is becoming possible to use region- or site-specific estimates of site response based on observations to develop, or critique, ground-motion and site-response modeling procedures (e.g. de la Torre et al., 2020; Lee et al., 2020; Nweke et al., 2022a; Parker and Baltay, 2022; Zhu et al., 2020). Some of these modeling techniques, such as empirically derived ground-motion models (GMMs), three-dimensional (3D) ground-motion simulations, and corrected horizontal-to-vertical spectral ratio (HVSR) techniques have been found to predict site and basin response with reasonable accuracy (e.g. Bradley et al., 2017; Day et al., 2019; Graves and Pitarka, 2015; Nweke et al., 2022b; Zhu et al., 2022). One of the challenges of these procedures is the handling of soil nonlinearity and its influence on site amplification. This is due to the lack of instrumental observations of strong nonlinearity in site response, and the inability for some of these methods to model complex site-specific nonlinear site response.
The Wellington region in New Zealand is a high seismicity zone that is strongly influenced by the site response in sedimentary basins. The Wellington Central Business District (CBD) and the nearby city of Lower Hutt are underlain by fault-bounded sedimentary basins (Kaiser et al., 2020) that have been shown to appreciably amplify ground motions in the period range of
To overcome challenges arising from limited observations of strong ground motions, approaches coupling observations with simulations, or different simulation methods have been proposed. For example, Bazzurro and Cornell (2004) developed a framework to use site-specific one-dimensional (1D) nonlinear site-response analyses to adjust hazard curves from empirical models, while de la Torre et al. (2020) and Pilz et al. (2021) used 1D site-response analyses to modify ground motions from regional-scale 3D ground-motion simulations which are currently incapable of capturing smaller-scale site-specific features and soil nonlinearity. Stewart et al. (2017) proposed using observations of linear site response in combination with 1D nonlinear site-response analyses to estimate the influence of site effects on ground motions for larger ground-motion amplitudes than what has been instrumentally observed at the site. In a similar manner, this study proposes combining site-specific site response from weak ground motion observations with 1D total stress nonlinear site-response analyses to estimate how these amplification factors vary with increasing ground-motion intensity. A database of weak-to-moderate intensity ground motions recorded in three basins of Wellington, New Zealand is used to study the observed site amplification. A subset of nine strong-motion stations was selected to perform nonlinear site-response analyses with strong ground motions to assess the influence of nonlinearity on site amplification factors and demonstrate the approach.
Methodology
Sites considered and basins in the Wellington region
Site-response observations are estimated from ground motion recordings at 43 strong-motion stations (SMS) throughout three main sedimentary basins of Wellington, New Zealand. The Te Aro and Thorndon basins are located in the Central Business District of Wellington and a third deeper basin exists under the cities of Lower Hutt and Petone. The map of the greater Wellington region in Figure 1 plots the estimated elevation (relative to mean sea level) of bedrock in the Wellington region (Hill et al., 2022) and identifies these basins of interest. A subset of nine stations, with good geotechnical and geophysical site characterization data (generally seismic cone penetration testing (sCPT), and active and passive surface wave methods), were selected for nonlinear site-response analyses with strong ground motions to assess the influence of nonlinearity on site/basin amplification factors and demonstrate the approach.
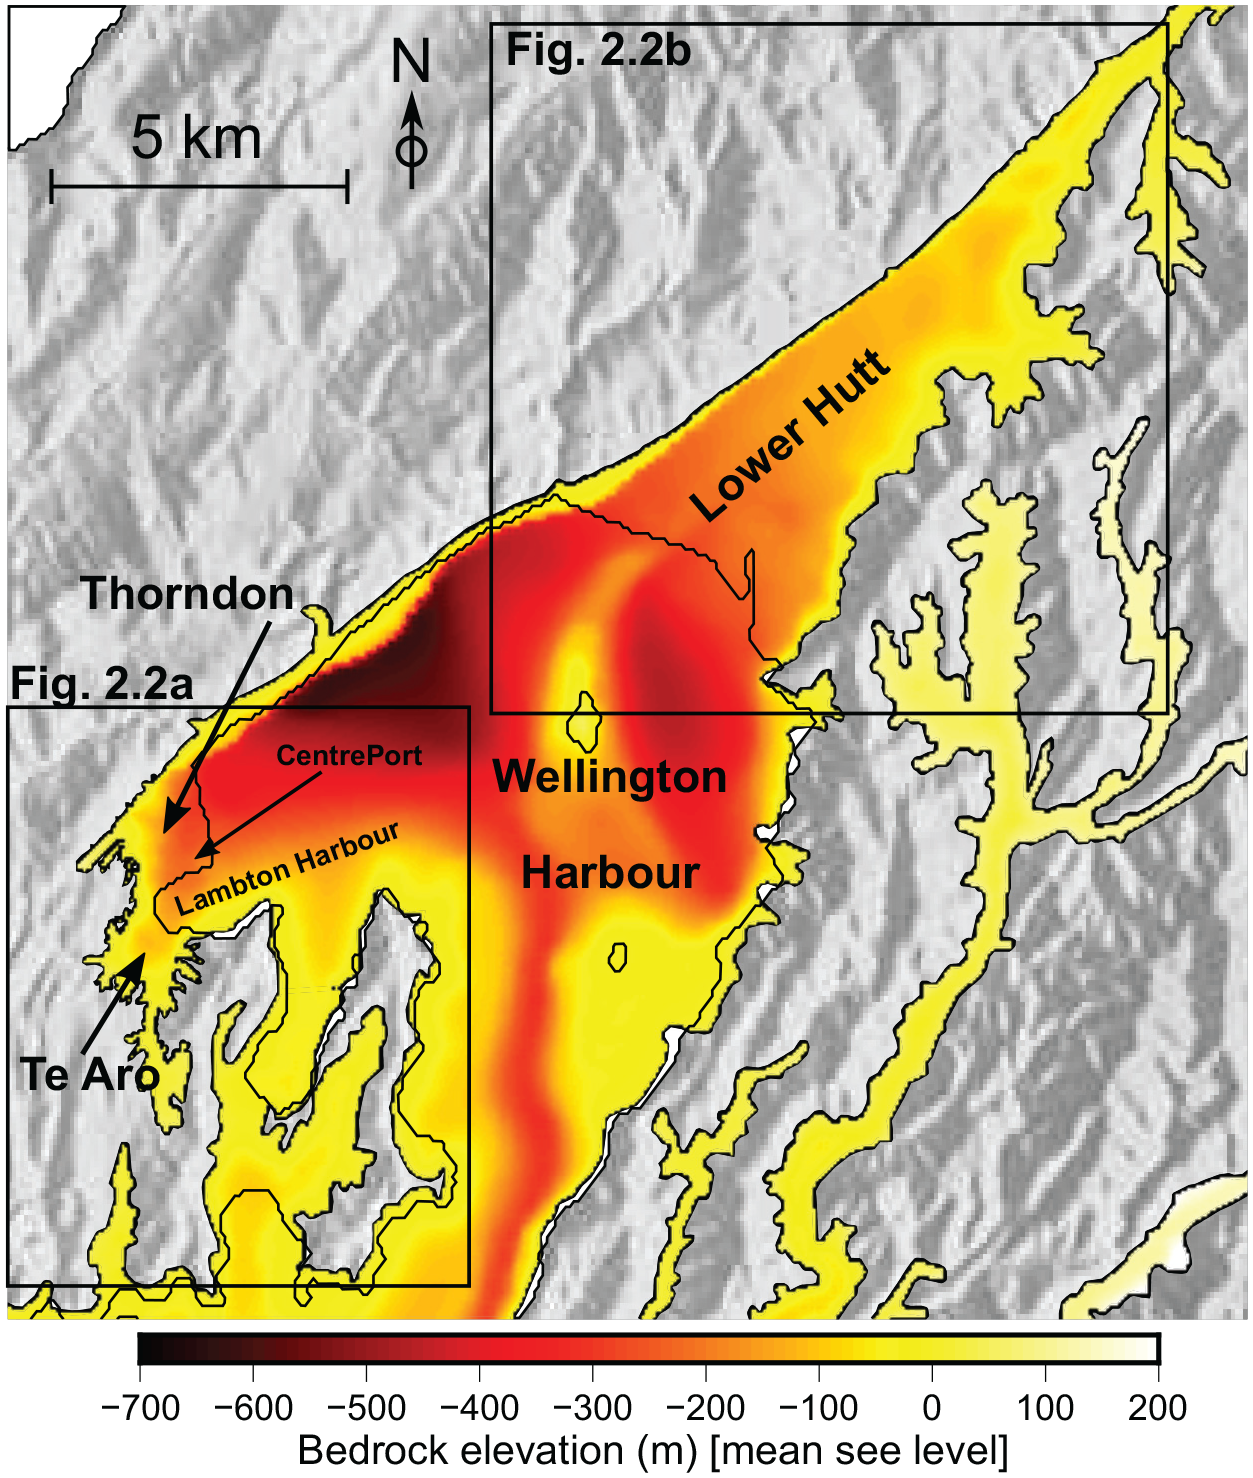
Estimates of bedrock elevation (relative to mean sea level) from the Hill et al. (2022) 3D Wellington Basin model. The main sub-basins of interest in this study are identified (Thorndon, Te Aro, and Lower Hutt).
Figure 2 shows the location of all SMS in the two regions (Wellington and Lower Hutt), as well as the surface traces of the Wellington and Aotea faults. The SMS symbols are color-coded by site period, showing values as long as 2 s in the deepest portions of the Lower Hutt basin. Table 1 includes additional metadata for all sites such as the time-averaged shear-wave velocity in the upper 30 m
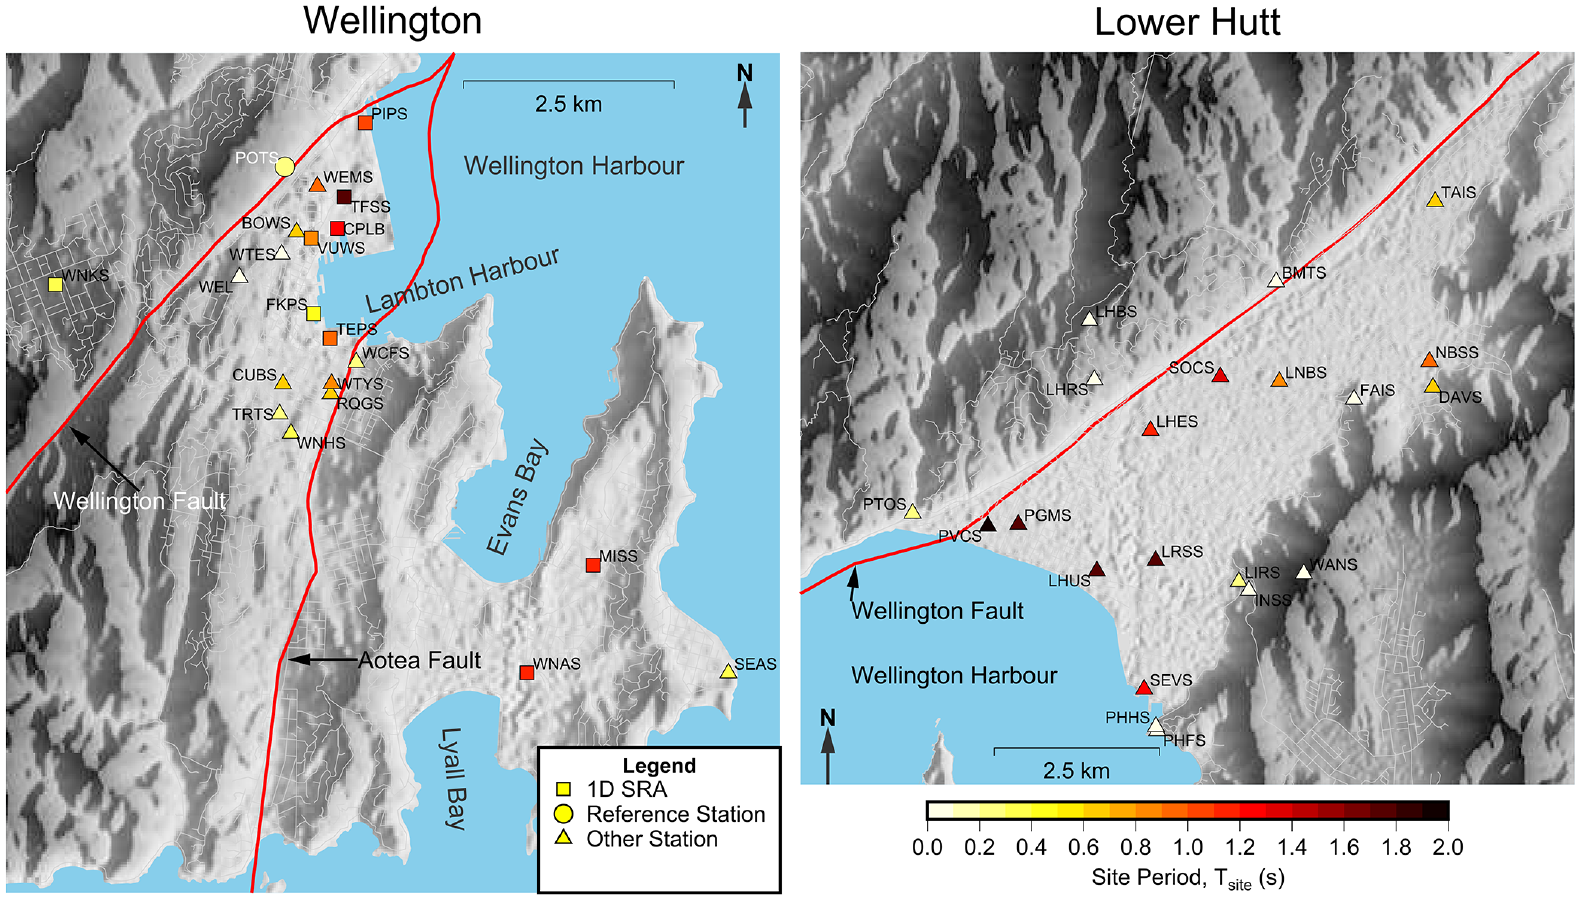
Topographic maps showing the location of strong motion stations used for this study in Wellington (left) and Lower Hutt (right). Station markers are color-coded by site period based on Wotherspoon et al. (2022). Stations in Wellington at which nonlinear site-response analyses (SRA) were performed are plotted with square symbols, and the reference station (POTS) is plotted with a circle and white font.
Metadata for Wellington region SMS including maximum and geometric mean observed horizontal PGA (geometric mean of two orthogonal components and all events recorded at the site)
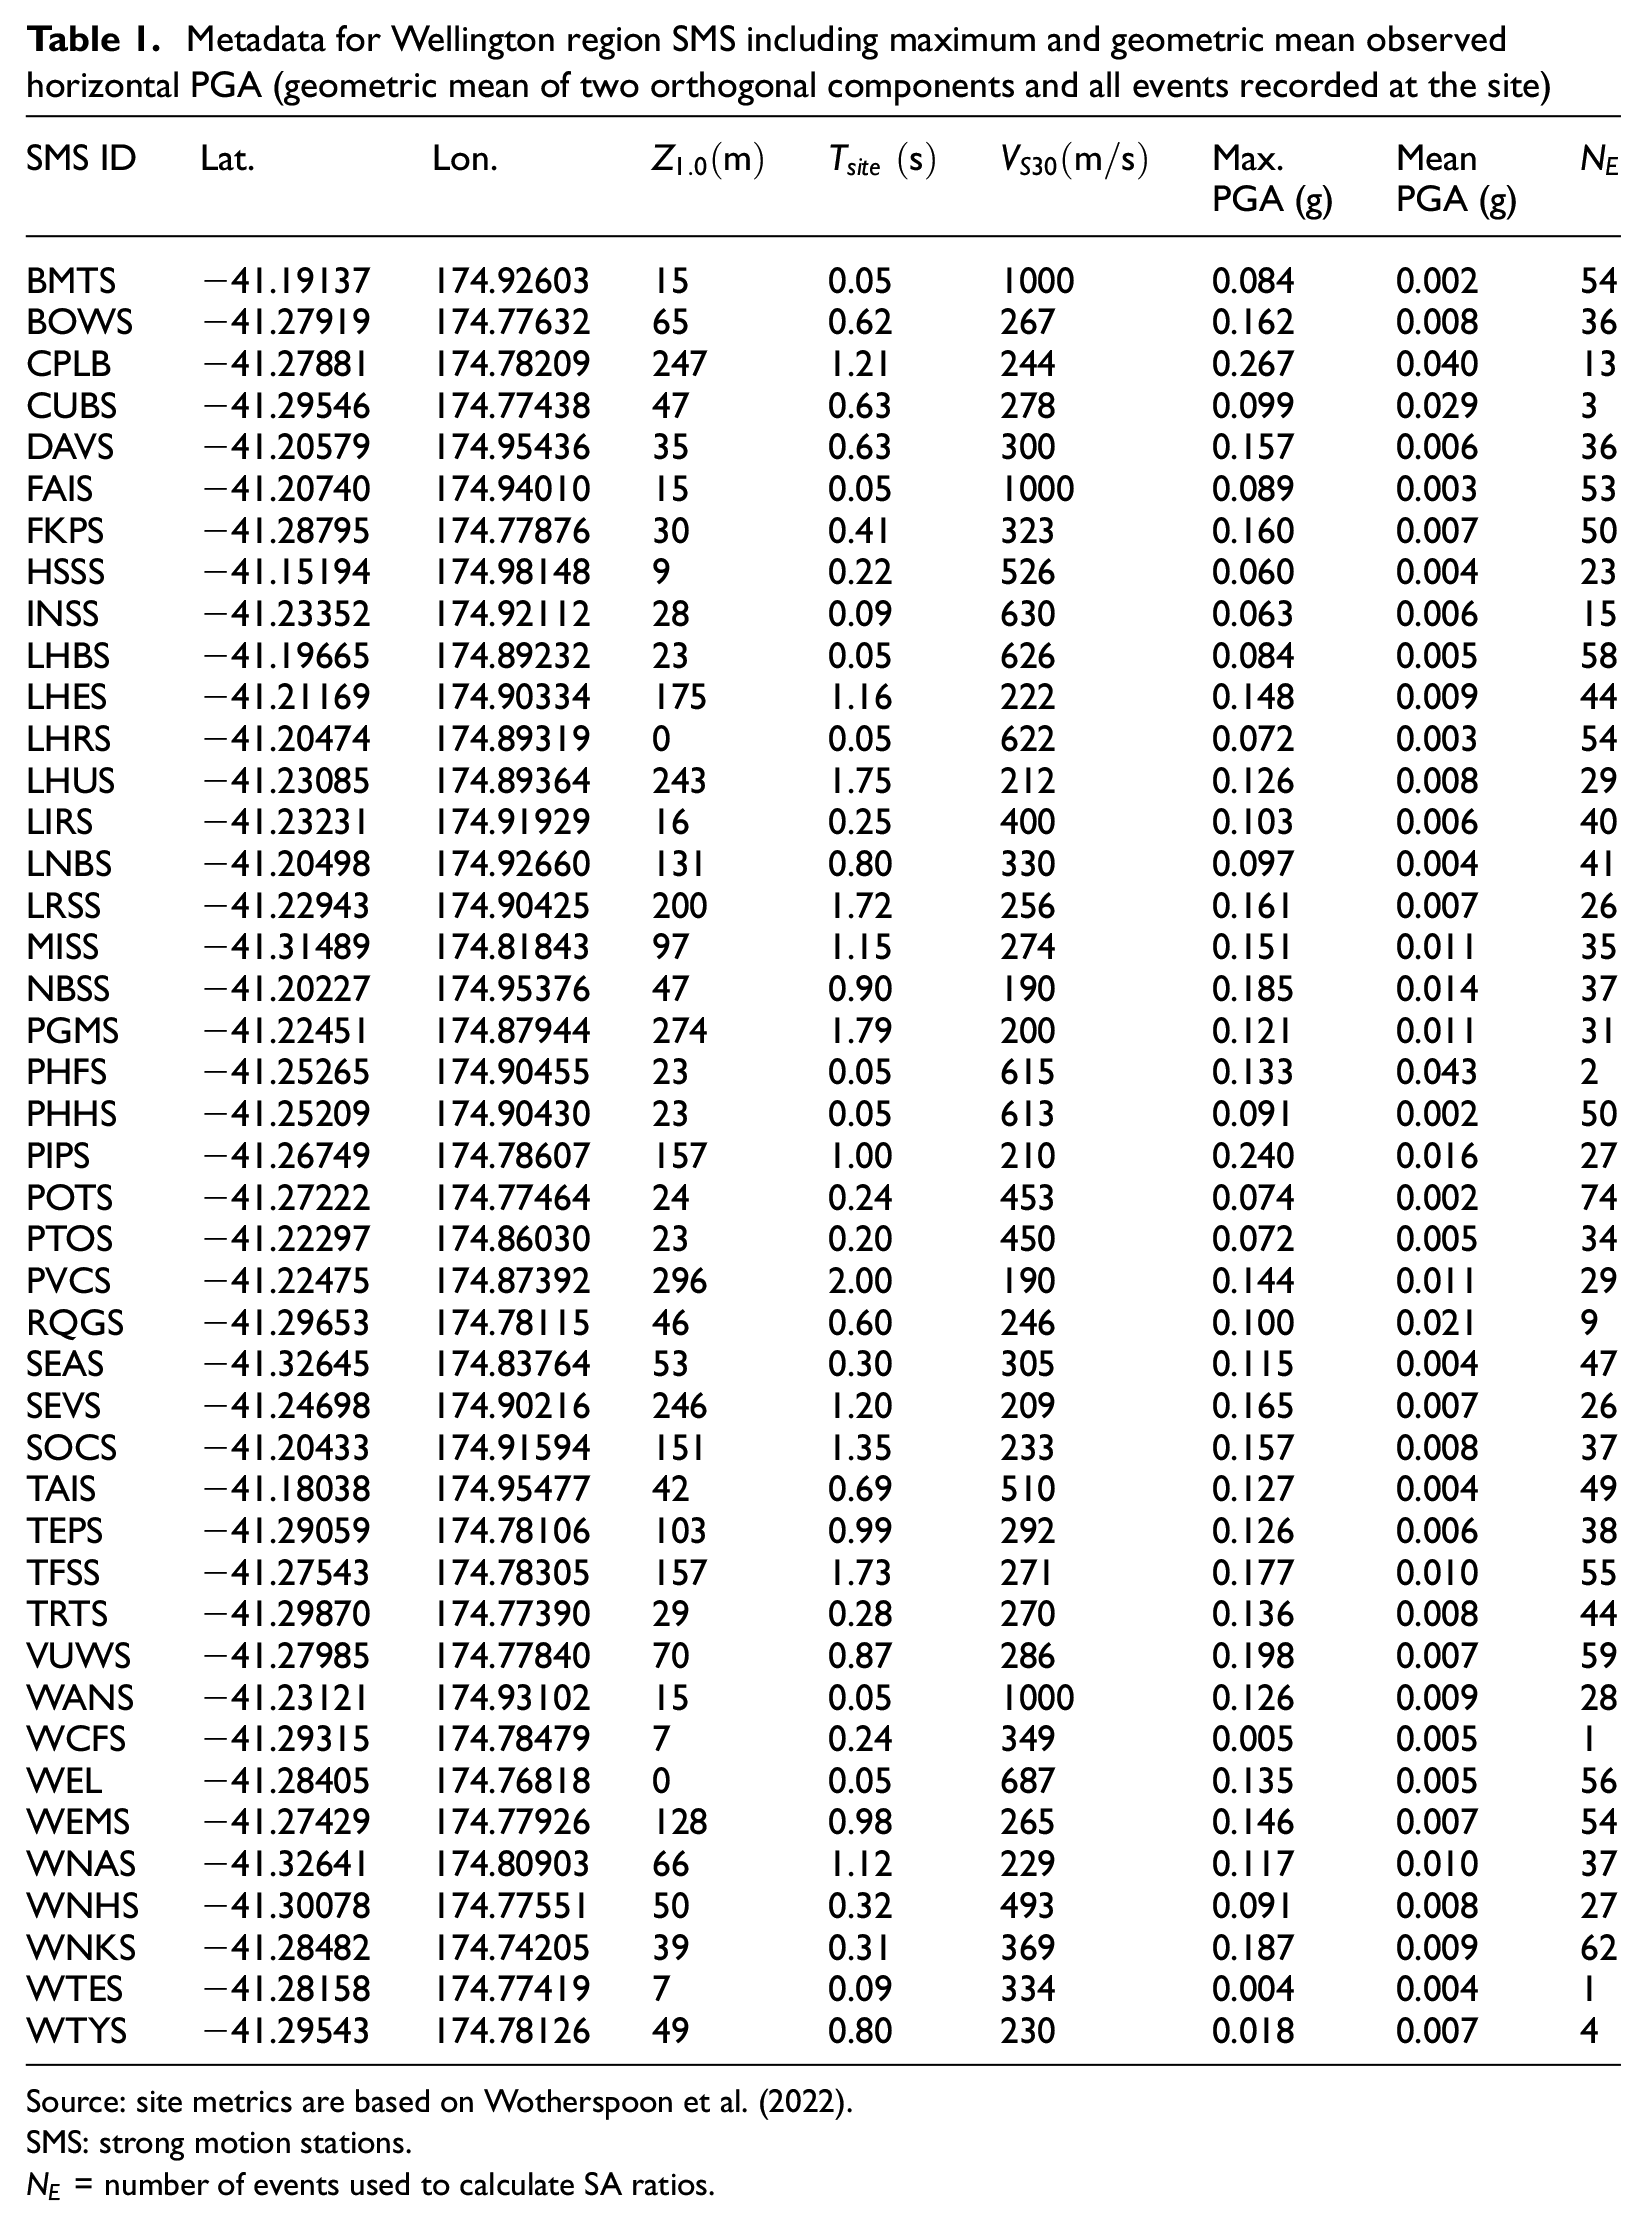
Source: site metrics are based on Wotherspoon et al. (2022).
SMS: strong motion stations.
Shear wave velocity
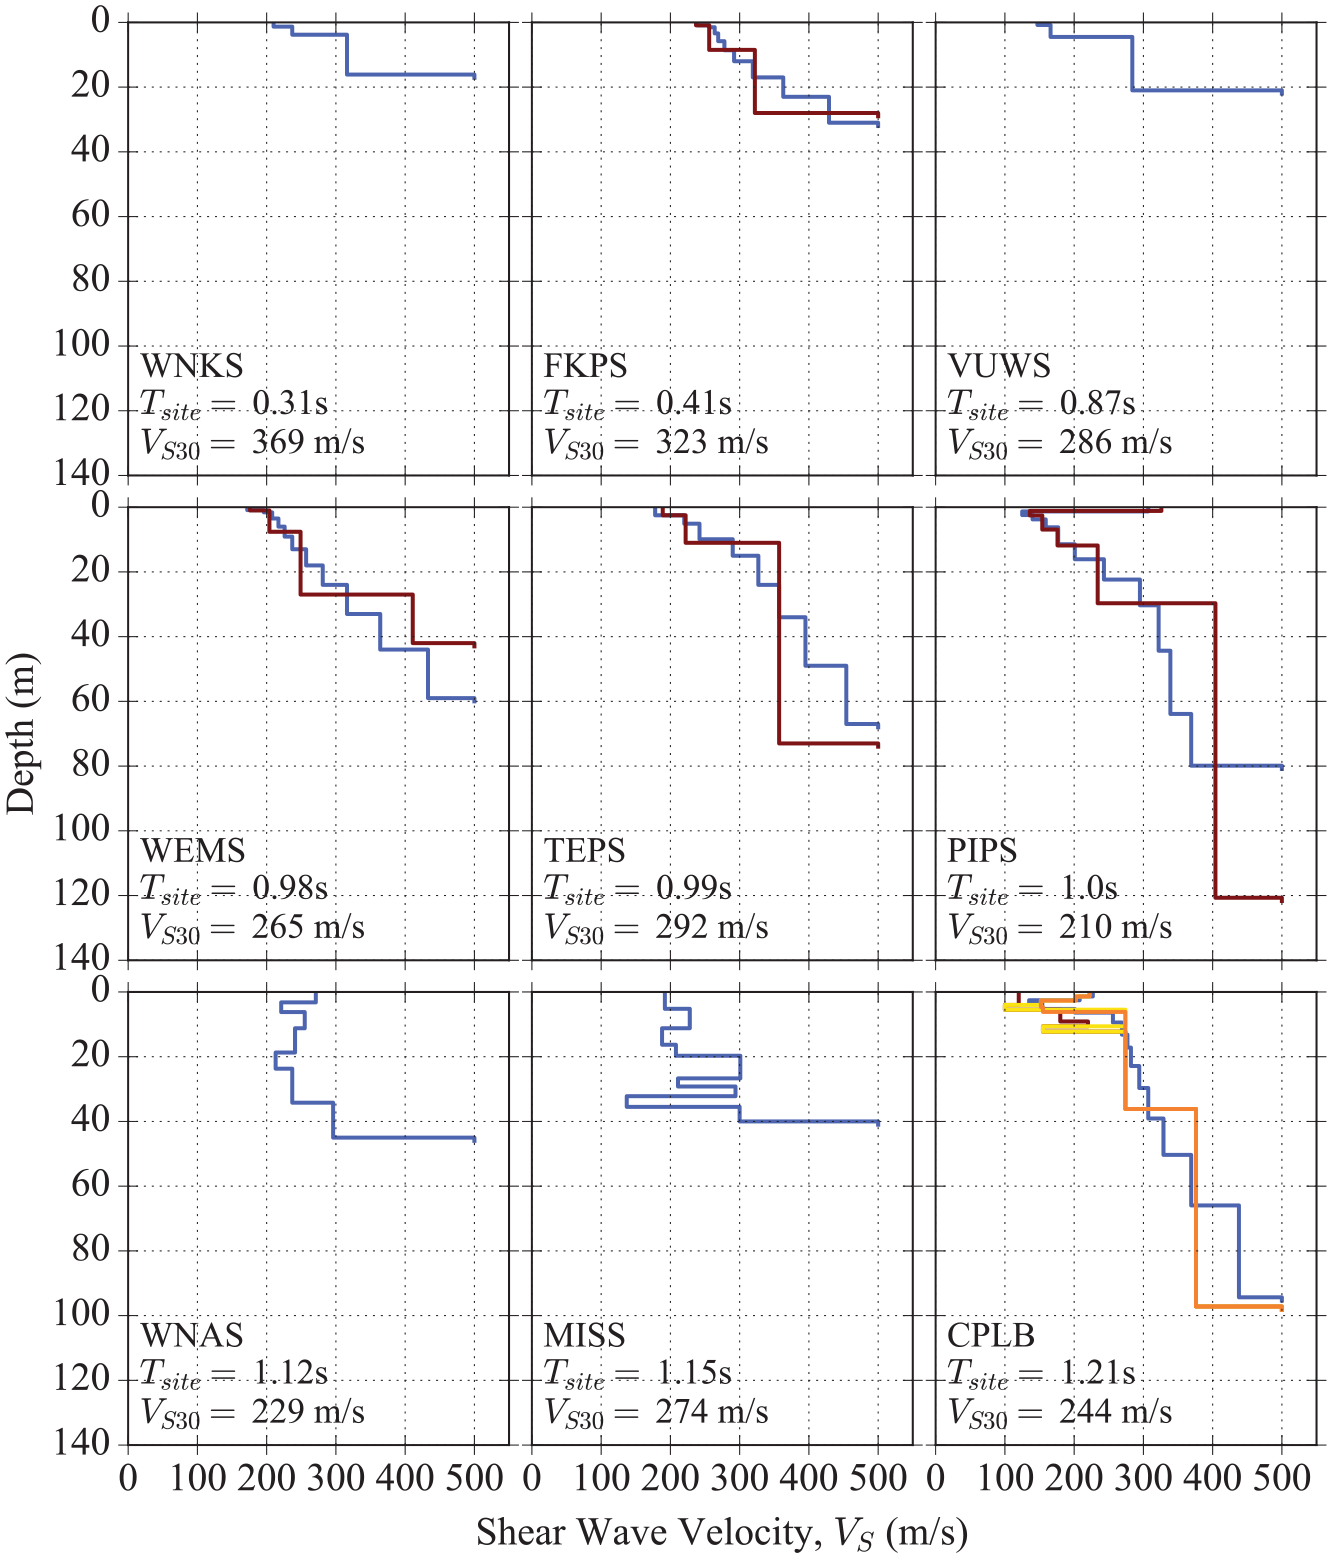
Shear wave velocity profiles for the nine sites at which nonlinear site-response analyses were performed. Subplots are ordered by increasing
Ground-motion database
A subset of ground motions from the 2021 New Zealand Ground Motion Database (Hutchinson et al., 2021) was used for this study. All events recorded at any of the 42 stations and the reference station (POTS) simultaneously were included in this study. The ground-motion preprocessing is documented in Hutchinson et al. (2021), however, additional rejection criteria on the database were enforced. These criteria help ensure that only the highest quality records within the selected moment magnitude
Crustal events with
Interface subduction events with
Slab subduction events with
Accelerometer channels only (i.e. “HN” and “BN” channels).
Following the additional rejection criteria, a total of 74 events, with weak-to-moderate shaking intensities, were available at POTS, making that the maximum possible number of events considered for any site. The total number of event and site pairs in the database used for this study was 1528. The number of events considered for each site
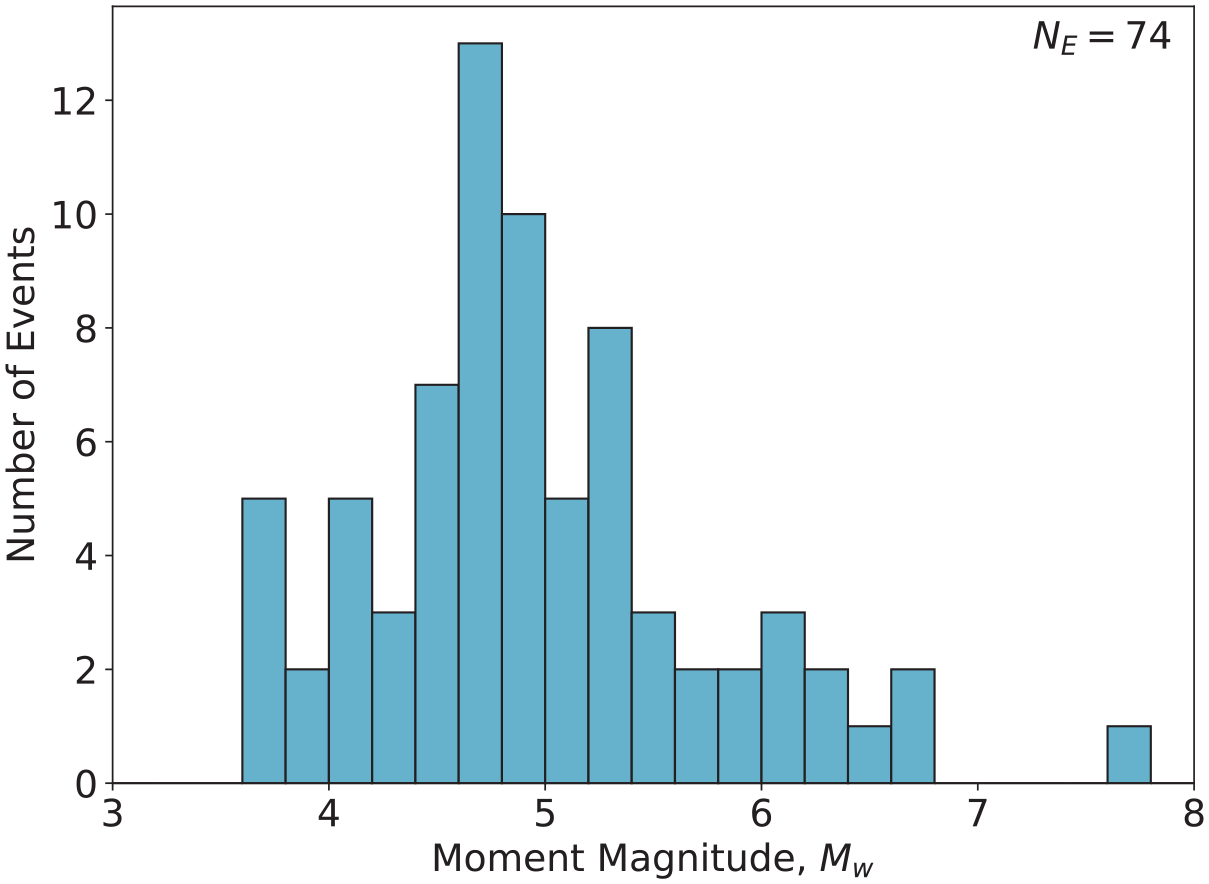
Histogram of moment magnitude
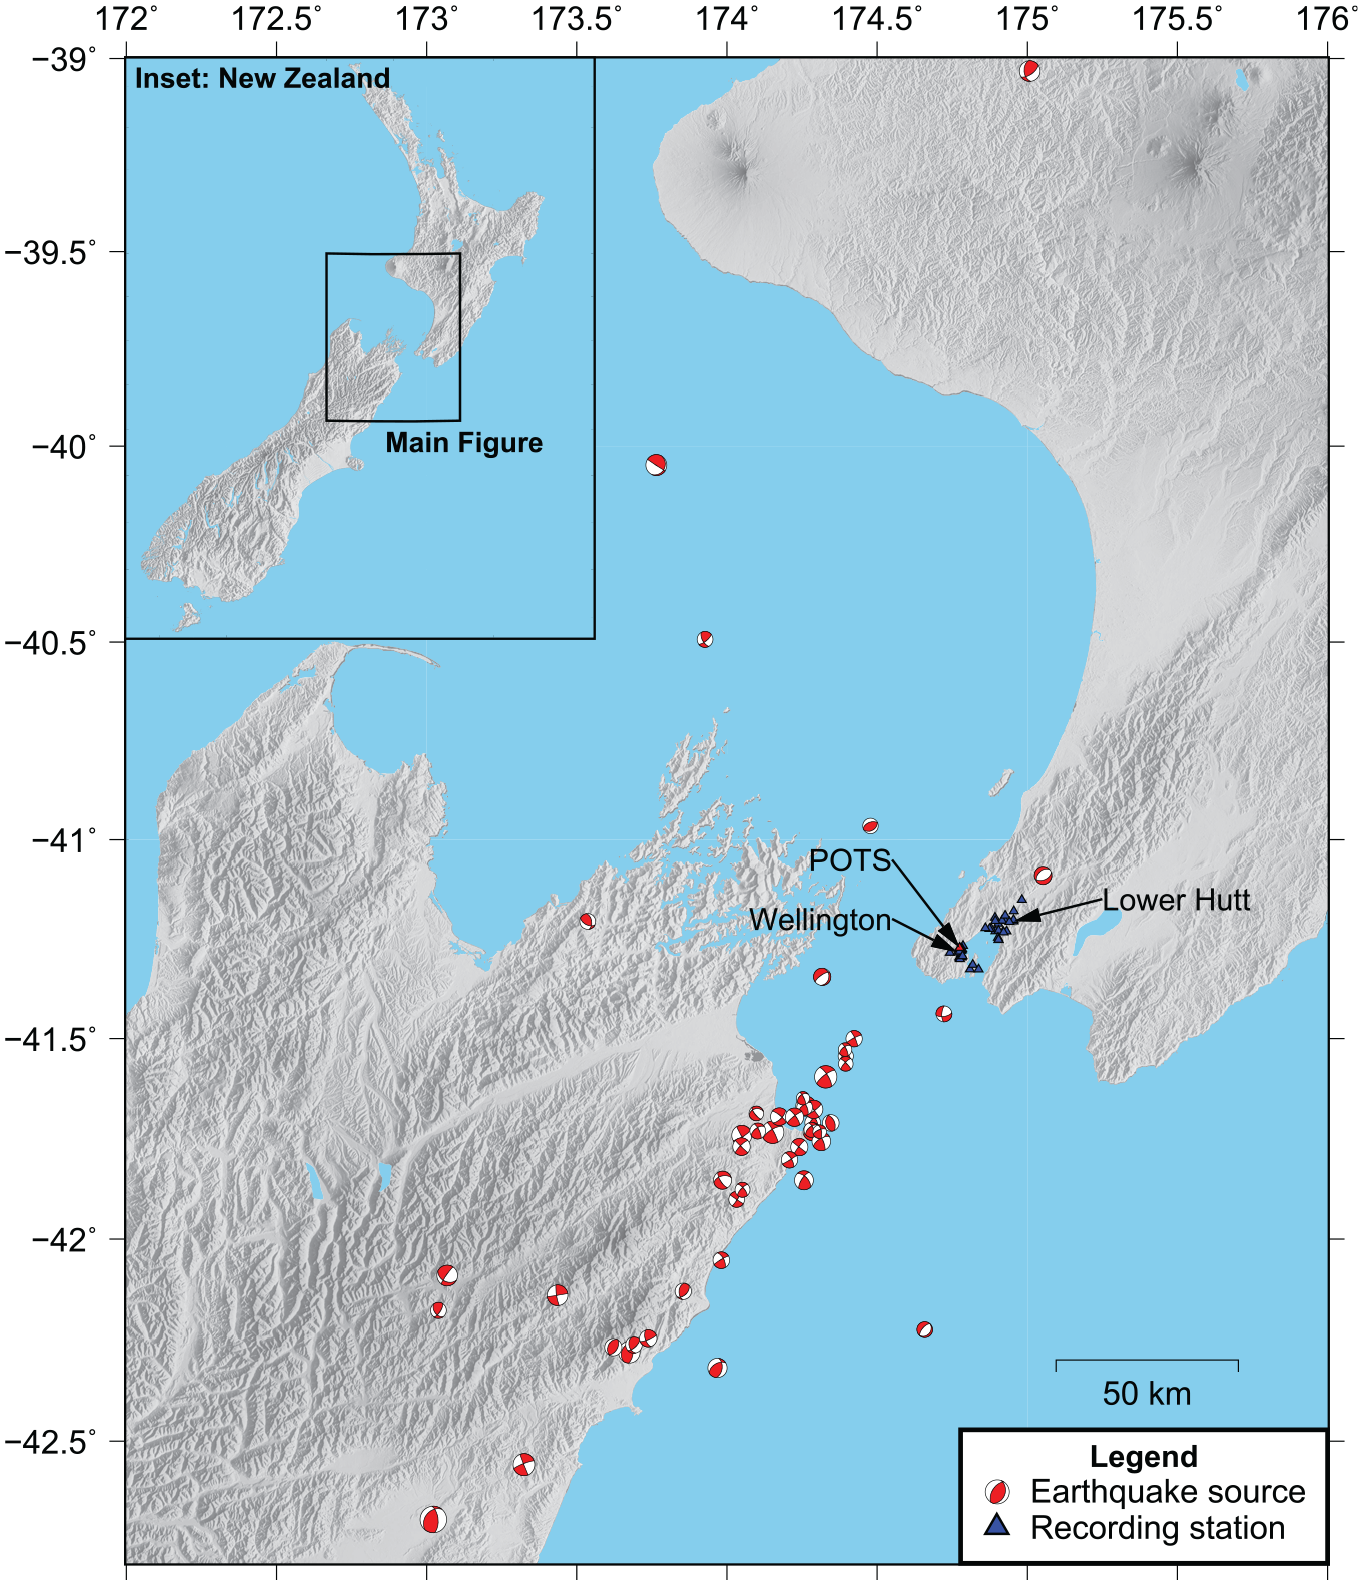
Map showing the location of epicenters of all events considered relative to the sites considered. The reference station, POTS, is labeled and plotted with a red triangle.
Assessment of reference stations
To estimate site response from observational data, a reference site was used. For this study, the Wellington Pottery Association building SMS (POTS) was selected as the reference station and is used for computing spectral acceleration (SA) amplification factors (i.e. ratios) at all sites. As shown in Figure 2, POTS lies outside of the basin, just north of the surface trace of the Wellington Fault and at the toe of the Wellington hills. A borehole with downhole
The measured
Kaiser et al. (2023) showed that estimates of full site response (i.e. site response predicted by the model plus the uncaptured site response represented by the site-to-site residual; relative to
The earthquake HVSR at POTS is relatively flat (see Figure 2 of Bradley et al., 2018), suggesting that strong site effects are not present. Bradley et al. (2018) anecdotally suggested using POTS and PTOS as reference stations, based on HVSR and the similarity of response spectra recorded at other rock SMS in the area. The site responses relative to POTS (i.e. the SA amplification factors) are compared in Figure 6 for several other sites outside of the basin edge and hill sites that could be considered as potential reference sites. SA for many of these sites are generally consistent, although some are likely influenced by the following effects: (1) site amplification for softer soil sites on the basin edge (WCFS, WTES, and SEAS), (2) topographic amplification at the tops or crests of hills (e.g. WANS, LHBS, and WEL; refer to topography in Figure 2), and (3) topographic deamplification at the toe of slopes (PTOS and INSS in Lower Hutt). On average, the site response at POTS is similar to other rock outcrop and stiff shallow soil sites.
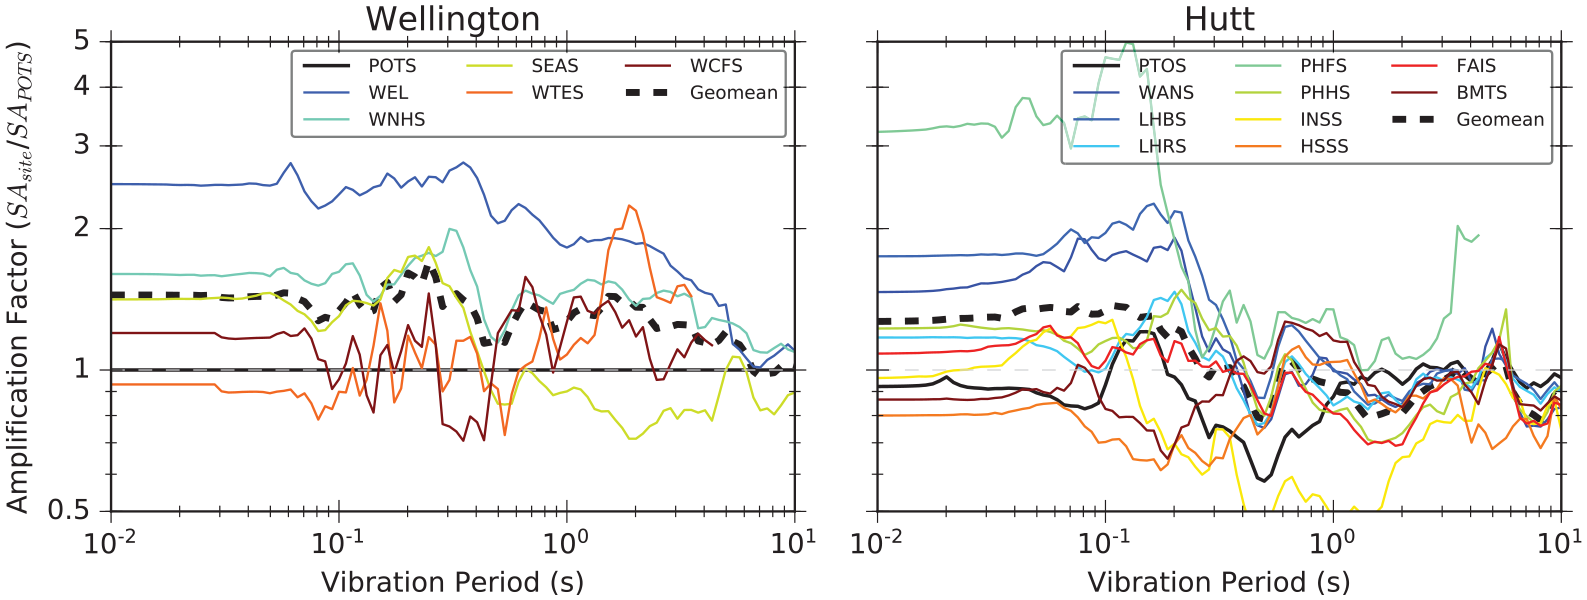
Geometric mean observed spectral acceleration amplification factors relative to site POTS for potential reference sites in Wellington (left) and Hutt (right). Potential reference sites are those outside the basin either on the edge of the basin (POTS, WTES, and WCFS in Wellington; PTOS and INSS in Hutt) or in the hills surrounding the basin (WEL, WNHS, SEAS in Wellington; WANS, LHBS, LHRS, PHFS, PHHS, HSSS, FAIS, and BMTS in Hutt).
POTS is located in close proximity to other sites in Wellington such that for sites in the Thorndon and Te Aro basins, distance scaling of the ground motions should not significantly influence the observed amplification factors. As shown in Figure 5, the source-to-site distances are generally large compared with the distance between POTS and other sites in Wellington. For Lower Hutt sites, the distance to POTS (approximately 8–18 km) is such that there may be some influence of source-to-site distance on spectral ratios for some of the closer events located in the Cook Strait and the NE corner of the South Island. We acknowledge this limitation, but still selected POTS as the reference for all stations because (1) a direct comparison can be made between Wellington and Lower Hutt ground motion amplitudes, albeit with some influence from distance scaling, (2) all Lower Hutt sites are using the same reference and can therefore be reasonably compared between themselves, and (3) the influence of distance scaling over these distances, if any, would primarily effect short periods.
The comparison of POTS to other similar stiff shallow soil or rock stations, its proximity to sites in the Wellington area, and the assessment of HVSR data and site-to-site residuals that do not suggest that POTS experiences pronounced or unusually large site response, make it a good candidate for use as a reference station throughout this article. This station was chosen over PTOS because the larger number of events recorded at POTS and the seemingly strong deamplification observed at PTOS around
Observed linear site amplification factors
For all 43 stations shown in Figure 2, observed site response was estimated using ratios of SA relative to the reference rock station, POTS. Geometric mean spectral ratios, or “amplification factors,” of all events recorded at any station and reference station pairs were computed. As discussed in subsequent sections, the majority of events produced weak shaking with generally linear response. However, trends in amplification factors, and predictions from 1D site-response analyses and empirical models, suggest there is likely some influence from nonlinearity for the intensity of shaking corresponding to the strongest records at soft sites, albeit minor. It was chosen to keep these events in the calculation of the linear site term in order to be able to resolve long-period amplification from larger-magnitude events. The effects of nonlinearity on observations were “removed” using results of nonlinear analyses, as discussed in the “Correcting observations for minor soil nonlinearity to compute the observed linear site response” section. The term site response used herein encompasses the combined effect from geometric amplification (i.e. basin effects) and near-surface soil amplification (e.g. impedance amplification due to soil stratigraphy, and soil response).
The top panels in Figure 7 plot geometric mean observed site amplification factors for sites within these three basins (Te Aro, Thorndon, and Lower Hutt). The results for different basins are plotted on separate columns, and lines are color-coded by the site period,
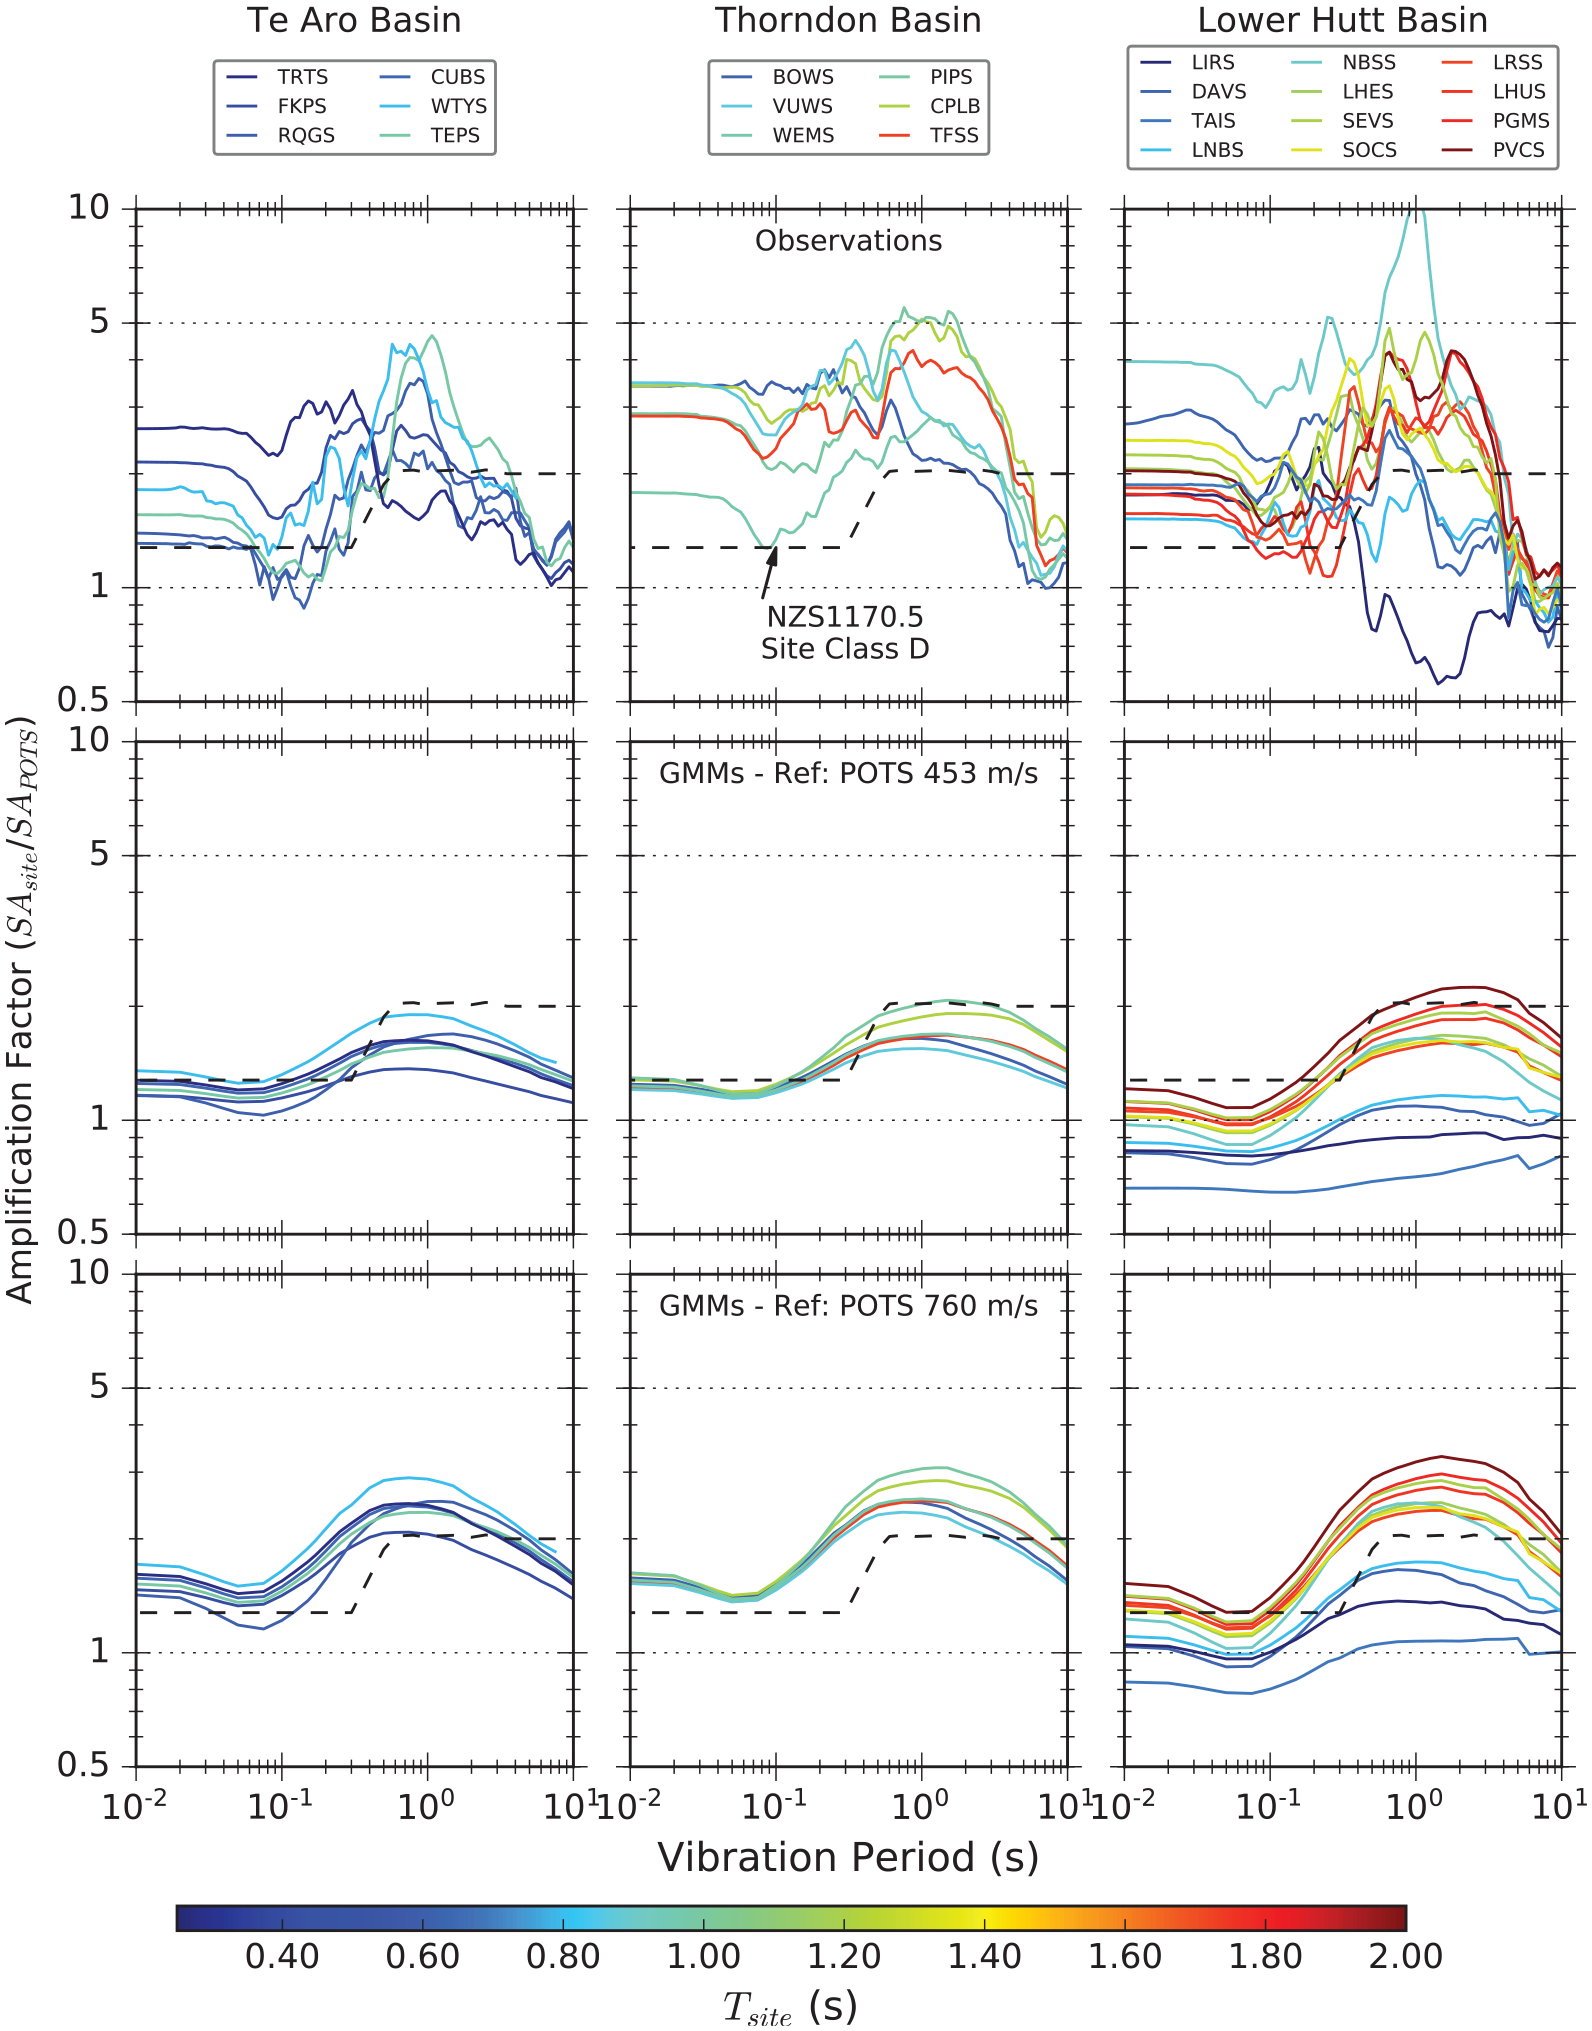
Geometric mean spectral acceleration amplification factors relative to the reference site POTS for: observed ground motions (top row), empirical GMM predictions using
The middle row of Figure 7 plots predicted spectral ratios (relative to the prediction at POTS) from empirical GMMs assuming the measured
The observed site response for deeper basin sites significantly exceed the New Zealand Standard (NZS1170.5, 2004) code-based amplification factors for Site Class D (relative to a reference condition of a Site Class A/B rock site; shown as a dashed black line in Figure 7) at long periods
Influence of nonlinearity on observations
While most events in the database produced weak recorded motions, the three largest magnitude and highest intensity ground motions (from the 2016
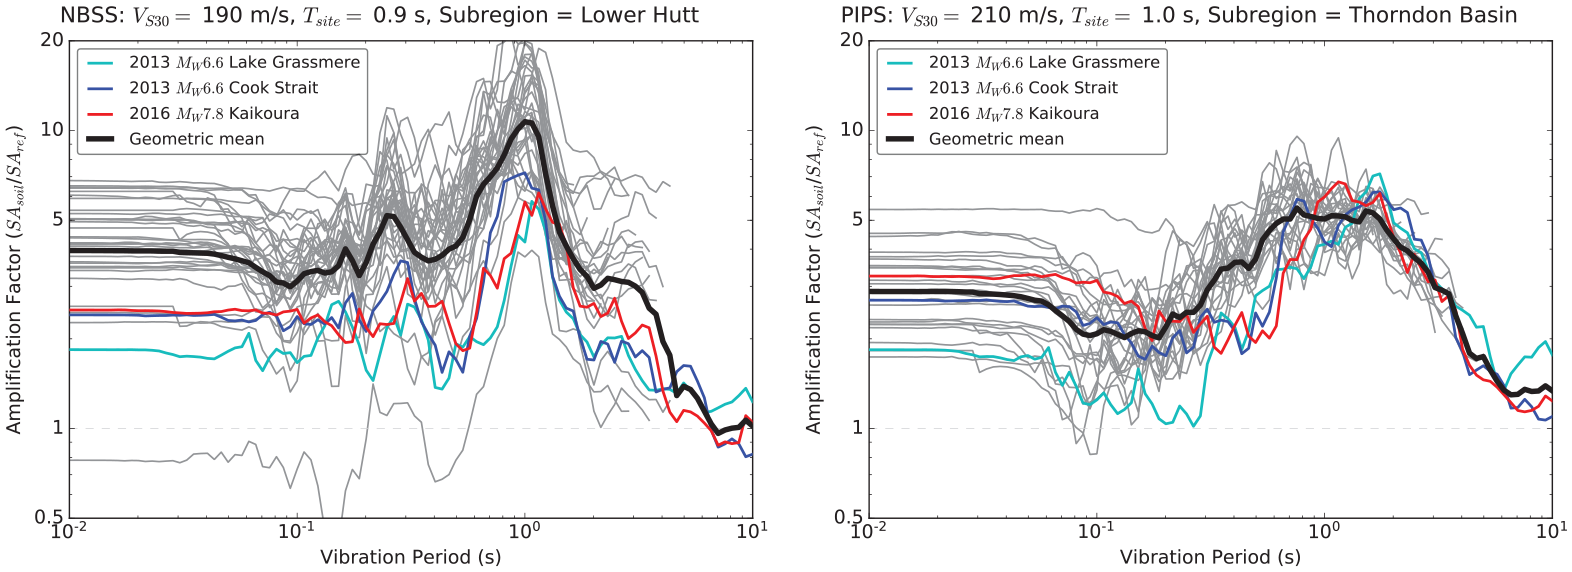
Observed spectral acceleration amplification factors for all events recorded at two soft soil sites: NBSS in Lower Hutt (left), and PIPS in Thorndon Basin (right). The three largest earthquakes (i.e. largest magnitude and strongest shaking intensity) are identified with different colors to illustrate potential influence of nonlinearity on observations.
The highest recorded peak ground accelerations
Nonlinear site-response analyses
To estimate how amplification factors vary with increasing ground-motion intensity, nonlinear total stress site-response analyses were performed using strong ground motions. Two orthogonal components of ground motions for the three largest-magnitude events recorded at the reference station (POTS) were scaled to reference PGA
The input parameters defined in this study for the PDMY02 model in OpenSees include: soil density, friction angle, shear, and bulk moduli at a reference pressure and the reference pressure. For the phase-transformation angle and contraction/dilation parameters, the default values based on relative density from the OpenSees Wiki were used. These contraction/dilation parameters do not influence the response, because the analyses are drained (i.e. an unrealistically high value of permeability is used). For PIMY in OpenSees, only the soil density, friction angle, and shear and bulk moduli are required. For DEEPSOIL, the input parameters include layer thickness, unit weight, shear wave velocity, shear strength, and reference MRD curves. Another modeling difference between these two codes, in addition to the different Masing unload–reload behavior, is the use of a pressure-dependent constitutive model for sands and gravels in OpenSees. While this could have some influence under strong shaking for soft soils, the soil and
The profiles used in 1D site-response analyses were taken down to a reference condition with shear wave velocity
Combining nonlinear adjustment factors with observed amplification factors
Quantifying the effects of nonlinearity in simulations
To estimate how the linear observed basin amplification factors change with increasing ground motion amplitude, nonlinear adjustment factors are computed from results of the 1D site-response analyses. The first step is to assess how the amplification factors from simulations vary with increasing amplitude relative to a reference linear simulation with a weak motion as follows:
Compute the geometric mean SA amplification factor
Bin the remaining amplification factors
Calculate the geometric mean amplification factor for each
Compute nonlinear adjustment factors as
Use the midpoint of each
To calculate approximate nonlinear adjustment factors for arbitrary values of
Correcting observations for minor soil nonlinearity to compute the observed linear site response
Once the nonlinear adjustment factors are computed from simulations, the observations were slightly corrected to back-calculate a corresponding linear amplification factor. While the observations are of relatively weak motions, and do not cause significant nonlinearity, the softest sites do experience minor soil nonlinearity effects from the strongest ground motions as explained above in the “Influence of nonlinearity on observations” section. Rather than neglecting these ground motions in computing the observed linear amplification, we chose to correct them based on simulations so that the amplification at long periods from these larger magnitude events could be included (i.e. most other events have a maximum usable period
Calculate the observed SA amplification factor relative to the reference station (POTS) for every event,
If
If
The linear observed amplification factor (in linear scale) for each event is now back-calculated by dividing out the interpolated nonlinear adjustment factors from the “raw” amplification factor with minor effects of nonlinearity as
For each site, take the geometric mean of all events to compute the observed linear site response
Adjusting observed linear site response to larger intensities based on nonlinear simulation results
After estimating the observed linear site response for each site (i.e. the geometric mean
For each
Multiply the linear site response term by the nonlinear adjustment factors, that is,
Illustrative examples of this procedure and the final results for all sites at which nonlinear site-response analyses were performed are in the “Modification of observed linear site response using nonlinear adjustment factors from simulations” section.
Results and discussion
Illustrative example of response spectra for increasing ground-motion intensity
To illustrate how the predicted amplification of ground motions varies with increasing input motion amplitude, response spectra for individual analyses are plotted in Figure 9. Results for different
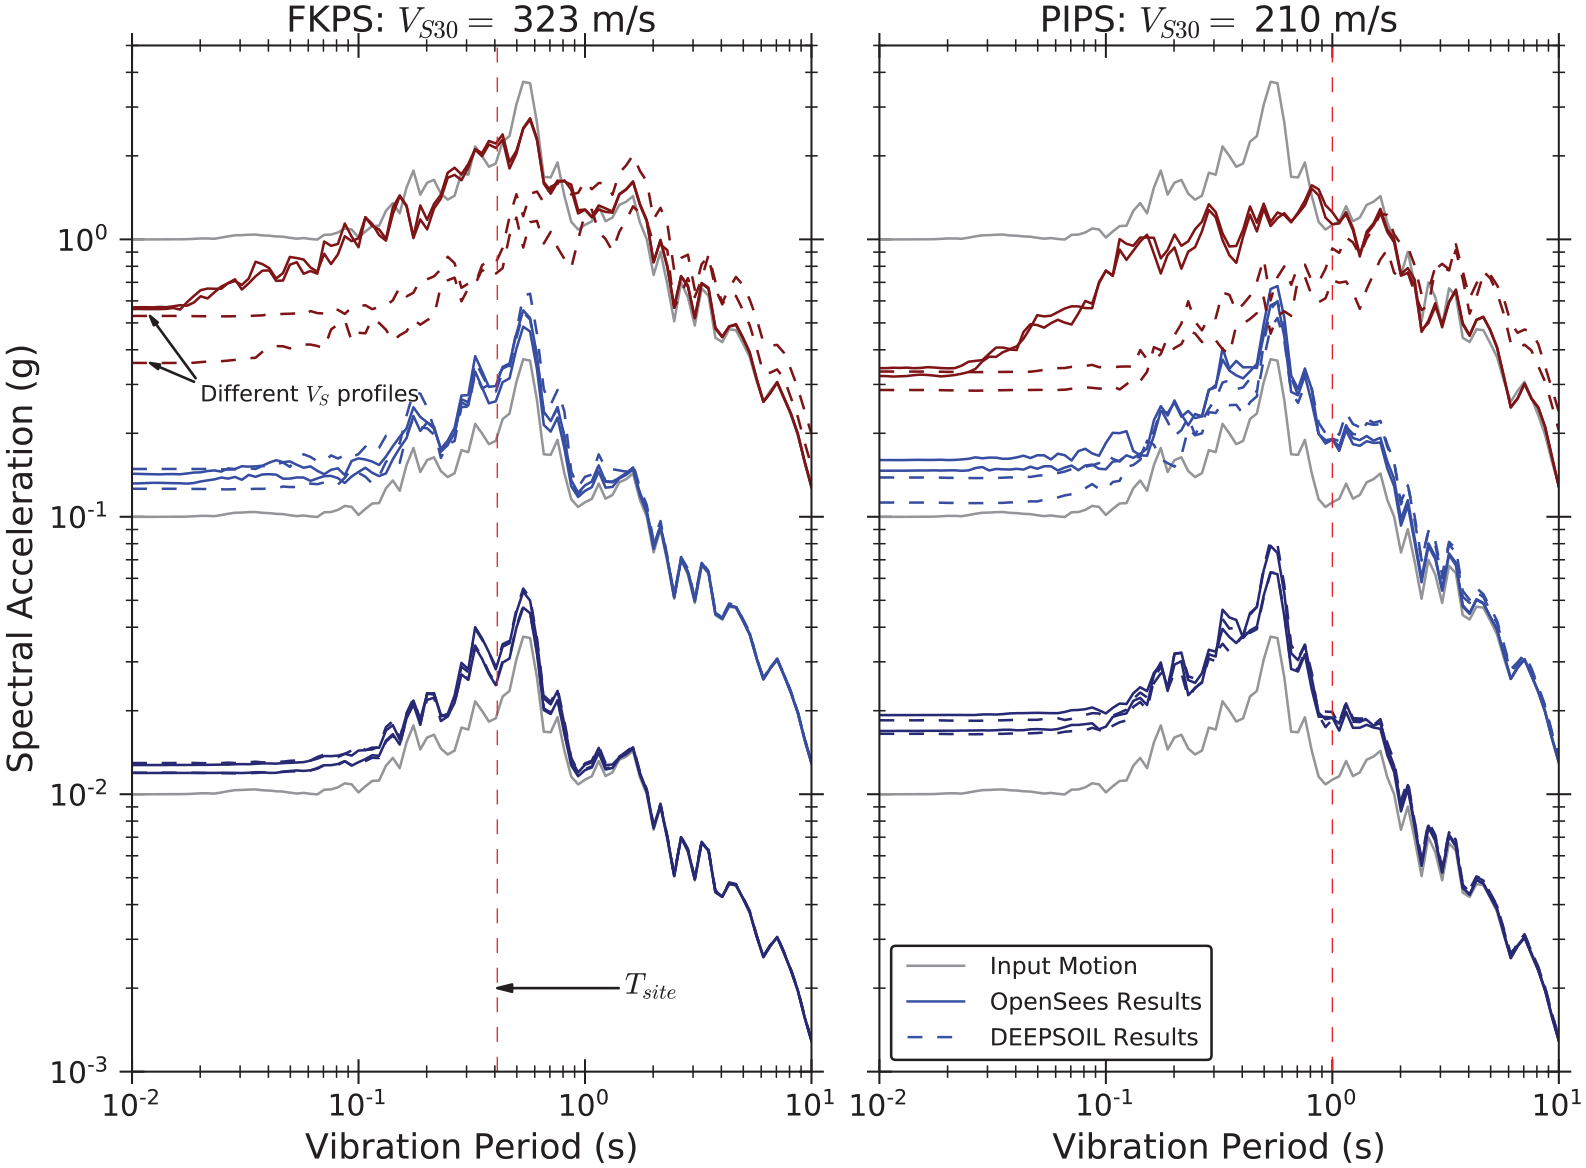
Example response spectra showing the influence of soil nonlinearity with increasing amplitude of the input motion (i.e.
Figure 9 illustrates that under weak ground-shaking (e.g.
As the intensity of ground-shaking increases, softer sites (such as PIPS) exhibit larger strains and more severe nonlinearity. This is visible in Figure 9, in which PIPS experiences more severe deamplification at short periods due to soil nonlinearity from the input motion with
Influence of nonlinearity on site amplification factors
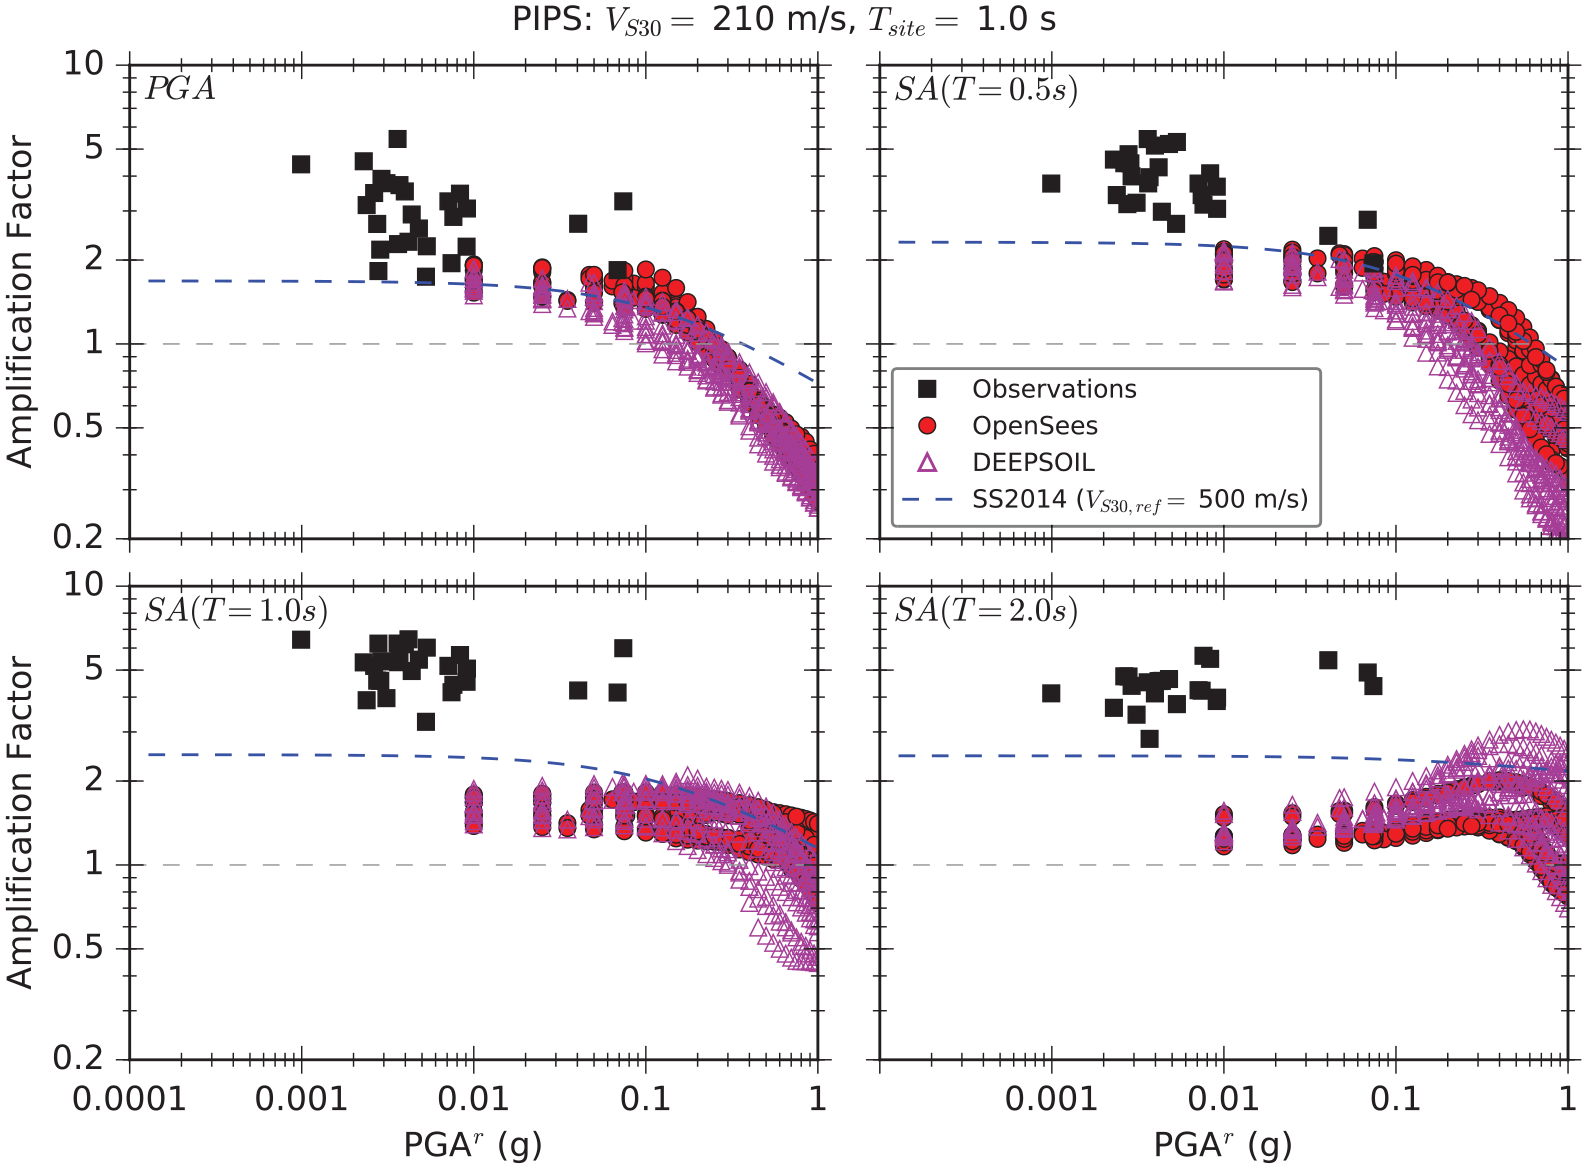
The same trends discussed above for individual response spectra can also be seen in amplification factors for all analyses at a given site. To further illustrate these trends, SA amplification factors (i.e.
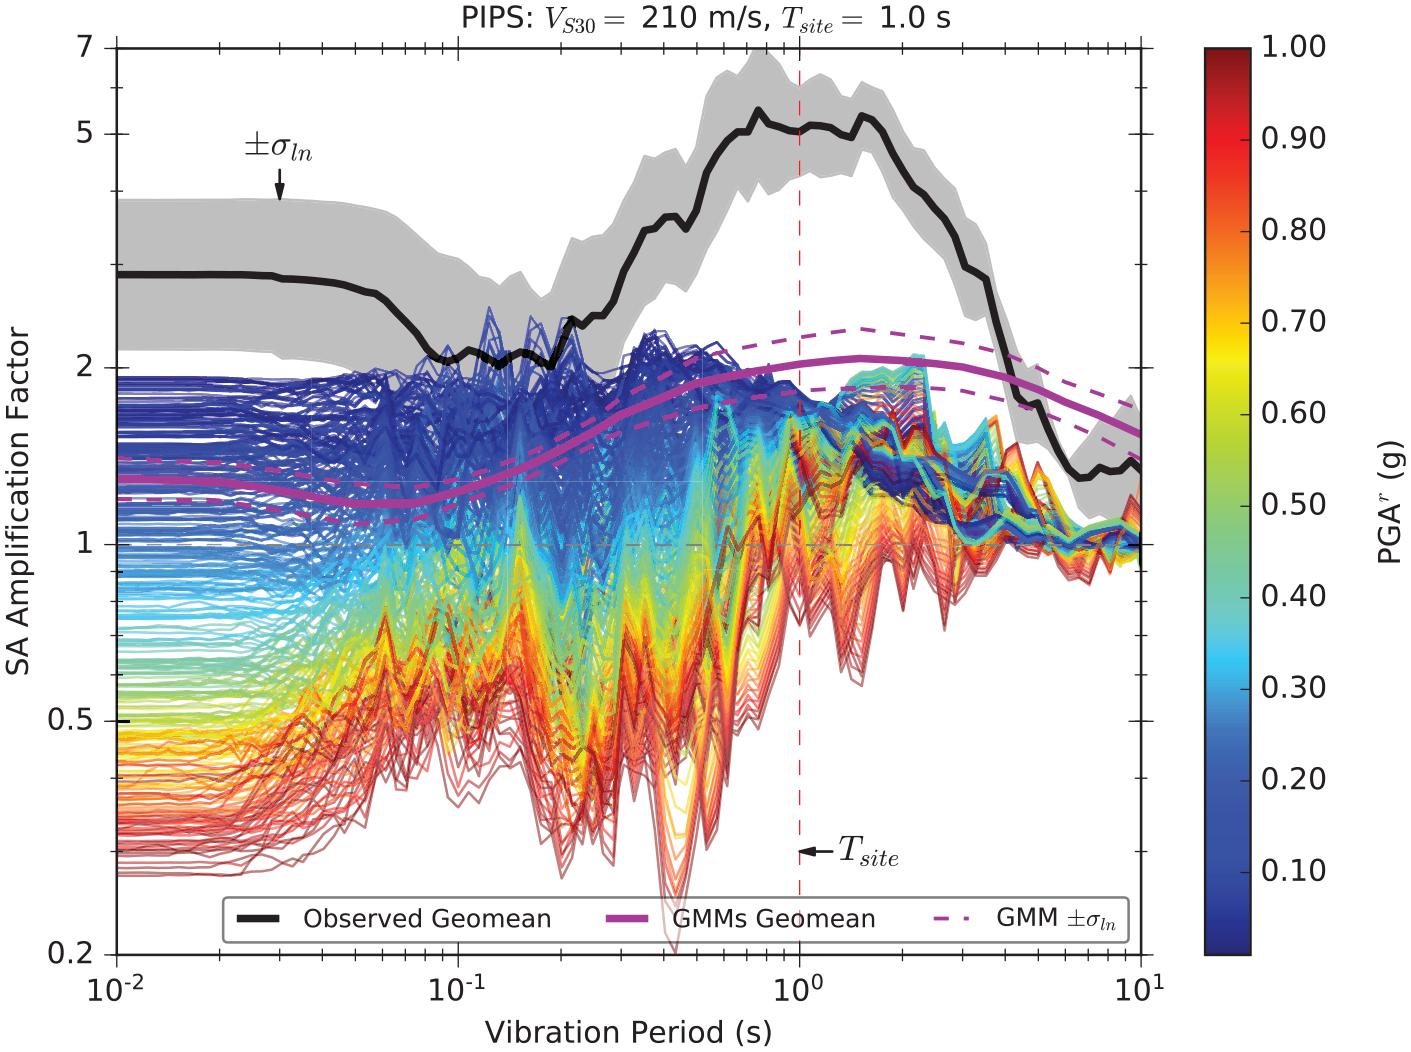
Comparison of spectral acceleration amplification factors for the geometric mean of observations, the geometric mean of empirical GMM predictions, and individual nonlinear analyses for all input motions with increasing intensity (ratio of soil surface motion to input motion) for an example soft site (PIPS). The nonlinear site-response results are color-coded by
Figure 10 illustrates that the amplification factors from 1D analyses are significantly lower than the observed median amplification factor at long periods. This is expected, as this long period energy comes from 3D effects at greater depths, not considered in 1D site-response models with limited vertical extents. However, this highlights one of the severe limitations of using nearby rock outcrop motions as input to 1D site-response analysis of soil/basin sites (i.e. any 3D basin effects that impact nonlinearity dependence will not be considered). While this poses issues for trying to directly predict the surface motion, this article focuses more on the relative amplification between different intensity levels. Interestingly, the GMM predictions also significantly under-predict the additional long period amplification from POTS to a soft basin site. This suggests that the index parameters used to estimate site and basin amplification (e.g.
The results in Figure 10 can be viewed at individual vibration periods to effectively visualize how the amplification factors vary with increasing
Amplification factors as a function of reference motion intensity
Amplification factors as a function of reference motion intensity
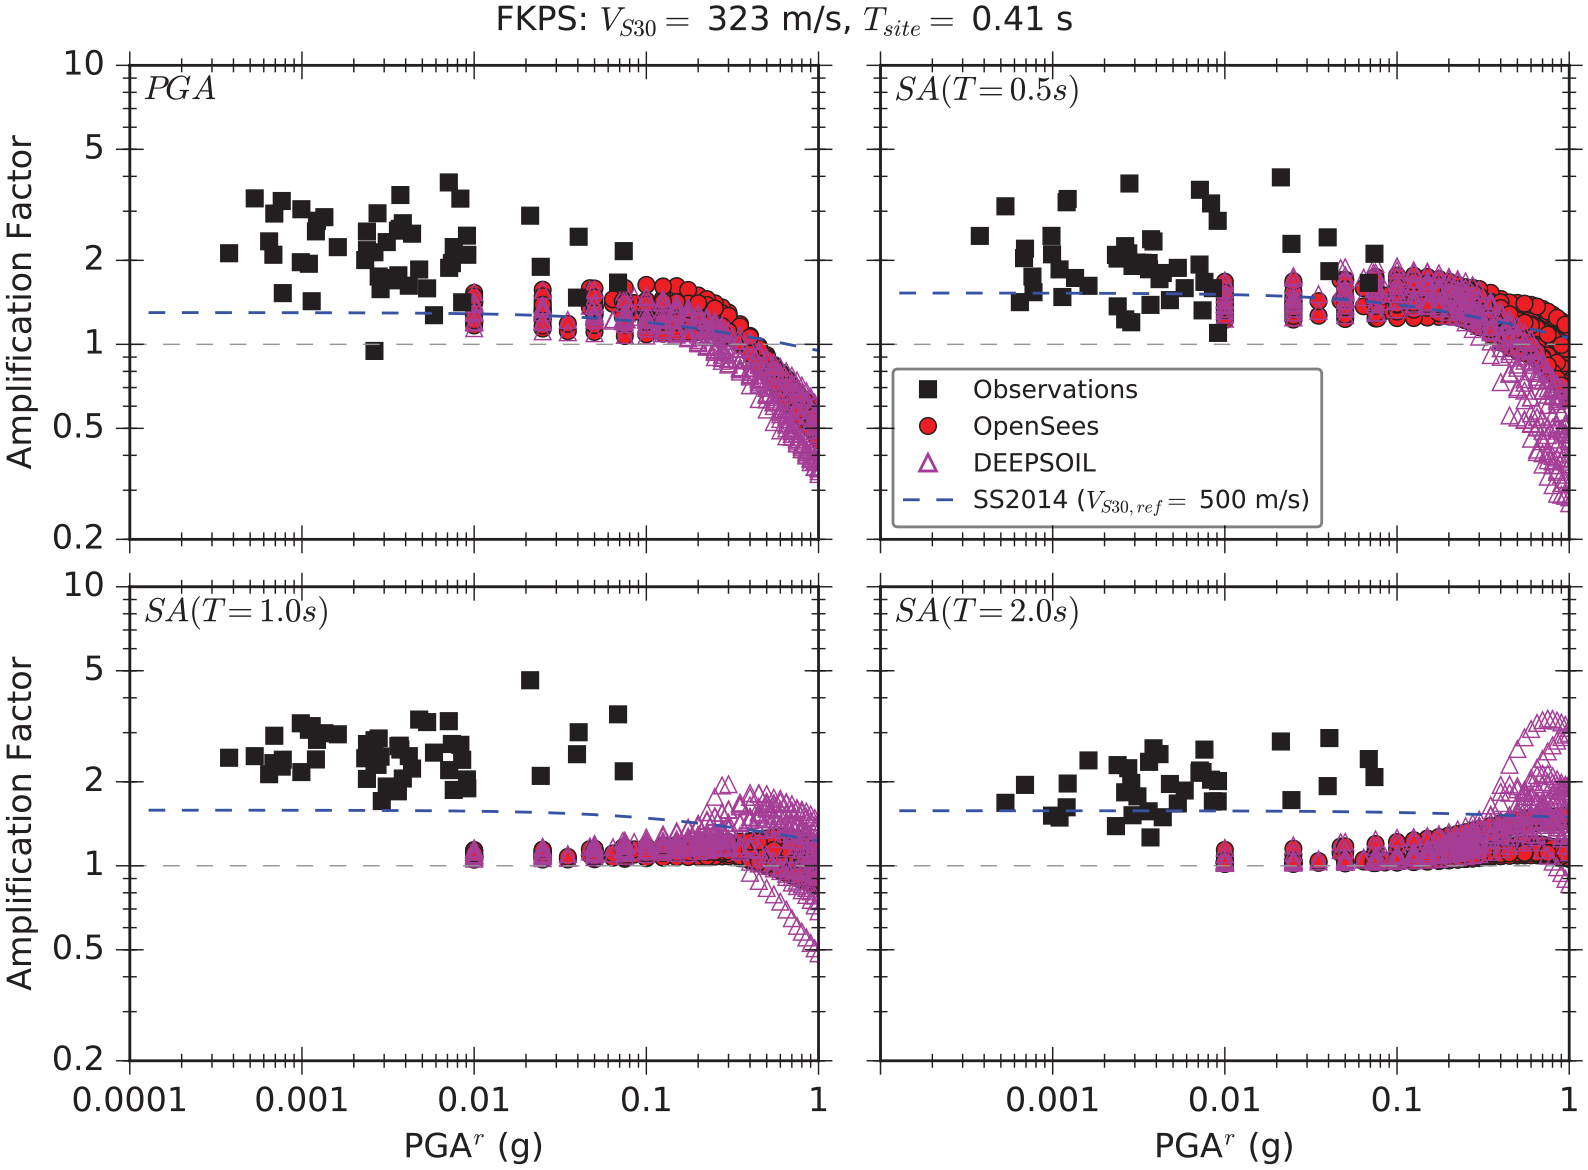
Figure 11 shows that, for FKPS, there is little effect from soil nonlinearity in observations, as the observed amplification factors are fairly constant with increasing
At PIPS (Figure 12), there is a noticeable decrease in amplification factors for observations of the three largest events at short periods (most noticeable at
For several sites, the 1D amplification factors at short periods provide a lower-bound estimate of the observed amplification factors calculated using POTS as a reference (e.g. PIPS, Figure 12). This is likely due to 3D basin amplification effects, and deeper impedance contrasts (e.g. soil to bedrock) that are not captured in the 1D profiles of shallow near-surface deposits (i.e. above 500 m/s), and are not present in the POTS recordings. In addition, as discussed in the “Assessment of reference stations” section, the site response at POTS may be more representative of a stiffer site than the assumed value of
The empirical
Parameterization of observed amplification factors
Further analysis of observed amplification factors was performed for all 43 sites to quantify the effects of nonlinearity as a function of ground motion intensity at various periods. Figure 13 demonstrates this relationship for nine periods at the site WNAS, where some of the strongest effects of soil nonlinearity were instrumentally observed. As seen in Figure 13, the maximum PGA recorded at POTS (i.e.
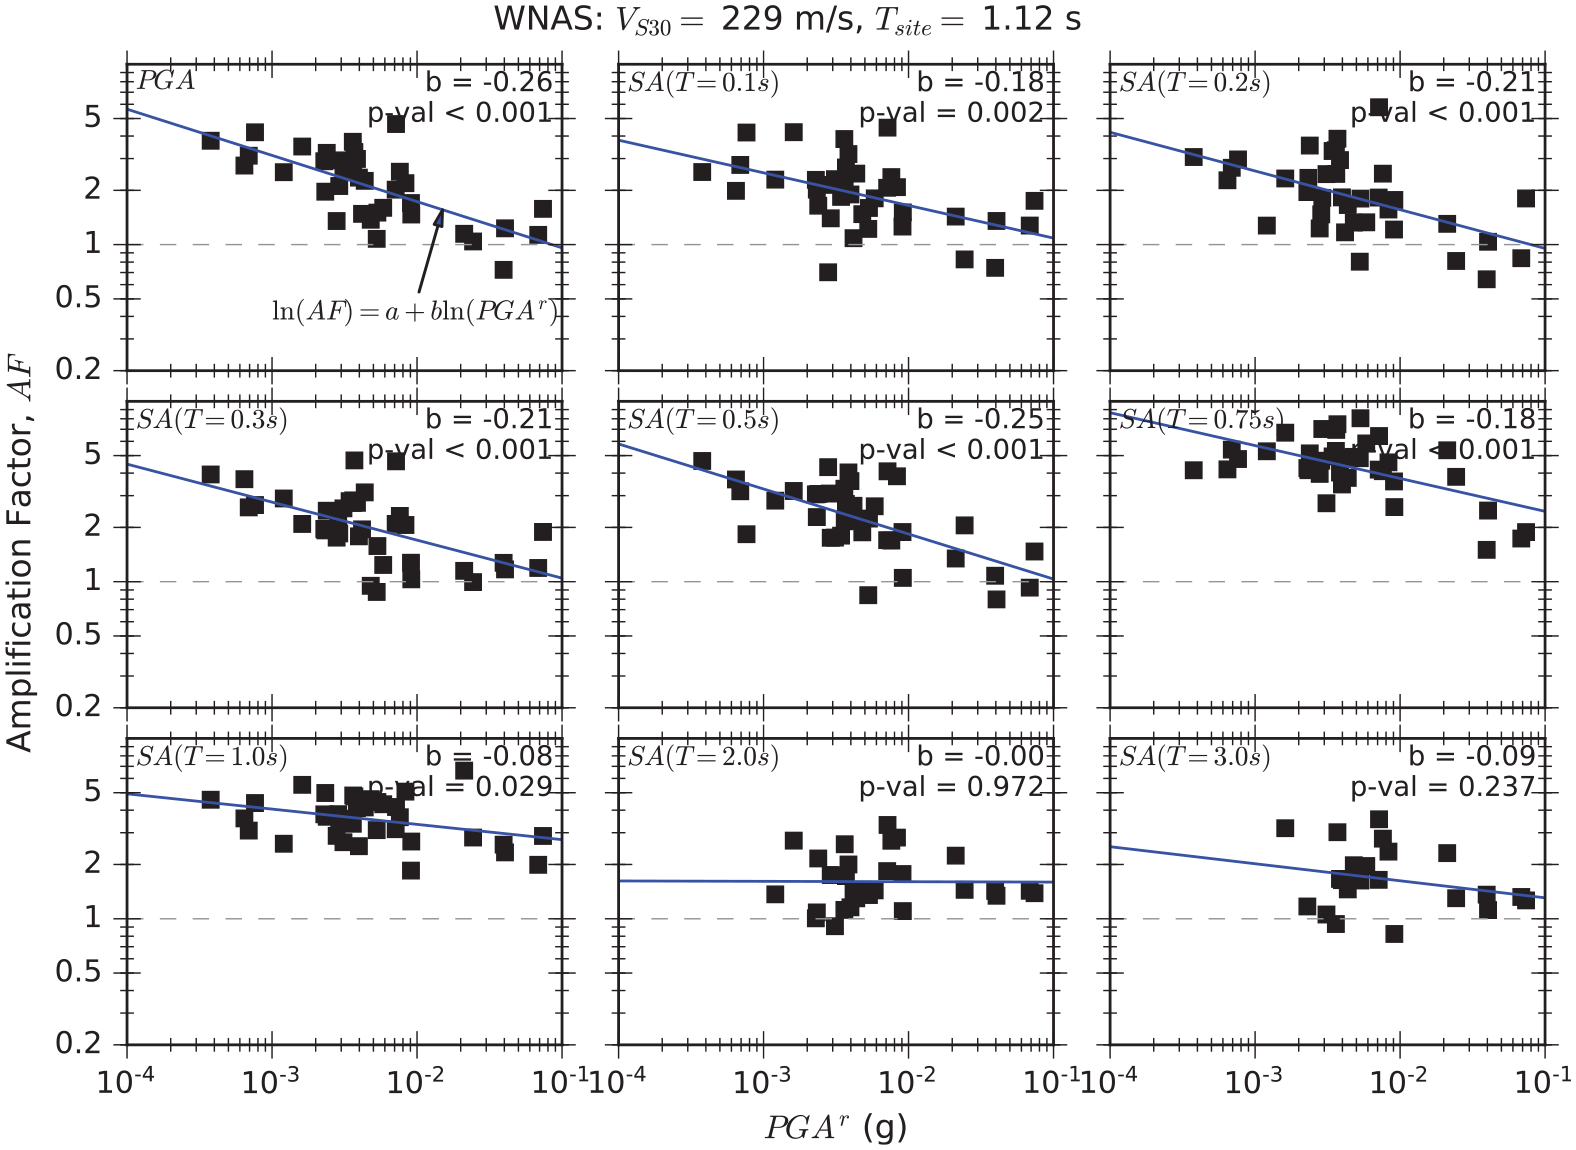
Example parameterization of observed amplification factors as a function of reference motion intensity
Given that the slopes (i.e.
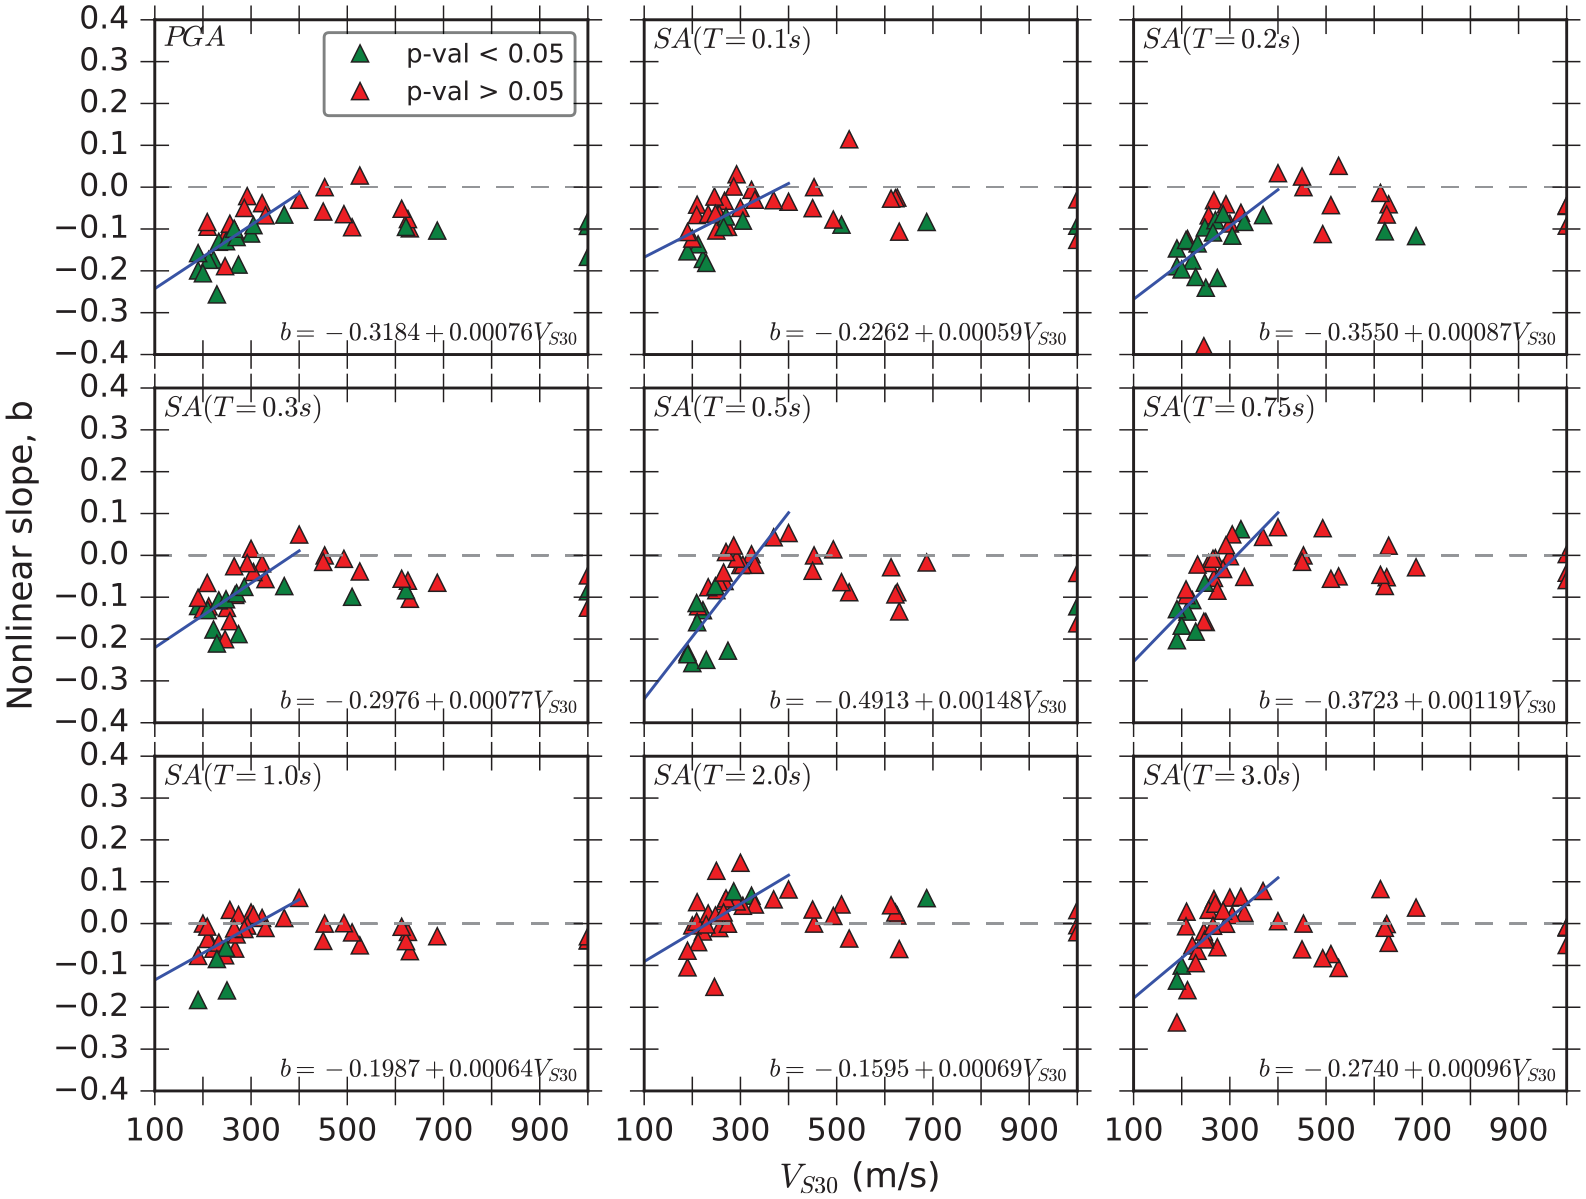
Nonlinear slope b (see Figure 13 for the definition of b) plotted versus
Maximum shear strains
One of the challenges in site-response modeling for large-strain motions, is developing constitutive models for which the behavior remains faithful to estimates of shear modulus degradation and damping (often lab-based), and soil shear strength. Even when constitutive models are capable of approximating both MRD curves simultaneously (e.g. Matasovic, 1995; Phillips and Hashash, 2008), typical curves (e.g. Darendeli, 2001) are only well constrained up to shear strains of approximately 0.3%. As discussed in Yee et al. (2013), when these MRD curves are extrapolated to large shear strains, they can significantly underestimate soil shear strength (i.e. the maximum shear stress that can develop in the soil). Hybrid models have been developed to honor published MRD curves at small strains and transition to strength-based hyperbolic backbone curves at large strain (e.g. Groholski et al., 2016,; implemented in DEEPSOIL).
A potential problem with using backbone curves based on typical MRD curves, which can greatly underestimate soil shear strength at large strains, is that under strong shaking the soil will fail and generate excessively large shear strains too early (i.e. at an unrealistically low shear stress; Zalachoris and Rathje, 2015). These unrealistically large shear strains may result in excessive softening and damping of the profile. The maximum value of shear strain throughout the soil profile for all sites and analyses are plotted versus
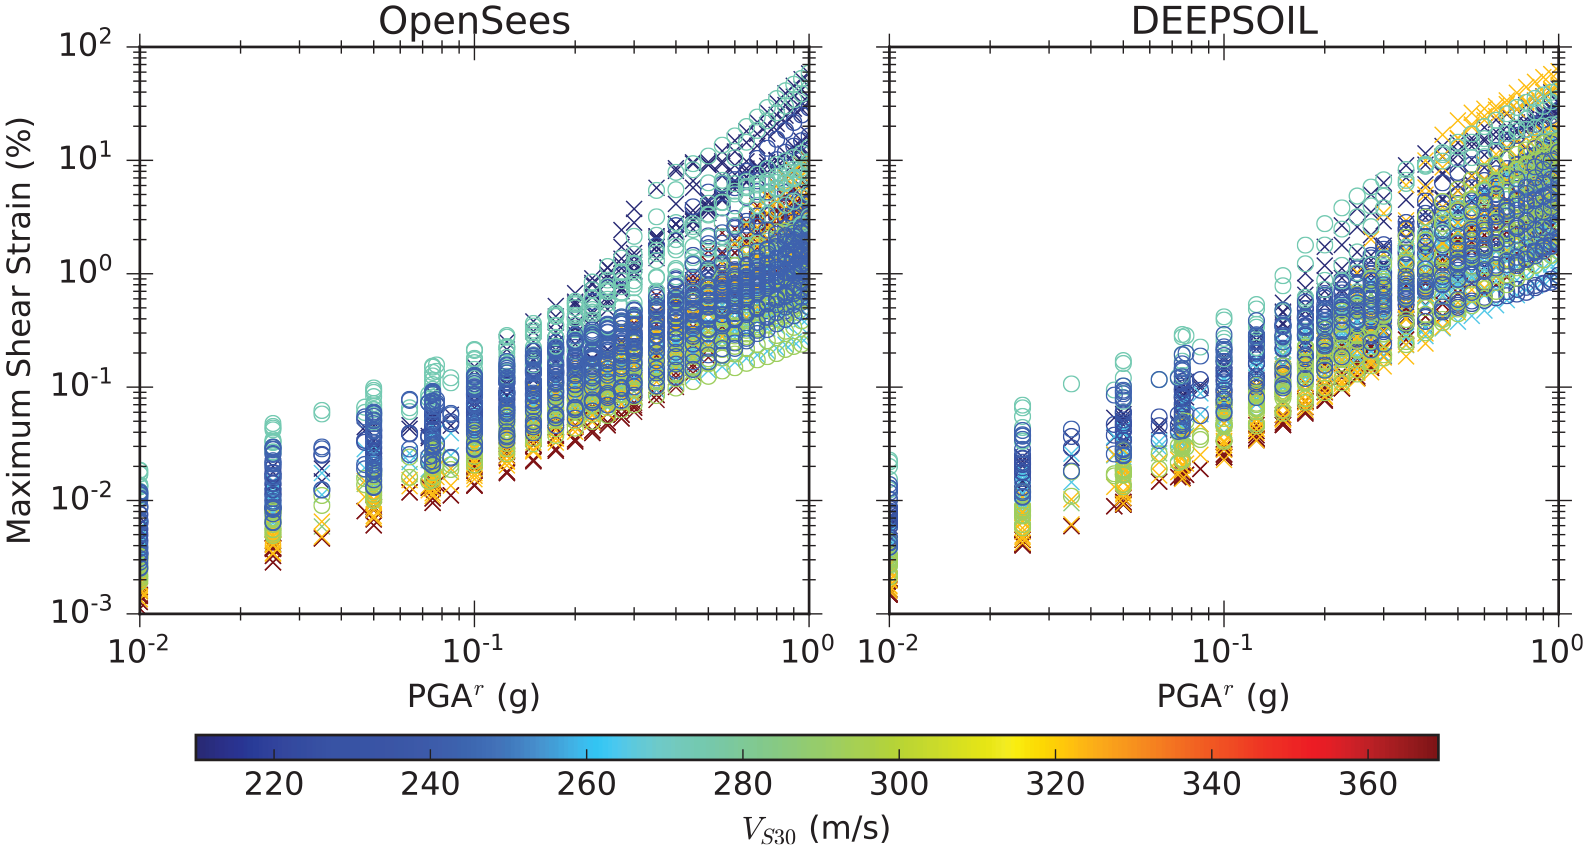
Maximum shear strains throughout the soil profile versus
Figure 15 shows that, in general, peak shear strain increases with decreasing
Whether these extreme levels of maximum shear strains (1%–10%, and especially
Modification of observed linear site response using nonlinear adjustment factors from simulations
The results of nonlinear site-response analyses are used nonparametrically to adjust the observed linear site response as outlined in the “Combining nonlinear adjustment factors with observed amplification factors section.” Examples of the procedure and final output are shown in Figure 16 for sites FKPS (representative of stiff sites) and PIPS (representative of soft sites). The figures show results from OpenSees, DEEPSOIL, and the average of the two on three different subplots. As shown subsequently in Figure 17, the behavior at these two example sites is generally representative of the behavior of other stiff
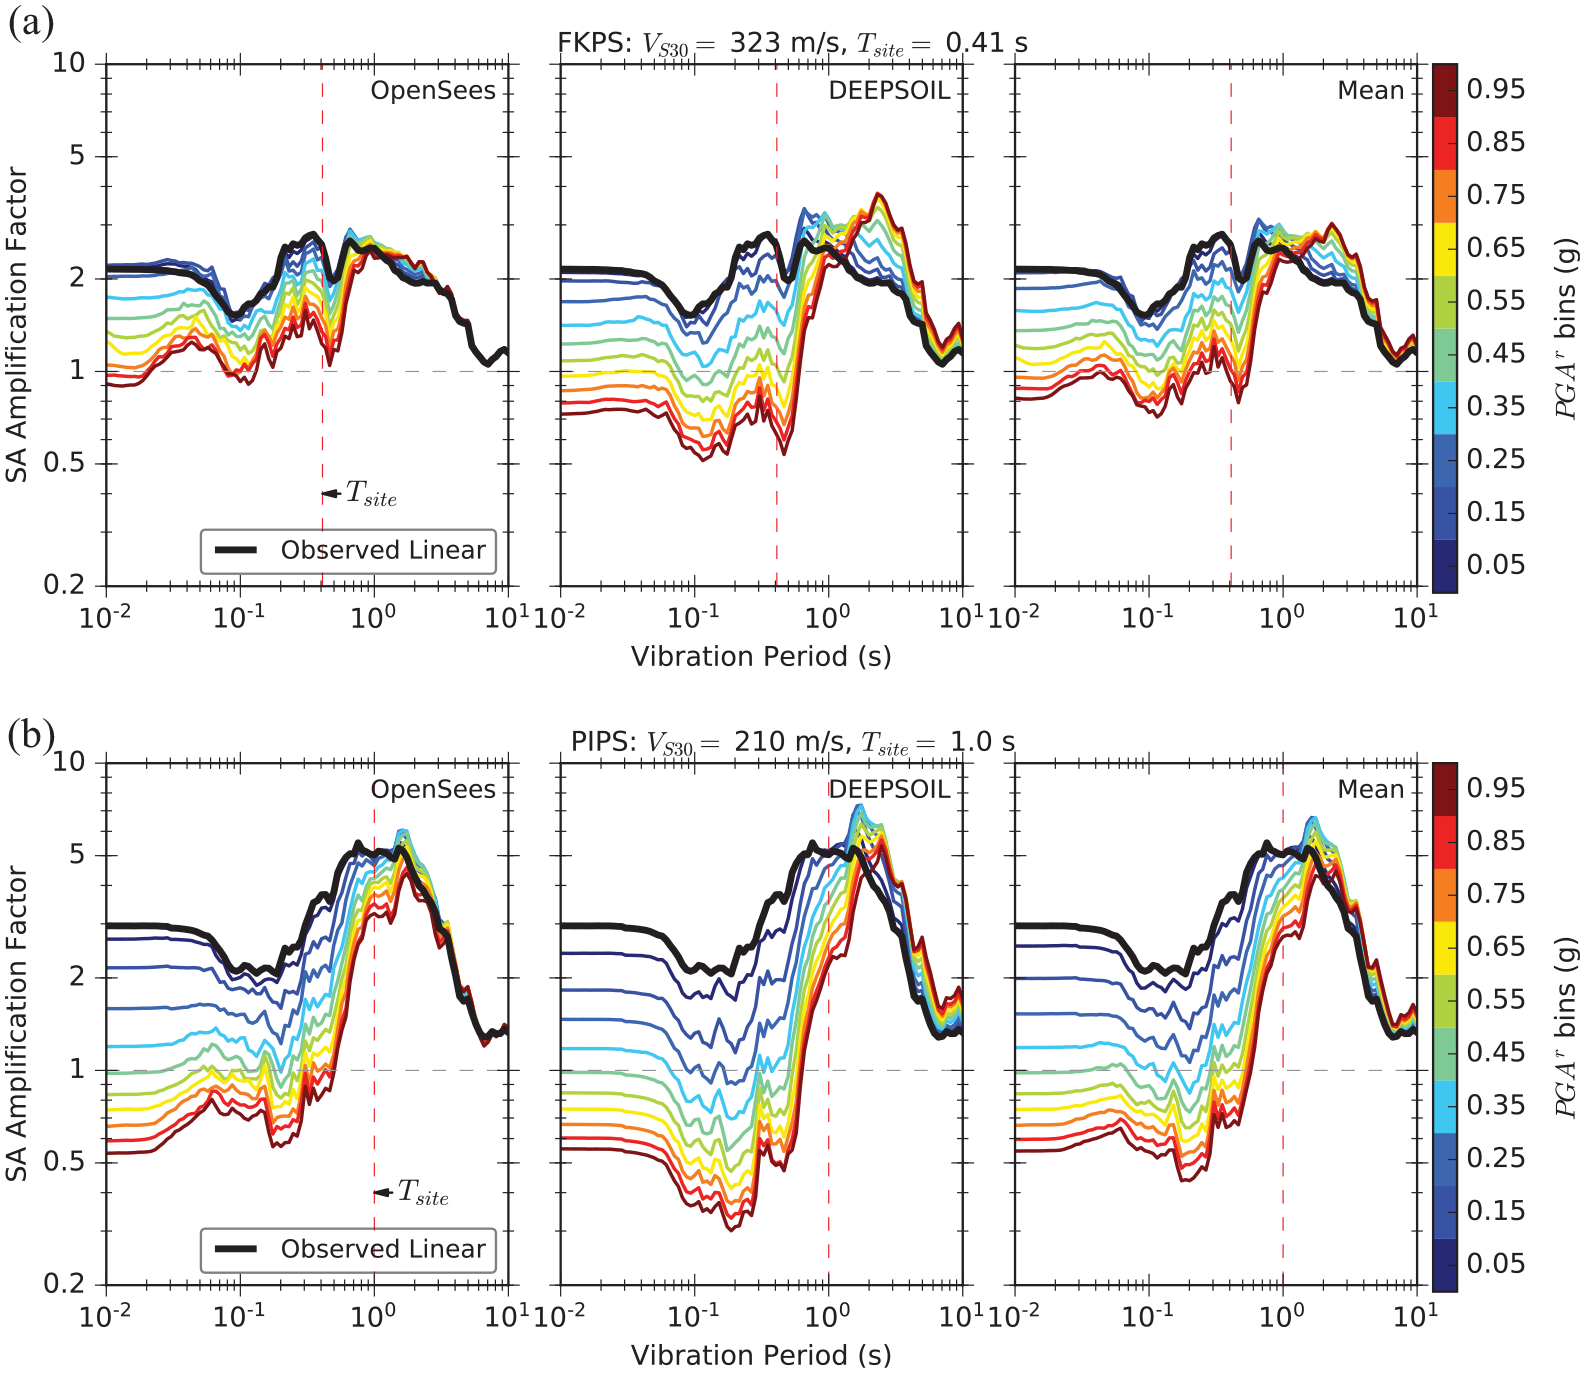
Spectral acceleration basin/site amplification factors computed by applying nonlinear adjustment factors from 1D site-response analyses to observed elastic basin amplification. Example results are presented for (a) a relatively stiff site (FKPS) and (b) relatively soft site (PIPS) with more severe nonlinearity. Results from OpenSees and DEEPSOIL analyses are plotted separately in addition to the average between the two codes. (a) Modified site amplification factors for a stiff site (FKPS). (b) Modified site amplification factors for a soft site (PIPS).
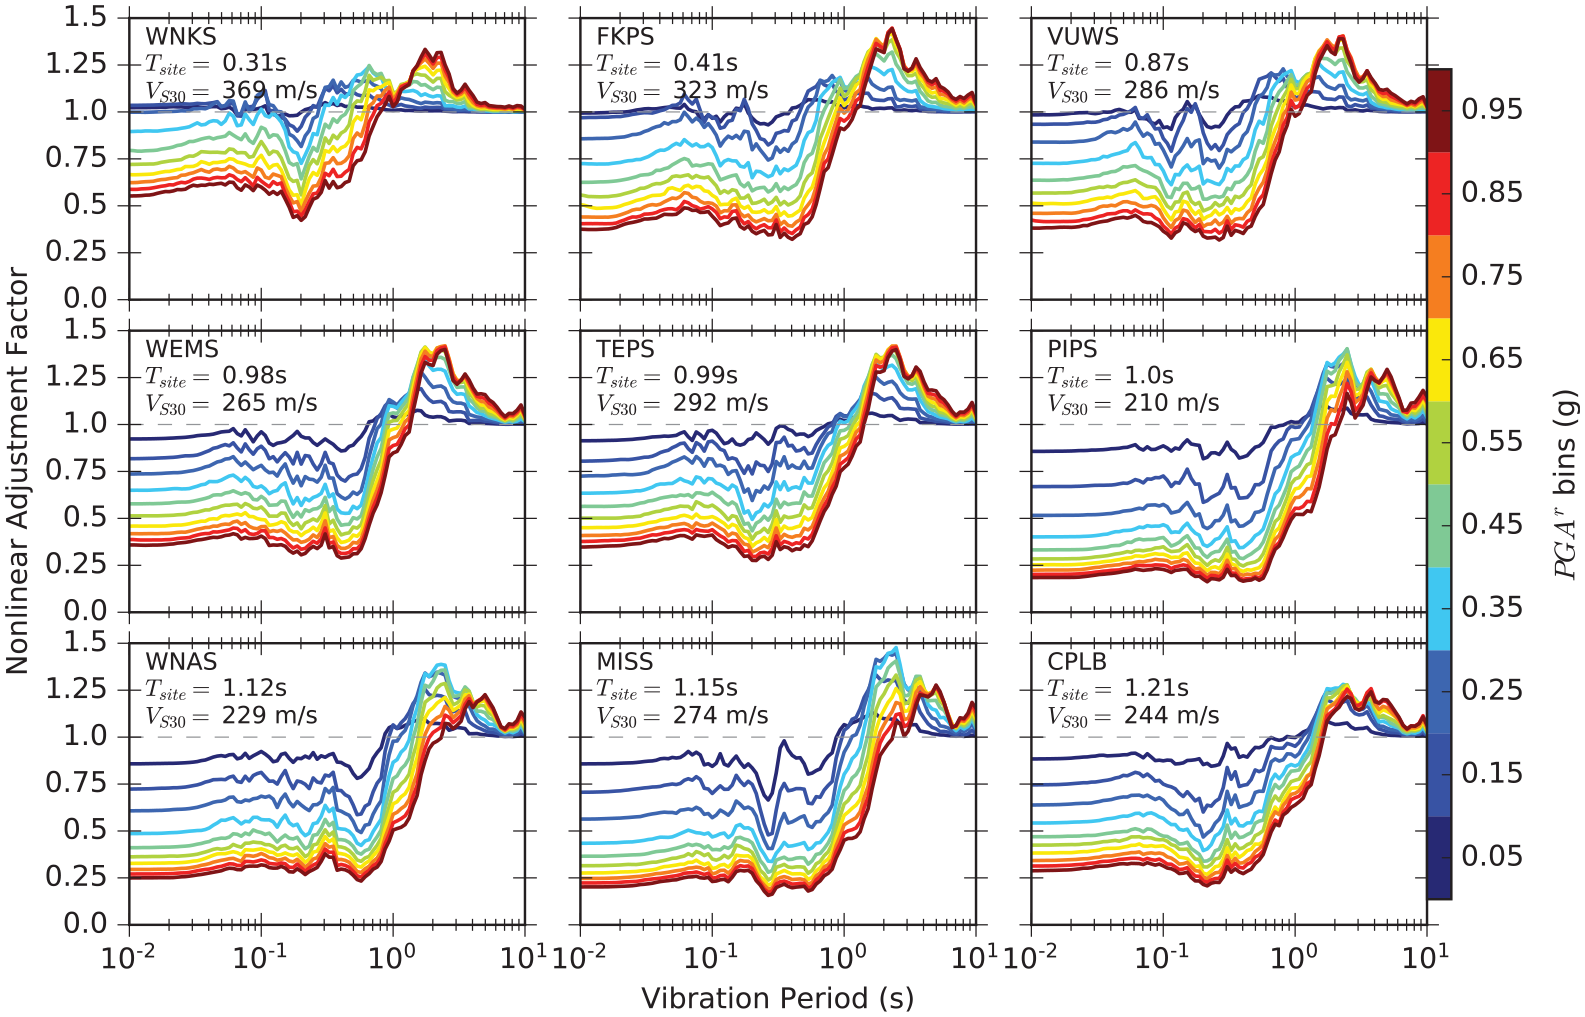
Nonlinear adjustment factors from 1D site-response analyses versus vibration period for all sites. The results presented here are the mean between OpenSees and DEEPSOIL analyses. Subplots are ordered by increasing
For FKPS (Figure 16a), a substantial reduction in basin amplification factors, relative to the expected linear amplification, is realized up to vibration periods of about 1 s as ground-motion intensity increases. For longer periods, significant additional amplification can occur, as discussed in the previous sections. This is likely due to softening of the soil profile, resulting in elongation of the soil-profile site period and amplification of long-period energy.
For softer sites, such as PIPS (Figure 16b), severe deamplification occurs at short periods for the highest
From Figure 17, it is evident that stiffer sites with
Softer sites with
Now, the adjustment factors plotted in Figure 17 are applied to the observed linear amplification factors for all nine sites in Figure 18. These results represent the mean between OpenSees and DEEPSOIL analyses. For comparison, the median GMM predictions (from weak motions) with one lognormal standard deviation
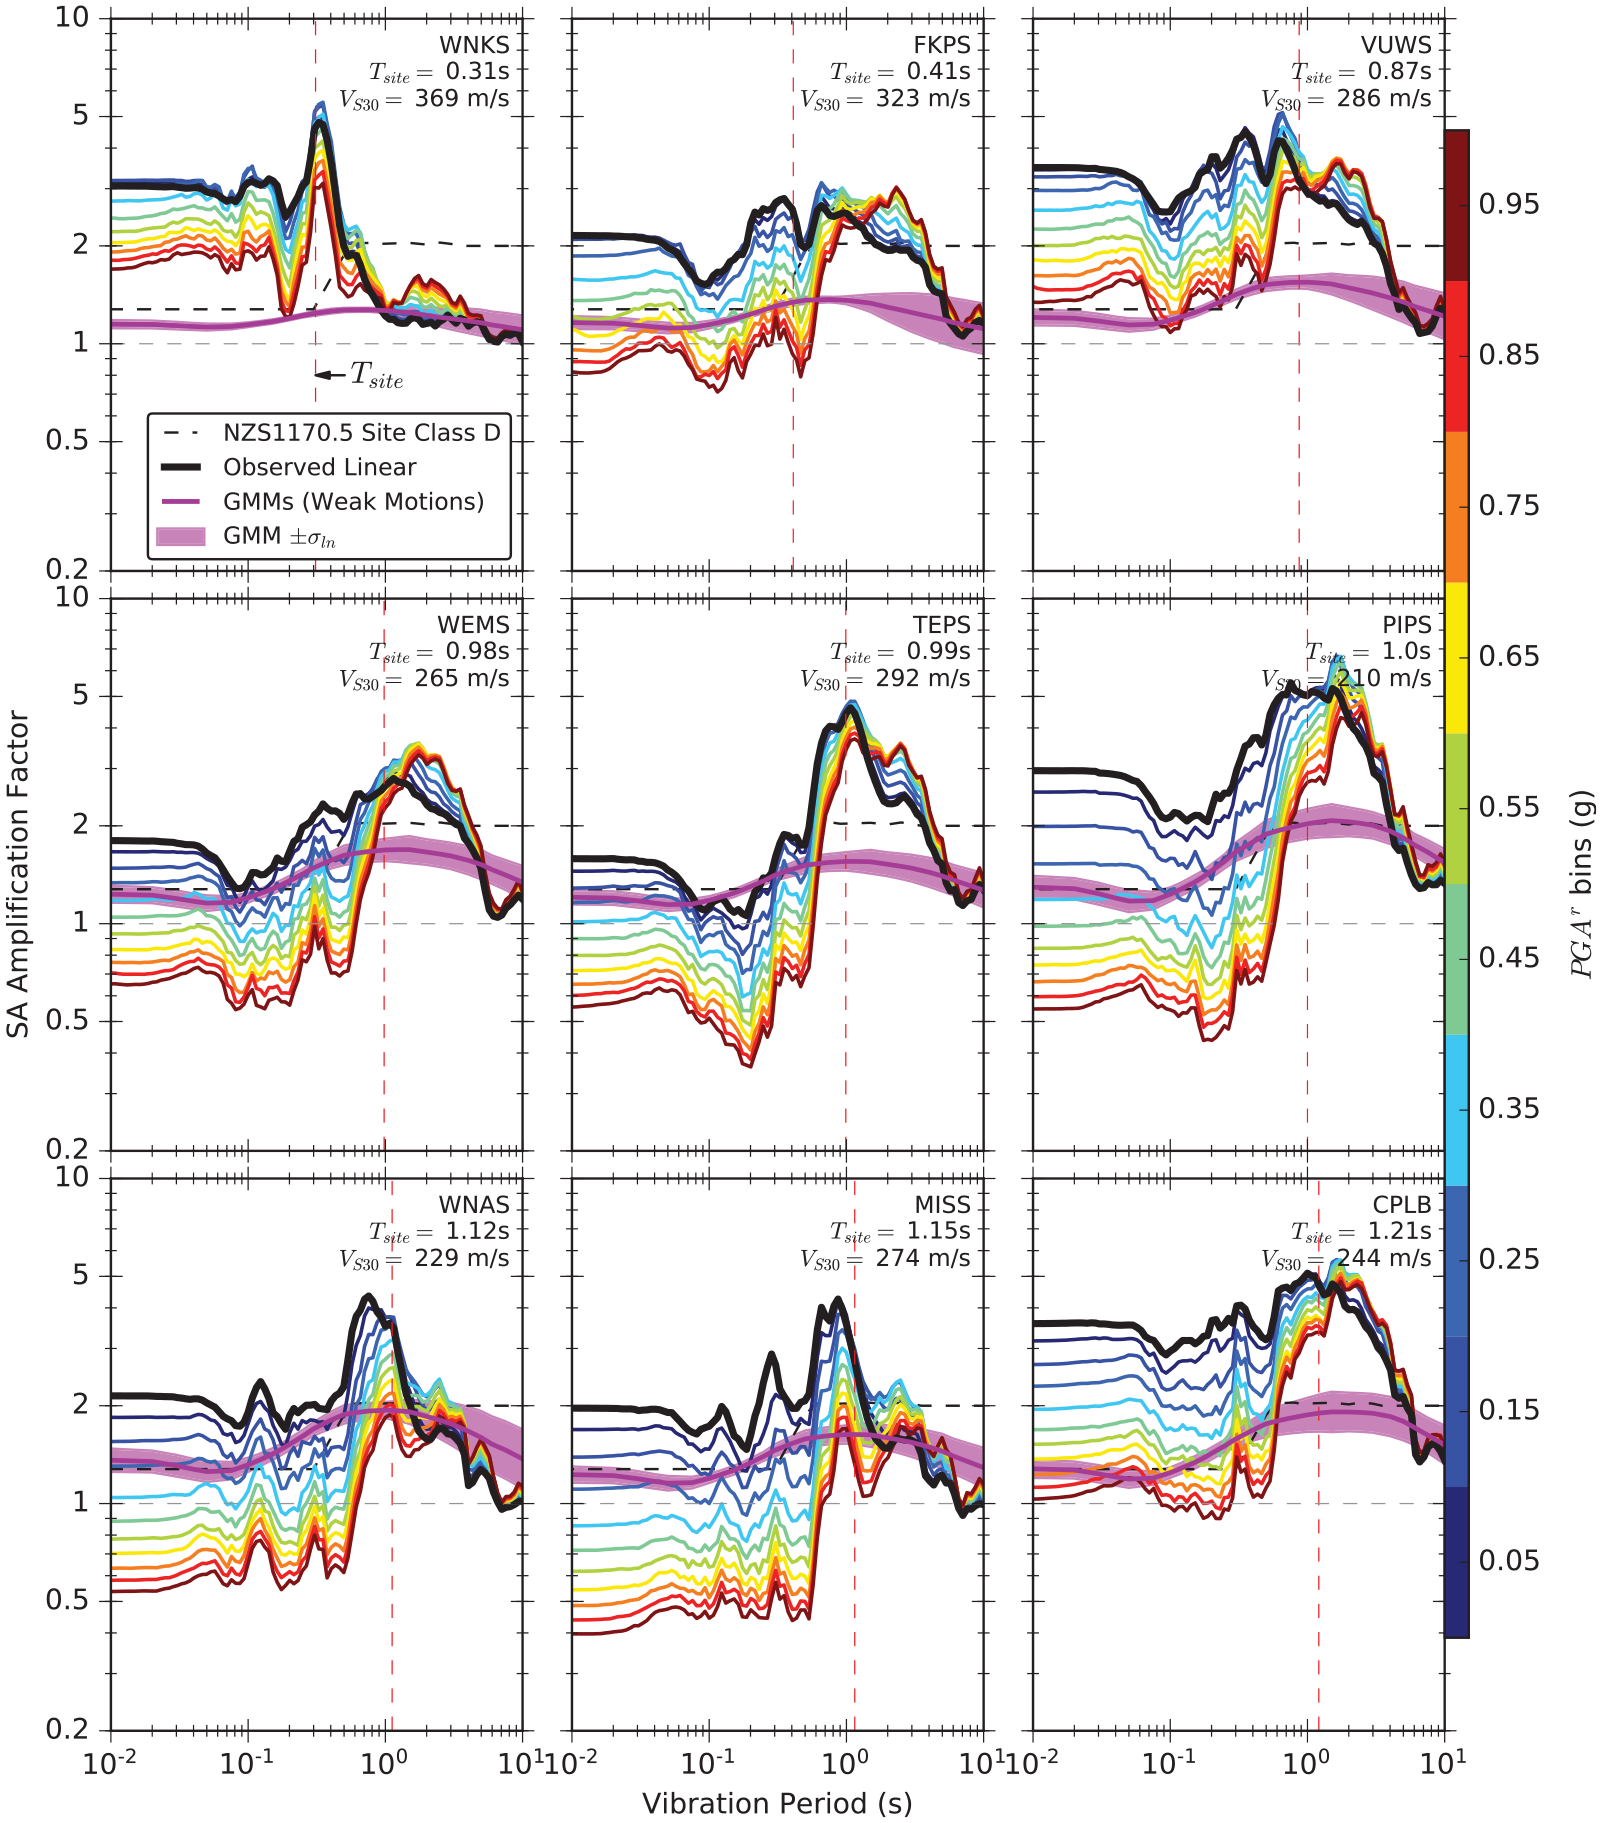
Spectral acceleration basin/site amplification factors computed by applying nonlinear adjustment factors from 1D site-response analyses to the estimated observed linear basin amplification for all sites. The results presented here are the mean between OpenSees and DEEPSOIL analyses. Geometric mean amplification factors predicted by empirical GMMs for the weak ground-motion database are also included.
Conclusion
The main objective of this study was to determine the appropriateness of using site/basin amplification factors derived from weak ground-motion observations, particularly at long periods, for strong design-level ground motions. Sites over sedimentary basins can display significant amplification at long periods under weak-ground motions, which, in many circumstances, greatly exceeds the site amplification suggested by the current New Zealand building code for Site Class D sites. Given that the soil generally remains elastic under these weak ground motions, an obvious question that arises is whether these large amplification factors should be used in combination with strong ground motions, for which soil nonlinearity is expected.
A database of weak ground motions, recorded at sites in sedimentary basins of the Wellington, New Zealand region, is used to quantify the influence of site and basin effects on the ground shaking. Given the lack of strong ground motion observations in this region, sophisticated nonlinear site-response analyses were performed with scaled input motions to understand how site amplification factors vary with increasing ground motion intensity for a range of soil conditions. A subset of nine strong motion stations with good geophysical and geotechnical site characterization data was used for these nonlinear analyses. The approach adopted here is similar to that developed in Stewart et al. (2017), albeit, we used: (1) a reference site to estimate the observed amplification as opposed to an empirical GMM and a site random effect term, and (2) a non-parameterized method as opposed to parameterization of the site amplification model from the empirical GMM.
Clear trends of increasing site/basin amplification at long periods are observed in recorded ground motions with increasing basin depth and decreasing soil stiffness. These trends in basin depth and soil stiffness correlate well with site period estimates from strong motion stations and temporary station HVSR measurements, suggesting that site period has good predictive capabilities for site response.
Results of the nonlinear analyses suggest that, for soft sites in sedimentary basins, some reduction in SA site amplification factors at intermediate-to-long periods (i.e. 0.5–2 s) can be expected for strong ground motions due to soil nonlinearity. As an example, for the soft site PIPS (Figure 16b), the amplification factor at
The results of this study show that “linear” site/basin amplification factors derived from weak ground motions should be used with discretion for strong design-level ground motions, even when considering long period amplification. We provide a method for combining such observations with site-specific nonlinear site-response analyses to develop adjustment factors to these linear-range basin terms. Given the increasing availability of seismometer or strong motion stations across many seismically active regions (including New Zealand), and the increasing use of site-specific site-response modeling in hazard predictions, the proposed approach provides a useful means to estimate combined site/basin effects for design-level seismic hazard prediction.
Supplemental Material
sj-docx-1-eqs-10.1177_87552930231209726 – Supplemental material for Combining observed linear basin amplification factors with 1D nonlinear site-response analyses to predict site response for strong ground motions: Application to Wellington, New Zealand
Supplemental material, sj-docx-1-eqs-10.1177_87552930231209726 for Combining observed linear basin amplification factors with 1D nonlinear site-response analyses to predict site response for strong ground motions: Application to Wellington, New Zealand by Christopher A de la Torre, Brendon A Bradley, Felipe Kuncar, Robin L Lee, Liam M Wotherspoon and Anna E Kaiser in Earthquake Spectra
Footnotes
Acknowledgements
This is QuakeCoRE publication number 0761. All members of the NSHM ground-motion modeling and Wellington Basin subgroups are thankfully acknowledged for their input and participation throughout the duration of the project. The authors thank Gail Atkinson, Peter Stafford, and three anonymous reviewers for their reviews which provided useful feedback that significantly improved the paper.
Declaration of conflicting interests
The author(s) declared no potential conflicts of interest with respect to the research, authorship, and/or publication of this article.
Funding
The author(s) disclosed receipt of the following financial support for the research, authorship, and/or publication of this article: The authors would like to gratefully acknowledge the New Zealand National Seismic Hazard Model (NSHM) update program, the New Zealand Earthquake Commission (EQC), and QuakeCoRE, a New Zealand Tertiary Education Commission-funded Centre, for funding this work.
Data and resources
Supplemental material
Supplemental material for this article is available online.
References
Supplementary Material
Please find the following supplemental material available below.
For Open Access articles published under a Creative Commons License, all supplemental material carries the same license as the article it is associated with.
For non-Open Access articles published, all supplemental material carries a non-exclusive license, and permission requests for re-use of supplemental material or any part of supplemental material shall be sent directly to the copyright owner as specified in the copyright notice associated with the article.