
Abstract
The United States Geological Survey (USGS) National Seismic Hazard Model (NSHM) is the scientific foundation of seismic design regulations in the United States and is regularly updated to consider the best available science and data. The 2018 update of the conterminous US NSHM includes major changes to the underlying ground motion models (GMMs). Most of the changes are motivated by the new multi-period response spectra requirements of seismic design regulations that use hazard results for 22 spectral periods and 8 site classes. In the central and eastern United States (CEUS), the 2018 NSHM incorporates 31 new GMMs for hard-rock site conditions
Keywords
Introduction
The National Seismic Hazard Model (NSHM), developed by the United States Geological Survey (USGS) for the United States and its territories, has long been the scientific foundation of seismic design regulations in the United States. Among other applications, in the past several decades these models have been used to compute design ground motions for the National Earthquake Hazard Reduction Program (NEHRP) Recommended Seismic Provisions for New Buildings and Other Structures (NEHRP Provisions, e.g. Building Seismic Safety Council (BSSC), 2015, 2020). For the conterminous United States (i.e. lower 48 states; CONUS), the 1996 USGS NSHM (Frankel et al., 1996) was the first model adopted by the NEHRP Provisions in 1997. This model was updated by Frankel et al. (2002) and adopted by the 2003 NEHRP Provisions. The previous two updates of the USGS NSHM for CONUS were in 2008 (Petersen et al., 2008) and 2014 (Petersen et al., 2014, 2015), which were adopted by the 2009 and 2015 NEHRP Provisions, respectively. From 2017 to 2019, the USGS updated the NSHM for CONUS to incorporate the latest available science and data, resulting in the 2018 NSHM, an overview of which is presented in Petersen et al. (2020). This latest update has been influenced by and accepted for adoption in the 2020 NEHRP Provisions (BSSC, 2020), as described below.
The USGS used the 2018 NSHM to perform probabilistic seismic hazard analyses (PSHAs) on a 0.05° by 0.05° grid spanning CONUS for the 2020 NEHRP Provisions. Two fundamental components of an NSHM are inputs to a PSHA: (1) seismic source models, including earthquake fault and background or smoothed seismicity models, which forecast the occurrence rates and magnitudes of potential seismic events and (2) ground motion models (GMMs), which provide estimates of the ground shaking for a given seismic event. Both PSHA inputs are updated in the 2018 NSHM as summarized by Petersen et al. (2020). This article focuses on the latter and further elaborates on the update of GMMs in the central and eastern United States (CEUS), including comparisons and implementation details that were not presented in Petersen et al. (2020). Selection of GMMs for the 2018 NSHM was not only influenced by the best available scientific modeling and seismic data, but also by the interests of earthquake engineers, which are summarized below.
The NEHRP Provisions specify procedures for computing design ground motions from USGS NSHMs. The BSSC Provisions Update Committee (PUC) develops these procedures, with funding for meetings from the Federal Emergency Management Agency (FEMA). Prior to the current update, the design ground motion maps of the NEHRP Provisions only required mean hazard values at three spectral periods (i.e. 0, 0.2, and 1 s) and one reference site condition (i.e. soft rock with a 760 m/s time-averaged shear-wave velocity from the surface to a depth of 30 m; hereafter
Project 17, a joint committee of BSSC-organized engineers and USGS researchers, was formed as part of the 2020 NEHRP Provisions update cycle to improve the procedures for development of the next generation of seismic design values (BSSC, 2019). One of the recommendations of Project 17 was to incorporate multi-period and multi-
The geology, tectonics, and earthquake potential represented in the NSHM source model is diverse, ranging from active tectonic regions and subduction zones in the western United States (WUS) to the stable continental regions in the CEUS. The NSHM requires GMMs that capture the propagation effects of each tectonic setting. It selects from the collection of all published GMMs, which represent various modeling choices (i.e. epistemic uncertainty), and weights them according to various criteria (Rezaeian et al., 2015). Similar to the 2008 and 2014 NSHMs, the GMMs used in the 2018 NSHM consist of four groups, those applicable to earthquakes in (1) stable continental regions of the CEUS, (2) the Cascadia subduction zone interface in the Pacific Northwest, (3) the Cascadia subduction zone intraslab setting, and (4) the active shallow crust of the WUS (including that of the Pacific Northwest). More categories may be added in the future to allow for improved regionalization. This article focuses on the first group. The GMMs for the other three groups in the WUS are discussed in Powers et al. (2021).
In the following, we first discuss updates to the USGS GMM selection criteria that stem from the recommendation of Project 17 to use multi-period response spectra. This article is the only 2018 NSHM publication where these updates are formally documented. Petersen et al. (2020a) presented only a summary of the CEUS GMM updates, which included comparisons of the 2018 weighted median GMMs to the 2014 NSHM and an overview of the aleatory variability (GMM standard deviation) and site-effect models. In this article, we discuss the CEUS GMM updates and implementation in the 2018 NSHM in detail. These updates consist of (1) 31 new GMMs, including the state-of-the-art Next Generation Attenuation relationships for central and eastern North America (NGA-East) (Goulet et al., 2018, 2017, 2021; Pacific Earthquake Engineering Research Center (PEER), 2015a), (2) an associated model of aleatory variability (based on Al Atik, 2015; Goulet et al., 2017; Stewart et al., 2019), and (3) a new site-effect model (for amplification or de-amplification) specific to the CEUS (Hashash et al., 2020; Stewart et al., 2020). In the following, we discuss the individual GMMs in terms of their medians, assigned weights, weighted averages, attenuations with distance (not discussed in Petersen et al., 2020), and epistemic uncertainty. We also elaborate on the aleatory variability and site-effect models and provide details on their implementation in the 2018 NSHM. Whenever possible, we compare each of these GMM components with those considered in prior NSHMs, specifically, the 2008 and 2014 NSHMs (Rezaeian et al., 2015), both of which are still in use for various engineering and risk assessment applications. Finally, we discuss the impact of the 2018 GMM updates on hazard relative to previous NSHMs for an assumed earthquake source model in the CEUS.
GMM selection criteria
GMMs (formerly referred to as attenuation relationships, or ground motion prediction equations, GMPEs) are models that describe the probability distribution of ground motion intensities in relation to parameters that represent the earthquake source, the seismic wave propagation path, and local site characteristics. A comprehensive model specifies the center, body, and range of this distribution (Budnitz et al., 1997). A typical GMM provides an equation for the median value of horizontal SA, assuming a lognormal distribution, and an equation for estimating its standard deviation (or aleatory variability). Most recent models provide the RotD50 component (Boore, 2010) of horizontal SA, which represents the 50th-percentile horizontal ground motion for all possible rotation angles and is independent of the orientation of the recording instrument. These equations are functions of spectral period, earthquake magnitude, source-to-site distance,
Background: the GMM selection criteria in the 2014 NSHM
As part of the 2014 NSHM update, the USGS formally introduced a set of 16 GMM selection criteria to vet available published GMMs and select those most appropriate for use in the NSHM (see p. 109–110 of Petersen et al., 2014, and p. S61–S62 of Rezaeian et al., 2015, for the full list of criteria). These criteria were designed to be general and flexible to accommodate the continued growth and evolution of GMMs. The criteria consisted of four categories: (1) general requirements, (2) database scope, (3) parameters and applicability range, and (4) functional form and modeling procedure. Two of these 16 criteria (items 1 and 10, shown below) were included specifically to ensure that the 2014 NSHM met minimum seismic design requirements. In particular, GMMs had to support hazard calculations at PGA, 0.2-, and 1-s spectral periods, and at a reference site condition of
Minimum requirements for spectral periods and site classes
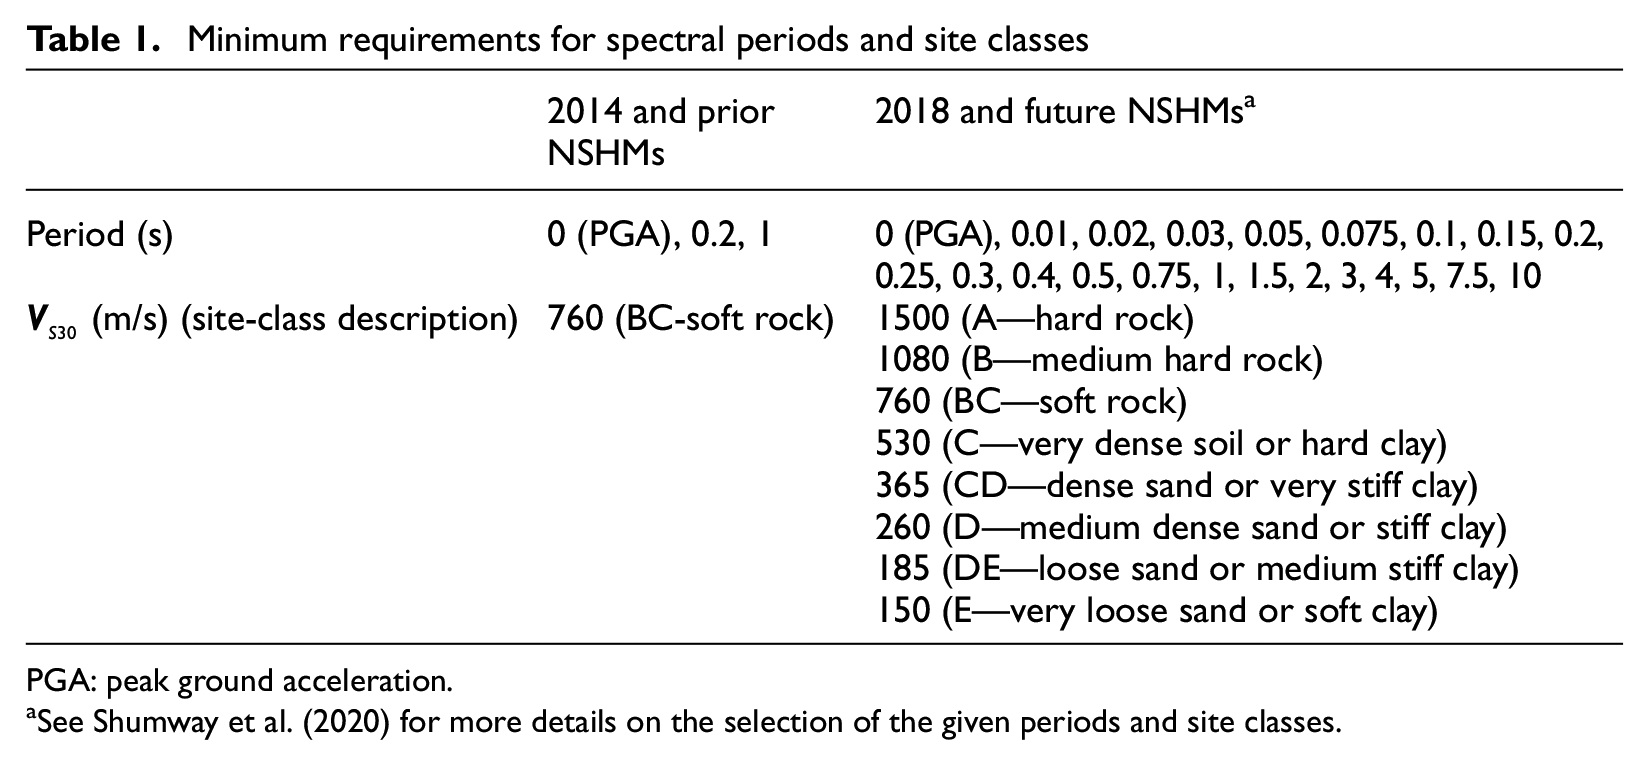
PGA: peak ground acceleration.
See Shumway et al. (2020) for more details on the selection of the given periods and site classes.
1. Basic Requirement (Petersen et al., 2014: 109–110)—The GMM must provide, as a minimum, equations for the median and aleatory uncertainty of the horizontal component for peak ground acceleration and spectral acceleration at 0.2- and 1-second spectral periods (5-hertz and 1-hertz frequencies). The GMM must be applicable to one of the tectonic regions relevant to the United States. 10. Site Condition Requirement (Petersen et al., 2014: 109–110)—GMMs must include a term for
Update: changes to the GMM selection criteria in the 2018 NSHM
Given the recommendation of Project 17 (BSSC, 2019) to use multi-period response spectra, the BSSC PUC and USGS have selected 22 periods and 8 1. Basic Requirement (2018)—The GMM must provide, as a minimum, equations for the median and aleatory variability of the horizontal component for peak ground acceleration (PGA) and spectral accelerations at periods from 0.01 to 10 seconds, specifically the 21 periods 0.01, 0.02, 0.03, 0.05, 0.075, 0.1, 0.15, 0.2, 0.25, 0.3, 0.4, 0.5, 0.75, 1, 1.5, 2, 3, 4, 5, 7.5, and 10 seconds. If equations are not provided for all 22 periods (including 0 seconds for PGA), the GMM must be reasonably extrapolated or interpolated to them. The GMM must be applicable to one of the tectonic regions relevant to the United States and its territories. 10. Site Condition Requirement (2018)—The GMM must include a term for
While it would be possible to select different suites of GMMs for different periods and site classes, our updated selection criteria above for the 2018 NSHM are designed to result in the same set of GMMs for all periods, in order to achieve a smooth spectral shape that has no discontinuities with respect to period. Furthermore, the selection criteria also maintain GMM consistency across all site classes. However, future research or observations may reveal that a GMM is not acceptable at a particular site class (e.g. site class E), but is necessary to represent epistemic uncertainty at other site classes. If such variation across periods and/or site classes is allowed in a future version of the NSHM, USGS GMM selection criteria would require revision.
CEUS GMMs in the 2014 NSHM
In the stable continental regions of the CEUS, USGS hazard models calculate ground shaking from earthquake sources up to a distance of 1000 km with moment magnitudes (hereafter “magnitude”) between 4.7 and 8.0. Therefore, CEUS GMMs must be applicable to this range of magnitudes and distances. Typical CEUS GMMs are relatively simple with only two input parameters, magnitude and distance, at any given spectral period. These models are not as well constrained as the WUS GMMs due to the lack of recorded data from large magnitude events at close distances in the CEUS. As a result, representation of uncertainties is extremely important and challenging. This is especially true for epistemic uncertainty, which is typically represented by logic tree branches and weights in PSHA and accounts for redundant models as well as missing models.
In the 2014 NSHM, the nine CEUS GMMs in Table 2 were incorporated (Rezaeian et al., 2015). To represent epistemic uncertainty in GMMs, logic tree weights were assigned based on model type (i.e. single-corner models, dynamic-corner models, hybrid models, reference-empirical models, and full-waveform simulation-based models) and categorization of near-source geometric spreading (i.e.
CEUS ground motion models in the 2014 NSHM. Parentheses for periods and site classes indicate the published range when a different range is supported in the USGS codes
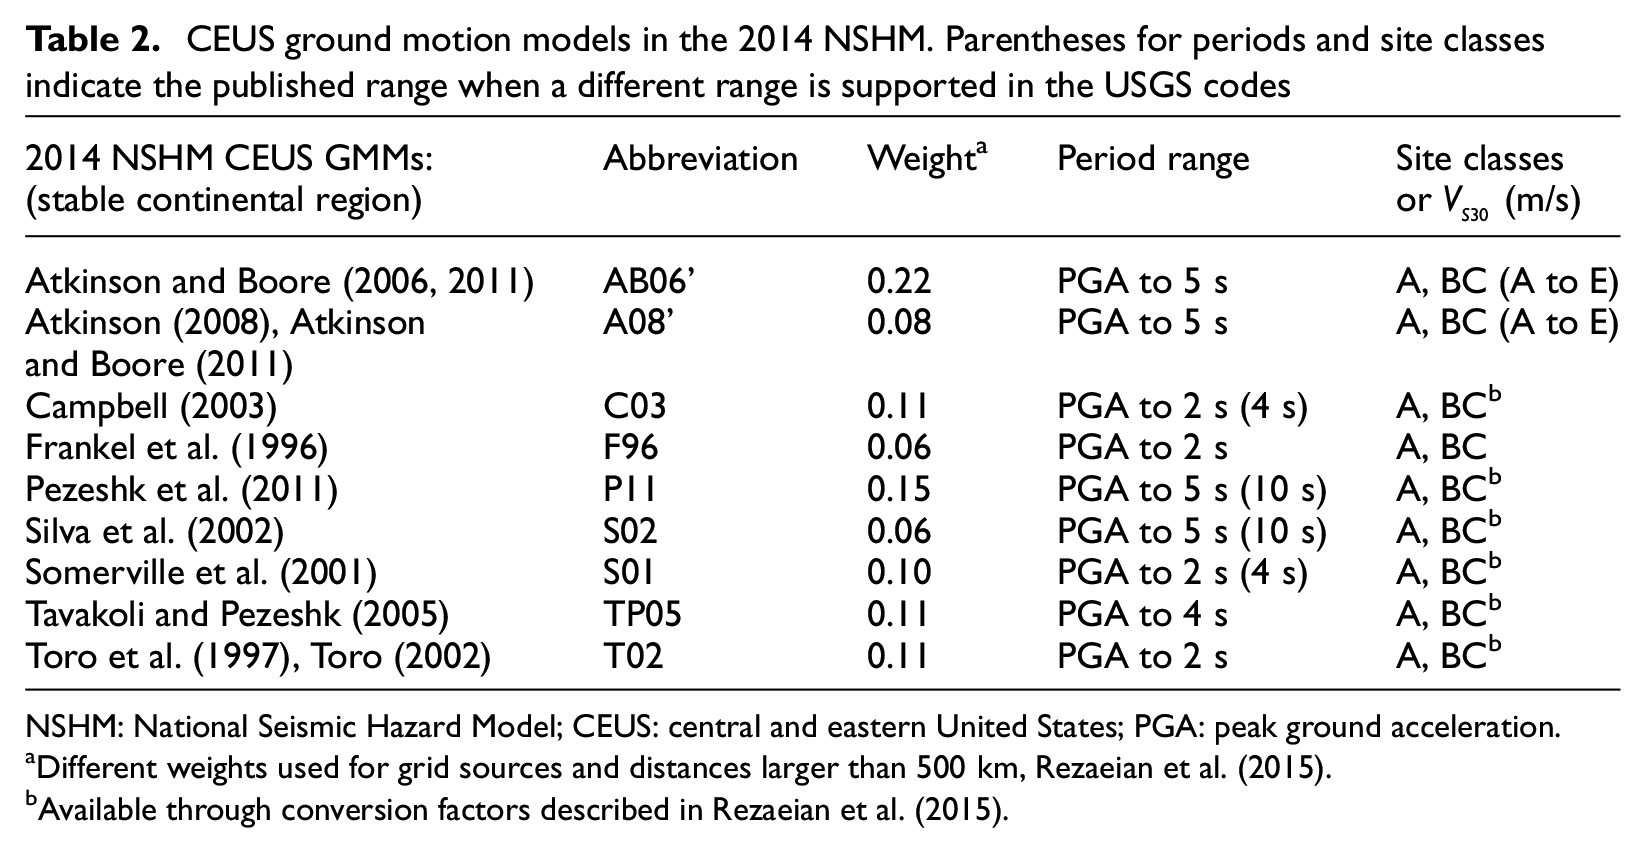
NSHM: National Seismic Hazard Model; CEUS: central and eastern United States; PGA: peak ground acceleration.
Different weights used for grid sources and distances larger than 500 km, Rezaeian et al. (2015).
Available through conversion factors described in Rezaeian et al. (2015).
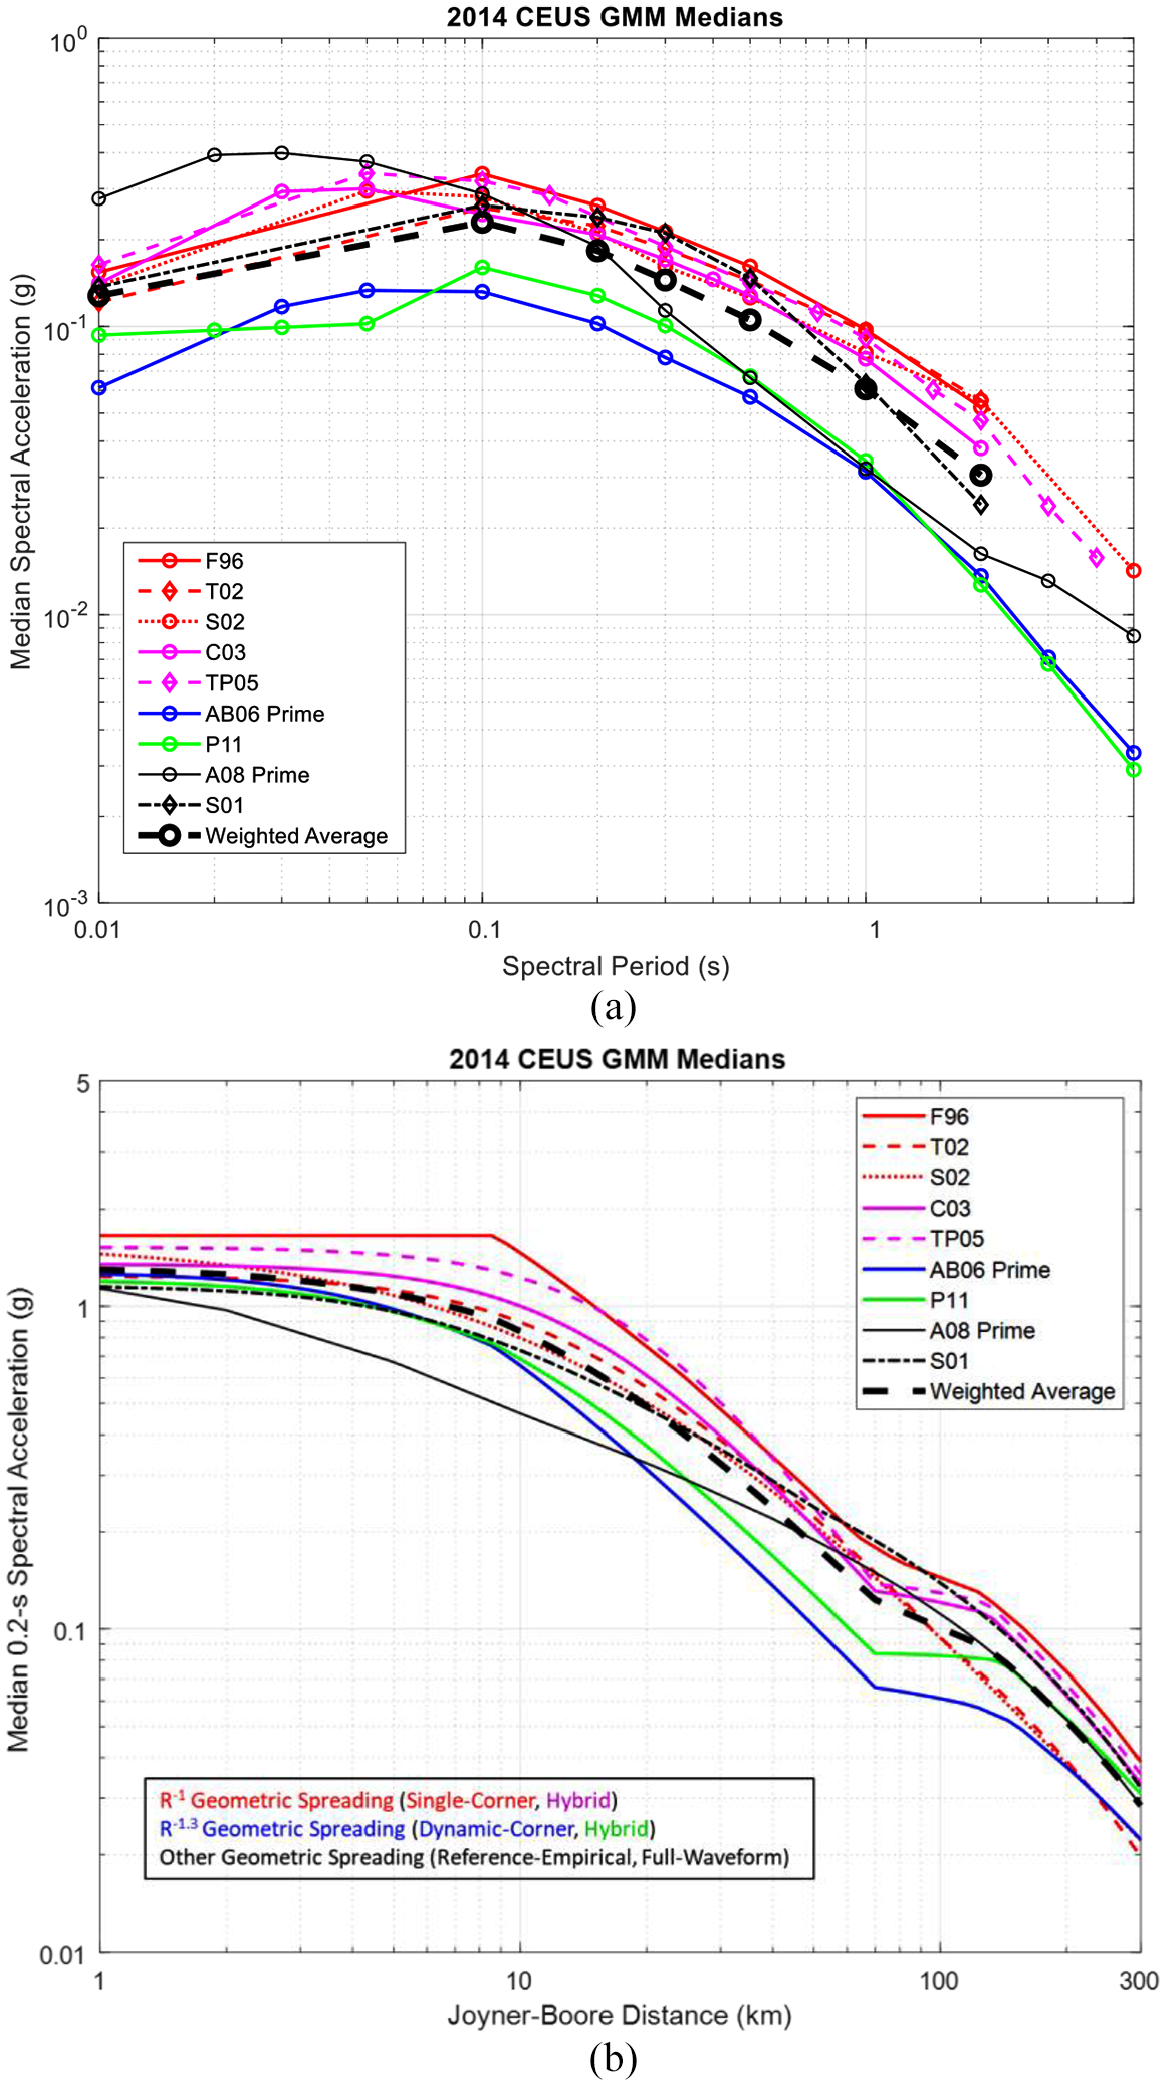
The nine 2014 NSHM GMMs in the CEUS for a magnitude 7 event on a very hard rock site: (a) median ground motions versus period at a distance of 50 km and (b) median ground motions versus distance at a 0.2-s spectral period. Model abbreviations and logic tree weights used to compute the weighted average are given in Table 2.
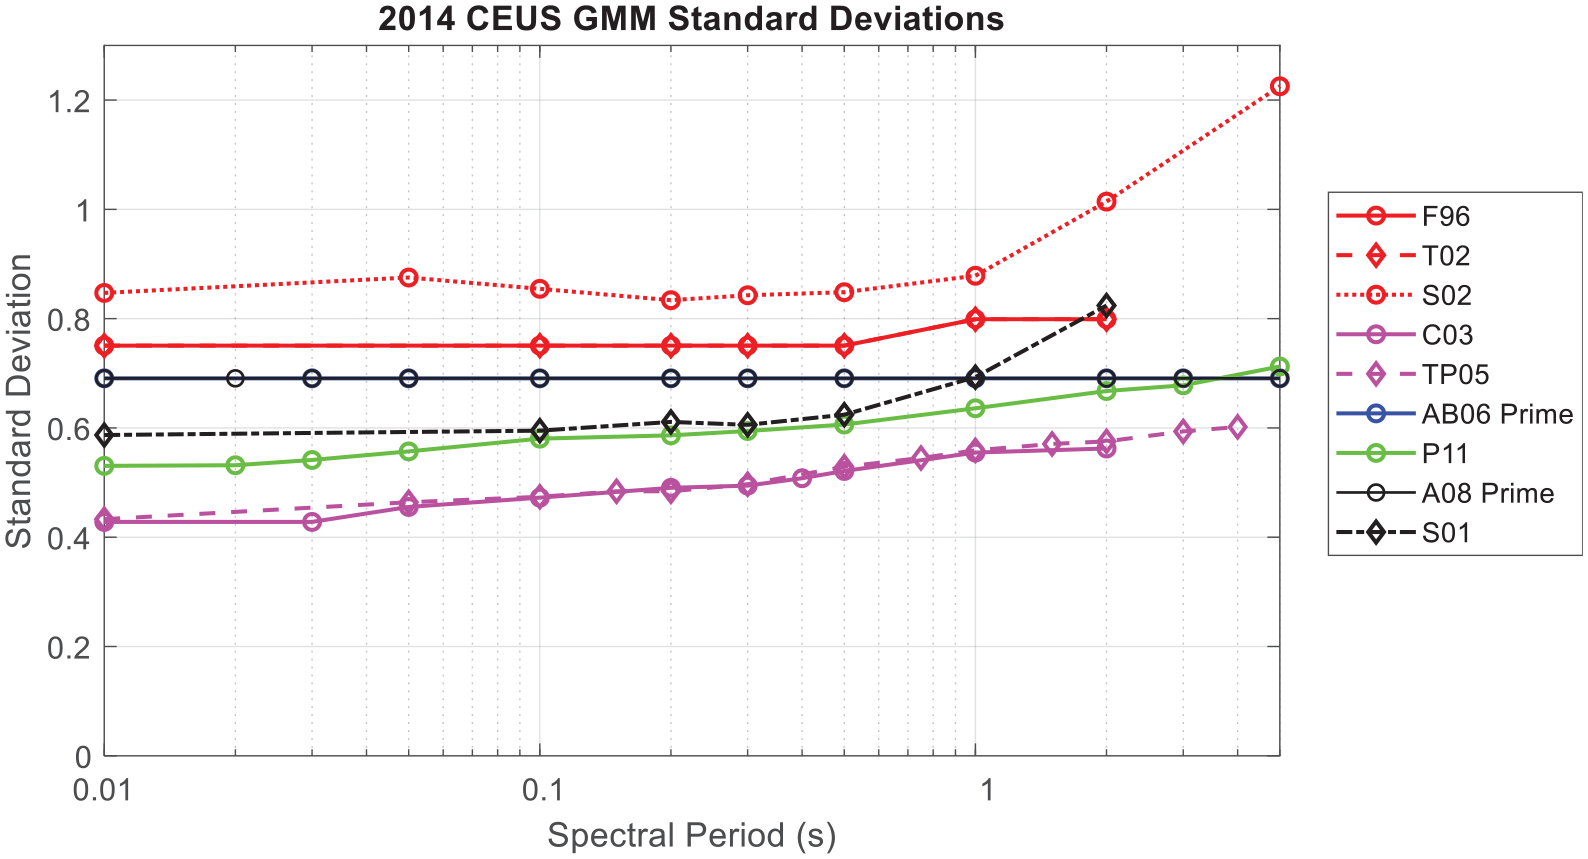
Standard deviations of the nine 2014 NSHM GMMs in the CEUS for a magnitude 7 event on a very hard rock site versus spectral period. Model abbreviations are given in Table 2.
Figure 1a shows the medians as a function of period at an example distance of 50 km. Although several of these GMMs were available beyond 2 s (Table 2), their validity was never examined by the USGS beyond this threshold (Shumway et al., 2018). Figure 1b shows the medians at a 0.2-s spectral period and demonstrates their attenuations with distance. The models are color coded to represent different geometric spreadings and model types. The two models with
Limitations of the 2014 CEUS GMMs in terms of period and
The 2014 NSHM GMMs in the CEUS are not applicable or adjustable through reasonable extrapolations for all periods and site conditions of interest in the 2018 NSHM. As an interim computation, Shumway et al. (2018) extended the 2014 NSHM hazard results to a subset of the 22 periods and 8 site classes shown in Table 1, namely, to 7 periods and 2 site classes in the CEUS. They were unable to provide the full suite because of the limited applicability of CEUS GMMs, shown with respect to period and site class in Table 2. Most of these GMMs are not available for spectral periods beyond 4 s and very few are available for site classes softer than BC. Furthermore, all nine GMMs listed in Table 2 were developed a decade, or more, ago. Considering their period and site class limitations, and the fact that new or updated GMMs have recently become available via NGA-East (Goulet et al., 2018, 2017, 2021; PEER, 2015a, 2015b; Youngs et al., 2021) and other modelers (e.g. Hashash et al., 2020; Stewart et al., 2020), all nine CEUS GMMs are replaced in the 2018 NSHM with new models that not only satisfy the Project 17 requirements of extended periods and site classes, but also better represent the epistemic uncertainty, as described in the following sections.
CEUS GMMS in the 2018 NSHM for very hard rock
In 2010, the PEER center initiated a multidisciplinary research project, NGA-East, to evaluate and improve ground motion characterization in central and eastern North America. The NGA-East project developed a uniformly processed database of empirical ground motion recordings and simulations (Goulet et al., 2014). The recorded ground motions were primarily from small magnitude events but included some moderate magnitude events. The simulations were developed for moderate to large magnitude events to supplement the recorded motions. The NGA-East database, available at the time of the 2014 NSHM development, aided in the GMM selection and logic tree weight assignments for that NSHM update through residual analyses (Rezaeian et al., 2015). PEER provided this database to a group of ground motion modelers to either update their previously published GMMs (Table 2) or to develop new GMMs. This resulted in a set of 20 new empirical- and/or simulation-based GMMs for the median (i.e. RotD50) component of horizontal ground motion (PEER, 2015b). These models were then adjusted by the NGA-East project team (PEER, 2015a) to be applicable to a uniform range of distances and spectral periods. These adjustments included extrapolations to small distances less than 10 km and large distances up to 1500 km, and spectral shape adjustments at high frequencies to ensure the GMMs are applicable to the entire range of PGA to 10 s. Of these 20 new adjusted GMMs, 19 GMMs 1 are referred to as the “adjusted seed” models because the NGA-East project then used them as input seed models in a process to develop GMMs representative of a continuous distribution of all possible GMMs (Goulet et al., 2018, 2017, 2021; Youngs et al., 2021). The goal of this process was to better and more objectively sample the ground motion distribution by accounting for redundancies in the seed models and capturing potentially missing models. NGA-East utilized the Sammon’s mapping process (Sherbaum et al., 2010) to project the input seed models onto a two-dimensional ground motion space in order to visualize the underlying epistemic uncertainty of GMMs. The space was then resampled to develop a manageable number of new, representative GMMs and associated period-dependent weights. These sampled models constitute the final 17 NGA-East GMMs (Goulet et al., 2018) and, as expected, provide a broader range and better representation of epistemic uncertainty.
As summarized in Petersen et al. (2020), the 2018 NSHM update uses two suites of CEUS GMM medians: (1) 14 updated seed GMMs with a collective weight of 0.333, which are an updated subset of the NGA-East adjusted seed models as described in the following section and (2) the 17 NGA-East GMMs with a collective weight of 0.667. These group weights, like all USGS NSHM logic trees, are based on a consensus-building process that assigns weights to a range of expert opinions. Table 3 and Figure 3 show these two main logic tree branches and their collective weights. The decision to update to NGA-East GMMs over the 2014 GMMs is also supported by the residual analysis of McNamara et al. (2019), which showed that the NGA-East GMMs provide a more accurate representation of the distribution (both median and standard deviation) of the observed instrumental ground motion data in stable tectonic environments than GMMs used in the 2014 NSHM. All the models in Table 3 and Figure 3 are applicable to the 22 periods requested by Project 17, but they are only valid for very hard-rock site conditions corresponding to
CEUS ground motion models in the 2018 NSHM
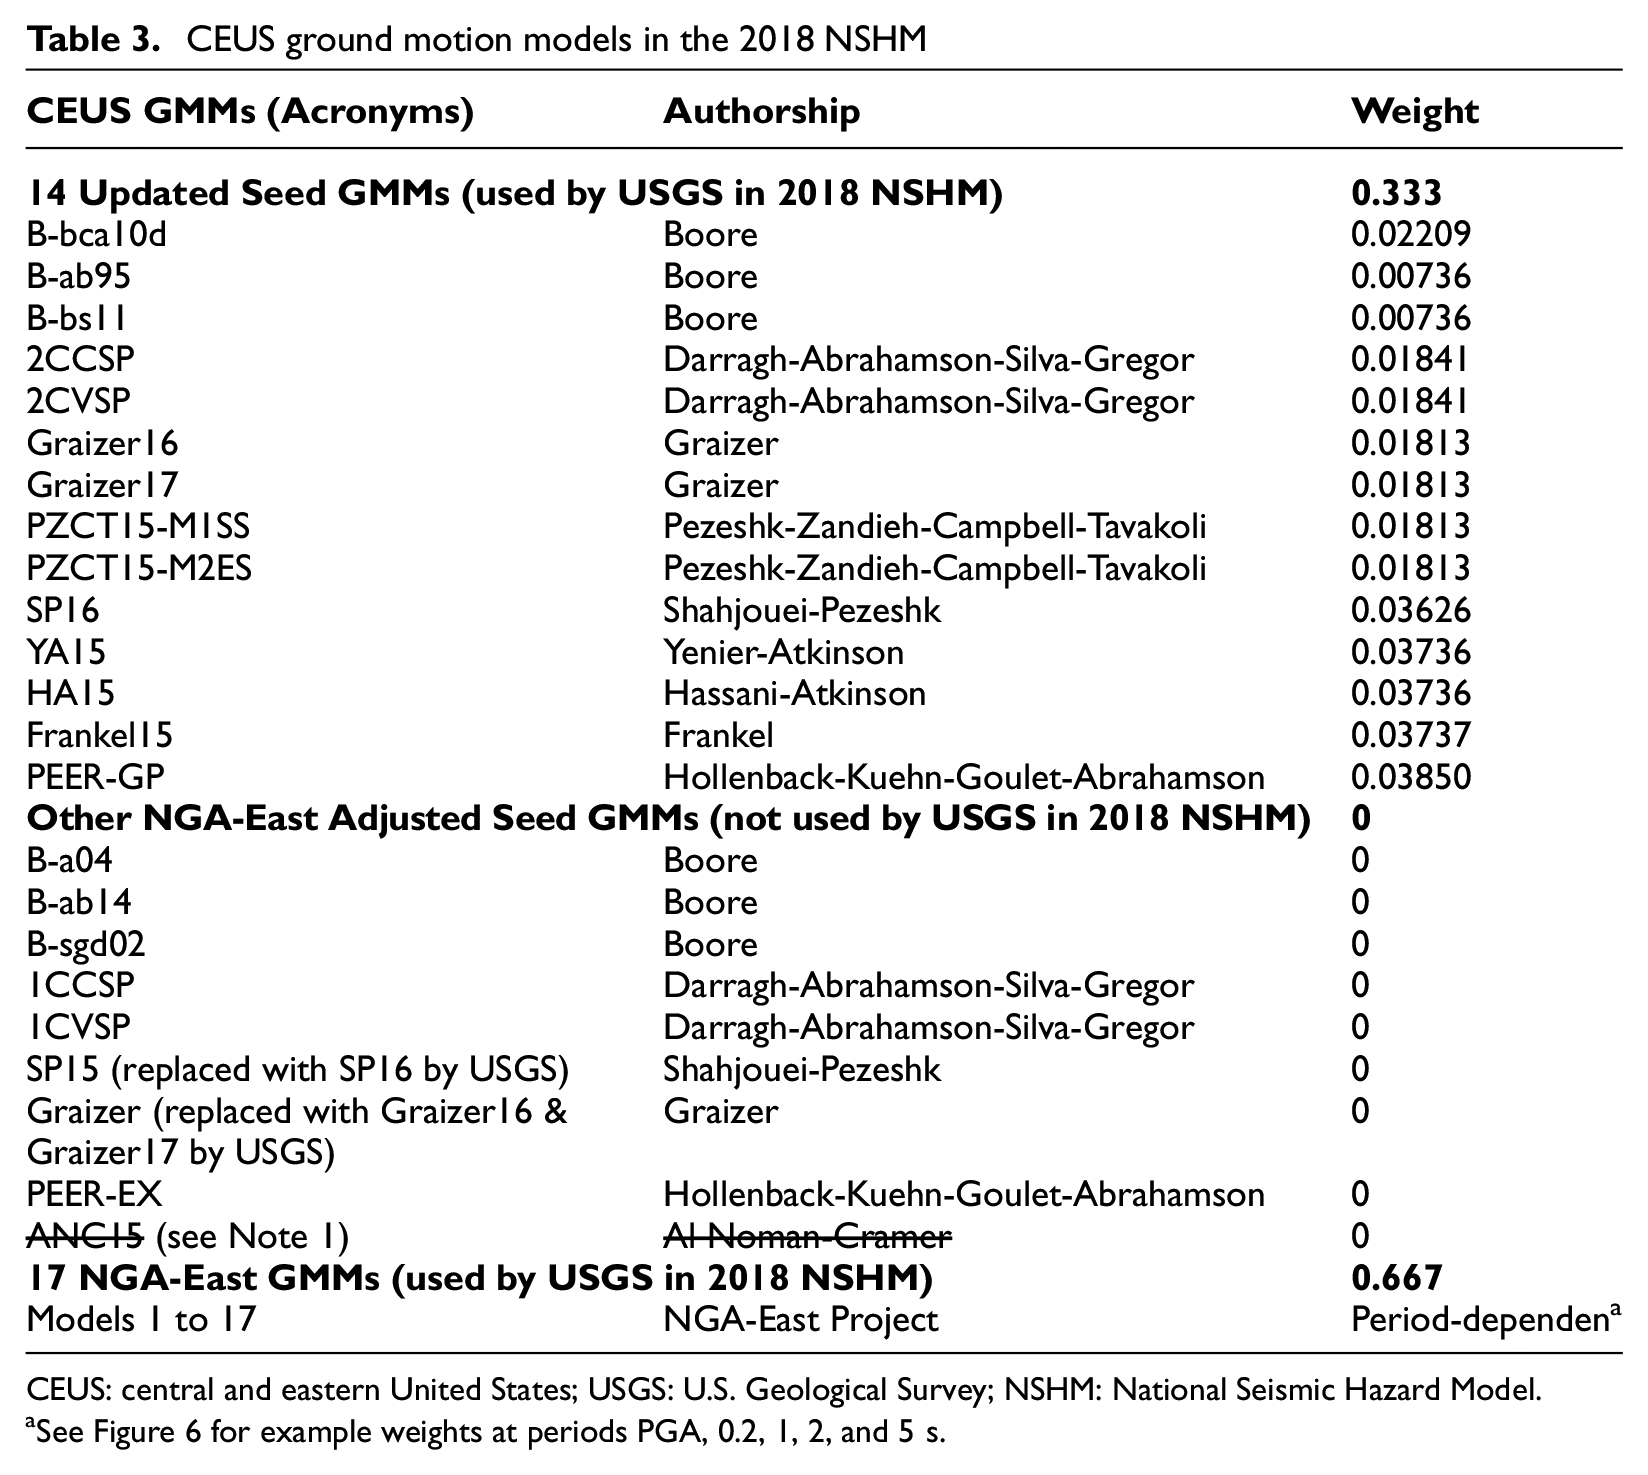
CEUS: central and eastern United States; USGS: U.S. Geological Survey; NSHM: National Seismic Hazard Model.
See Figure 6 for example weights at periods PGA, 0.2, 1, 2, and 5 s.
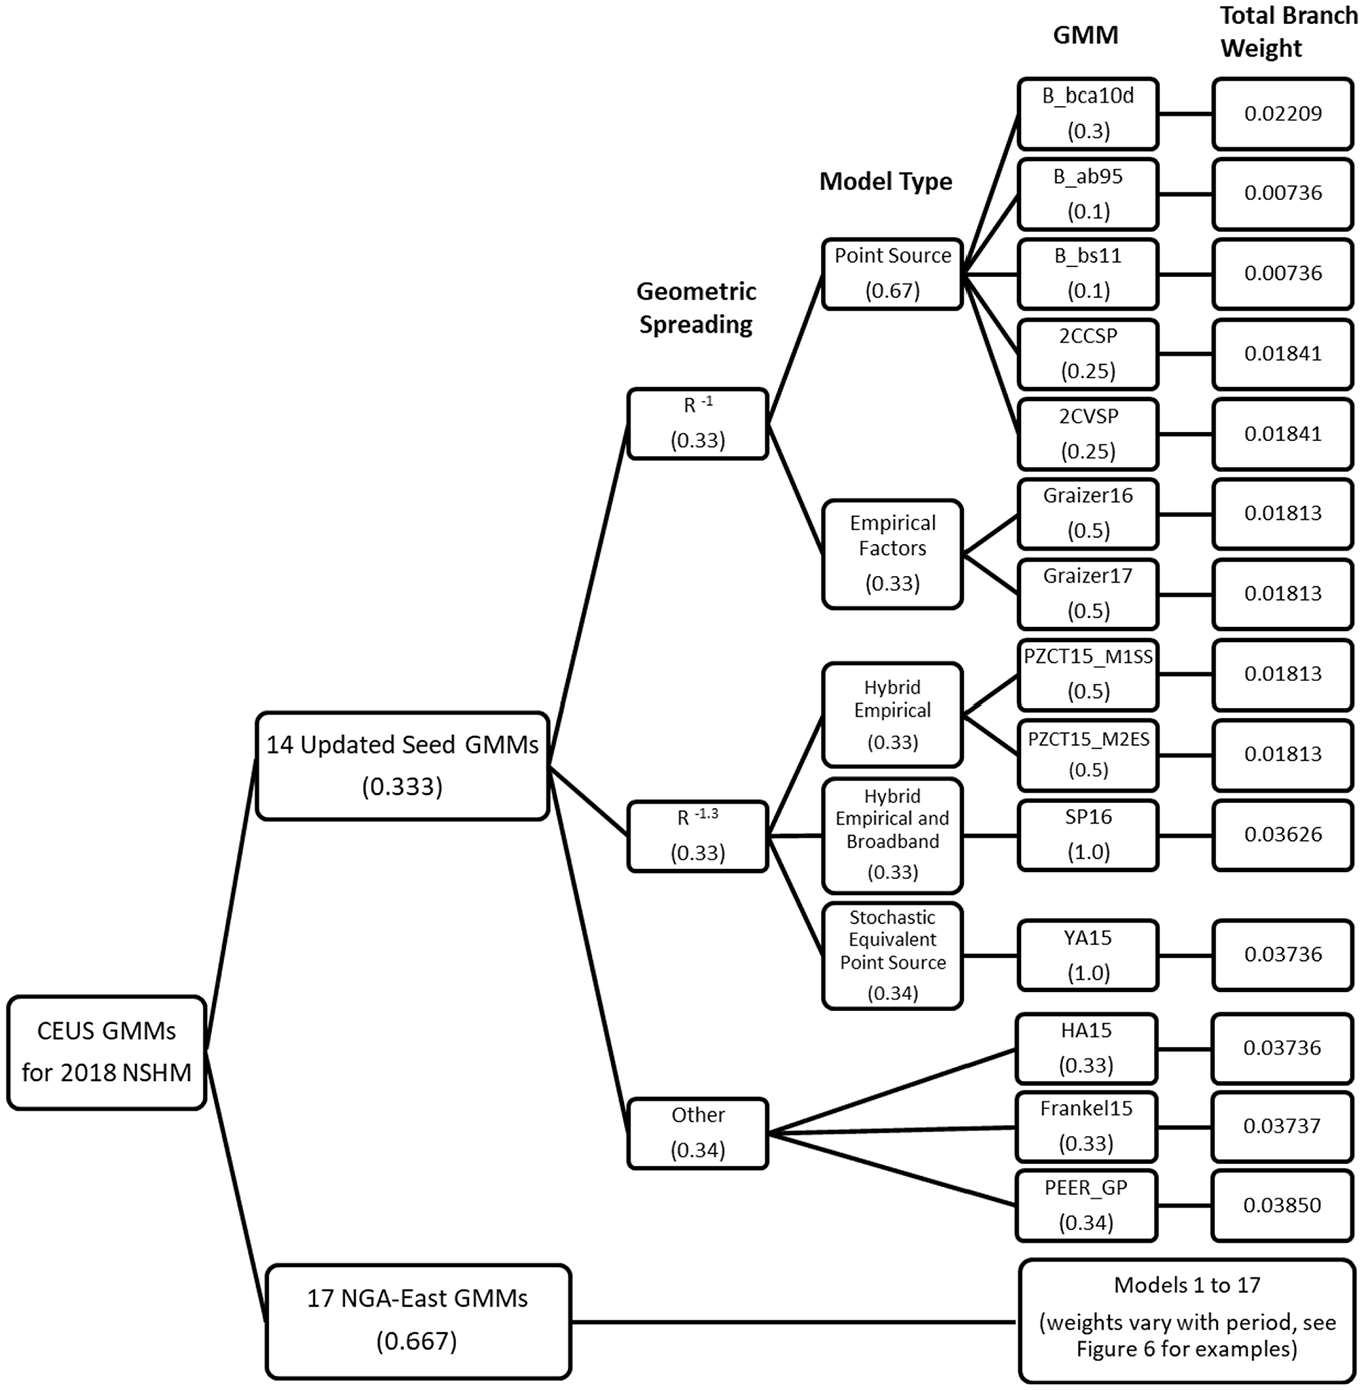
A logic tree showing the grouping of updated seed GMMs by geometric spreading and model type, as well as the weights assigned to all CEUS GMMs in the 2018 NSHM. Relative weights for each group or model are given in parentheses.
Although the final NGA-East GMMs and associated weights are intended to represent the entire epistemic uncertainty by quantifying the center, body, and range of the underlying distribution in an objective way, in the 2018 NSHM update we also include a logic tree branch for the updated seed GMMs. This decision was made because some participating experts at the 2018 NSHM workshop (Petersen et al., 2020) made the case that incorporating both suites of GMMs is necessary to accurately represent the epistemic uncertainty. They argued that seed GMMs are more informed by physics, as opposed to the outcome of the Sammon’s mapping process in the NGA-East approach that results in models which are not interrogated by individual modelers in the same way that has been customary for GMM development. Therefore, seed GMMs should be incorporated directly in the NSHM to capture any physical features that may not be represented by GMMs derived via Sammon’s mapping. An example of such a physical feature is a strong reflection of seismic waves from the Mohorovičić discontinuity, the boundary between the crust and the mantle in the Earth that can change the velocity and composition of seismic waves, (hereafter referred to as the Moho reflection) that is seen in the attenuation of most seed GMMs at a distance of around 60 to 100 km, but is somewhat subtle in the final NGA-East GMMs. Another example is the higher correlations seen between the NGA-East GMMs, with respect to distance, compared with the seed GMMs, which may not affect the mean hazard substantially at an individual site, but is suspected to influence uncertainty analyses and applications that aggregate the hazard, for example, portfolio risk assessments. Both examples are discussed in detail in this article. Given that the current primary output of the USGS NSHM is the mean hazard at individual sites, and to reflect the high confidence of most workshop participants in the Sammon’s mapping process, the set of final NGA-East GMMs is assigned double the weight (0.667) of the updated seed GMMs (0.333).
The weighted medians calculated separately for the updated seed and the NGA-East GMMs, assuming hypothetical group weights of 1 for each suite, were compared with each other in Petersen et al. (2020, their Figure 3). In general, the NGA-East GMMs result in larger weighted medians compared with the updated seed GMMs for large magnitude events. Hypothetical hazard maps, also assuming group weights of 1 for each suite of GMMs, are compared in Petersen et al. (2019) to understand the sensitivity of hazard values to each suite of models. In the following, we first present the two suites of 14 updated seed and 17 NGA-East median GMMs. We discuss the behavior of each suite in terms of attenuation with distance and representation of epistemic uncertainty. We then compare the combined weighted median of the two GMM suites, using their final group weights of 0.333 and 0.667, to the weighted GMM medians from prior NSHM cycles.
Updated seed GMMs and weights
For the 2018 NSHM update, we performed our own review of the 19 NGA-East adjusted seed GMMs (PEER, 2015a) and selected 13 models based on our GMM selection criteria. We replaced two of the adjusted seed models with three updated versions from Graizer (2016, 2017) and Shahjouei and Pezeshk (2016), which were published after the NGA-East report on adjusted seed models was completed. We refer to these final selected 14 seed models as the “updated seed GMMs.” All adjusted seed models are listed in Table 3 with their assigned weights. If an adjusted seed model was not selected or was replaced in the set of 14 updated seed GMMs, its assigned weight is zero.
Logic tree weights are assigned to the updated seed GMMs using the same method as in the 2014 NSHM. The CEUS GMM logic tree and final weights are illustrated in Figure 3. We generally consider equal weights across different geometric spreading categories and model types and split weights between multiple models developed by a single team who assumed alternative input parameters. In the end, the individual model weights are low and are very similar to one another. These weights were discussed with the NGA-East team and the NSHM Project Steering Committee and found to be reasonable. Other weighting methodologies could be chosen that would also lead to reasonable assessments of mean hazard. During an early sensitivity analysis, two alternative weighting methodologies were considered, which resulted in at most a 10% difference in the total mean hazard, with smaller differences at shorter periods, and larger differences at longer periods.
As shown in Figure 3, the updated seed GMMs are separated into three categories based on their geometric spreading: (1)
The
B_bca10d, B_ab95, B_bs11: six seed GMMs were developed by Boore (2015), using point-source stochastic simulations with a single-corner source spectral shape. Each model is based on different anelastic attenuation (often expressed as seismic quality factor, Q) and geometric spreading factors. Based on recommendations from the author (D. Boore, written communs., 2018), we selected B_bca10d as the preferred model, assigned a relative weight of 0.3 in its group, and B_ab95 and B_bs11 as the next two preferred models with relative weights of 0.1 (Figure 3).
2CCSP and 2CVSP: four seed GMMs were developed by the Darragh–Abrahamson–Silva–Gregor (DASG) team (Darragh et al., 2015), based on single-corner (1C) or double-corner (2C) point-source stochastic simulations, using both constant (CSP) and variable (VSP) stress models. We selected the two double-corner models with both types of stress models. Each is assigned a relative weight of 0.25 in its group.
Graizer16 and Graizer17: these two models are based on applying spectral shapes that are developed for the WUS and then empirically adjusted to the CEUS, and therefore, are referred to as empirical-factor models in Figure 3. These types of models were not used in previous NSHM cycles. Graizer16 (Graizer, 2016) was published as an update to the “Graizer” seed model of NGA-East (PEER, 2015b, chapter 9). Graizer17 (Graizer, 2017) is an alternative, using a more physically justified approach, to Graizer16. Based on recommendations from the author (V. Graizer, oral and written communs., 2018), we used both models with equal weights to replace the original seed model.
The
PZCT15_M1SS and PZCT15_M2ES: these are two models from the same developer team, Pezeshk–Zandieh–Campbell–Tavakoli (Campbell, 2014; Pezeshk et al., 2015). They are based on a hybrid empirical method that defines the WUS as the host region and the CEUS as the target region, then develops host-to-target adjustments. The two different models have different large-magnitude scaling, one based on stochastic simulation scaling (SS) and the other based on empirical scaling (ES). Both versions are used and assigned equal weights.
SP16: this model is developed by Shahjouei and Pezeshk (2016) and is an update to SP15, an original seed GMM for NGA-East (PEER, 2015b, chapter 7). This model is based on a hybrid empirical method like the two models above, but unlike those models, it also incorporates hybrid broadband simulations with both stochastic and deterministic components for both host and target regions.
YA15: this model is developed by Yenier and Atkinson (2015b) and is a regionally adjustable generic model, based on equivalent point-source simulations. The model is adjusted to the CEUS based on empirical observations (also see Yenier and Atkinson, 2014, 2015a)
There are three models (HA15, Frankel15, and PEER_GP) with geometric spreading other than
HA15: this is a referenced empirical model by Hassani and Atkinson (2015) (also see Hassani and Atkinson, 2014) and is similar in methodology to YA15. However, it uses WUS GMMs as the base, and therefore, the geometric spreading is different from the other CEUS GMMs and more similar to WUS GMMs.
Frankel15: this model is developed by Frankel (2015), using finite-fault simulations that are enhanced by stochastic simulations at short periods. The
PEER_GP: two seed GMMs were developed by the Hollenback–Kuehn–Goulet–Abrahamson developer team (Hollenback et al., 2015) based on different simulation models (GP and EX, Table 3). Based on recommendations from the authors and simulation model developers (e.g. R. Graves, oral communs., 2018), we selected the PEER_GP as the preferred model and excluded the PEER_EX model. The PEER_GP model is based on the finite-fault simulations of Graves and Pitarka (2015).
The 14 updated seed models described above are shown in Figure 4 for a magnitude 7 event on a very hard-rock site condition
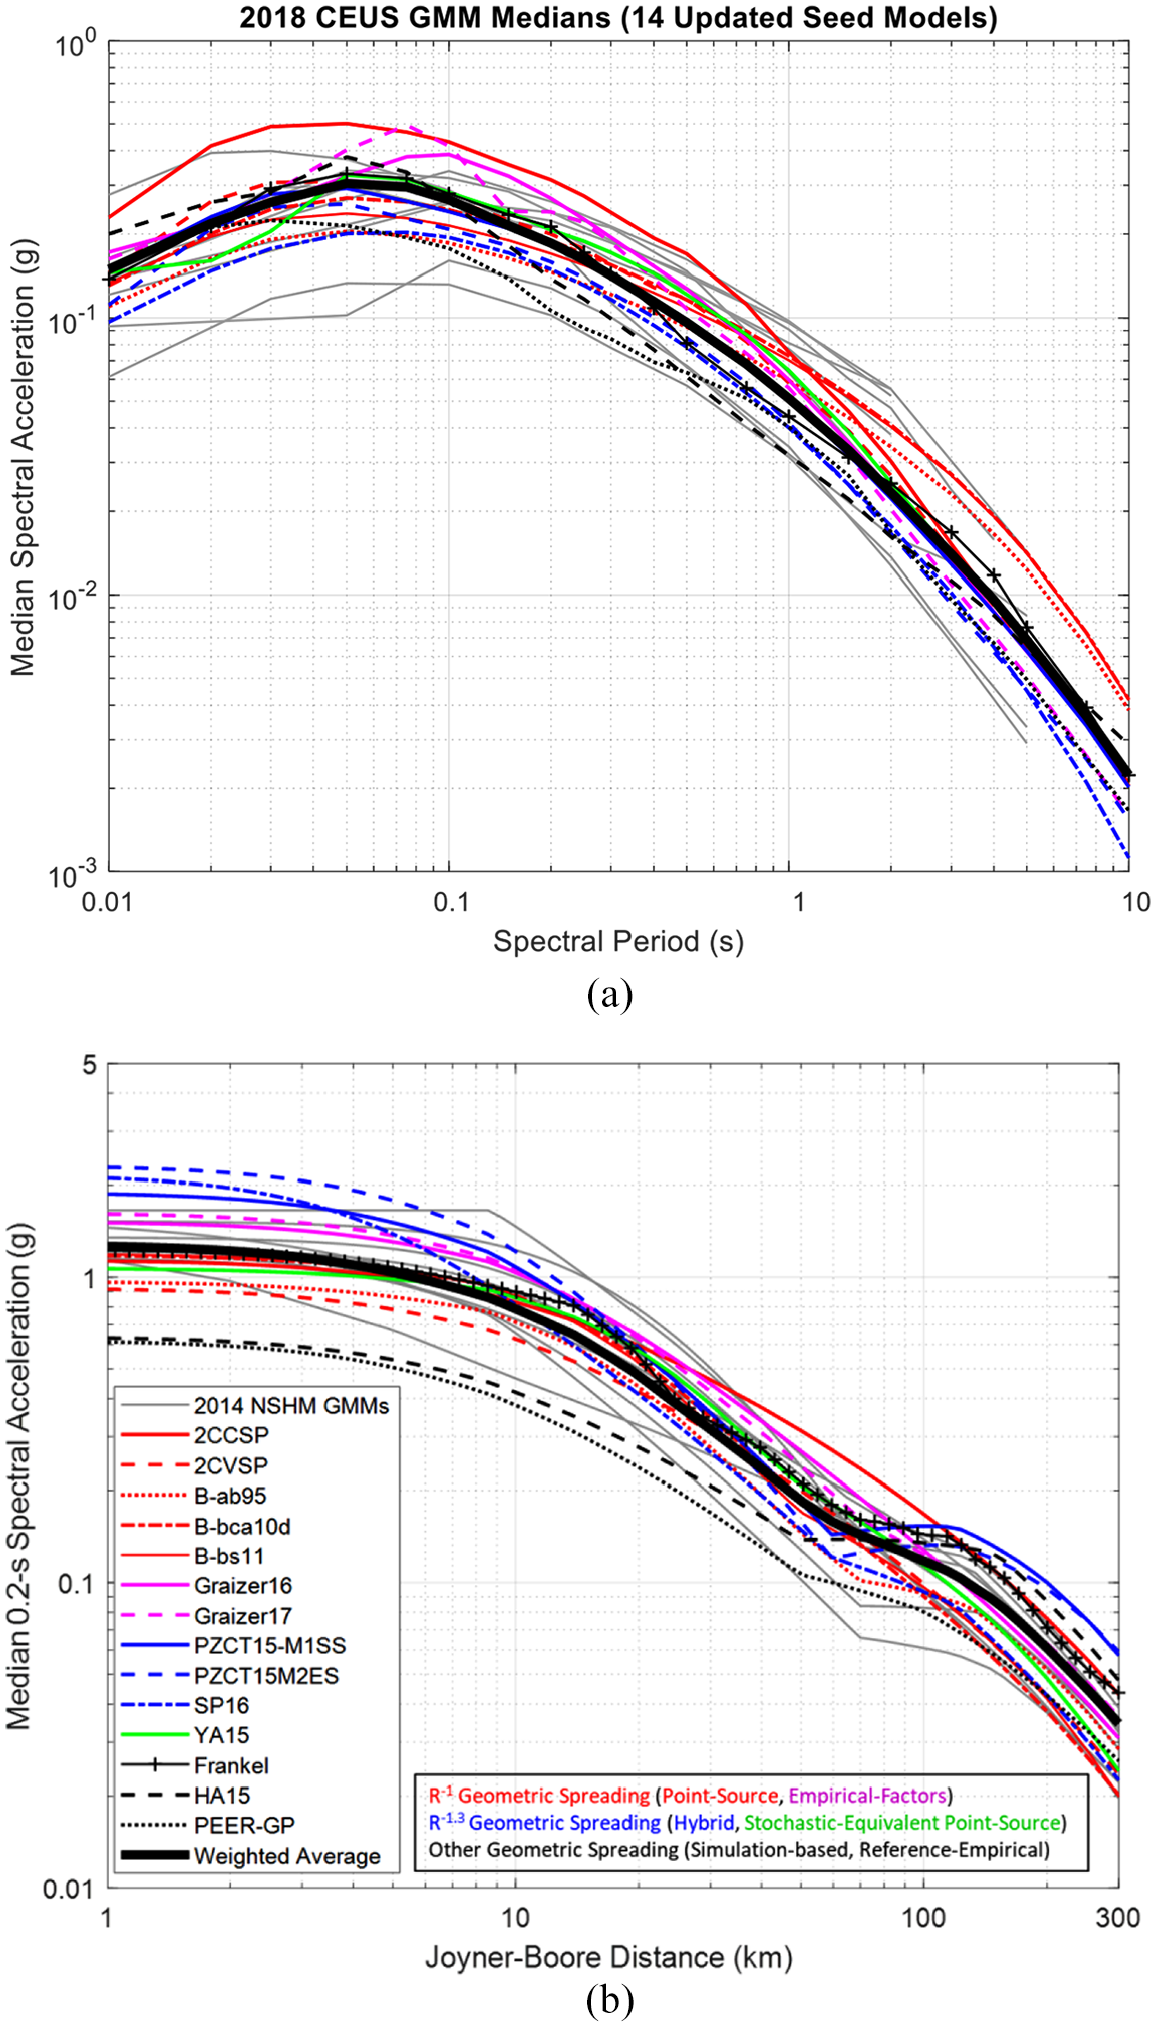
The 14 updated seed CEUS GMMs in the 2018 NSHM for a magnitude 7 event on a very hard rock site: (a) medians versus period at a distance of 50 km and (b) medians versus distance at 0.2-s spectral period, superimposed on the nine CEUS GMMs from the 2014 NSHM of Figure 1. Model abbreviations and weights are defined in Table 3 and Figure 3.
NGA-East GMMs and weights
The NGA-East project team adjusted the seed models, developed by individual modelers, and used them as inputs to a Sammon’s mapping procedure (Sherbaum et al., 2010), a statistical tool that aids in visualizing the probability distribution of the input seed GMMs. The procedure then resamples the ground-motion space to select an evenly distributed set of GMMs and weights that better represent the underlying continuous distribution (or epistemic uncertainty) than the set of input seed GMMs. The evenly distributed set avoids redundant GMMs and fills out the predicted space of possible GMMs. The resulting NGA-East GMMs are tabulated values (i.e. not equations) for given magnitudes, distances, and spectral periods.
Three early versions of the NGA-East models based on Sammon’s mapping were considered for use in the 2018 NSHM update: (1) a suite of 29 GMMs; (2) a suite of 13 GMMs; and (3) a suite of 17 GMMs (referred to as “NGA-East for USGS,”Goulet et al., 2017, with an addendum, referenced in Petersen et al., 2020). After each version, the USGS provided feedback to the NGA-East modelers for improving the final set, but the overall variation in mean hazard was minor, reflecting robustness of the Sammon’s mapping process regardless of sampling density. After the completion of 2018 NSHM, the suite of 17 GMMs was republished by NGA-East for assessing seismic safety of nuclear facilities and was called the “NGA-East final” suite (Goulet et al., 2018). Hence, the 2018 NSHM uses the NGA-East final suite of GMMs by incorporating the Goulet et al. (2017) report with the addendum.
The final 17 NGA-East GMMs are shown in Figure 5 for a magnitude 7 event on very hard-rock site conditions
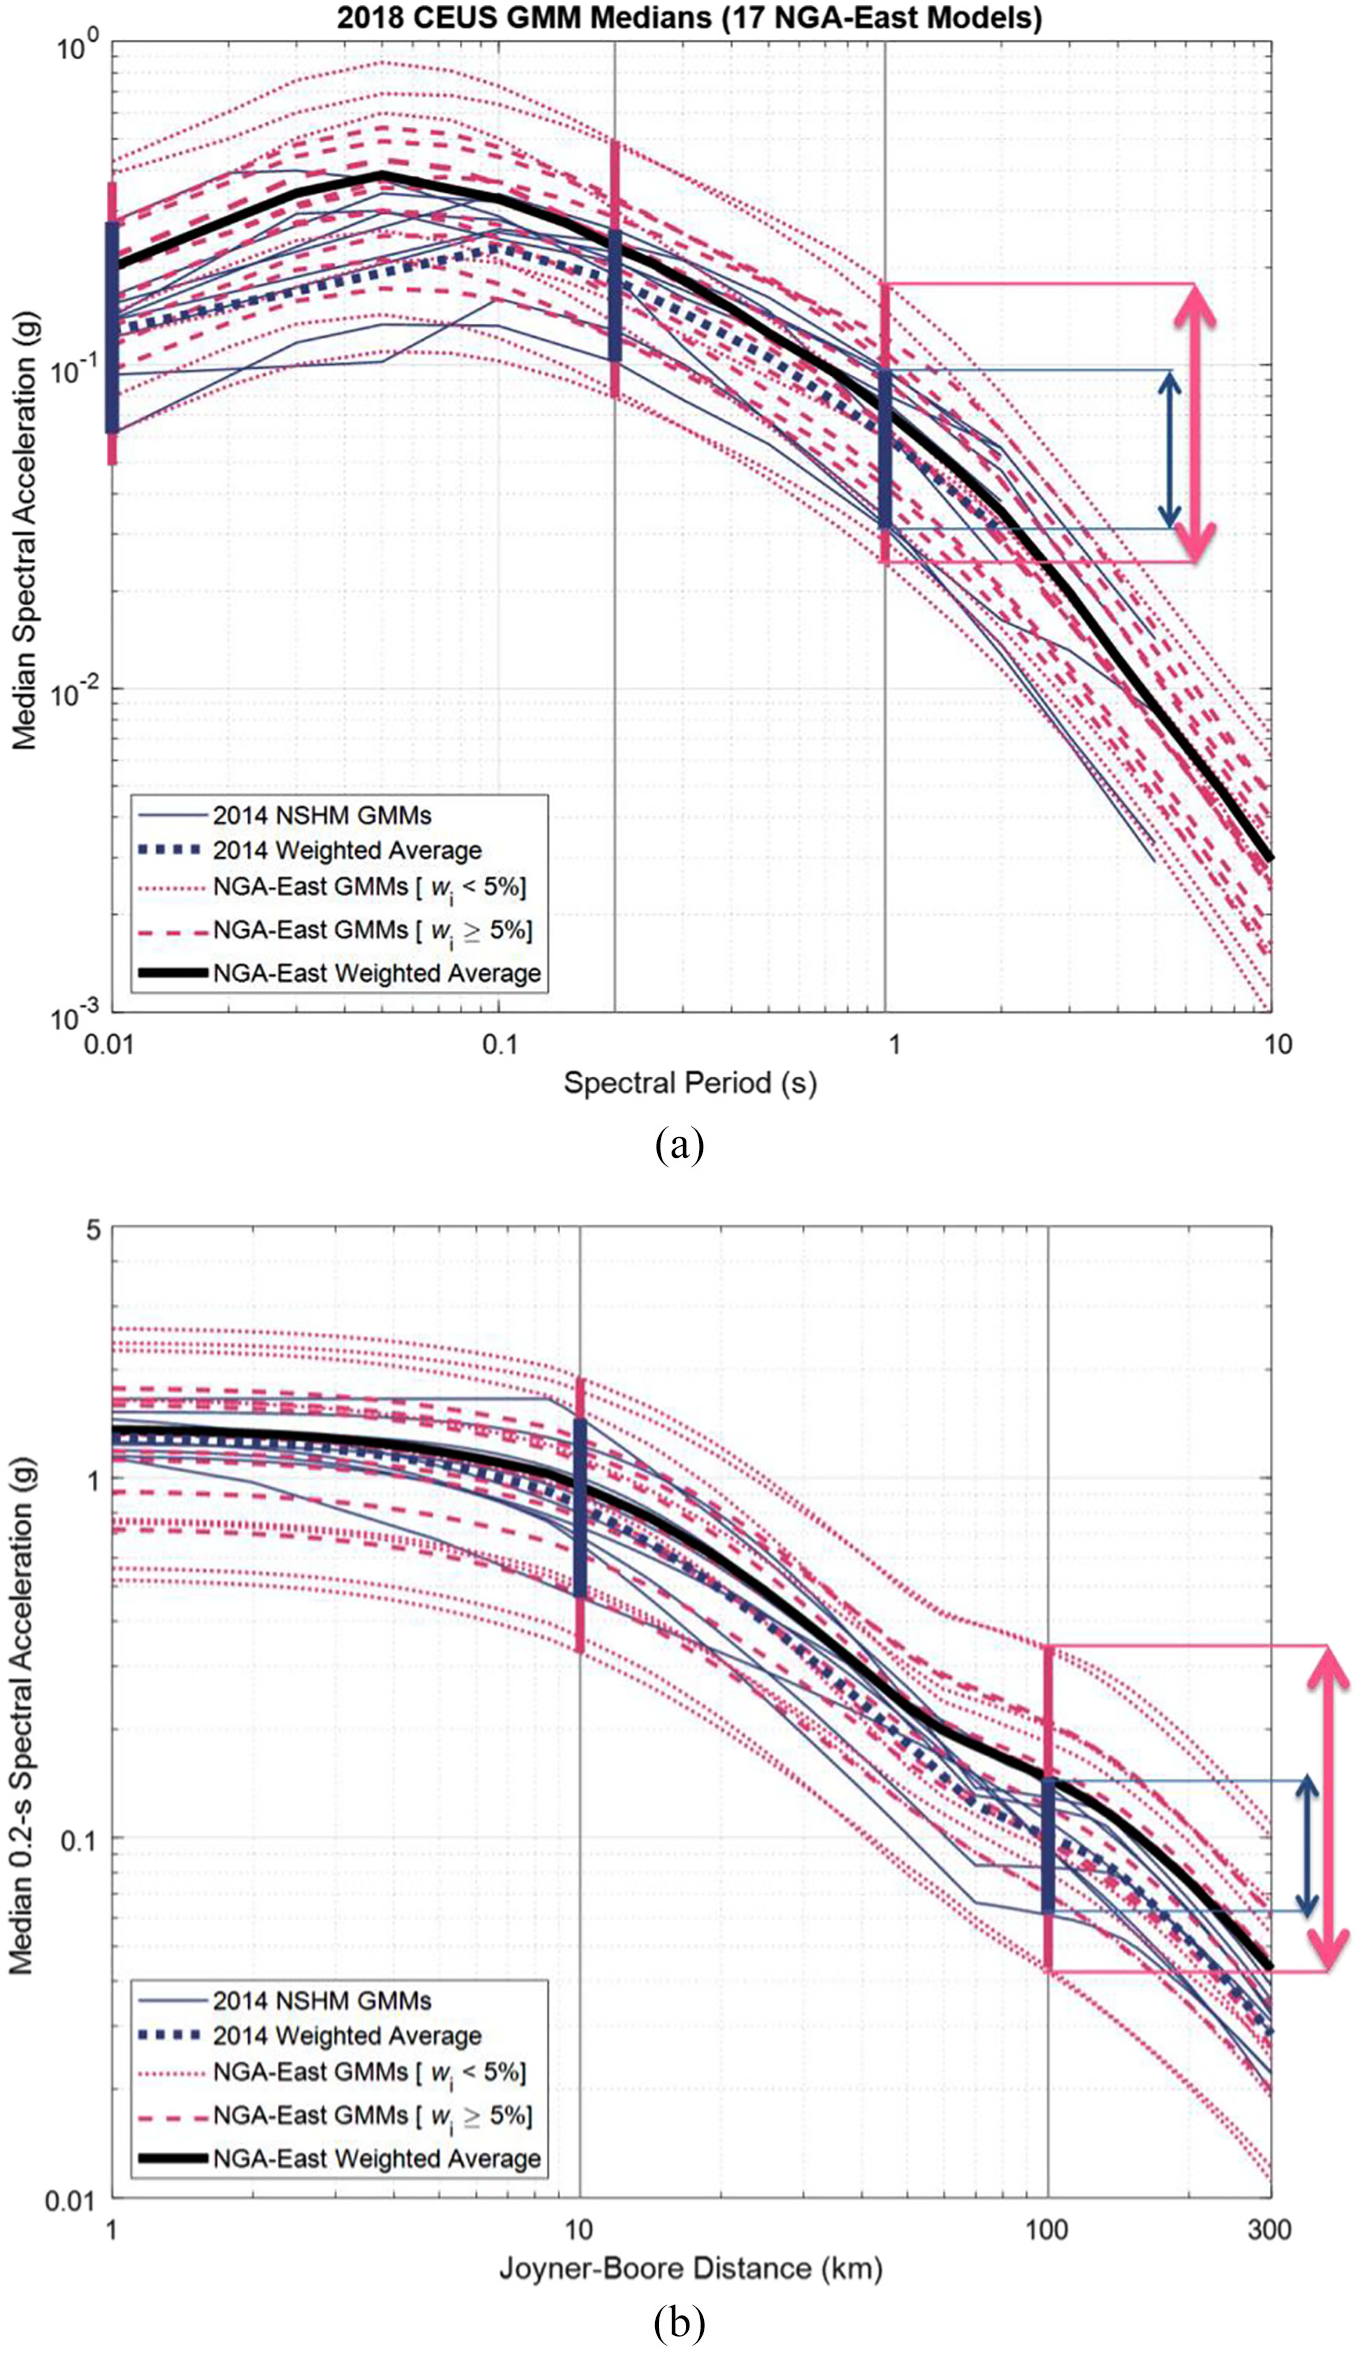
Medians of the 17 NGA-East GMMs in the 2018 NSHM for a magnitude 7 event on a very hard rock site: (a) medians versus period at a distance of 50 km and (b) medians versus distance at 0.2-s spectral period, superimposed on the nine CEUS GMMs from the 2014 NSHM in Figure 1. Vertical bars and arrows indicate the range of ground motions at different spectral periods and distances for the two groups of GMMs and are referenced in Figure 11.
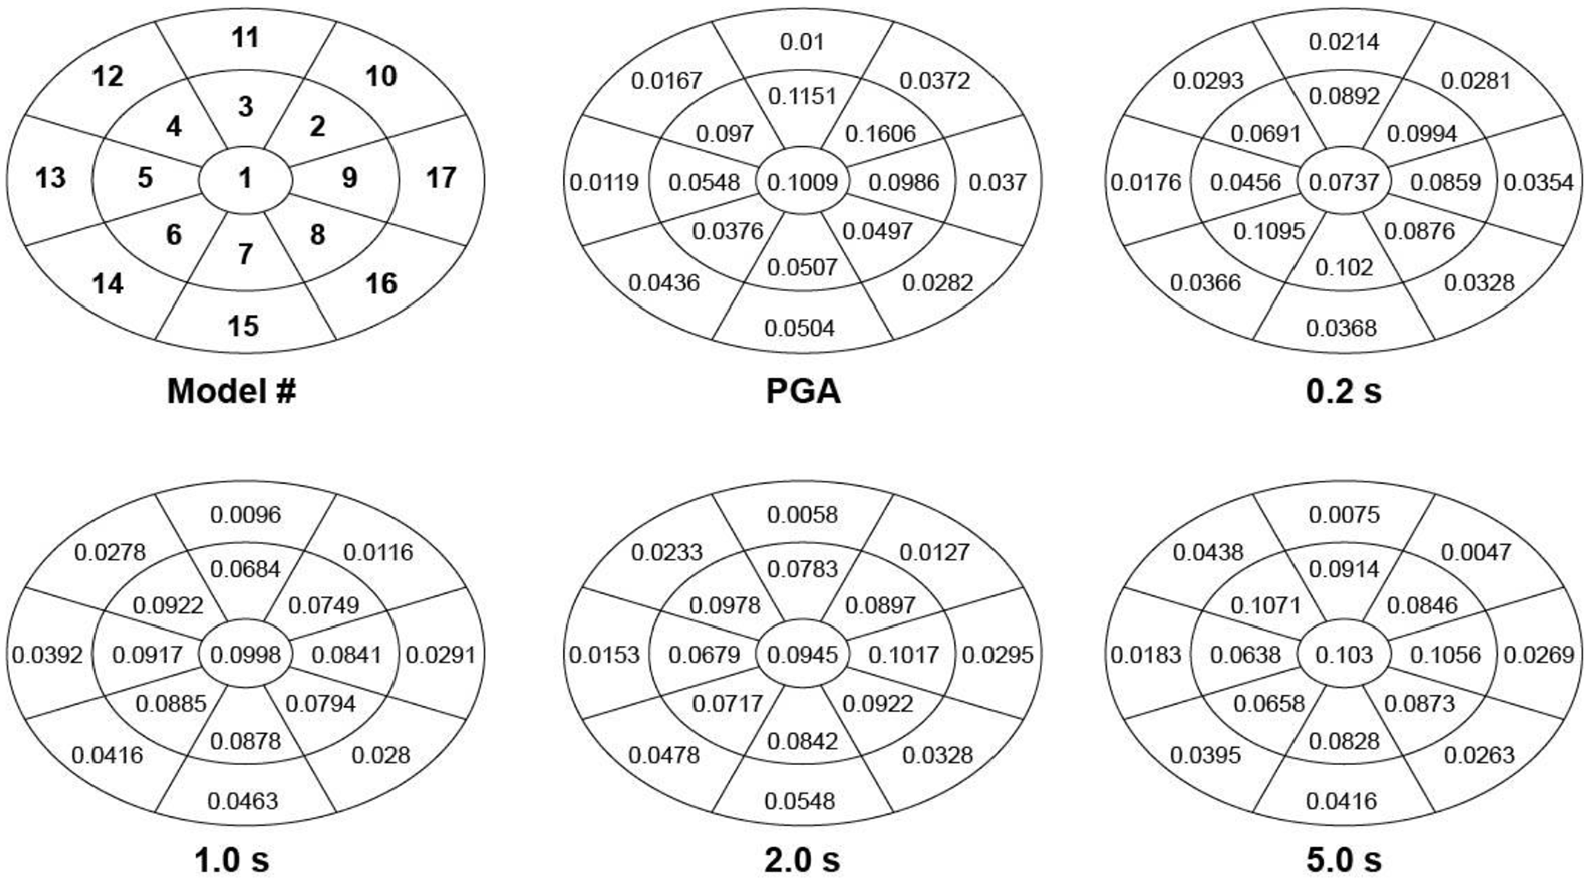
Period-dependent weights for the final 17 NGA-East models. The upper left ellipse defines the model number corresponding to each cell.
Additional figures that directly compare the two suites of updated seed GMMs and NGA-East GMMs (without the 2014 GMMs) are provided in an electronic supplement (Figures A3 and A7 for magnitude 5 and 7 events, respectively). Although the above conclusions are based on a large magnitude 7 event and for attenuation with distance at a 0.2-s period (Figures 4b and 5b), they are also true for smaller magnitude events (electronic supplement, Figures A1b and A3b) and for a 1-s period (electronic supplement, Figures A5c and A7c).
Figure 5 also shows vertical cross sections at three periods and two distances, indicating the range of ground motions for the two suites of GMMs. These vertical lines show that for a large magnitude event, the range of ground motion from the NGA-East GMMs is significantly larger than that spanned by the nine 2014 GMMs. In contrast, Figure 4 shows that the updated seed GMMs span a similar range as the 2014 GMMs. The updated seed and NGA-East GMMs are compared directly in the electronic supplement Figure A7. This increased range of NGA-East ground motion values demonstrates an increase in epistemic uncertainty. In addition to the range of ground motions, epistemic uncertainty also depends on the distribution of weights assigned to each GMM.
The NGA-East project team assigned period-dependent weights to each of the 17 GMMs based on two considerations: (1) the weight for each final GMM should reflect the likelihood of that GMM with respect to the distribution of input seed GMMs and (2) GMMs that better fit the available data should receive higher weights (Goulet et al., 2017, 2018). Different weights are given to the two approaches at different periods based on their relative merits at that period. These weights are typically displayed in an ellipse that can be thought of as a two-dimensional projection of the ground motion space and can be used to visualize the epistemic uncertainty. Figure 6 shows examples of these period-dependent weights for PGA, 0.2, 1, 2, and 5 s, which are used directly in the USGS hazard analyses. Each cell in an ellipse is the ground motion space represented by one of the final NGA-East GMMs. Therefore, the weight of a GMM representing an individual cell reflects the contribution of that cell in the total ground-motion space.
GMM weights for grid sources and distances beyond 500 km
For grid or background seismicity sources that include smaller magnitude events and for distances beyond 500 km, the 2014 CEUS GMM weights were different than those for fault-based and repeating large-magnitude earthquake (RLME) sources such as the New Madrid and Charleston, SC source zones. While nine GMMs were used for RLME sources within 500 km, only eight were used for grid sources because S01 was not applicable to small magnitude events (Table 2). Between 500 and 1000 km, only five GMMs that could be reasonably extrapolated to large distances were used. In contrast, the 2018 CEUS GMM weights are the same for all source types and for all distances up to 1000 km because the 2018 GMMs are all applicable for the entire magnitude and distance range of interest.
Weighted average of medians
Figures 7 and 8 show the weighted averages of CEUS GMM medians as functions of spectral period and distance, respectively, for two magnitude scenarios: 5.5, typical of areas with high background or gridded seismicity rate (e.g. the East Tennessee seismic zone), and 7.5, typical of fault-based or RLME sources (e.g. the New Madrid seismic zone). Both figures also include the weighted combinations of medians from the 2014 and 2008 NSHMs. Note that the increases and decreases in these figures are not exact representations of changes in the final hazard because PSHA is not a linear process; it first calculates the hazard (annual rate or probability of exceedance) for a given GMM median and its standard deviation, and then combines the hazard based on logic tree weights rather than combining the ground motion values. However, weighted averages of GMM medians are a good proxy for what happens to the final estimated mean hazard when they are combined with uncertainties discussed in the following sections.
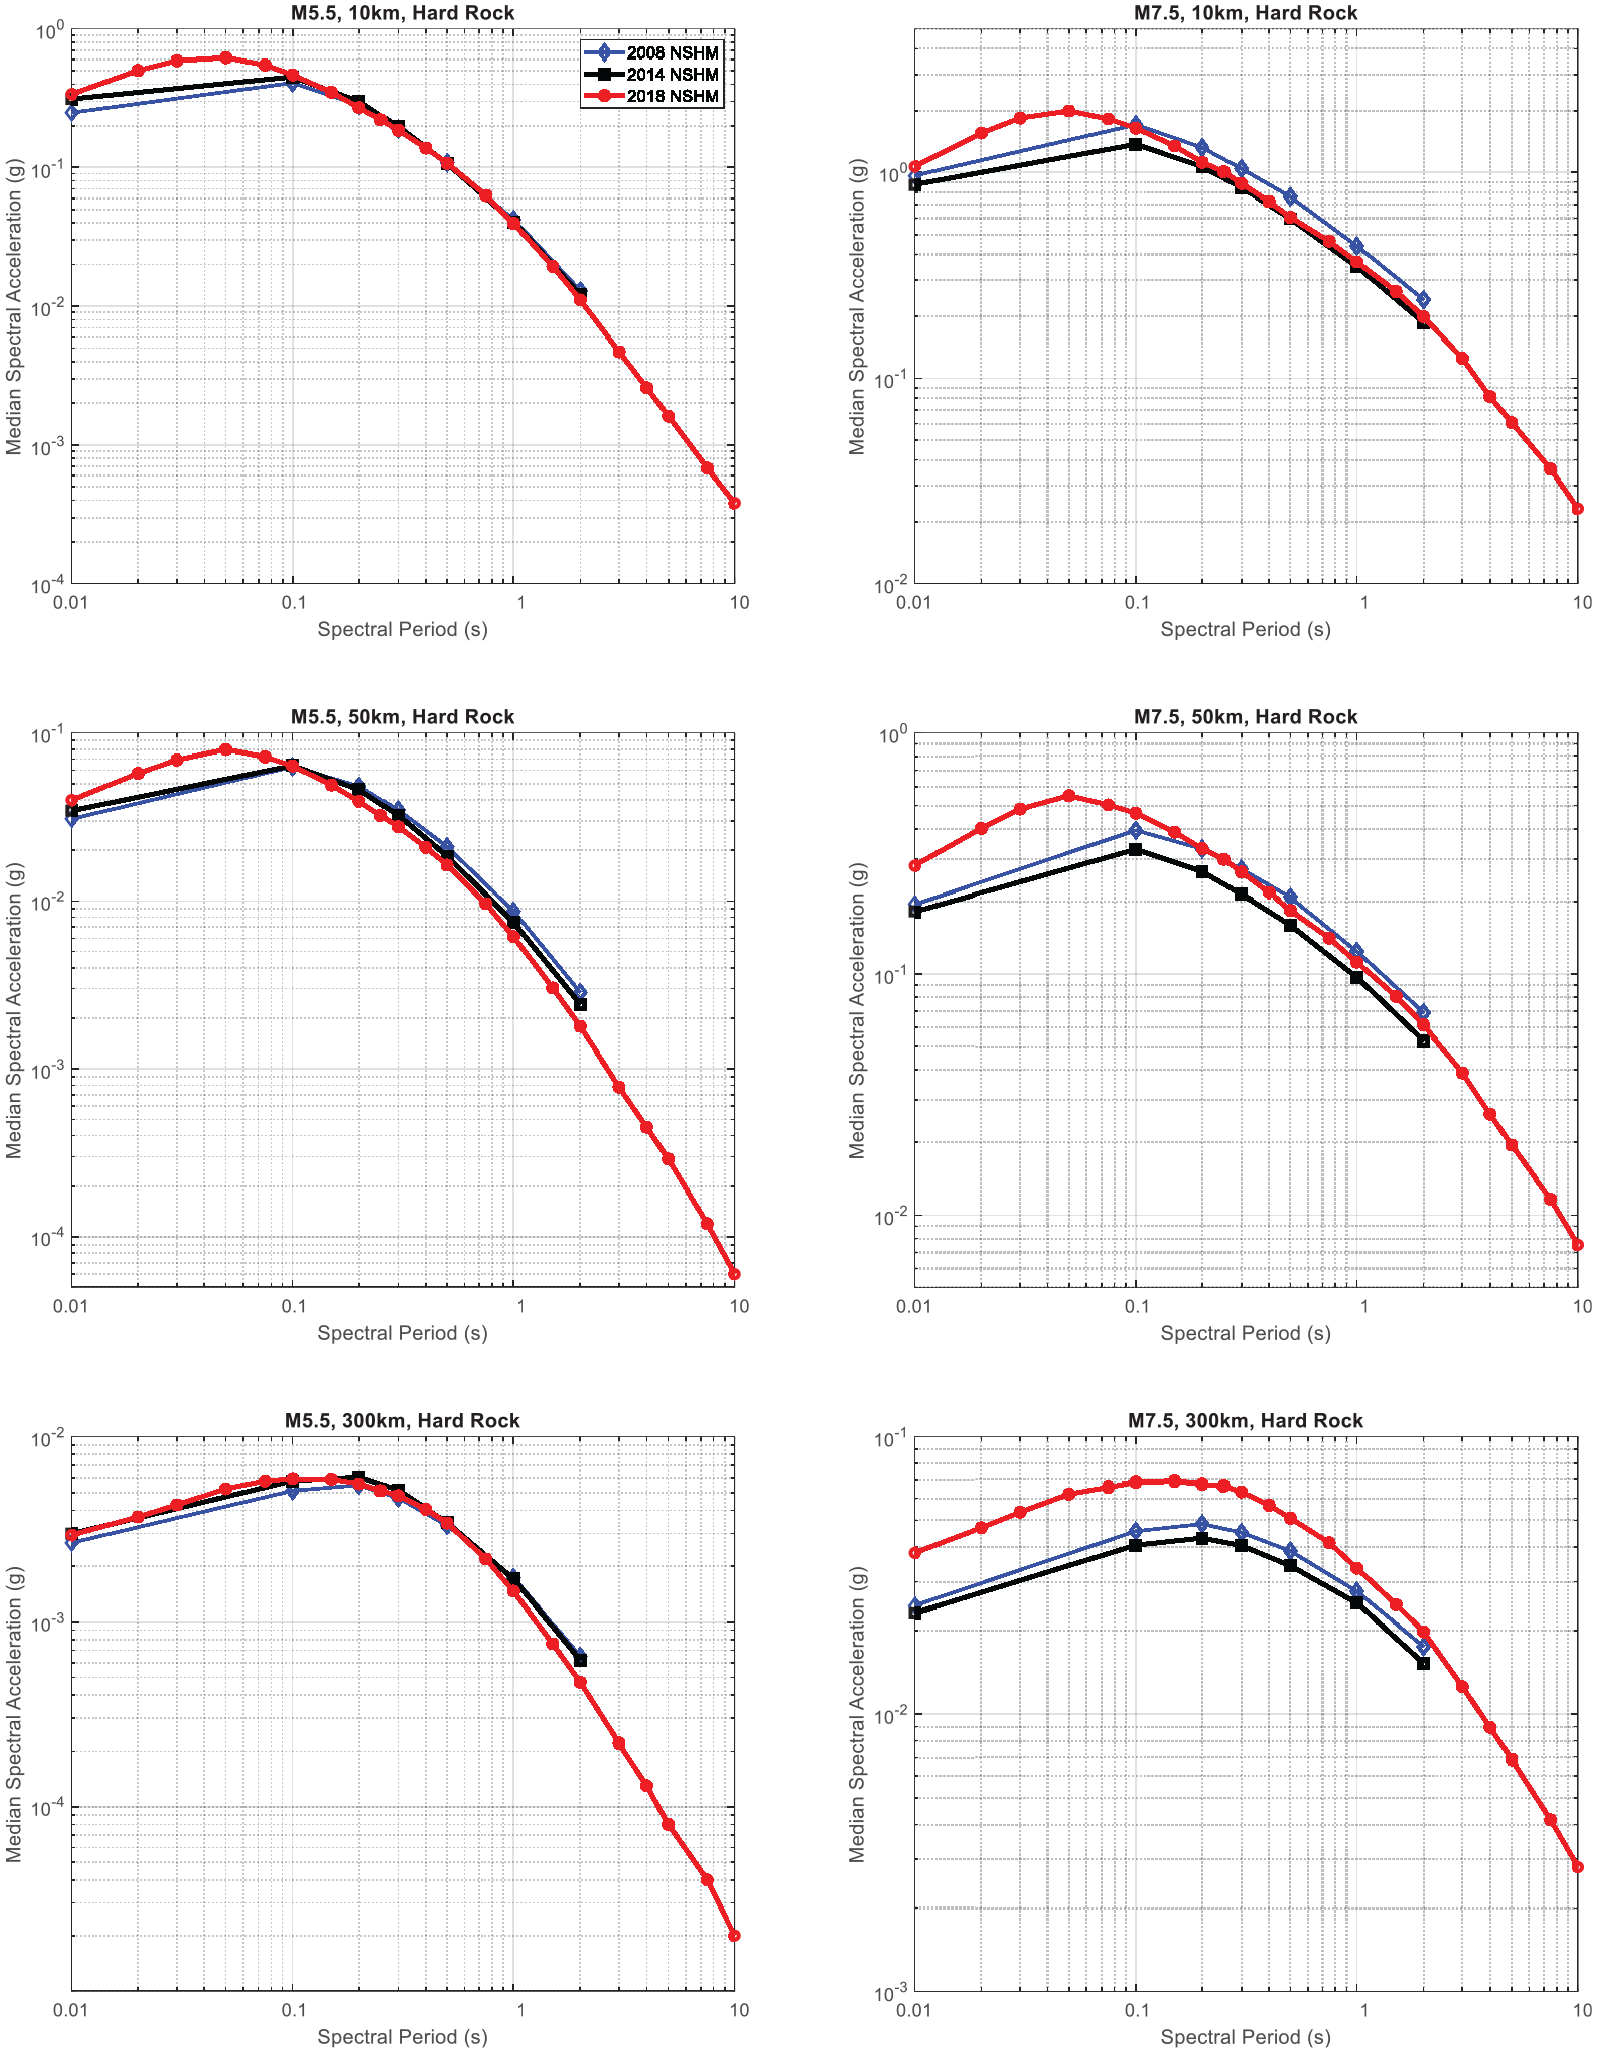
Weighted averages of CEUS GMM medians from the 2018 NSHM, 2014 NSHM (RLME), and 2008 NSHM (RLME) versus period for magnitude 5.5 and 7.5 events at 10, 50, and 300 km distances for hard rock representing the original site conditions of the models (about 2000 m/s in 2008 and 2014 NSHMs, 3000 m/s in 2018 NSHM).
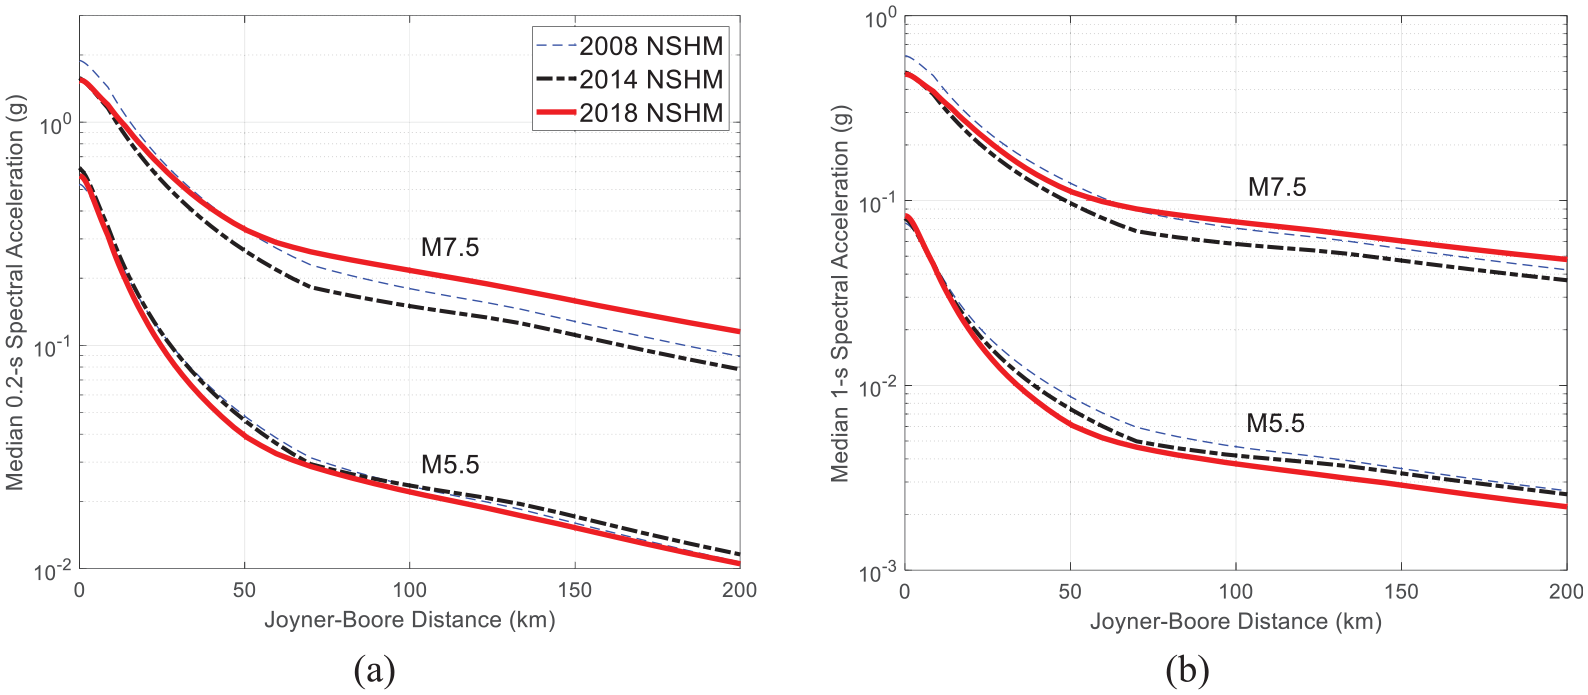
Weighted combinations of CEUS GMM medians from the 2018 NSHM, 2014 NSHM (RLME), and 2008 NSHM (RLME) versus distance for magnitude 5.5 and 7.5 events at (a) 0.2 s and (b) 1 s. These plots are made for hard rock representing the site conditions of the original models (2000 m/s in the 2008 and 2014 NSHMs, 3000 m/s in the 2018 NSHM).
Figure 7 shows the ground motions at three distances of 10, 50, and 300 km. The median 2018 GMMs at 0.2 and 1 s periods are slightly lower than the median 2014 GMMs for small magnitude events (e.g. around East Tennessee), but are noticeably larger than the median 2014 GMMs for large magnitude events (e.g. around New Madrid) at larger distances. At short distances, the differences are negligible. The increase for large magnitudes at larger distances could be due to the higher weight that is given to the NGA-East GMMs and their larger values due to their slower attenuation with distance beyond 60 km compared with the updated seed and the 2014 GMMs. As will be shown in the maps at the end of this article, this causes a ring of increased ground motion values around, but not in the immediate vicinity of the New Madrid seismic zone. In Figure 7, median 2008 GMMs are also shown, which also used physics-informed GMMs, but with more weight on
Figure 8 shows the attenuation of 0.2 and 1-s ground motions with distance, plotted in the linear distance scale unlike Figures 4b and 5b to show a different perspective and to be comparable to similar figures in previous NSHM publications. Observe that the medians for hard rock slightly decrease from the 2014 to the 2018 cycle for small magnitude events but increase for large magnitude events. Note that for large magnitudes, the increase from 2014 to 2018 accelerates around 60–80 km (where Moho reflection happens), and is relatively constant beyond about 80 km. The 2008 GMM medians are also shown in Figure 8. Note that, as we also observed in Figure 7, for large magnitude events, the 2018 GMMs are closer to the 2008 GMMs than the 2014 GMMs at middle to large distances, and the changes from 2014 to 2018 are more significant compared with the changes from 2008 to 2014.
Epistemic uncertainty of medians
Epistemic uncertainty accounts for variability due to lack of knowledge and modeling choices and is represented by logic tree branches and weights associated with different models. Replacing the 9 2014 CEUS GMMs with the 31 2018 CEUS GMMs increases the epistemic uncertainty significantly. Figure 9 demonstrates the increase of epistemic uncertainty in NGA-East GMMs by showing the range of median ground motion values and their assigned weights for the 17 NGA-East relative to the 9 2014 GMMs. Figure 10 makes the same comparison for the 17 NGA-East relative to the 14 updated seed GMMs. Both figures show values at three periods for a distance of 50 km, and at two distances for a 0.2-s period for a magnitude 7 event on hard-rock site conditions. Note that the vertical scale is logarithmic in these figures and the range of vertical axes, while different, is similar in the order of magnitude in all subplots for easy comparison. The dotted lines show weighted averages of median ground motions. The solid lines on the vertical axes in Figure 9 are the same as the vertical cross sections in Figure 5 and indicate the range of ground motion values in each suite of GMMs. These ranges are a good representation of epistemic uncertainty (larger range = larger uncertainty), but the distribution of assigned weights, shown in Figures 9 and 10 as stem plots, is also important. These figures show that the ground motion values for all three suites of models (2014 GMMs, 2018 NGA-East GMMs, 2018 updated seed GMMs) cover a broad epistemic uncertainty range: about a factor of 2 for the 2014 and the 2018 updated seed GMMs, and about a factor of 10 for the 2018 NGA-East GMMs, for a magnitude 7 event with variations depending on distances and periods.
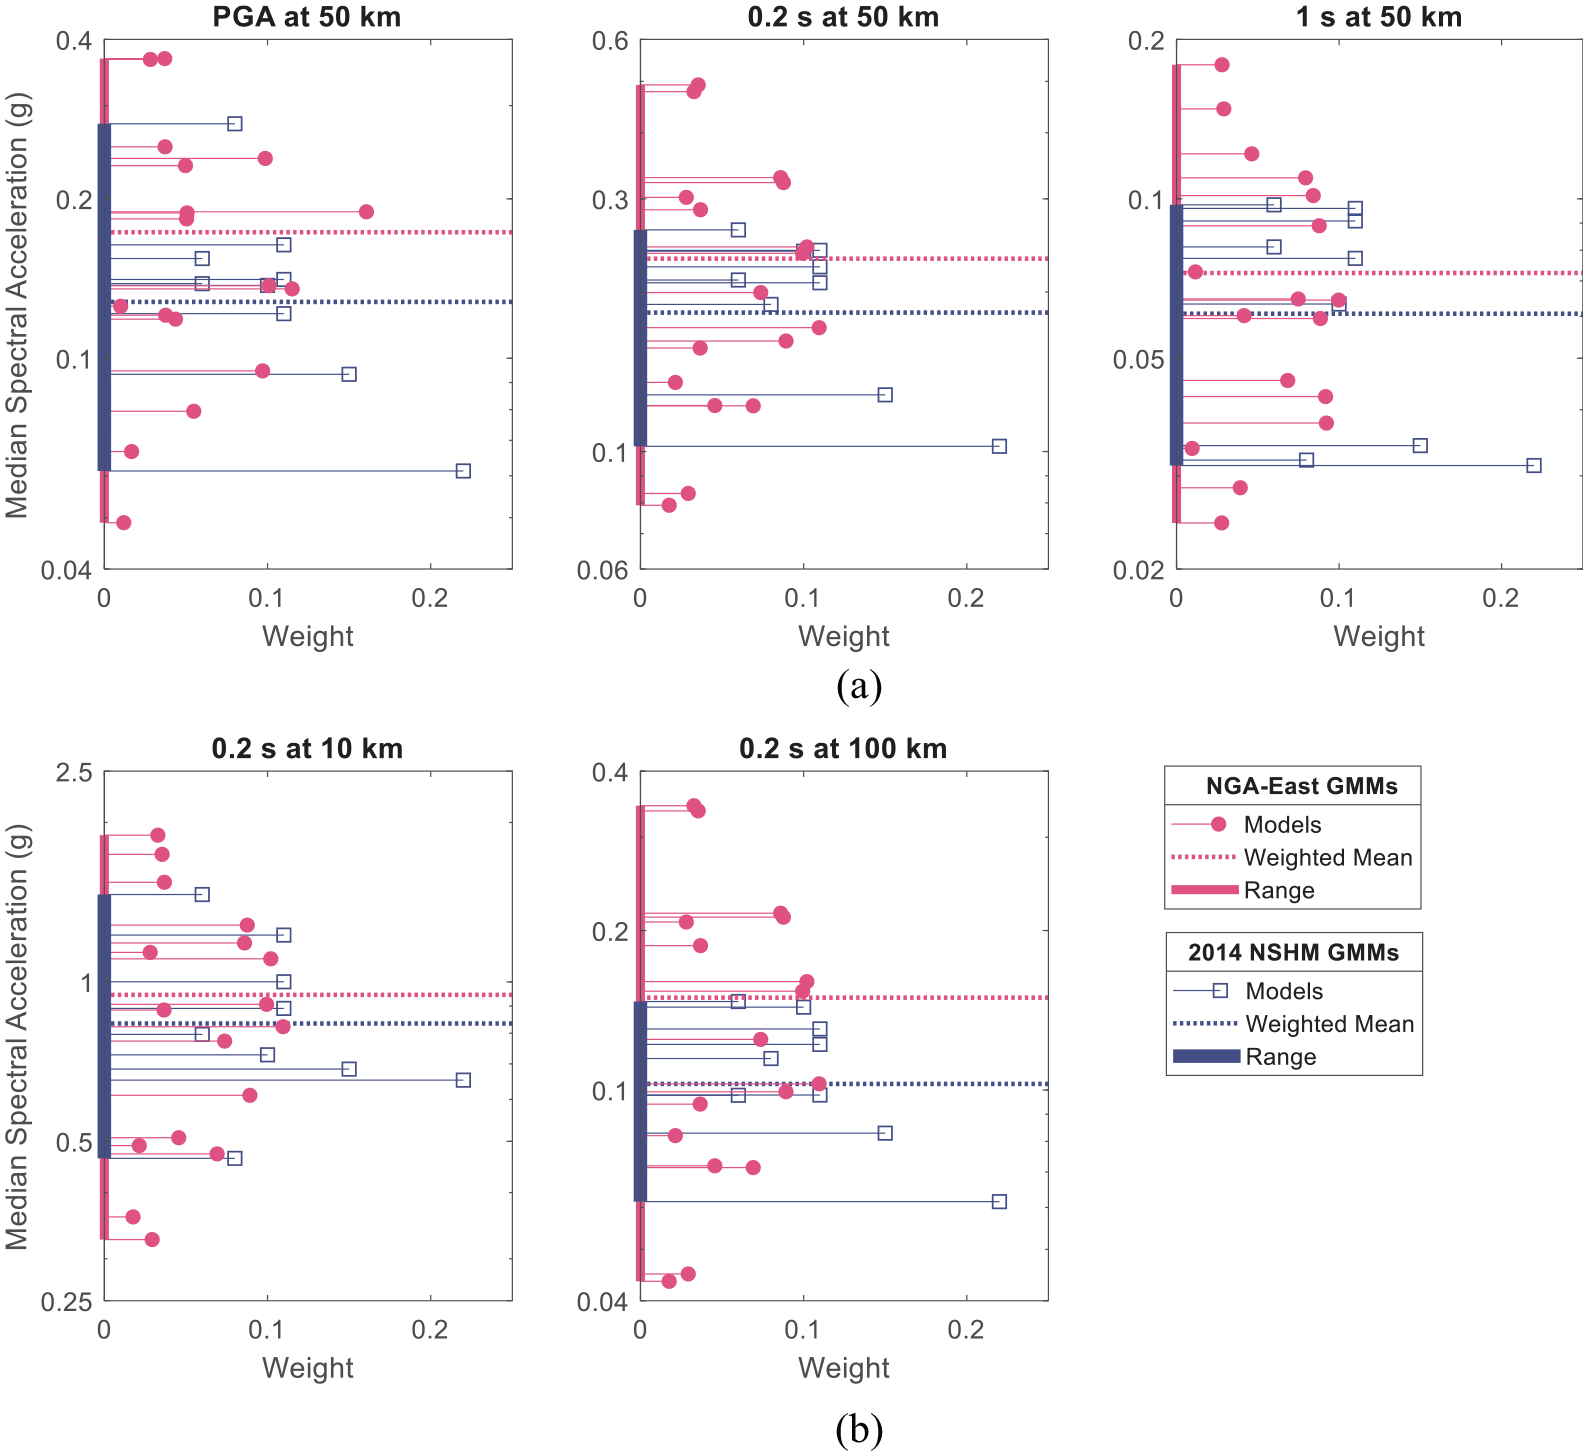
Epistemic uncertainty of NGA-East GMMs and 2014 GMMs represented by the range and distribution of ground motion medians at vertical cross sections of Figure 5, for a magnitude 7 event on hard rock (i.e.
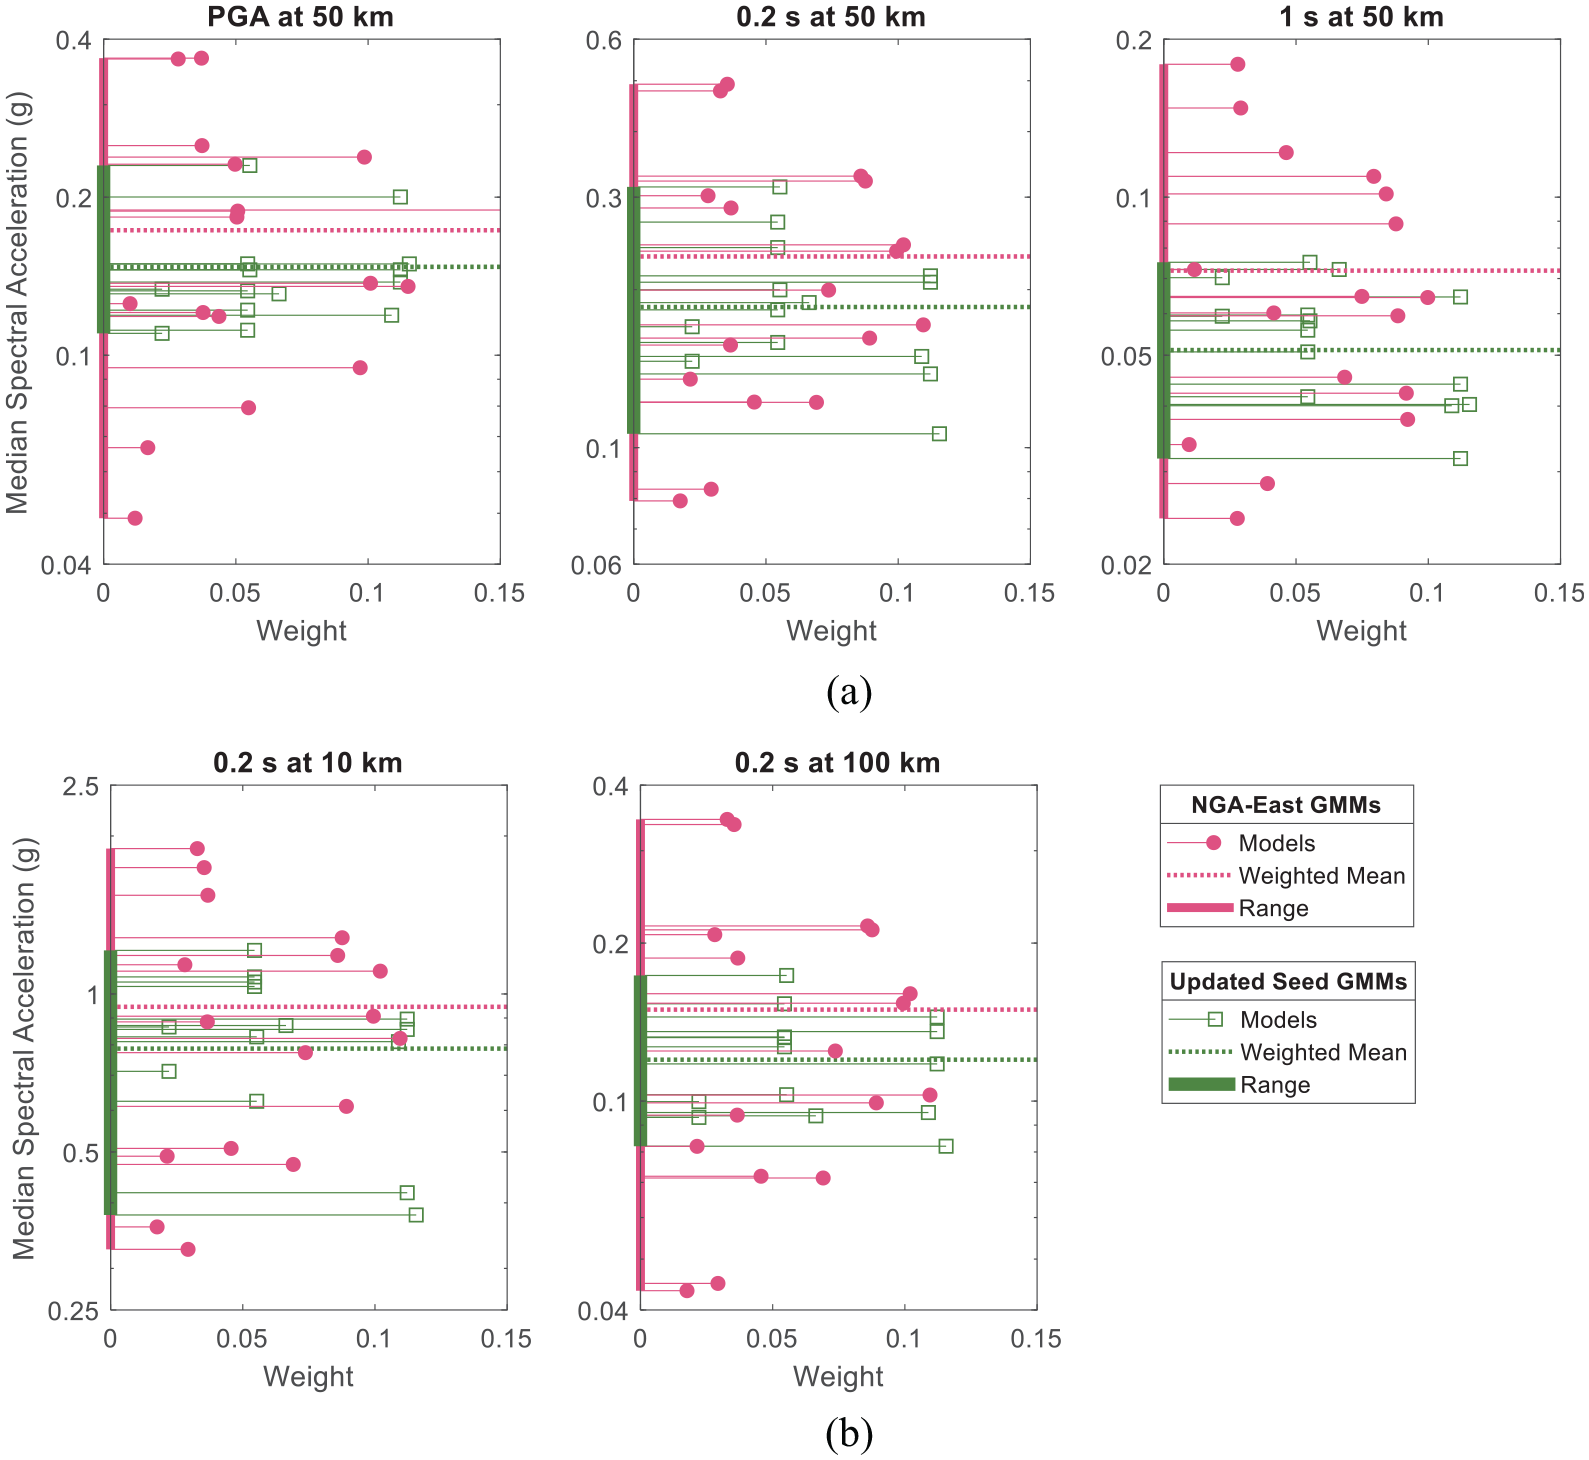
Epistemic uncertainty of NGA-East GMMs and updated seed GMMs represented by the range and distribution of ground motion medians at vertical cross sections of Figures 4 and 5, for a magnitude 7 event on hard rock (i.e.
As expected, for a magnitude 7 event, epistemic uncertainty of the 17 NGA-East GMMs is much larger and more similar to a continuous normal probability distribution than those of the 2014 GMMs (Figure 9) and the updated seed GMMs (Figure 10) as a result of the NGA-East approach of utilizing Sammon’s mapping process and resampling the ground motion space. For smaller magnitude events, the range of the 17 NGA-East GMMs are closer to those of the 2014 and the updated seed GMMs (electronic supplement, Figures A2 and A4). We attribute this to the availability of more small magnitude data and therefore a more similar representation of the ground motion space by different modeling approaches. However, even for smaller magnitude events, the epistemic uncertainty of NGA-East GMMs still provides a better representation of a continuous normal distribution.
Figures 9 and 10 illustrate that the NGA-East GMM weights more closely resemble a normal distribution with higher weights in the middle and lower weights at the highest and lowest ground motion values. The peripheral, lower weighted models are commonly those in the outer rings of the Sammon’s maps shown in Figure 6. In contrast, the weights of the 2014 GMMs and the updated seed GMMs are random and asymmetric reflecting the inherent subjectivity of the underlying GMM selection and weighting procedures. Although the NGA-East process may expand the range of GMMs and provide a more complete representation of the ground motion space, it may also have shortcomings that require further studies. For example, in Figures 9 and 10, note that at 0.2 s and 100 km, where the physics-informed seed GMMs show less variability compared with 10 km, possibly due to the flattening effect of Moho reflections discussed earlier (Figures 4b and 5b), the NGA-East GMMs show much more variability that is similar in the order of magnitude to that of 10 km. It is also worth noting that the weighted average of the NGA-East GMMs is at the upper end of the 2014 and the updated seed GMM values. Without observed data for large magnitude events in the CEUS, it is difficult to make a conclusion about the accuracy of the two sets of models. However, these considerations are reflected in the collective weights of 0.333 and 0.667, given, respectively, to the updated seed and NGA-East GMMs, based on a range of expert opinions and their confidence in each suite of models.
Whereas USGS NSHMs have historically focused on the mean hazard, or the center, with underlying logic trees of GMMs representing the body, the NGA-East GMMs expand on prior model distributions to better represent the full “range” of possible ground motions. This feature will prove important as the USGS moves toward complementing mean hazard results with estimates of uncertainty in future NSHMs.
Aleatory variability
Aleatory variability (GMM standard deviation) accounts for the random variability that is naturally present in ground shaking for a given magnitude, distance, and site condition. Unlike the 2008 and 2014 NSHMs, for which each GMM was assigned a different independently developed standard deviation, the 2018 NSHM uses the same standard deviation model for all GMMs. The NGA-East GMMs included a logic tree of standard deviation models (Al Atik, 2015), the most heavily weighted branches of which are largely based on ground motion observations from the richer dataset available in the WUS. The lower weight branches considered data from small to moderate magnitude earthquakes, large-magnitude simulations, and the potential for greater variability in site response in the CEUS for sites with similar
The 2018 NSHM does not use the NGA-East (Al Atik, 2015), Graizer16, Graizer17, or SP16 recommended standard deviation models, but rather uses a modified version of the NGA-East recommended model as described in Petersen et al. (2020) and shown in Figure 11. Figure 11 also shows standard deviation models of the nine 2014 GMMs for comparison. Note that the 2018 model falls in the middle of the range, indicating little overall change to aleatory variability relative to 2014. Petersen et al. (2019) show the sensitivity of hazard values to the 2014 and 2018 aleatory variability models, demonstrating that they are not significantly different. The 2008 standard deviation models were largely identical to the 2014 models and are not shown in Figure 11.
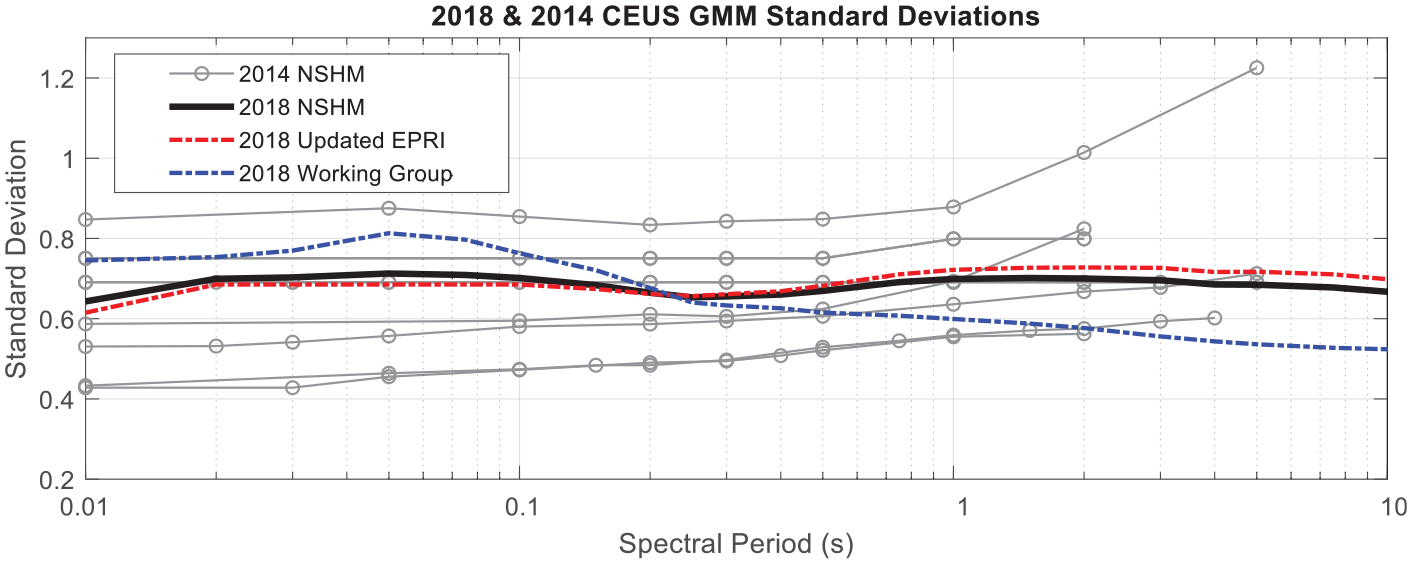
The two CEUS aleatory variability models (“2018 Updated EPRI” and “2018 Working Group”), used for all 31 GMMs in the 2018 NSHM, and their SRSS combination (“2018 NSHM”), superimposed on standard deviation models of the nine 2014 GMMs for a magnitude 7 event on hard rock
In the NGA-East for USGS report, Goulet et al. (2017) recommend an updated version of the Electrical Power Research Institute (2013) aleatory variability model. This model consists of the final published total inter-event, τ, and intra-event, ϕ, aleatory variability terms of NGA-West2 with CEUS adjustments (Al Atik, 2015). However, concerns arose at the 2018 NSHM workshop that we should consider additional site-to-site variability, ϕS2S, arising from lack of knowledge of site conditions in the CEUS and from
The final standard deviation model incorporated in the 2018 NSHM consists of a logic tree of the NGA-East recommended model with 0.8 weight (Goulet et al., 2017, denoted “2018 Updated EPRI” in Figure 11), and an alternate model that includes the working group site-to-site variability term, ϕS2S, with 0.2 weight (denoted “2018 Working Group” in Figure 11). Petersen et al. (2019) explores the sensitivity of hazard values to each of these models, assuming hypothetical weights of 1 for each model. The final USGS implementation of this logic tree computes hazard for all pairings of CEUS median GMMs and the two aleatory variability models. As shown in Figure 11, the “2018 Working Group” model is higher at short periods and lower at long periods compared with the WUS-based “2018 Updated EPRI” model. The main reason for the higher short-period values is the relative preponderance of short-period resonances in the CEUS compared with the WUS sites. Because these effects are observed in available CEUS data, but are not taken into account in the
Goulet et al. (2017) consider additional epistemic uncertainty on τ and ϕ SS terms and provide period-dependent coefficients for each. The working group model did not include such branching, and we therefore elected to use only the central branches of the τ and ϕ SS terms in the final model. Sensitivity studies show that this has little effect on the mean hazard.
The final standard deviation model in the 2018 NSHM is a function of period, magnitude, and
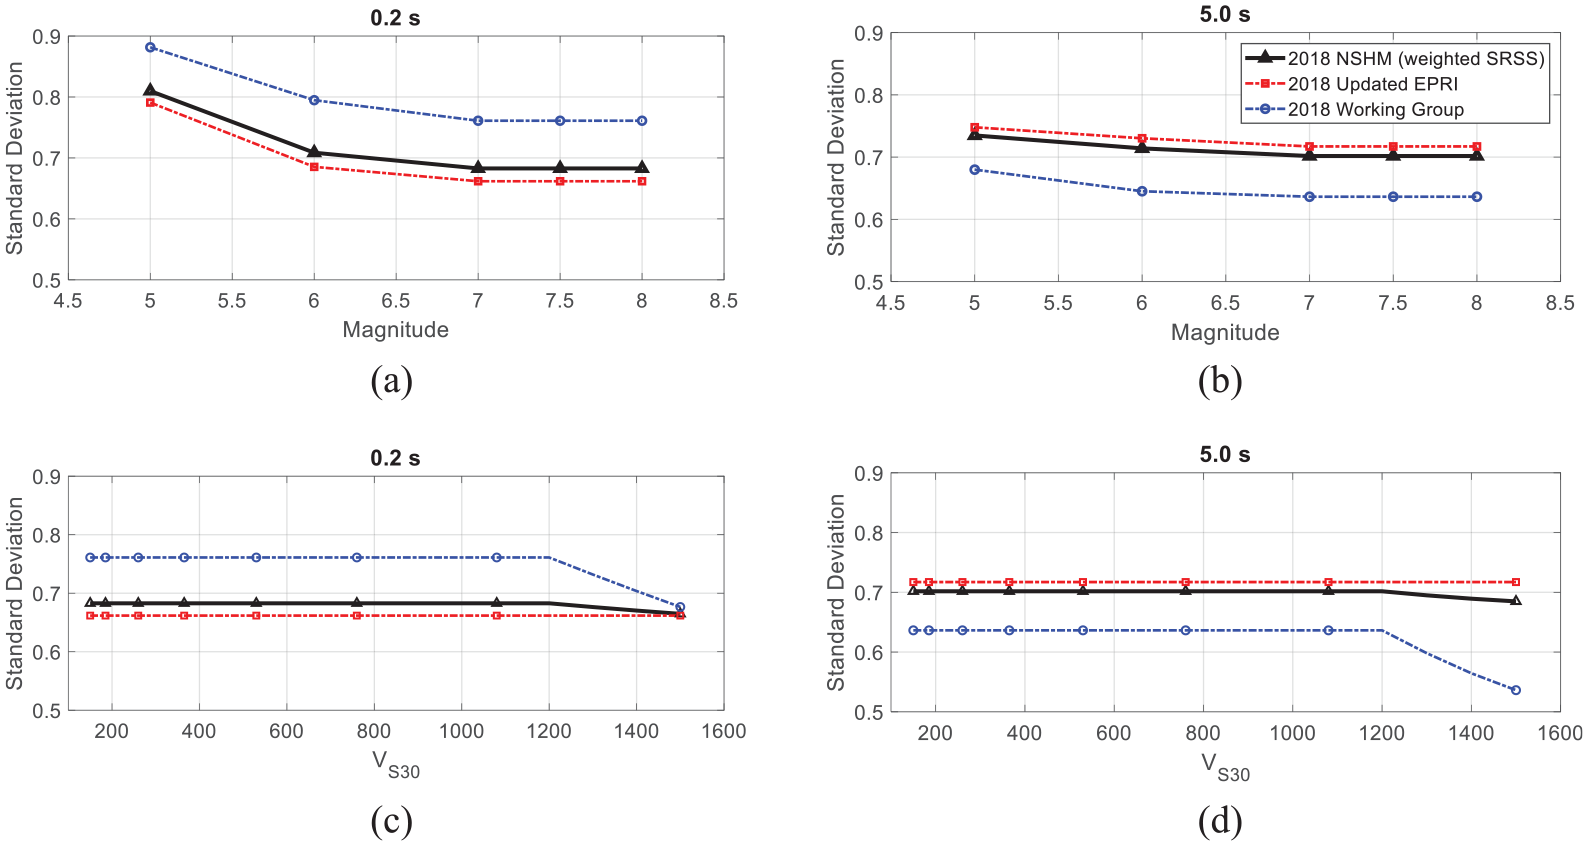
Standard deviation models used in the 2018 NSHM plotted versus magnitude at spectral periods of (a) 0.2 s and (b) 5.0 s, and versus
Site-effect model
Prior to the 2018 update, NSHMs were only required to support hazard calculations at one reference site condition defined by
In the 2018 NSHM implementation, uncertainties associated with each model term are assumed to be independent and the total site-effect standard deviation,
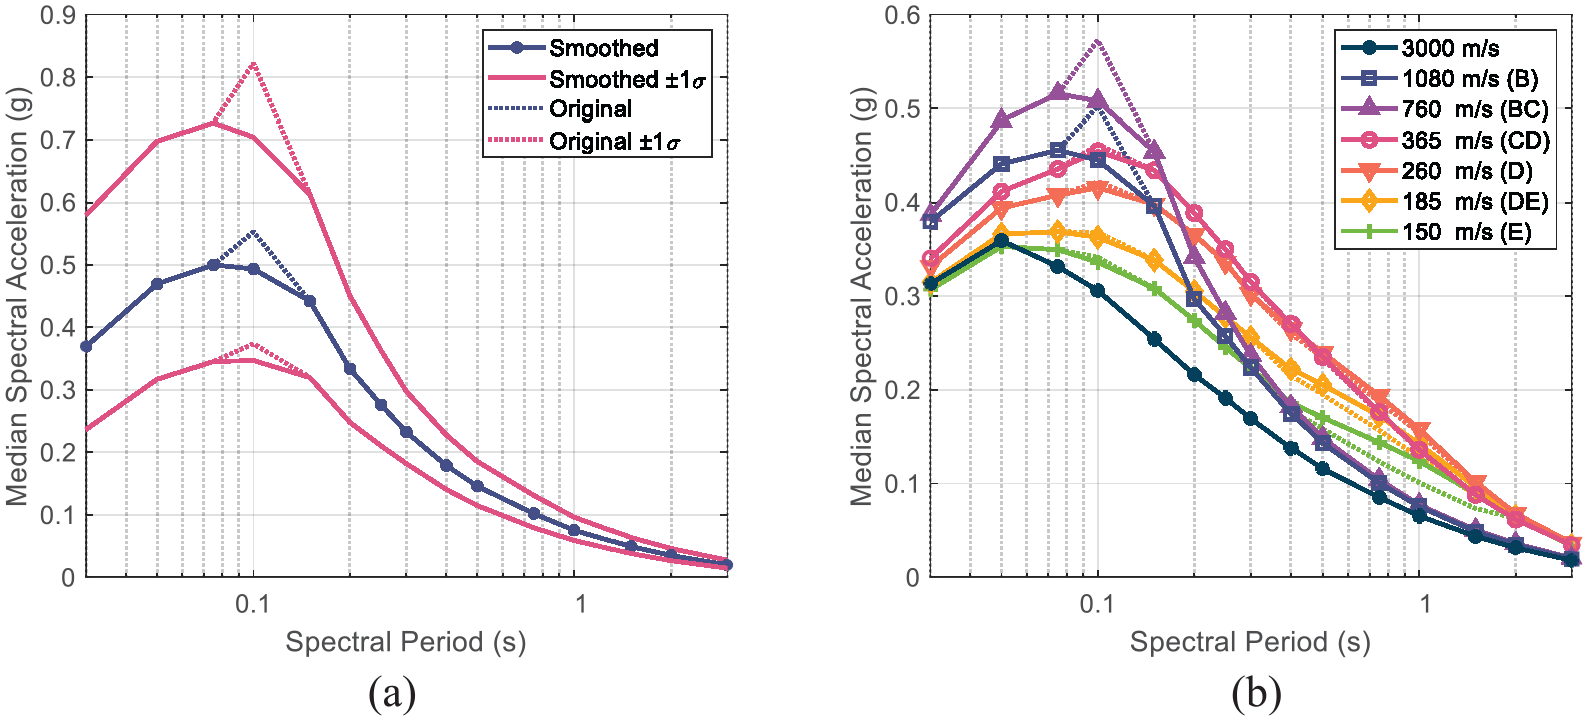
Response spectra for a magnitude 7 earthquake at 50 km, using the weighted average of the 2018 GMM medians at (a) the reference site condition of
Subsequent to initial publication of the linear model terms (Stewart et al., 2017), exchanges between the USGS and the working group led to a variety of model improvements, including (1) providing coefficients for peak ground velocity (PGV) and additional spectral periods (consistent with the intensity measures supported by the final NGA-East GMMs (Table 1), (2) adjustments to the
Despite evidence for the 0.1 s peak in stiff CEUS site ground motions and the modeling framework giving greater weight to the gradient-based model for softer sites, the NSHM team and Steering Committee expressed concern about the strong peak in the simulation-based
Subsequent to initial publication of the nonlinear model, Hashash et al. (2020) proposed alternate interpretations for the soft soil “1 s shoulder” in the response spectra, which can be seen in Figure 13b as dotted lines around 0.4–1.5 s for site classes D, DE, and E. This “1 s shoulder” feature is caused by nonlinear de-amplifications for strong shaking at periods shorter than about 1 s and can either be a physical period-dependent resonant effect, or a modeling artifact and due to the cutoff period of the nonlinear de-amplification model. Given that it may be a modeling artifact, Hashash et al. (2020) compute a set of adjusted coefficients and recommend a final model that gives half-weight to each interpretation (dotted and solid lines near 1 s in Figure 13b). This recommendation was not available in time for inclusion in the 2018 NSHM but will likely be considered in future updates.
Other implementation details
When computing hazard, the USGS truncates the distribution of ground motions at 3 standard deviations to avoid unacceptably large ground motions at shorter periods, where the peak of the spectrum is usually observed (Frankel et al., 1996, 2002; Petersen et al., 2008, 2014). In the CEUS, the USGS has historically also capped the median ground motion at 1.5g for PGA and 3g for 0.2-s spectral acceleration, and further truncated the distribution of ground motion at 3g for PGA and 6g for 0.2-s spectral acceleration when these values are less than the 3 standard deviation cutoff. The capping and truncation also recognized that the ground motion values from point-source simulations were not as reliable for magnitude 8 earthquakes at very short distances less than about 20 km (Frankel et al., 1996). This practice was maintained from the 1996 NSHM up through the 2014 NSHM.
For the 2018 NSHM, due to the addition of spectral periods and site classes, we revisited this practice. Prior NSHMs were only concerned with producing mean hazard at three spectral periods for which this capping and truncation practice ensured that ground motions were less than about 2g for a 2% in 50-year return period (the primary return period of concern for building codes of the time). However, this came at the expense of collapsing the upper end of the underlying epistemic uncertainty distribution; multiple GMMs were restricted to the same median, yielding flat-topped response spectra. With the replacement of all CEUS GMMs in the 2018 NSHM, this practice is discontinued for several reasons. First, the NGA-East and updated seed GMMs include a magnitude saturation effect that limits large ground motions as magnitude increases. Second, continuing the practice would necessitate adapting the capping and truncation rules to shorter spectral periods (the peak usually happens below 0.2 s in the CEUS). Third, with an increased focus on quantification of uncertainty by the USGS moving forward, it does not make sense to apply modifications that collapse the uncertainty distribution.
Implications of GMM changes on hazard
This section shows the combined effects of changes in GMM medians, epistemic uncertainty, and standard deviations on hard-rock site conditions over the last two NSHM cycles. We calculated uniform hazard maps for 2% probability of exceedance in 50 years for the CEUS for 0.2- and 1-s spectral periods using the 2014 NSHM source model. One map uses the 2008 GMMs and the other uses the 2014 GMMs. Figure 14 shows the difference and ratios between these two maps at the two spectral periods. Figure 15 shows the same comparison, using the 2014 NSHM source model but paired with the 2014 GMMs and the 2018 GMMs. Note that these maps are not representative of the total change in hazard given the use of the same source model; they only show the effects of GMM updates discussed in this article. Petersen et al. (2019) provide maps that show the total changes in hazard, including source model updates. Difference and ratio maps for more common site classes in the CEUS are not presented because such maps were not developed in the 2008 and 2014 NSHMs due to site class limitations of CEUS GMMs in those cycles (Table 2).
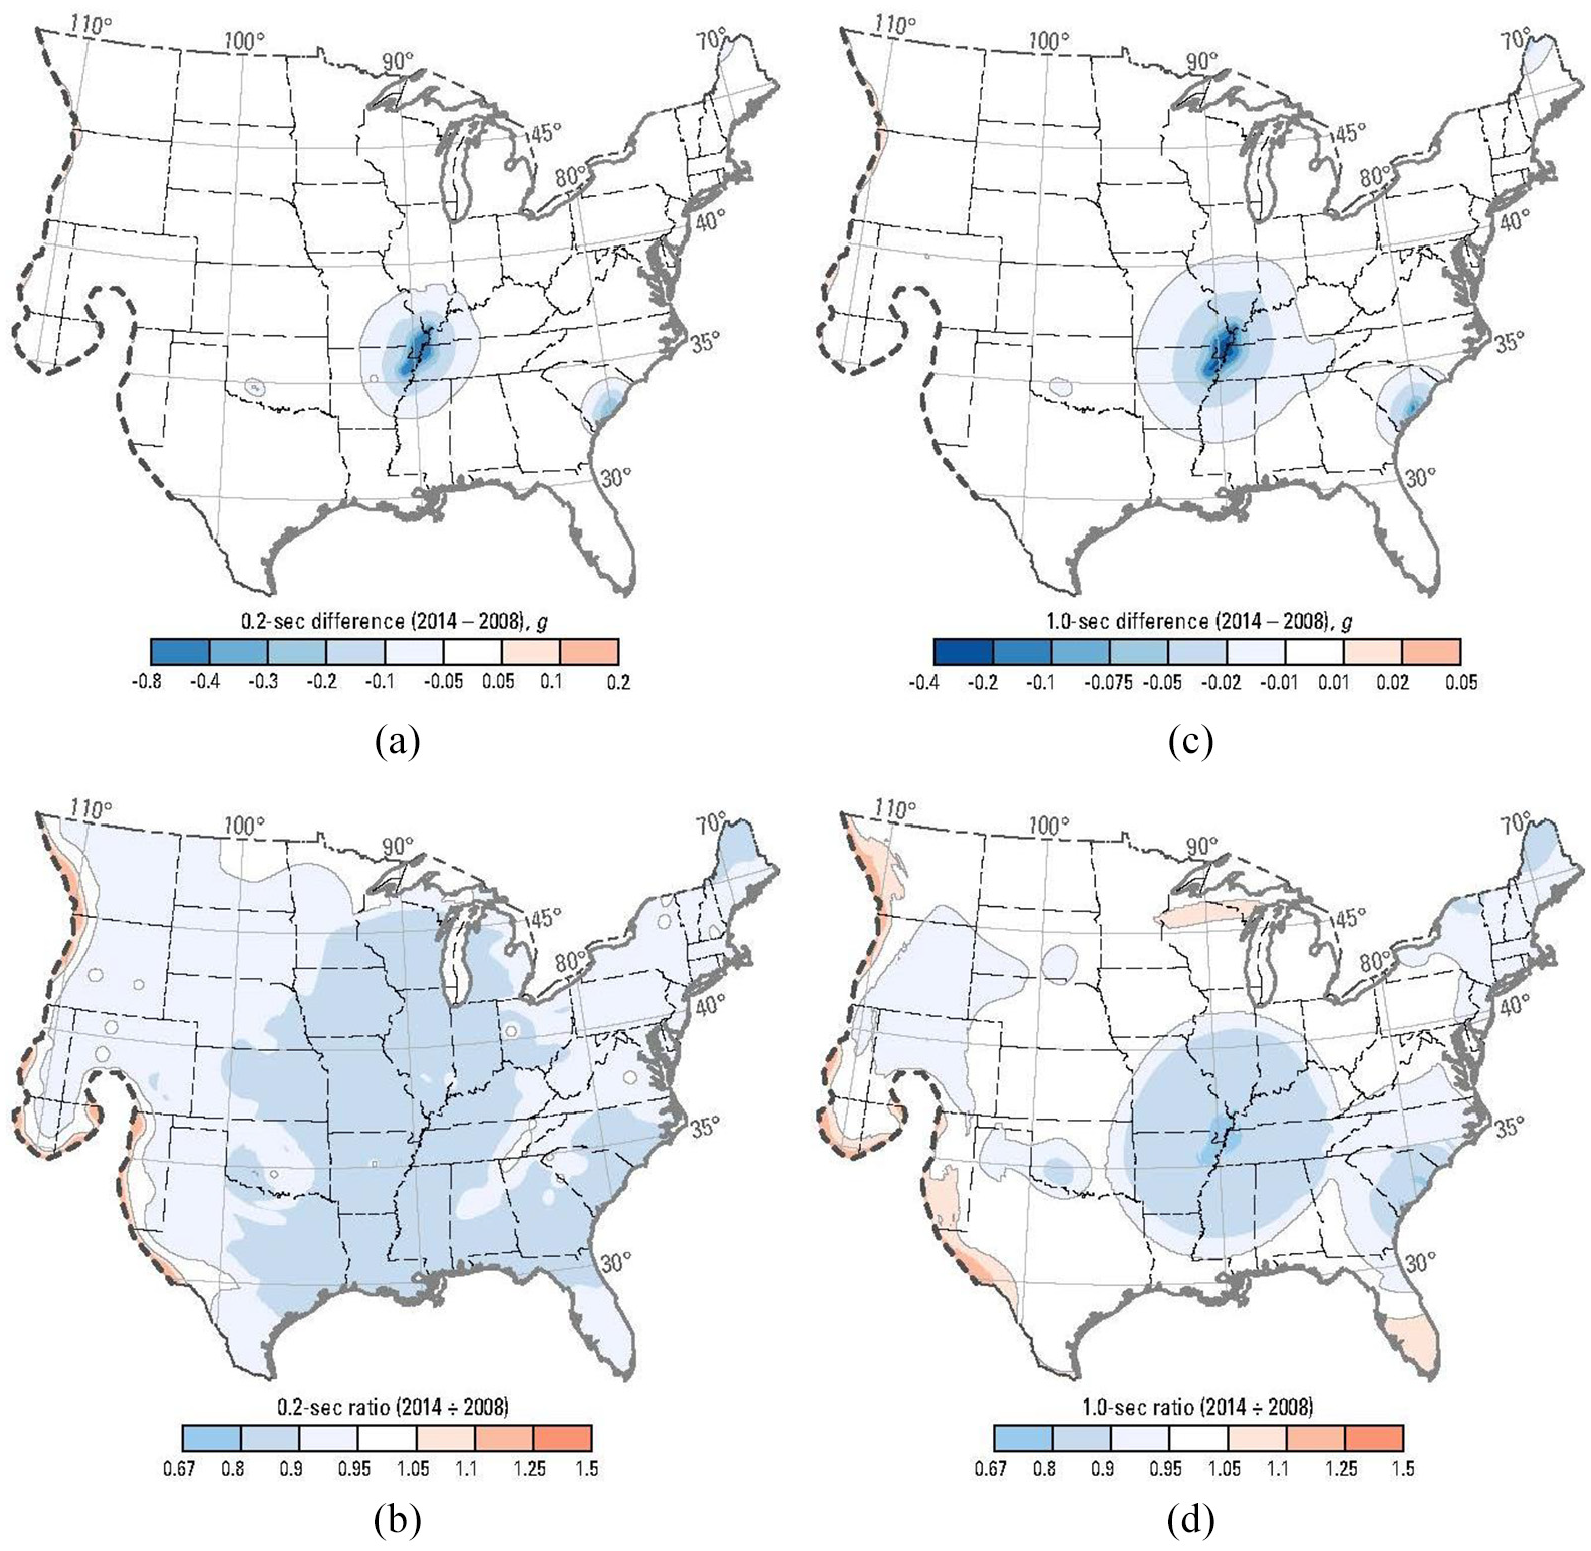
Differences and ratios in ground motions with 2% probability of exceedance in 50 years hazard level, using the 2008 and 2014 CEUS GMMs (both using the 2014 NSHM source model). Maps are provided for 0.2 and 1 s spectral periods on a uniform hard rock site condition: (a) differences between 2014 and 2008 GMMs at 0.2 s, (b) ratios between 2014 and 2008 GMMs at 0.2 s, (c) differences between 2014 and 2008 GMMs at 1 s, and (d) ratios between 2014 and 2008 at 1 s.
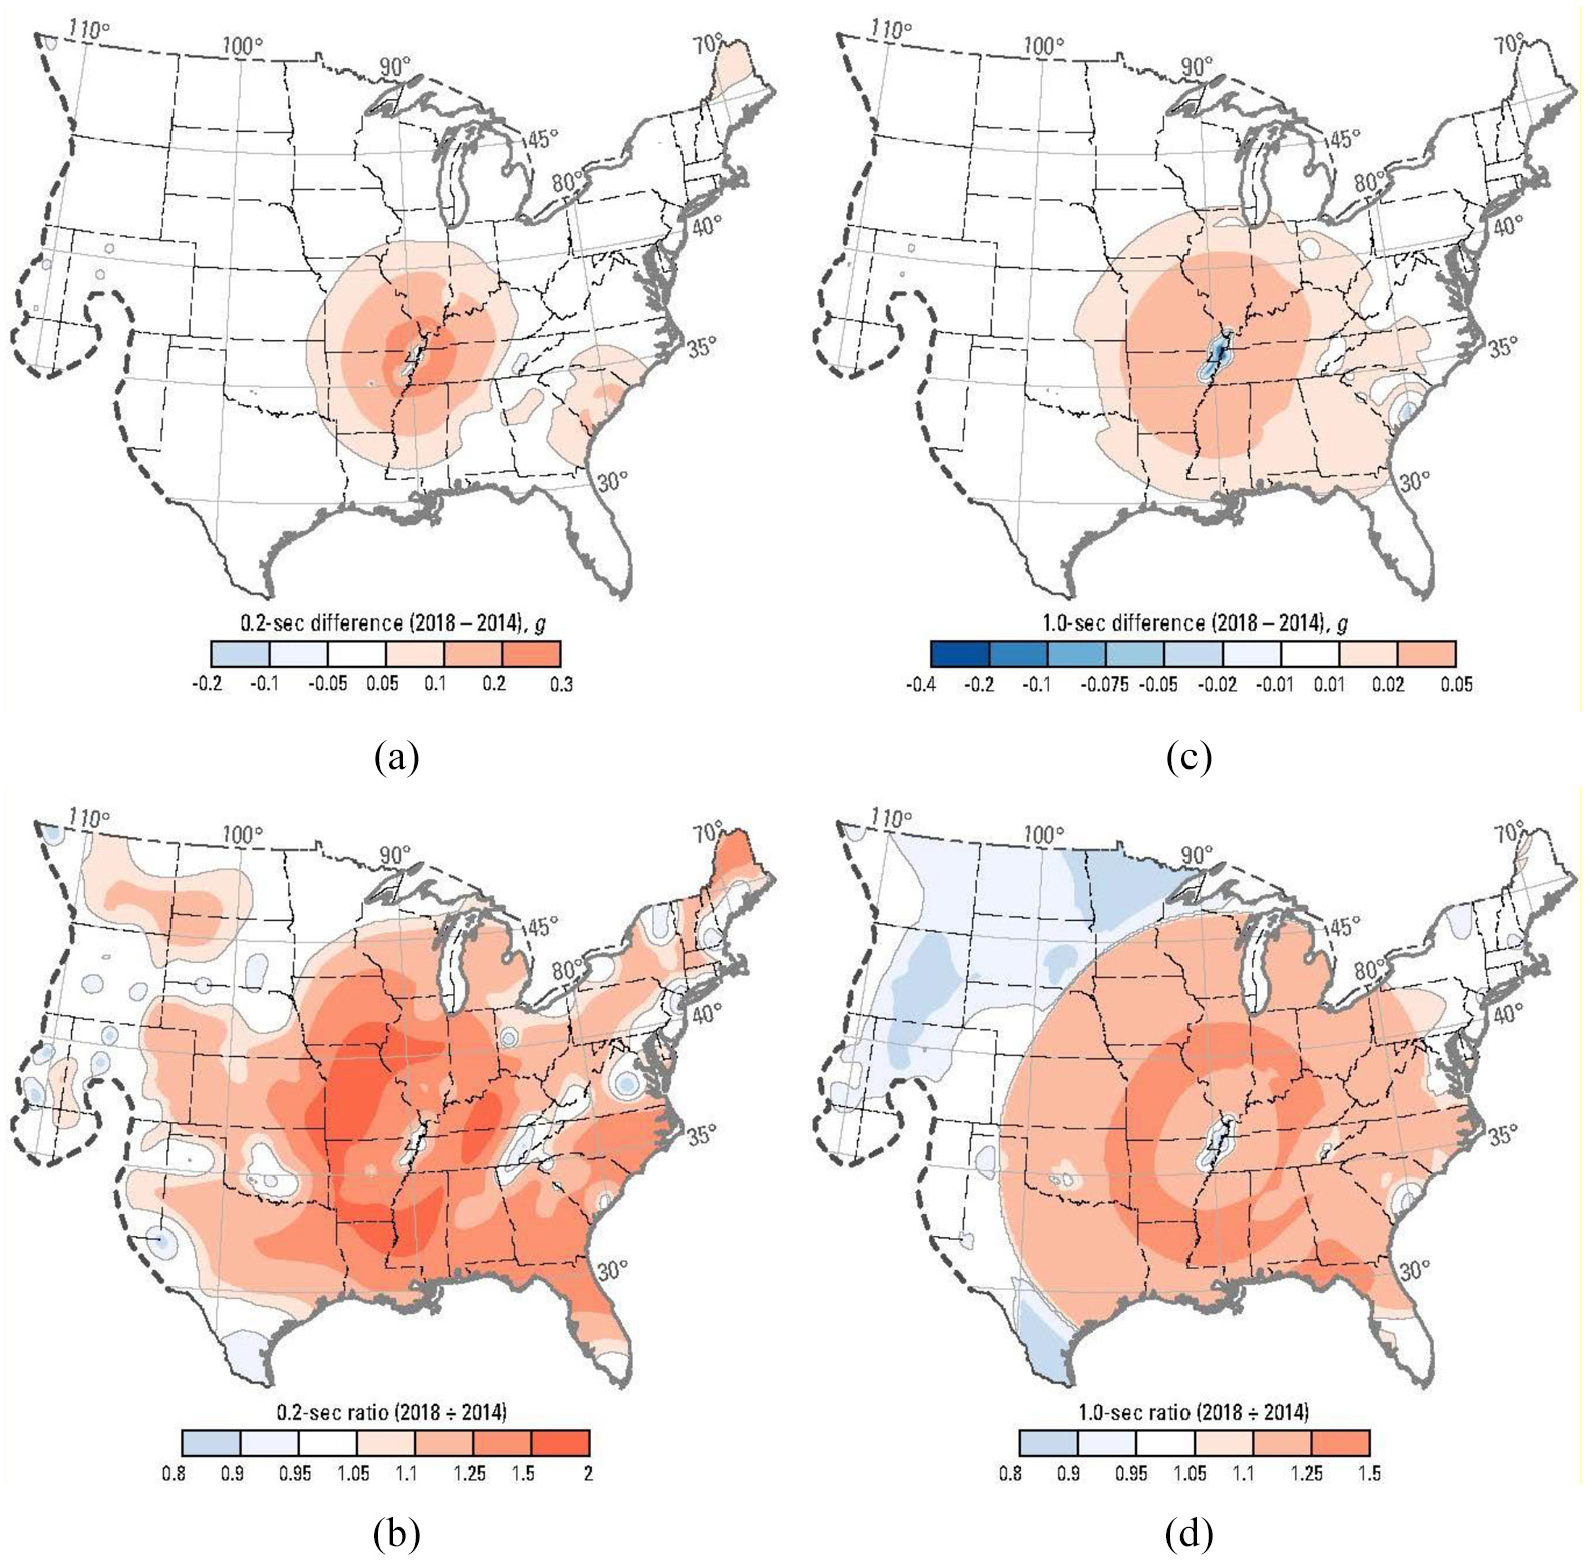
Differences and ratios in ground motions with 2% probability of exceedance in 50 years hazard level, using the 2014 and 2018 CEUS GMMs (both using the 2014 NSHM source model). Maps are provided for 0.2 and 1 s spectral periods on a uniform hard rock site condition: (a) differences between 2018 and 2014 GMMs at 0.2 s, (b) ratios between 2018 and 2014 GMMs at 0.2 s, (c) differences between 2018 and 2014 GMMs at 1 s, and (d) ratios between 2018 and 2014 GMMs at 1 s.
In the 2014 NSHM update, the primary changes to the 2008 CEUS GMMs were the addition or update of three GMMs and the use of a different weighting methodology (Rezaeian et al., 2015). More weight was given to models that attenuate faster with distance (
In contrast to the 2014 NSHM update, the 2018 NSHM update incorporates significant changes to the median ground motion values (lower for small magnitude events and higher for large magnitude events at middle to large distances; Figures 7 and 8), epistemic uncertainty (higher in all cases but much greater for large magnitudes and middle to large distances; Figures 5b and 9), and aleatory variability (not significantly different; Figure 11). The overall effects of these changes on hazard are shown in Figure 15 for the two periods of 0.2 and 1 s. Ground motions increase in a ring around the New Madrid seismic zone due to the increase in median ground motions and epistemic uncertainty at middle to large distances (60–100 km), but a negligible change in median ground motion at short distances for large magnitude events. The median increase at middle to large distances is partly due to the updated seed GMMs, but mainly due to the larger NGA-East GMMs as a result of slower attenuations with distance and their subtle representation of Moho reflections (Figures 5b and 9b). The epistemic uncertainty increases for large magnitude events at all distances, resulting in some increase in mean hazard everywhere; but because this increase is even greater at distances of about 100 km (Figures 5b and 9b), it further contributes to the ring around the New Madrid seismic zone. The outer boundary of the ring could be a result of the New Madrid source being less dominant at larger distances. On the contrary, the ground motions in the vicinity of the East Tennessee seismic zone decrease. This is due to the high rate of smaller magnitude events that control the hazard in this region. For smaller magnitudes, the median ground motion is slightly lower than the 2014 NSHM (Figures 7 and 8), and the epistemic uncertainty does not increase as much as it does for large magnitude events. Likewise, in the areas outside of the New Madrid seismic zone, where background gridded seismicity with lower magnitude events control the hazard (e.g. Oklahoma, Virginia, New York), ground motion decreases due to the changes in 2018 CEUS GMMs.
Future work
Starting with the 2018 NSHM, the USGS is putting noteworthy effort into quantifying and publishing the uncertainty in the model. Doing so is aided by improved characterization of epistemic uncertainty like that provided by the NGA-East GMMs. To improve future updates of the NSHM, the NGA-East approach of attempting to represent a continuous distribution of GMMs and its adoption in PSHA should be studied beyond the CEUS. More studies are required to understand the reason for NGA-East GMMs being higher in terms of both medians and epistemic uncertainty at distances greater than 60 km for large magnitude events compared with the 2014 and the updated seed GMMs. Finally, more research is necessary to understand whether the slower attenuations with distance, the subtle representation of the Moho reflections, and the large epistemic uncertainty at middle to large distances are real physical features that should be preserved or unintentional consequences of the NGA-East approach that should be modified.
As also noted by the site-effect model working group, it is preferable to coordinate the development of GMMs and site-effect models in future updates of the NSHM (Stewart et al., 2020). This was not possible in the time frame leading up to publication of the 2018 NSHM. Moving forward, the USGS encourages coordinated development of median ground motion, aleatory variability, and site-effect models. Although the site-effect model presented in this article was a significant improvement in the CEUS, more studies are required to improve this model for future NSHM updates. Examples include considering additional site parameters such as resonant frequency, regionalization of the model for Atlantic and Gulf coastal plains, and inclusion of non-ergodic models.
In the next update of the NSHM, other CEUS considerations include support for additional intensity measures such as PGV, improvements to the nonlinear site-effect model by Hashash et al. (2020), and as always, additions or modifications to existing median GMMs, epistemic uncertainty, aleatory variability, and site-effect models.
Summary
The USGS NSHMs are used in building design applications, which traditionally have been based on ground motions from three spectral periods at one reference site class. The 2018 NSHM update is influenced by the new MPRS recommendations of Project 17 for future generations of building design regulations that call for hazard results from 22 spectral periods and 8 site classes defined by their
Supplemental Material
sj-pdf-1-eqs-10.1177_8755293021993837 – Supplemental material for The 2018 update of the US National Seismic Hazard Model: Ground motion models in the central and eastern US
Supplemental material, sj-pdf-1-eqs-10.1177_8755293021993837 for The 2018 update of the US National Seismic Hazard Model: Ground motion models in the central and eastern US by Sanaz Rezaeian, Peter M Powers, Allison M Shumway, Mark D Petersen, Nicolas Luco, Arthur D Frankel, Morgan P Moschetti, Eric M Thompson and Daniel E McNamara in Earthquake Spectra
Footnotes
Acknowledgements
The authors thank the U.S. Geological Survey (USGS) Earthquake Hazards Program for funding the development of the 2018 NSHM, the USGS Steering Committee for providing helpful input in developing the 2018 NSHM, and the numerous NGA-East researchers with whom they coordinated. Special thanks are due to Robert Graves, Yousef Bozorgnia, and Christine Goulet who were instrumental in helping to select the final suites of updated seed and NGA-East GMMs. The authors acknowledge the continued contributions and input from all GMM developers mentioned in this manuscript, including David Boore, Nico Kuehn, Norm Abrahamson, Gail Atkinson, Jonathan Stewart, Kenneth Campbell, Vladimir Graizer, and Shahram Pezeshk. They also thank Kenneth Rukstales for helping with the map figures and finally Grace Parker, Oliver Boyd, Jonathan Stewart, Albert Kottke, and David Wald for their review and invaluable feedback.
Declaration of conflicting interests
The author(s) declared no potential conflicts of interest with respect to the research, authorship, and/or publication of this article.
Funding
The author(s) received no financial support for the research, authorship, and/or publication of this article.
Additional resources
An electronic supplement is provided with this manuscript that contains additional Figures (A1–A8) for interested readers. The code used to perform PSHA, including GMM calculations that are used to develop many of the figures in this article, is available as part of the nshmp-haz software and associated web services and applications at https://doi.org/10.5066/F7ZW1K31 (Powers, 2017).
Supplemental Material
Supplemental material for this article is available online.
Notes
References
Supplementary Material
Please find the following supplemental material available below.
For Open Access articles published under a Creative Commons License, all supplemental material carries the same license as the article it is associated with.
For non-Open Access articles published, all supplemental material carries a non-exclusive license, and permission requests for re-use of supplemental material or any part of supplemental material shall be sent directly to the copyright owner as specified in the copyright notice associated with the article.