
Abstract
Sites located in the Sacramento-San Joaquin Delta region of California typically have peaty-organic soils near the ground surface, which are characteristically soft, with shear wave velocities as low as 30 m/s. These unusually soft geotechnical conditions, which are outside the range of applicability of existing ergodic site amplification models, can be anticipated to produce significant site effects during earthquake shaking. We evaluate site response for 36 seismic stations in the Delta region using non-ergodic methods with low-amplitude ground motion data. We model first-order site effects using a period-dependent relation conditioned on the 30 m time-averaged shear wave velocity (VS30). Relative to extrapolations of global ergodic models, this Delta-specific model provides lower and higher levels of amplification for short and long periods, respectively. While the local model provides unbiased predictions for Delta sites as a whole, it smooths over site-specific effects such as resonant peaks. Microtremor-based horizontal-to-vertical spectral ratios (mHVSRs) were measured for 34 sites, from which additional site parameters such as peak frequency (fp), peak amplitude (ap), and average mHVSR amplitude over some frequency bandwidth (
Introduction
The ground motion models (GMMs) used in California are from the Next Generation Attenuation (NGA) West2 project (Bozorgnia et al., 2014) and have site response components that apply either globally for active tectonic regions (e.g. Boore et al., 2014; hereafter BSSA14) or for broad regions (e.g. California vs Japan; Campbell and Bozorgnia, 2014). However, differences have been observed when investigating site effects at more local scales (e.g. Landwehr et al., 2016; Nweke et al., 2022). The application of ergodic site response models to regions with soils having unusual characteristics, such as the Sacramento-San Joaquin Delta region of California (hereafter Delta), carries large epistemic uncertainty. The peaty-organic soils in the Delta produce typical time-averaged shear wave velocities in the upper 30 m (VS30) lower than 150 m/s (Figure 1c), which is softer than the lower limit for NGA-West2 site response models. Furthermore, the soft soils in the Delta typically overlie relatively firm, non-organic soils, which can give rise to more pronounced impedance and resonance effects than would be typical at non-Delta sites. These features of site response are not captured by common VS30-based models, although they could be potentially captured with the addition of site response terms conditioned on peak frequency (fp) as a site parameter (e.g. Harmon et al., 2019; Hassani and Atkinson, 2018a, 2018b; Kwak et al., 2017; Wang et al., 2022a).
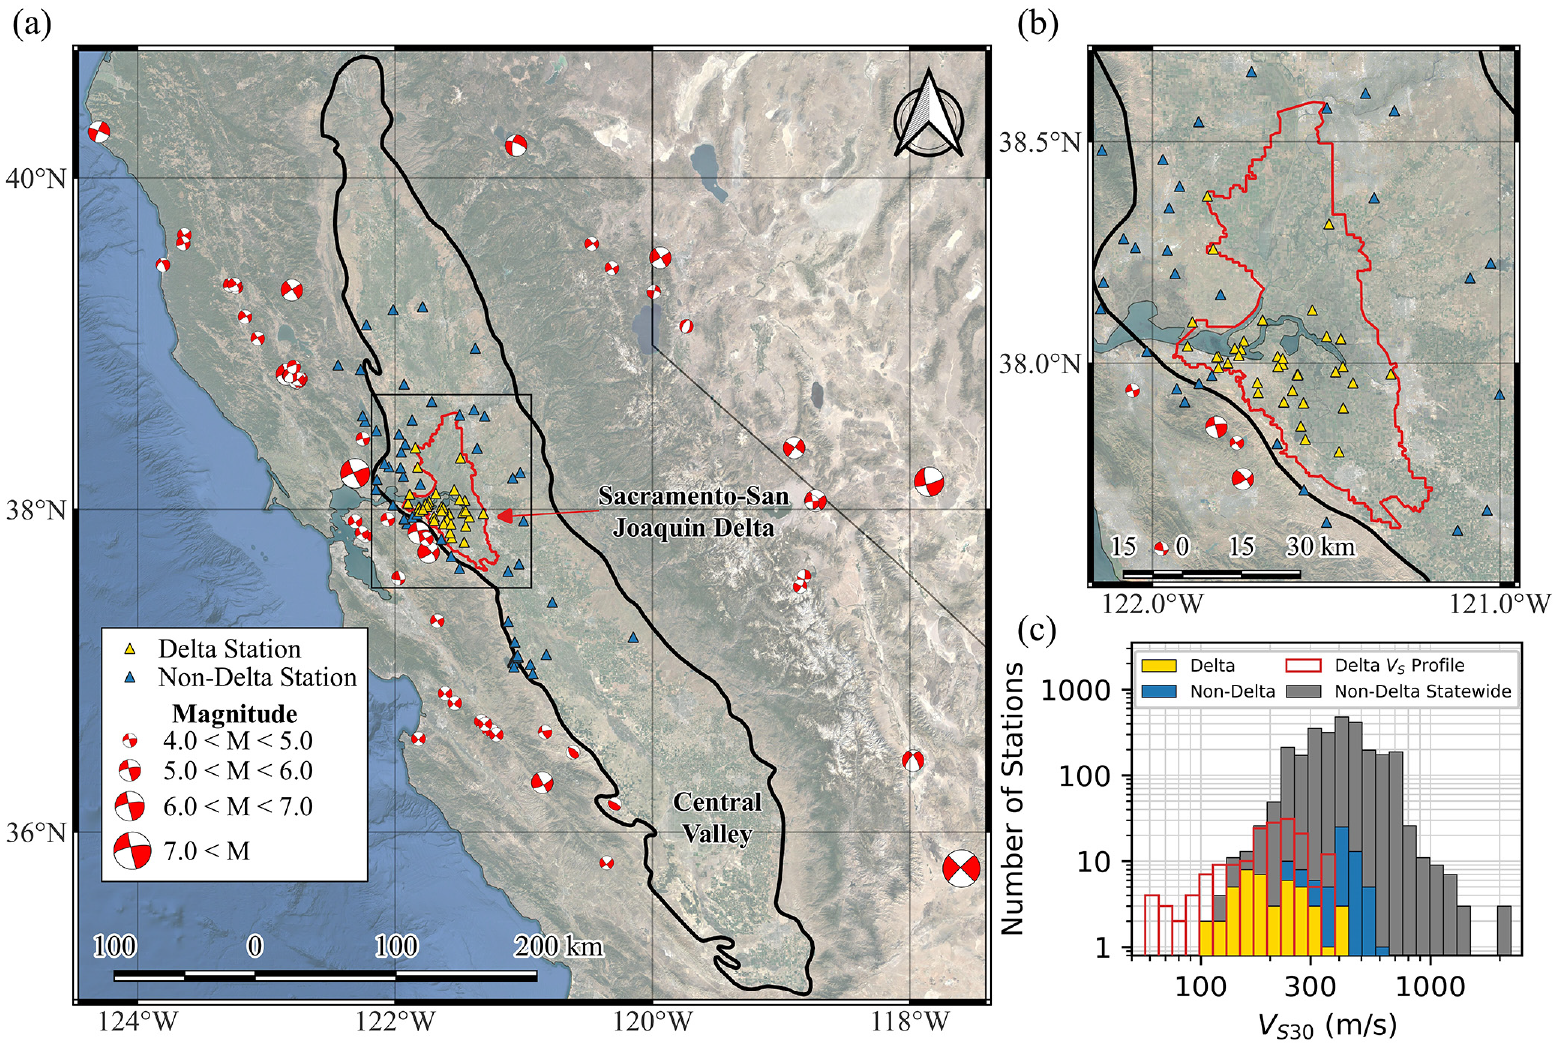
(a) Locations of earthquakes in California and western Nevada recorded by Delta stations (boundary of Central Valley is from Buckreis et al., 2023b); (b) inset map showing locations of Delta stations within the Delta jurisdictional boundaries given by Department of Water Resources (2018); and (c) distribution of VS30 from “Delta” (yellow) and “non-Delta” (blue) stations used in this study, from VS profiles measured in the Delta irrespective of whether they are located near a ground motion station (“Delta VS Profile”; red-outline), and from all California sites (gray) in the national database (Kwak et al., 2021).
Accordingly, the ergodic site terms in current GMMs used in California are expected to have bias and large uncertainty when applied to peaty-organic sites, such as those encountered in the Delta. In this article, we utilize a subset of an expanded ground motion database (relative to NGA-West2) to develop a local linear site response model based on features of site response derived from non-ergodic analyses. We condition our model on VS30 as the primary site parameter, and present optional additive terms conditioned on parameters derived from microtremor-based horizontal-to-vertical spectral ratios (mHVSRs). The models presented here represent a refinement to the ergodic site response model in BSSA14 (i.e. Seyhan and Stewart, 2014; hereafter SS14). The results are expected to be useful for hazard and risk analyses in the Delta region. Moreover, the methodology developed for this study could be useful for future studies seeking to couple VS30 with mHVSR-based parameters for regional- or local-scale site response modeling.
Following this introduction, we describe the ground motion data set and site parameters upon which the site response models are developed. We then present data analyses that include non-ergodic methods using residual calculations. The results are used to develop the VS30-scaling model and the additive terms conditioned on mHVSR-based site parameters. We conclude by comparing the performance of the proposed models with SS14 and provide a summary and recommendations.
Data sources
Since 1969, the Delta has been instrumented by 54 distinct seismic stations operated at different times by the Berkeley Digital Seismograph Network (network code: BK, number of stations: 2), California Department of Water Resources (WR, 11), California Strong Motion Instrumentation Program (CE, 15), and the United States Geological Survey (NC, 1; NP, 14; and YU, 11). This section presents the data compiled for analysis of non-ergodic site response at these stations.
Ground motions and related metadata
We use a subset of the California ground motion database described in Buckreis et al. (2023a), which is a significantly expanded version of the NGA-West2 database (Ancheta et al., 2014) for California sites. We defer to that publication for details, but present here the selection criteria implemented as part of this work. We consider data from moment magnitude (
As shown in Figure 2, most of the data are associated with small magnitude events (
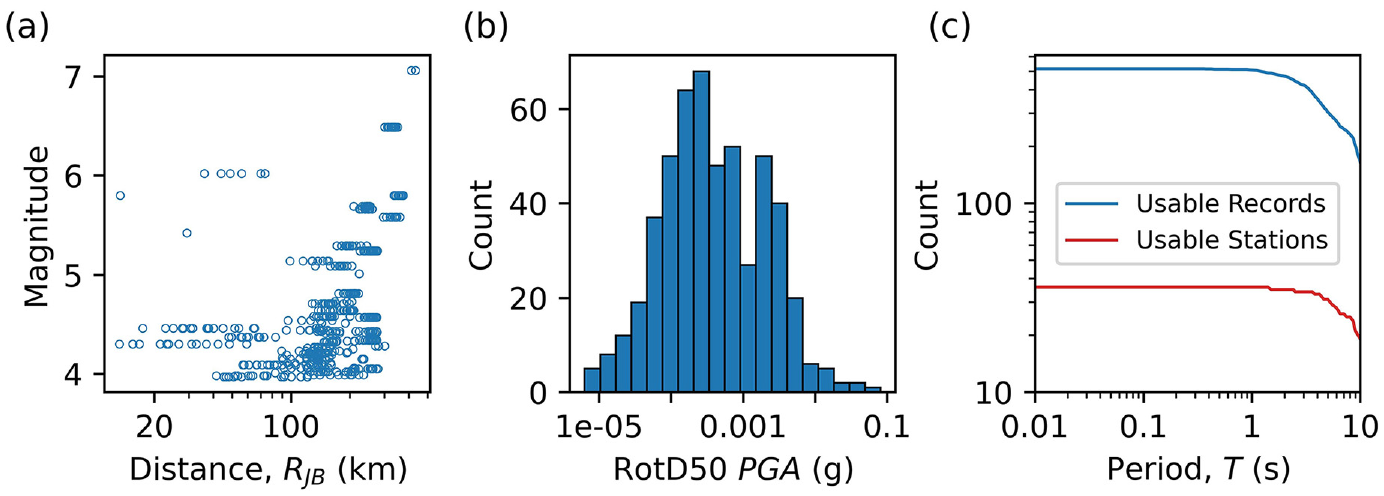
(a) Distribution of Delta ground motion records in magnitude versus distance space; (b) distribution of median-component (RotD50) peak ground accelerations (PGA); (c) number of usable records (T < 1/(1.25fc,hp), where fc,hp is the greater of the two high-pass corner frequencies selected during signal processing) and usable stations (each with at least four records) versus period.
Site conditions
The Delta is the largest freshwater tidal estuary on the west coast of the United States, which provides geologic conditions well suited for the deposition of peaty-organic soils (Drexler, 2011). Peat makes up about 18% of soils encountered within depths of 0–10 m across much of the Delta with notable exceptions on Sherman, Twitchell, and several other neighboring islands where deposits can be up to 15 m thick (Department of Water Resources (DWR), 2013, 2015). Underlying the peat are interbedded layers of clays, silts, and liquefiable sands. It is important to point out that not all Delta sites contain peat; therefore, the site effects associated with the peaty-deposits will not be observed across all Delta sites. This subsection presents the geotechnical data used to assign site parameters for the purpose of modeling local site response within the Delta. We have not considered sediment depth effects because the available basin depth model (USGS SFCVMv21.1; Hirakawa and Aagaard, 2021) provides uniform depth estimates (e.g. depth to 1000 m/s shear wave iso-surface, z1.0) across the study region.
Time-averaged shear wave velocity in the upper 30 m (VS30)
The most commonly used site parameter in site response models is VS30, which is computed as the ratio of 30 m to the shear wave travel time in the upper 30 m of the site (e.g. Borcherdt, 1994). Typical VS30 values in the Delta computed from measured VS profiles uploaded to the community shear wave velocity database (www.vspdb.org; Kwak et al., 2021) range from approximately 60 to 350 m/s (Figure 1c), where stations with VS30 > 275 m/s are unlikely to have peat. VS30 values at seismic stations lacking measured VS data are assigned using a locally calibrated peat-thickness proxy-based model (Buckreis, 2022) where peat-thickness is taken from nearby borings or cone penetration tests (CPTs), or is estimated using the approach of Deverel and Leighton (2010) in which kriging interpolation of peat thicknesses from over 1100 borings is applied. The range of VS30 values for Delta stations used in this study is from 100 to 390 m/s, as shown in Figure 1(c) and summarized in Table 1.
Metadata for the 36 Delta stations used in this study
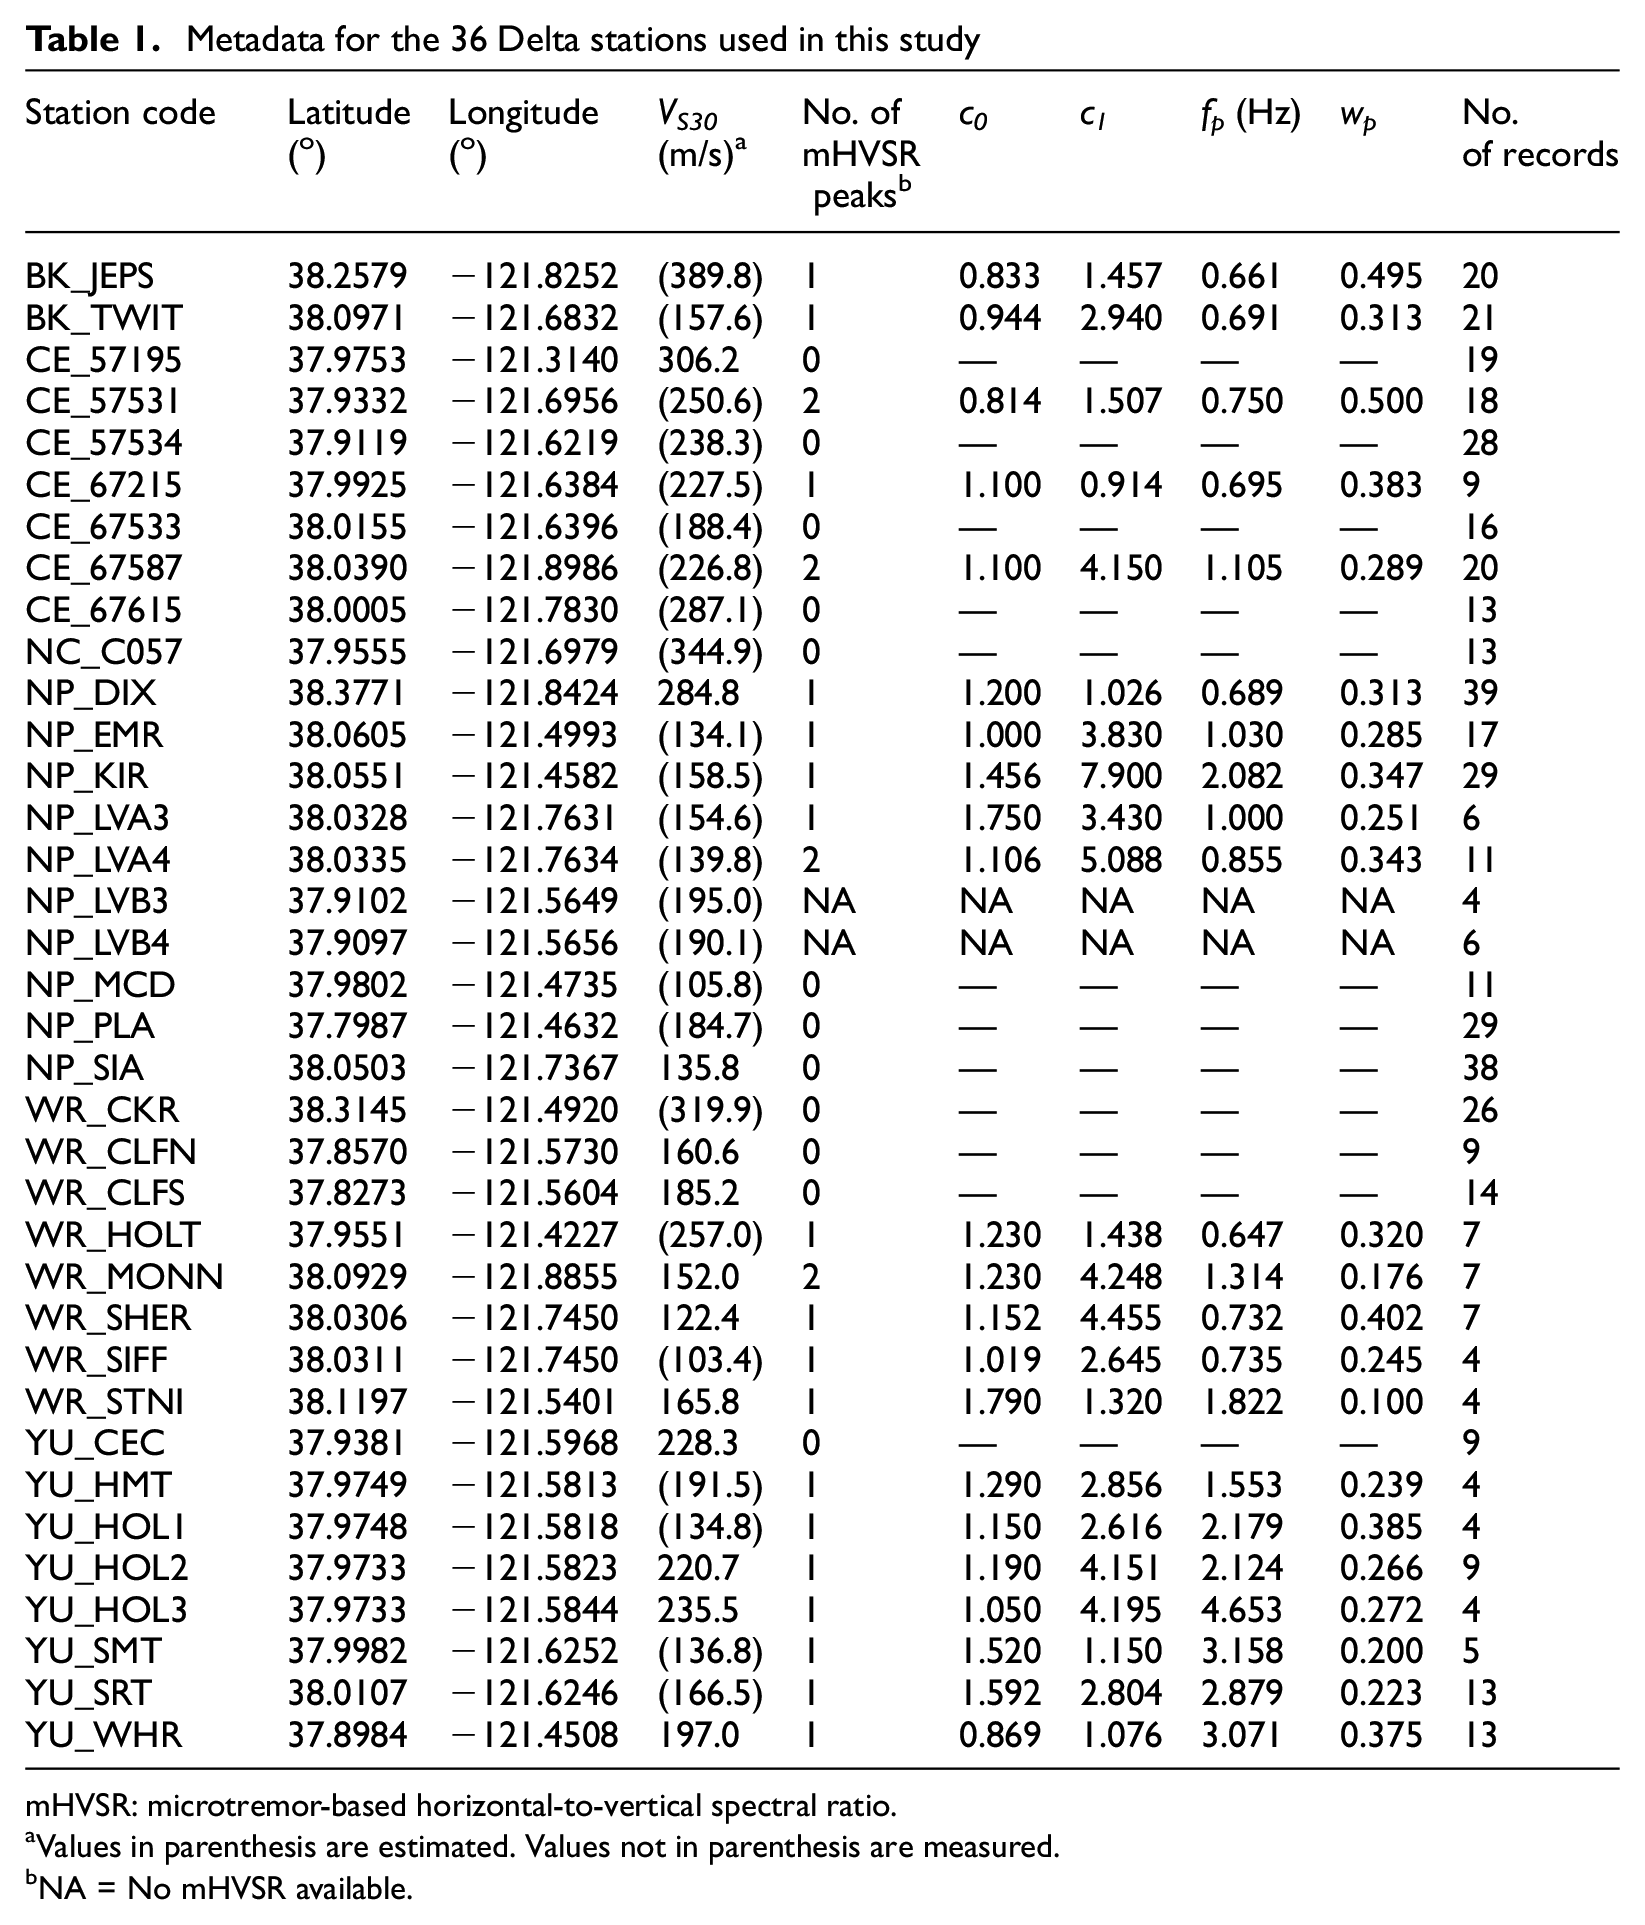
mHVSR: microtremor-based horizontal-to-vertical spectral ratio.
Values in parenthesis are estimated. Values not in parenthesis are measured.
NA = No mHVSR available.
Microtremor-based horizontal-to-vertical spectral ratios (mHVSR)
Peaks in amplitude–frequency mHVSR plots can identify resonance features in the site response (Bonilla et al., 1997, 2002; Cadet et al., 2012; Field and Jacob, 1993, 1995; Nakamura, 1989; Nogoshi and Igarashi, 1970, 1971; Satoh et al., 2001; Theodulidis et al., 1996). These peaks and other mHVSR features are evaluated in this study for their potential to improve site response predictions and reduce uncertainties relative to those from ergodic VS30-based models. We derived mHVSR at 41 stations using data from temporarily deployed seismometers (Buckreis et al., 2021), and ambient noise data for 11 permanently deployed seismometers queried from the Incorporated Research Institutions for Seismology (IRIS; Trabant et al., 2012) using the “ObsPy” package in Python (Krischer et al., 2015). The mHVSR were processed using procedures described in Wang et al. (2022b), which are revised from earlier protocols (Site EffectS assessment using AMbient Excitations, 2004).
Each mHVSR curve is independently assessed for peak features using the automated algorithm presented by Wang et al. (2023). The peak detection algorithm implements a regression tree to represent the mean mHVSR curve as a step-wise function, from which relative amplitudes and lengths of adjacent steps are used to identify peak features, as illustrated in Figure 3. Sites identified to possess peak features are fit using a Gaussian function (Ghofrani and Atkinson, 2014):
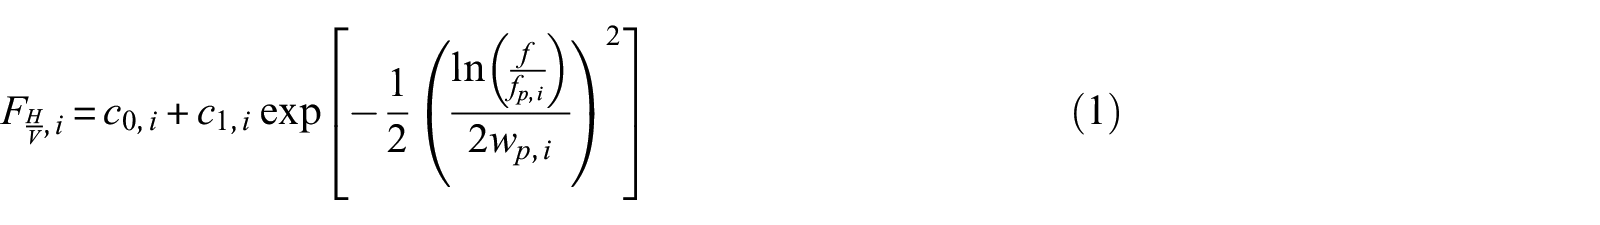
where fp is the fitted peak frequency for the ith HVSR peak (i.e. the location of the HVSR peak, regardless of whether it actually corresponds to a site resonant frequency), c1 is peak amplitude, wp is peak width, c0 is a frequency-independent constant, and f is frequency in Hz. The absolute amplitude of the peak (denoted ap) is calculated as the sum of c0 and c1. The fit operation estimates fp, c0, c1, and wp for peak i at each site with a significant peak.
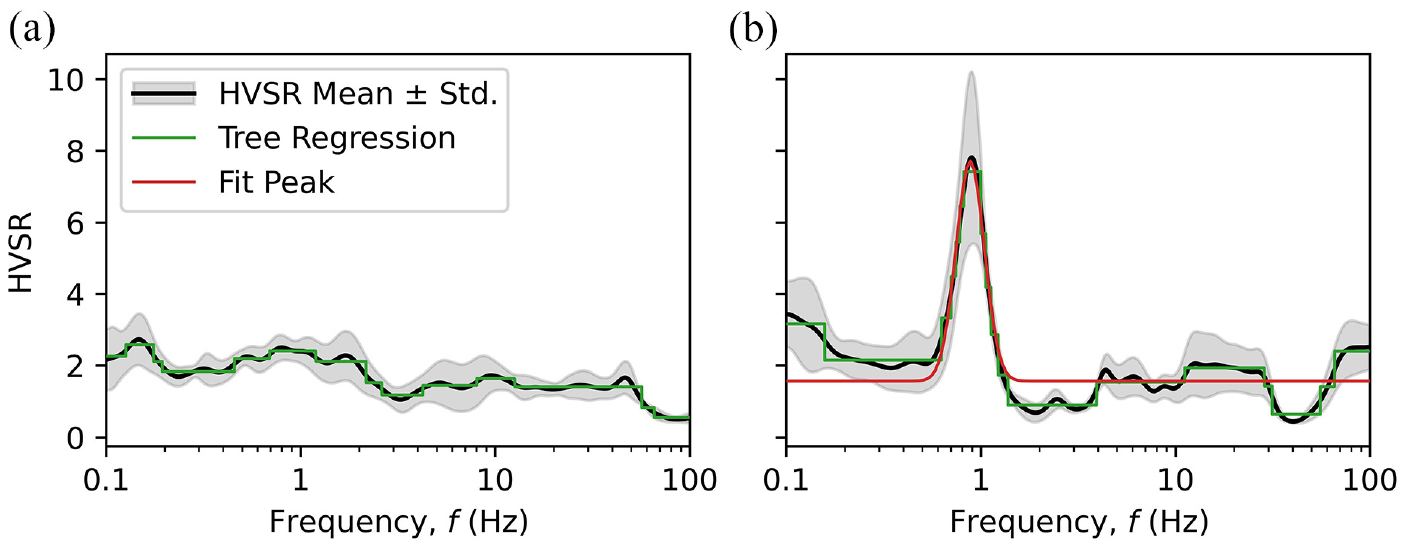
Examples of peak identification and fitting algorithm proposed by Wang et al. (2023) for Delta sites with (a) no peak (WR CLFS) and (b) clear peak (CE 67265).
Note that the lowest peak frequency (fp1) is not necessarily equal to the fundamental site frequency (f0) for various reasons, including (1) f0 could be out of the mHVSR usable frequency range for sites in deep basins, and (2) horizontal amplitudes near f0 may not exceed the instrument noise threshold. Table 1 presents a summary of the peak identification and fitting results (lowest frequency peak only) for the Delta stations used in model development.
Approximately 71% of all Delta sites are identified as possessing peaks, which is significantly more than what has been observed across California as a whole (e.g. 27%–52%; Wang et al., 2023). One factor which produces peak features is the presence of a strong impedance contrast in the soil column, such as that observed between near-surface soft soils (including peaty layers and soft clays) and stiffer underlying non-organic soils. This strong impedance contrast is expected to give rise to significant site response effects.
Ground motion data analysis
Non-ergodic analyses were performed to characterize local site response in the Delta region. This section presents the approach that was applied to support model development.
Residual calculations
Total residuals (Rij) represent differences between data and the median predictions of a GMM:

where

where
Non-ergodic site response for Delta region stations
Site response models (FS), whether site-specific or ergodic, usually can be expressed in the following general form (e.g. Stewart et al., 2017):

where the first and second terms represent the linear (
Non-ergodic site response methods take the site response as the sum of the site response model (used in the GMM applied for residual analyses) and the site term. For this work, the linear site response (

where
The resulting site response quantities are plotted in Figure 4 for 24 of the 36 Delta sites, each of which has reliable
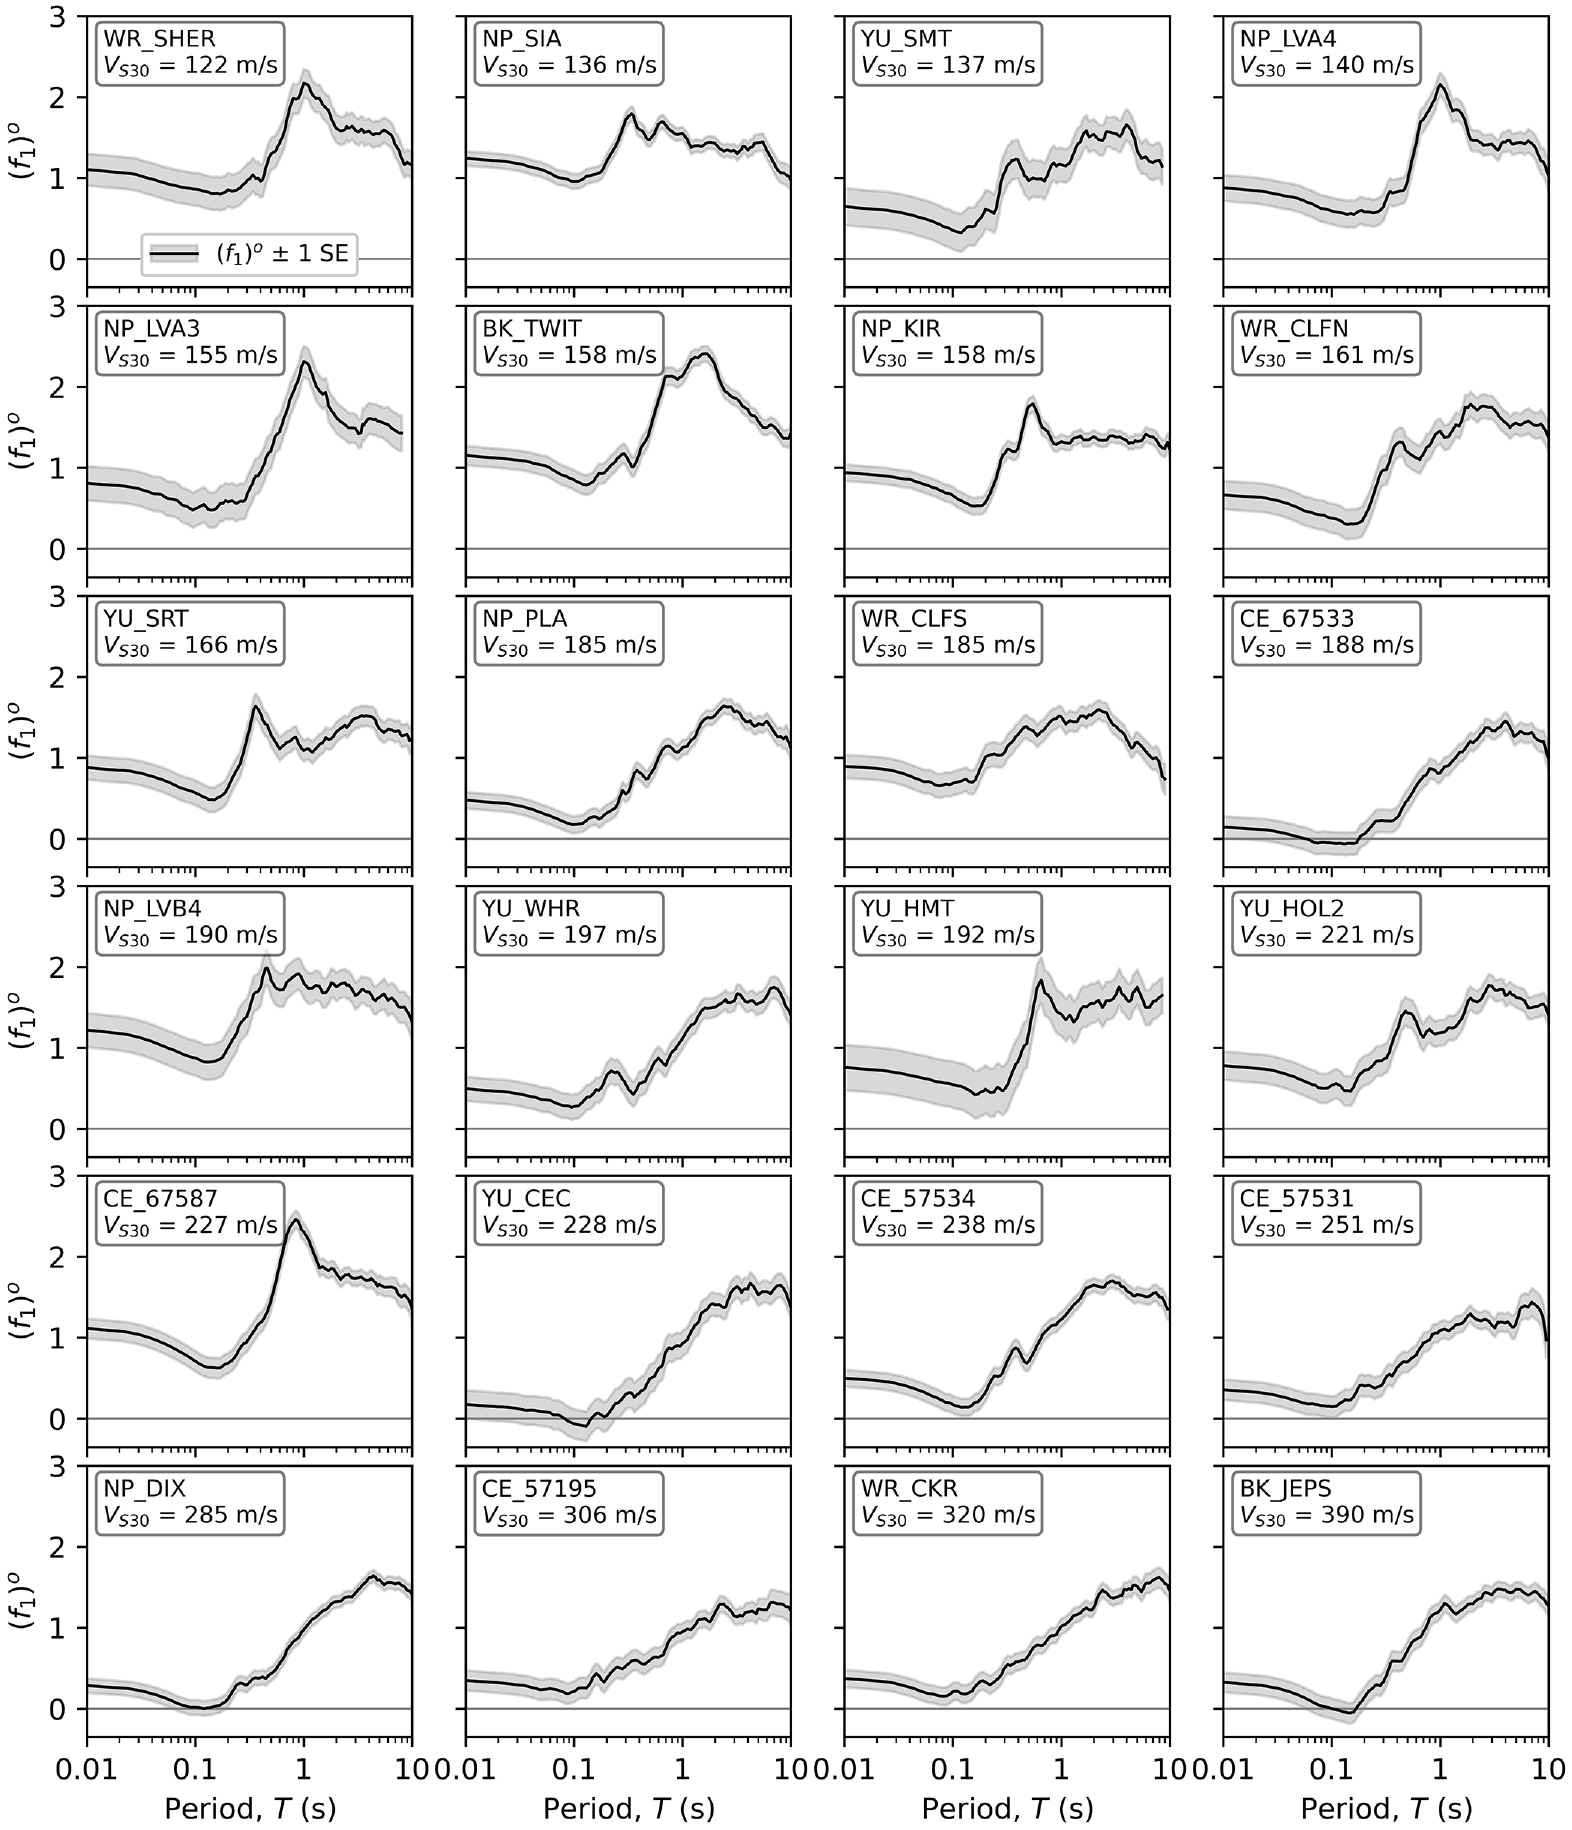
Plots of observed linear mean amplification,
Site amplification model development
The modeling approach outlined in this section aims to develop a linear site response model for the Delta region using weak ground motions (relatively low amplitudes), where significant nonlinear effects are not expected. The computed
The advantage of using
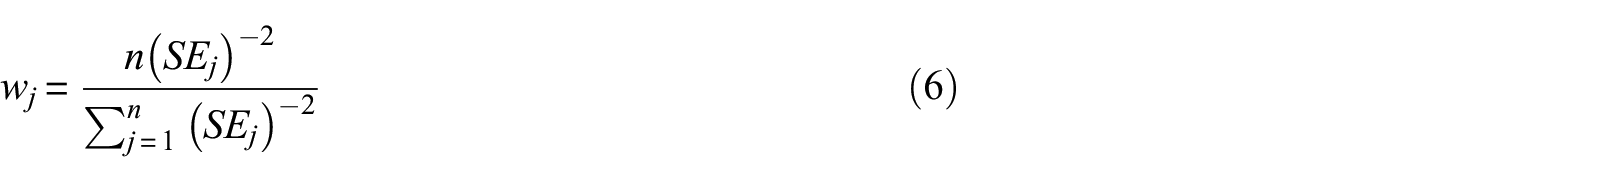
where n represents the number of sites used during regression for each IM. It follows that stations with smaller SEj values will have greater influence during the regression.
The proposed model was developed in three stages, as described in the following subsections. The first develops the VS30-scaling model, and the second and third develop additive terms conditioned on mHVSR peak parameters and average mHVSR amplitudes, respectively.
Stage 1: Analysis of VS30-scaling
Ergodic site response models are typically conditioned on VS30 to capture first-order site effects (e.g. SS14; Parker and Stewart, 2022). Data from 36 Delta and 45 surrounding non-Delta stations (Figure 1) are used to develop the VS30-scaling model. The motivation for including the 45 non-Delta stations at this stage of model development is as follows:
The Delta is located within the Central Valley—a large sedimentary basin structure, where we anticipate basin effects that are more readily investigated using a larger population of sites, and
A VS30-scaling model developed using solely data from Delta stations would only be applicable to the parametric range of the data (i.e. 100 < VS30 < 300 m/s). The resulting model would likely be biased for stiffer soil sites near the outer-edges of the Delta, so data in the general vicinity with similar geologic conditions (i.e. within the Central Valley) are used to constrain the model for moderately-soft-to-stiff site conditions.
In Figure 5, the
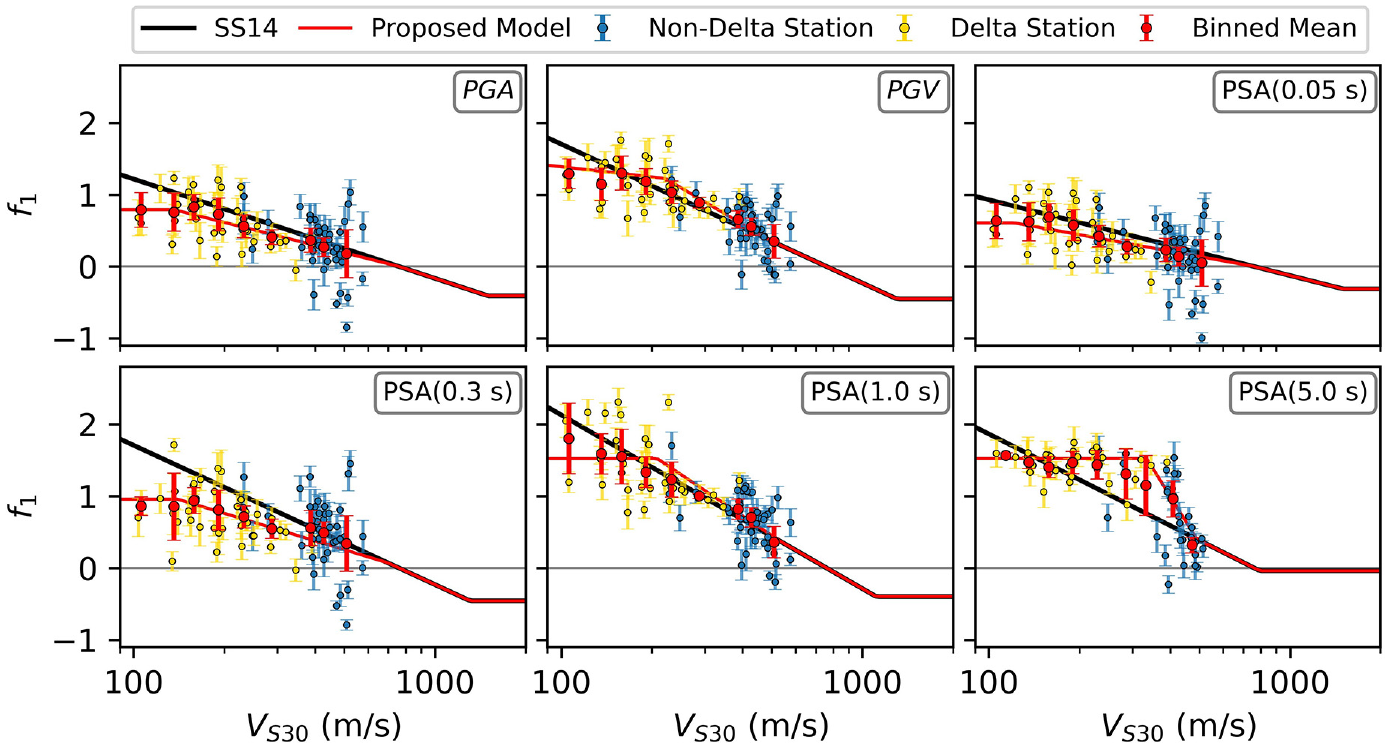
VS30-scaling for observed linear amplification,
For Delta stations, the ergodic model tends to over-predict amplification for PGA and periods shorter than about 1.0 s. Across all IMs, the VS30-scaling appears to saturate (i.e. slope goes to zero) for exceptionally soft soil sites (VS30 < 150 m/s), which is consistent with the findings of recent studies for other regions (Parker et al., 2019 for central and eastern North America; Parker and Stewart, 2022 for global subduction zones; Nweke et al., 2022 for southern California basins). As with non-Delta stations, the ergodic model appreciably under-predicts the site response at periods longer than 3.0 s.
Based on these observations, we modify SS14 as follows:
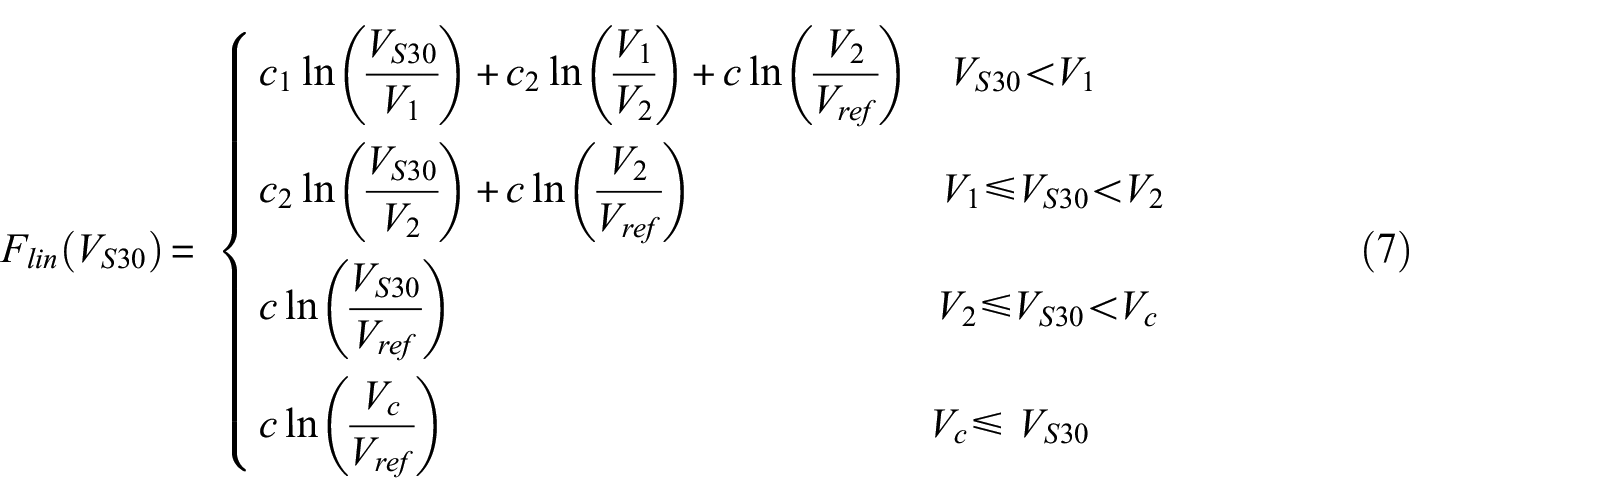
where c1, c2, and c are VS30-scaling coefficients; V1, V2, and Vc are limiting velocities; and Vref is the reference site condition where Flin = 0 (VS30 = 760 m/s). The first two model components (first and second rows) effectively represent the VS30-scaling in the Delta for exceptionally soft and soft-to-moderately-stiff site conditions, respectively. The third and fourth components match the SS14 model; the only modification is an added lower limiting velocity on the third component (i.e. V2). The coefficients c and Vc are adopted from SS14, and c1, c2, V1, and V2 are estimated for the Delta region.
The model is first fit to the data with all four free parameters using WLS regression. VS30-scaling coefficients c1 and c2 are constrained to be non-positive, since site response has been observed to increase as sediment stiffness decreases across many investigations spanning over 50 years (e.g. Borcherdt and Gibbs, 1976; Borcherdt and Glassmoyer, 1994; Idriss, 1990; Seed et al., 1976). V1 is constrained to be less than V2, which is constrained to be less than or equal to Vref to ensure a continuous function and to enforce a reference velocity of Vref = 760 m/s. From these results, c1 was identified to be the most stable parameter in terms of lacking sudden between-period fluctuations and was set to a constant value of zero for all IMs except for PGV, effectively removing the first term in the top model component in Equation 7.
A second round of WLS regression was performed with c2, V1, and V2 estimated as free parameters. These results indicated that V1 was the most stable parameter. Regressed values of V1 were smoothed using LOESS regression, which is a type of locally weighted scatterplot smoothing (Cleveland, 1979). A third and fourth round of WLS regressions and smoothing were conducted to set V2 and c2, respectively. Figure 6 presents the as-regressed and final smoothed-coefficients of the proposed VS30-scaling model, the results of which for individual IMs are represented by the lines in Figure 5. Coefficients are provided in Table S1 in the supplement.
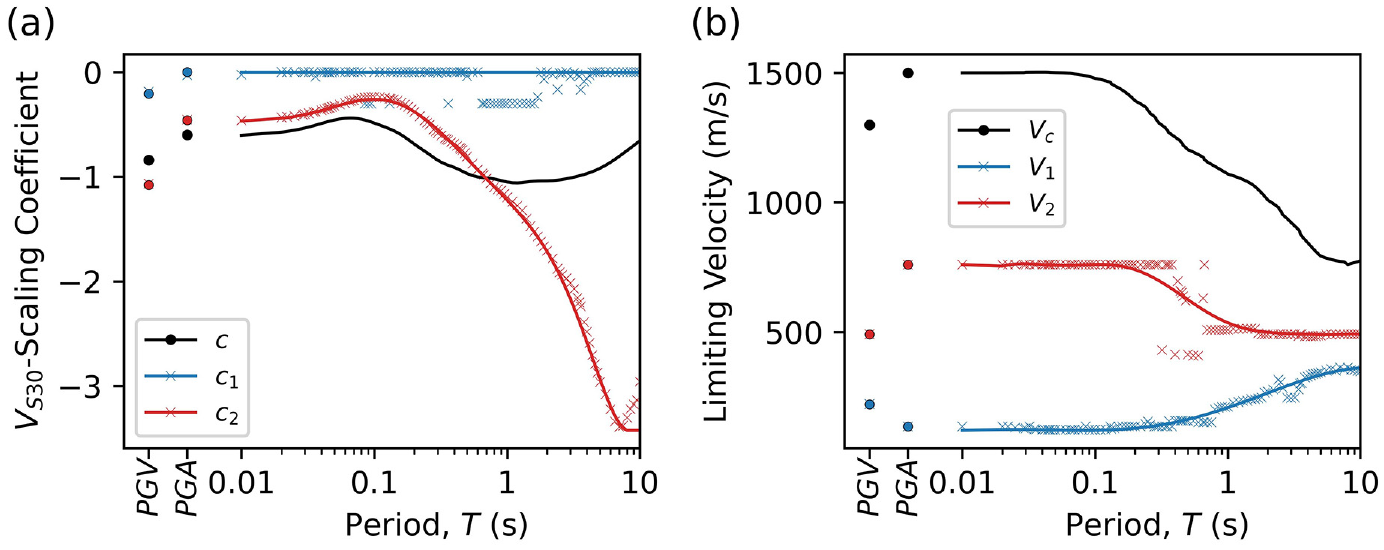
As-regressed (discrete symbols) and recommended-smoothed coefficients (lines) for (a) VS30-scaling coefficients and (b) limiting velocities. The impacts of the smoothing operation are indicated by the differences between symbols and lines.
The proposed Delta-calibrated VS30-scaling model is implemented as follows:

where the site response is solely a function of VS30 and PGA at the reference rock condition (VS30 = 760 m/s; PGAr) (i.e. Fnl). The “v” superscript indicates that the median prediction is computed using a model that only includes VS30-scaling.
The variability of
Stage 2: Analysis of site resonance effects
Site resonance effects cannot be predicted by simple VS30-scaling models, such as that described by Equation 7, because of the necessary smoothing across site-specific features in model development. In this section, we investigate whether resonances observed in site response are related to peaks in mHVSR. There are two general types of HVSR measurements—from microtremors (denoted mHVSR) and earthquake recordings (eHVSR). Most past research relating HVSR to site response has used eHVSR, including Cadet et al. (2012), Zhao and Xu (2013), Ghofrani et al. (2013), and Kwak et al. (2017) for Japan; Hassani and Atkinson (2016, 2018b) for central and eastern North America; Hassani and Atkinson (2018a) for California; and Panzera et al. (2021) for Switzerland. The use of eHVSR is convenient because the data required to measure HVSR are readily available from earthquake ground motion databases at ground motion recording sites; however, the problem is that the recordings used to develop the HVSR site parameters are not independent of those used to compute the site response. As a result, the correlation between eHVSR site parameters and site response is likely to be over-estimated. In addition, eHVSR is not likely to be available for forward applications at most sites. For these reasons, we only use mHVSR as the basis for site parameters used to develop the model. A similar approach was used previously for another local region having peaty-organic soils—Obihiro in Hokkaido, Japan (Wang et al., 2022a).
The Delta is rather unique in California because the geologic environment and depositional history results in a high percentage of sites (∼71%) that have significant mHVSR peaks, which is suggestive of strong impedance contrasts. It follows that site parameters, such as those summarized in Table 1, may have potential to improve site response predictions in the Delta. This subsection addresses the following questions: (1) can mHVSR be used to predict the presence of peaks in the site response, and (2) when mHVSR contain peaks, can the associated site parameters be used to improve predictions of site response? Of the 36 Delta sites with usable data, 34 have measurements of mHVSR and can be used to answer these questions.
Identification of site resonances
To objectively assess whether resonance manifests at a given site, we developed an algorithm similar to that proposed by Wang et al. (2023) for HVSR to identify peak features in site response. In general, “peaks” are defined as features possessing the following key attributes: (1) relatively localized (i.e. the width should not span too large of a period range), (2) have sufficiently large mean amplitude relative to adjacent periods, and (3) have sufficient confidence that the feature is meaningful (i.e. uncertainty in amplitudes or periods should not be too large).
Total residuals (
As in Wang et al. (2023), a regression tree (Breiman et al., 1984) is used to effectively smooth and simplify the empirical relative site response as a piecewise function of non-overlapping linear segments (i.e. steps), to facilitate peak identification. The peak detection algorithm operates on the stepped results of the regression tree to identify peaks based on the three criteria previously defined. These conditions are assessed using the algorithm presented in Buckreis (2022). A Python code implementation, which includes documented examples, is available at https://github.com/tristanbuckreis/srPeak.
Figure 7 presents plots of
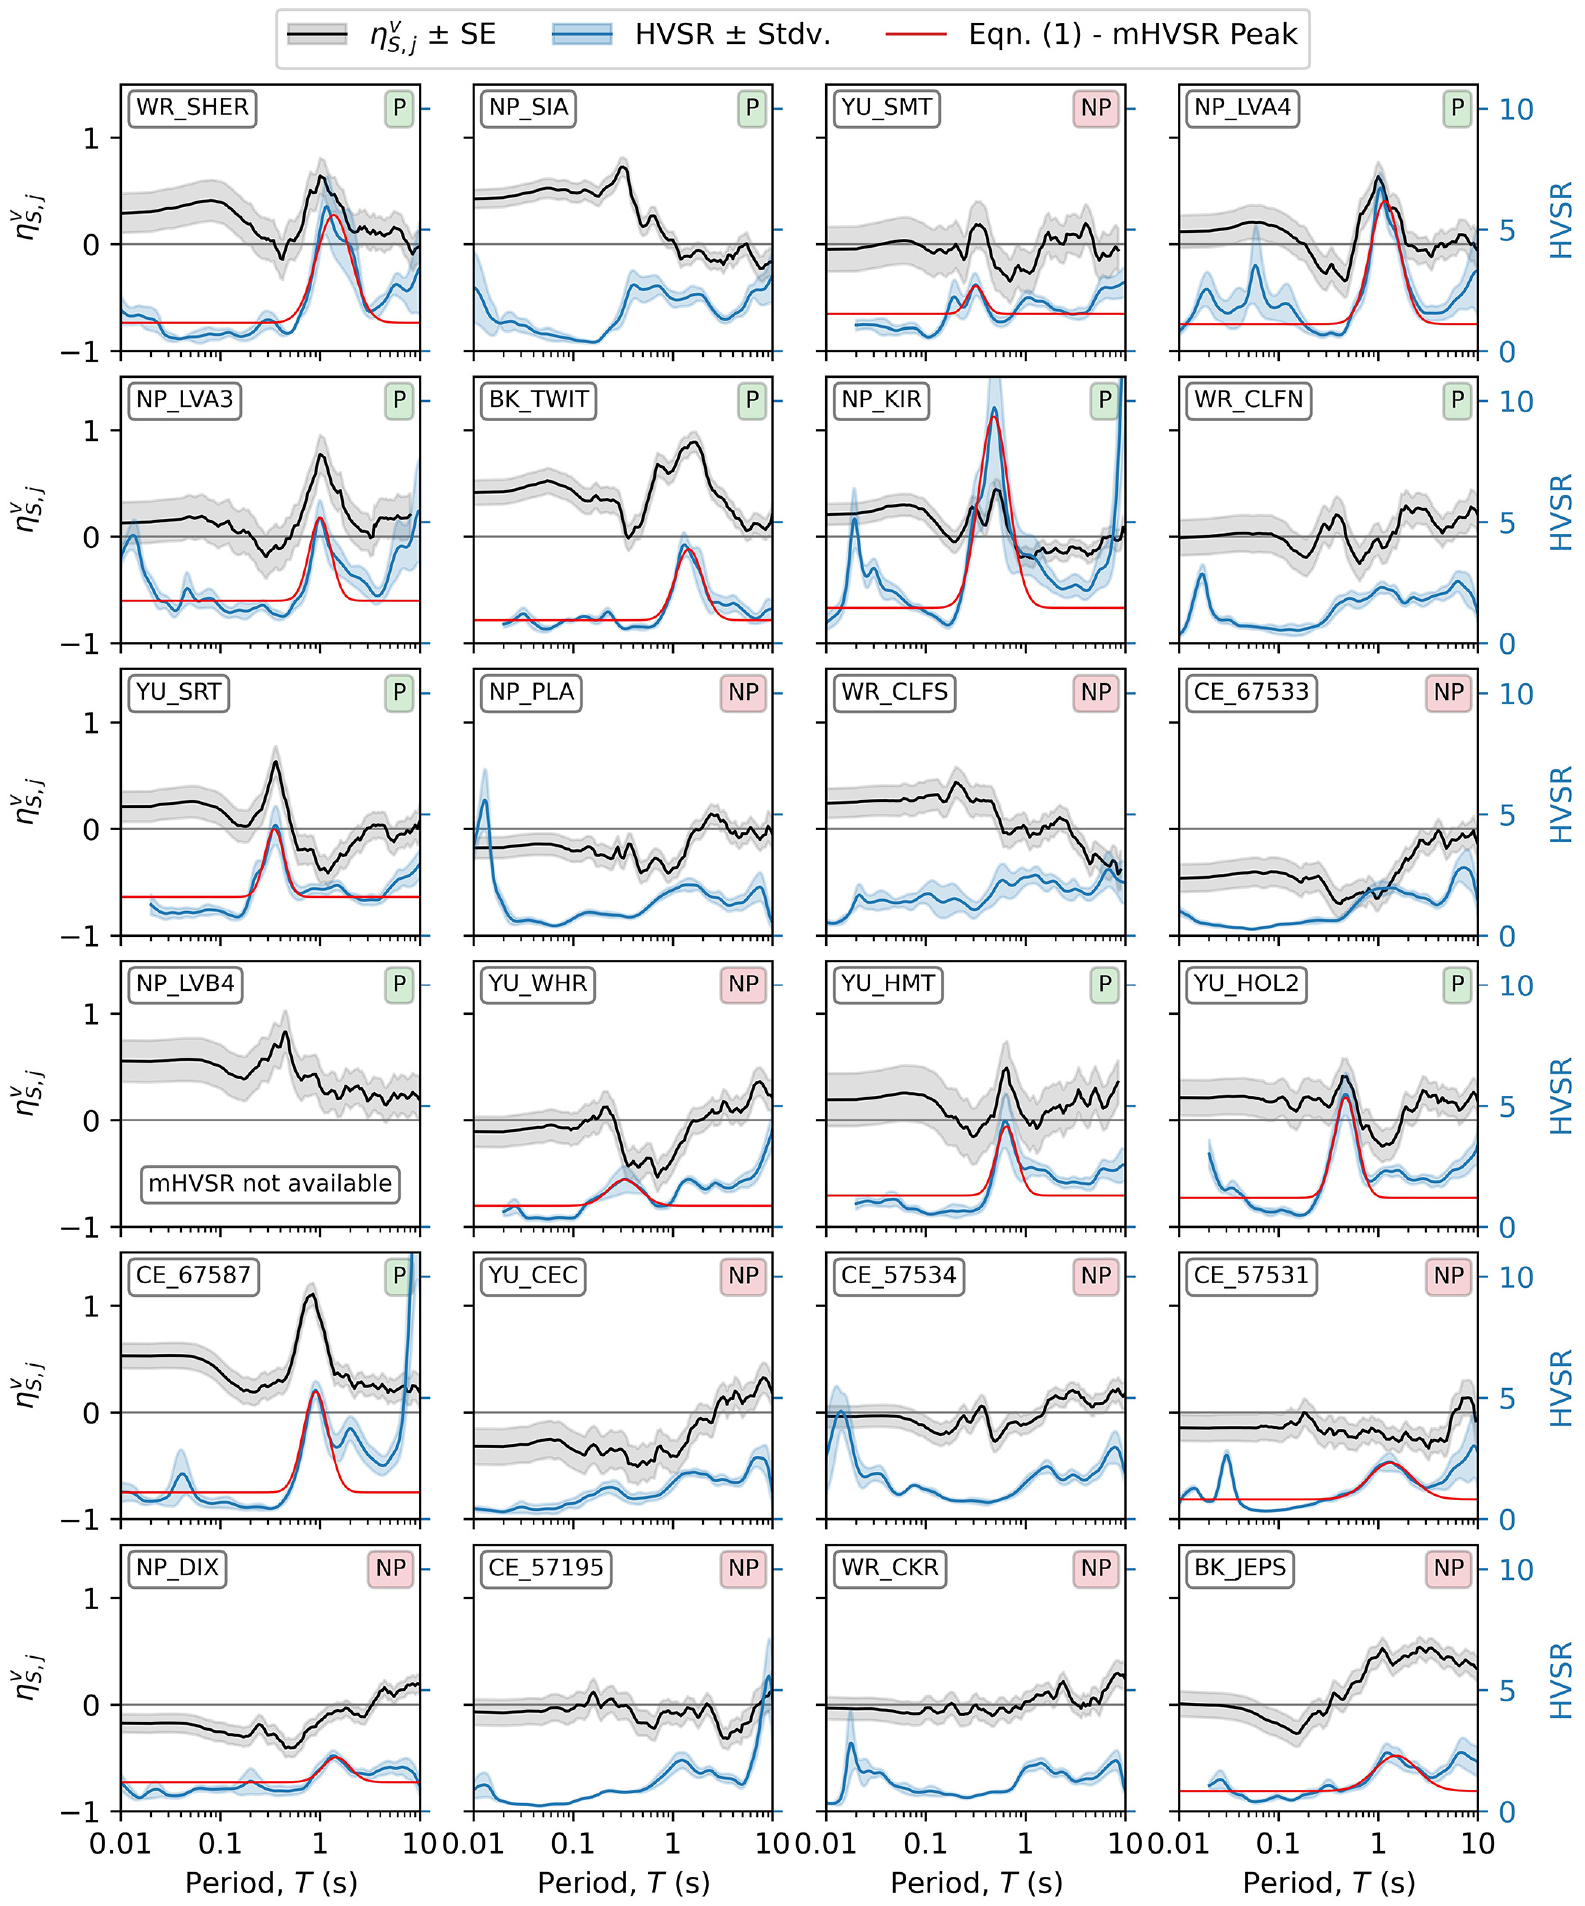
Plots of relative site response,
Predicting site resonances using mHVSR
Figure 7 shows plots of mHVSR curves and fitted Gaussian functions from Equation 1, applied when peaks were identified, for all sites except NP_LVB4 where mHVSR data were not available. A comparison to peaks from site response (previous section) indicates coincident peak features for about 71% of cases. This suggests that the existence of an mHVSR peak is a potentially useful indicator of when site resonances can be anticipated, although the imperfect correlation suggests other (un-parameterized) factors also affect site resonances.
Investigations of correlation between relative site response and mHVSR peaks suggests that sites with clear relative site response peaks generally coincide with mHVSR peaks having tall relative peak amplitudes (ap ≥ 3) and small tail amplitudes (c0). This is shown in Figure 8a where sites with and without relative site response peaks are plotted in c0-ap space. Using logistic regression (Lottes et al., 1996), we propose a probabilistic model conditioned on c0 and ap to predict the presence of relative site response peaks:

where Pp is the probability of a resonant peak (0 ≤ Pp ≤ 1),
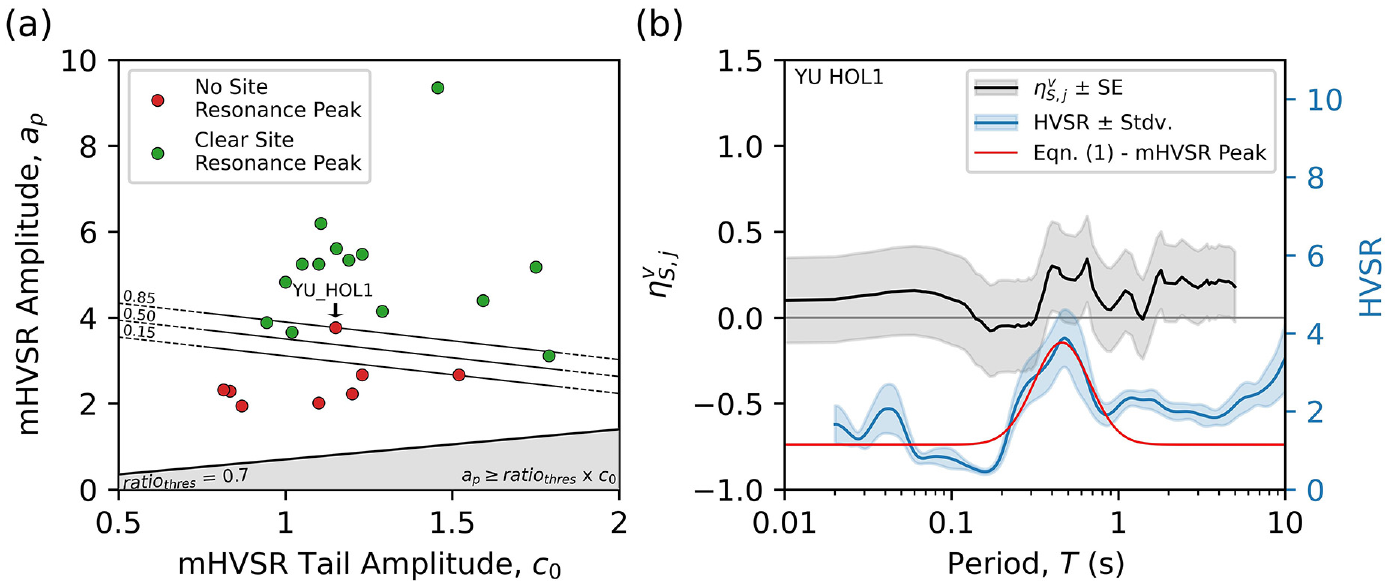
(a) Occurrences and non-occurrences of relative site response peaks as a function of mHVSR tail amplitude (c0) and peak amplitude (ap =c0 + c1) (discrete symbols) and predictions of logistic model (lines) for peak probabilities Pp = 0.15, 0.5, and 0.85. The shaded region corresponds to conditions that are not possible for mHVSR peaks. (b) Plot of relative site response,
The logistic model described by Equation 9 requires mHVSR peak attributes. If the mHVSR is not found to possess a peak, Pp is taken as zero. If we impose a threshold probability of 50% (i.e. if Pp < 0.50 there is no
Using mHVSR peak parameters to predict relative site response resonances
For modeling purposes, we parameterize relative site response (
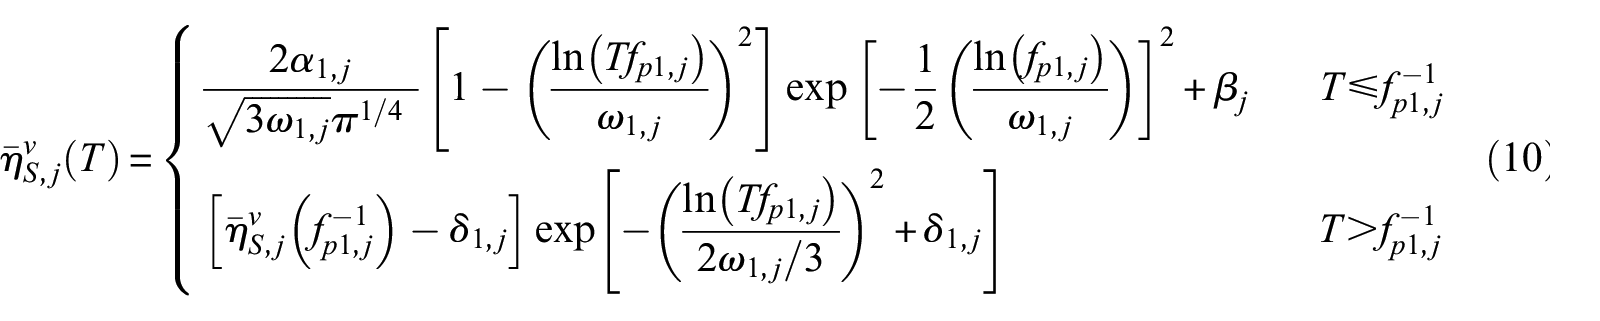
where
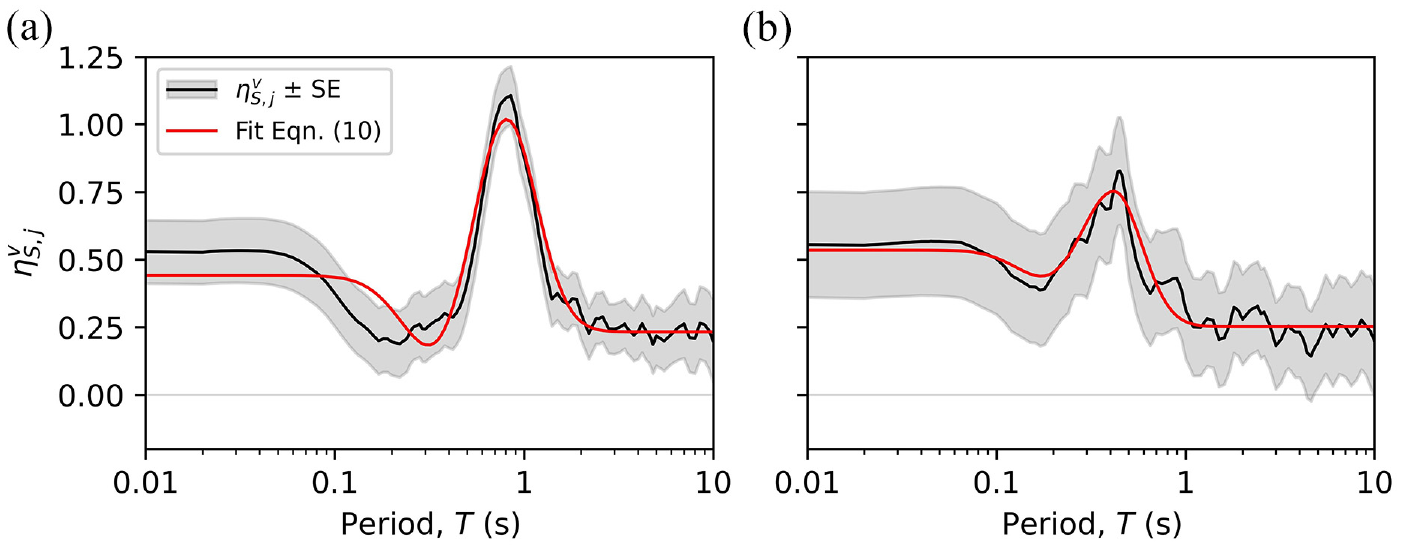
Relative site response (
Equation 10 estimates the properties of site amplification peaks where relative site responses have been derived from observations (i.e. interpreted ground motions). To generalize the model for sites without recorded ground motions (but with mHVSR), we relate fit coefficients
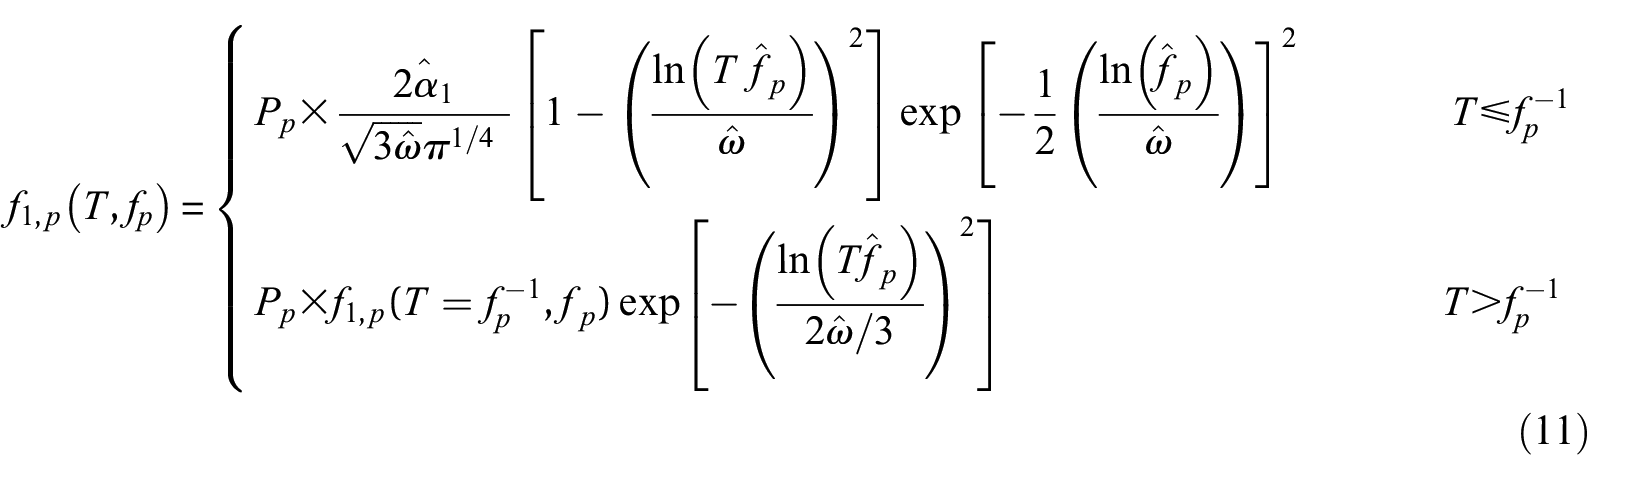
where the f1,p term in the second row of Eq. 11 is its value at T=f p -1 as evaluated using the first row, and

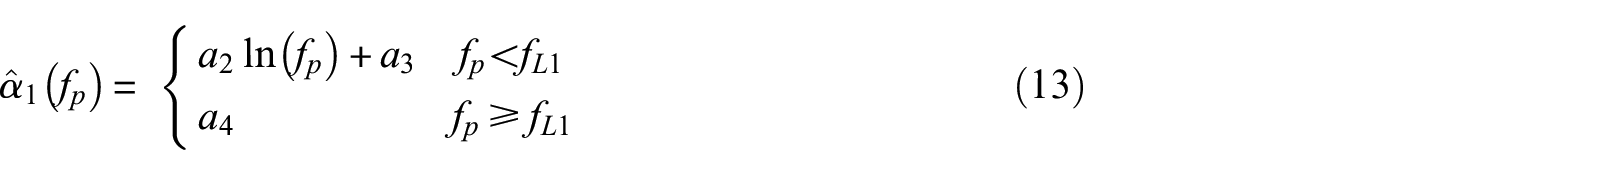
and
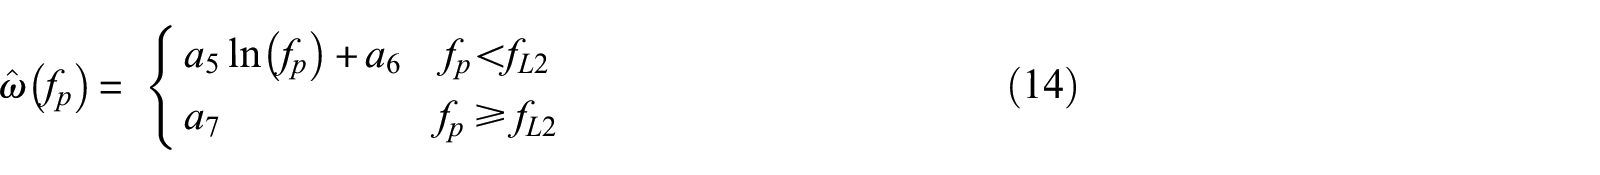
where f
p
is in Hz; coefficients
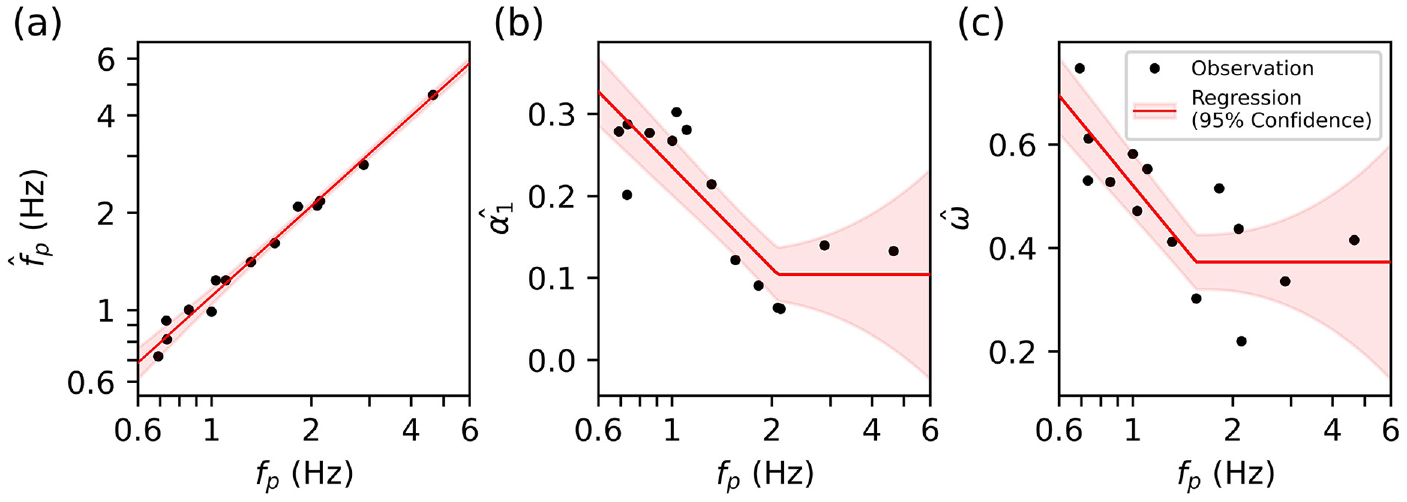
Relationships of mHVSR peak frequency (fp) and relative site response resonance model coefficients (a)
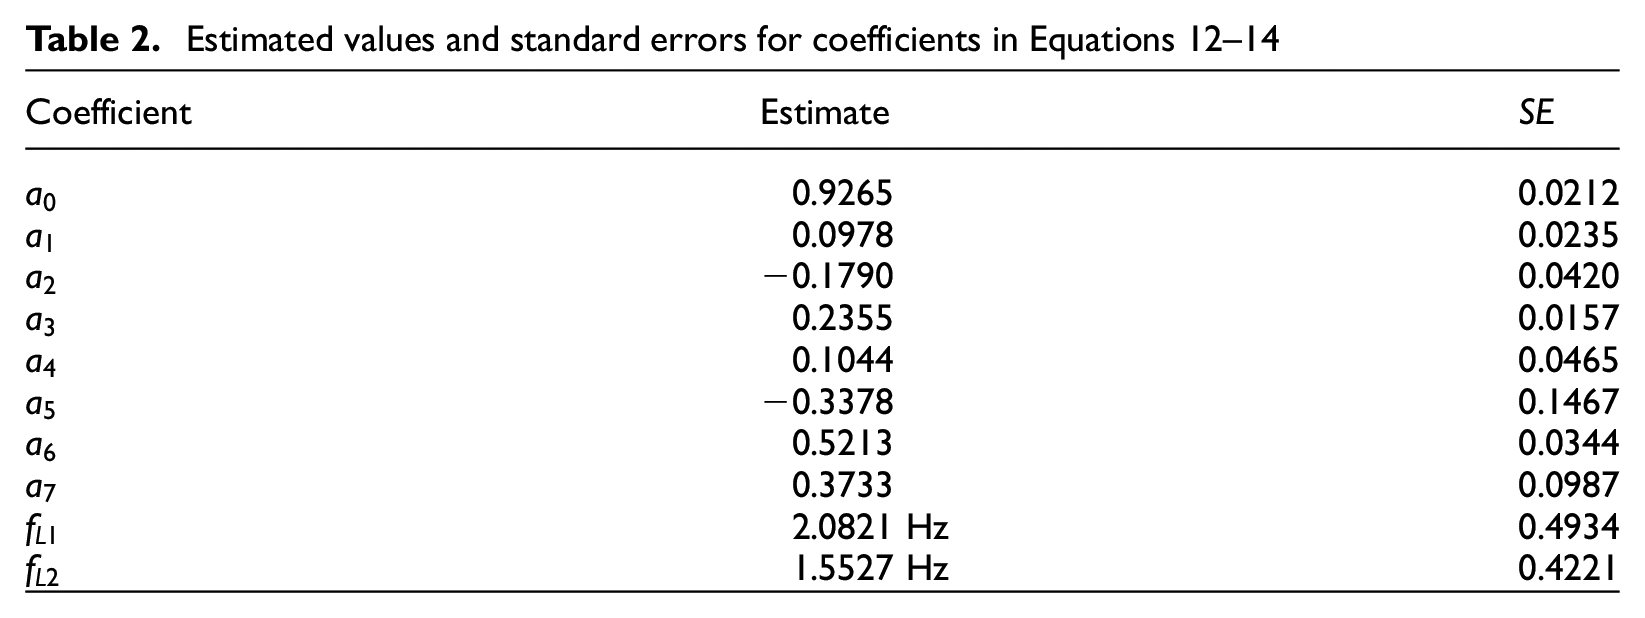
Estimated values and standard errors for coefficients in Equations 12–14
The updated GMM, which uses the VS30-scaling model described by Equation 7 and the mHVSR peak–based model in Equations 11–14, is described by
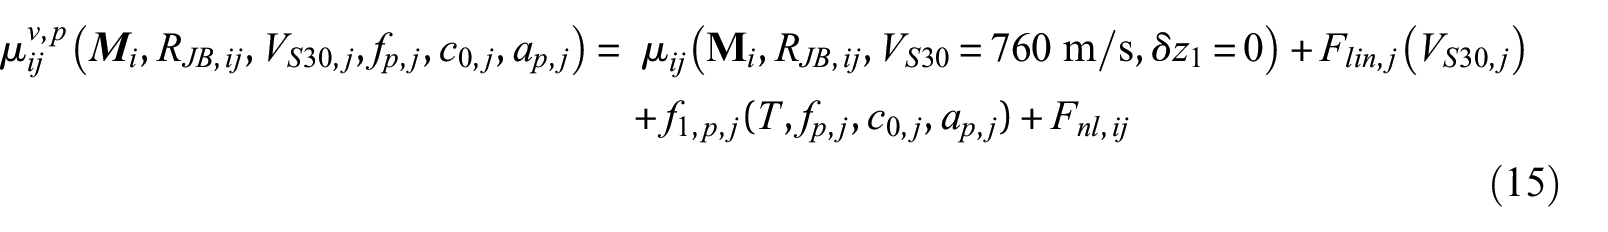
where the linear site response is a function of VS30, fp, c0, and ap. The “v, p” superscript indicates that the median prediction is computed using a model that includes VS30-scaling and peak-resonance effects.
Stage 3: Analysis of remaining amplification effects
Some previous research efforts have proposed to use broadband mHVSR features (not just peak attributes) for the prediction of site response. Senna et al. (2008) proposed a site response model for Japan conditioned on mHVSR and geologic or topographic units, where the shape of a reference site spectrum is modified by a period-dependent factor based on the mHVSR shape. Pinilla-Ramos et al. (2022) propose an mHVSR-based site response model for California, which similarly uses the whole period-dependent spectrum to predict amplification. These approaches differ from the work presented above because they use mHVSR ordinates directly to predict site response instead of using mHVSR primarily as a means by which to identify site resonances and their effects on amplification. Pinilla-Ramos et al. (2022) present a model conditioned on mHVSR amplitudes and VS30, where mHVSR amplitudes were found to have the greatest influence for periods between 0.5 and 4.0 s. Their findings suggest that mHVSR amplitudes may have value for site response prediction, which is examined in this subsection.
Within-event residuals (
General trends of
where
Plots of residual site response,
For modeling purposes, we relate the arithmetic average of
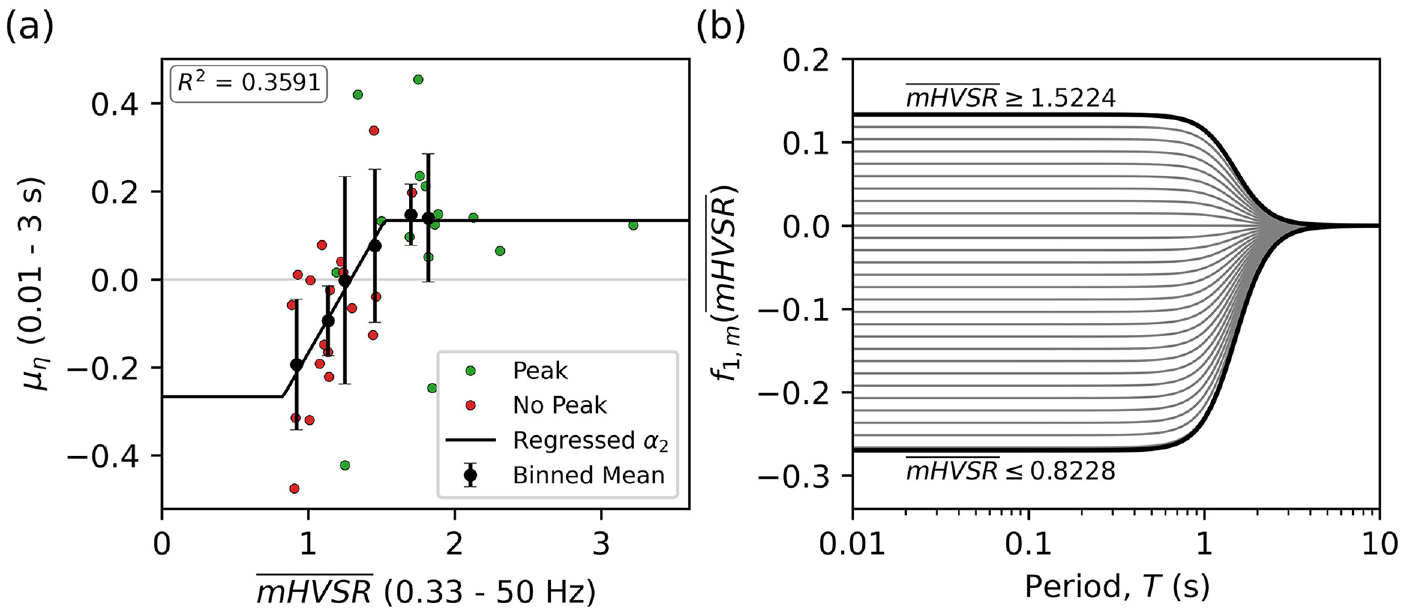
(a) Relationship between average residual site response (
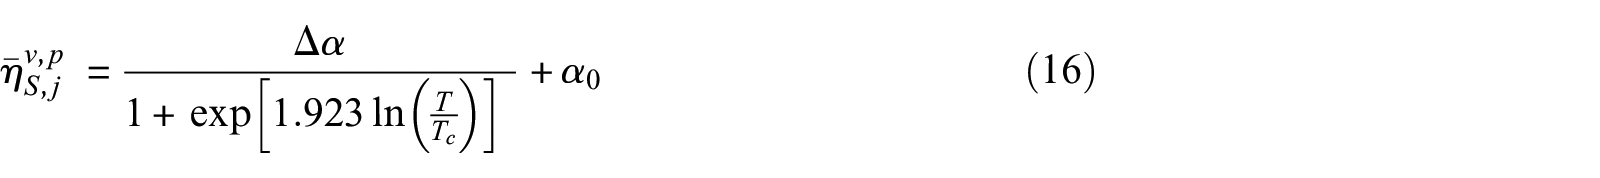
Based on these observations, we propose a model (denoted f1,m) conditioned on

where
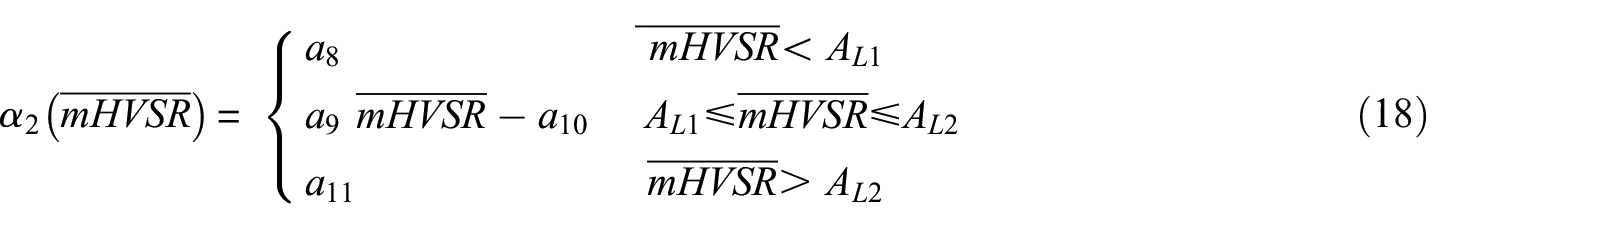
where
The final proposed GMM, which implements the local VS30-scaling model and is informed by mHVSR, can be summarized as
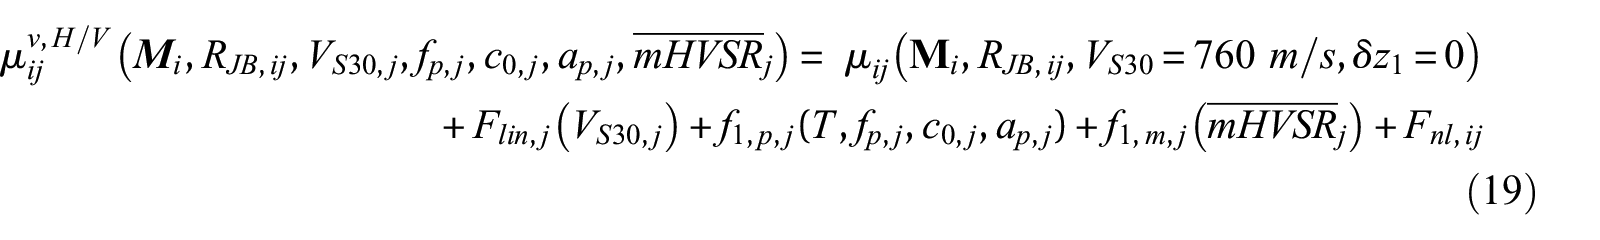
where the linear site response is a function of VS30, fp, c0, ap, and
Model performance and comparison to global ergodic model
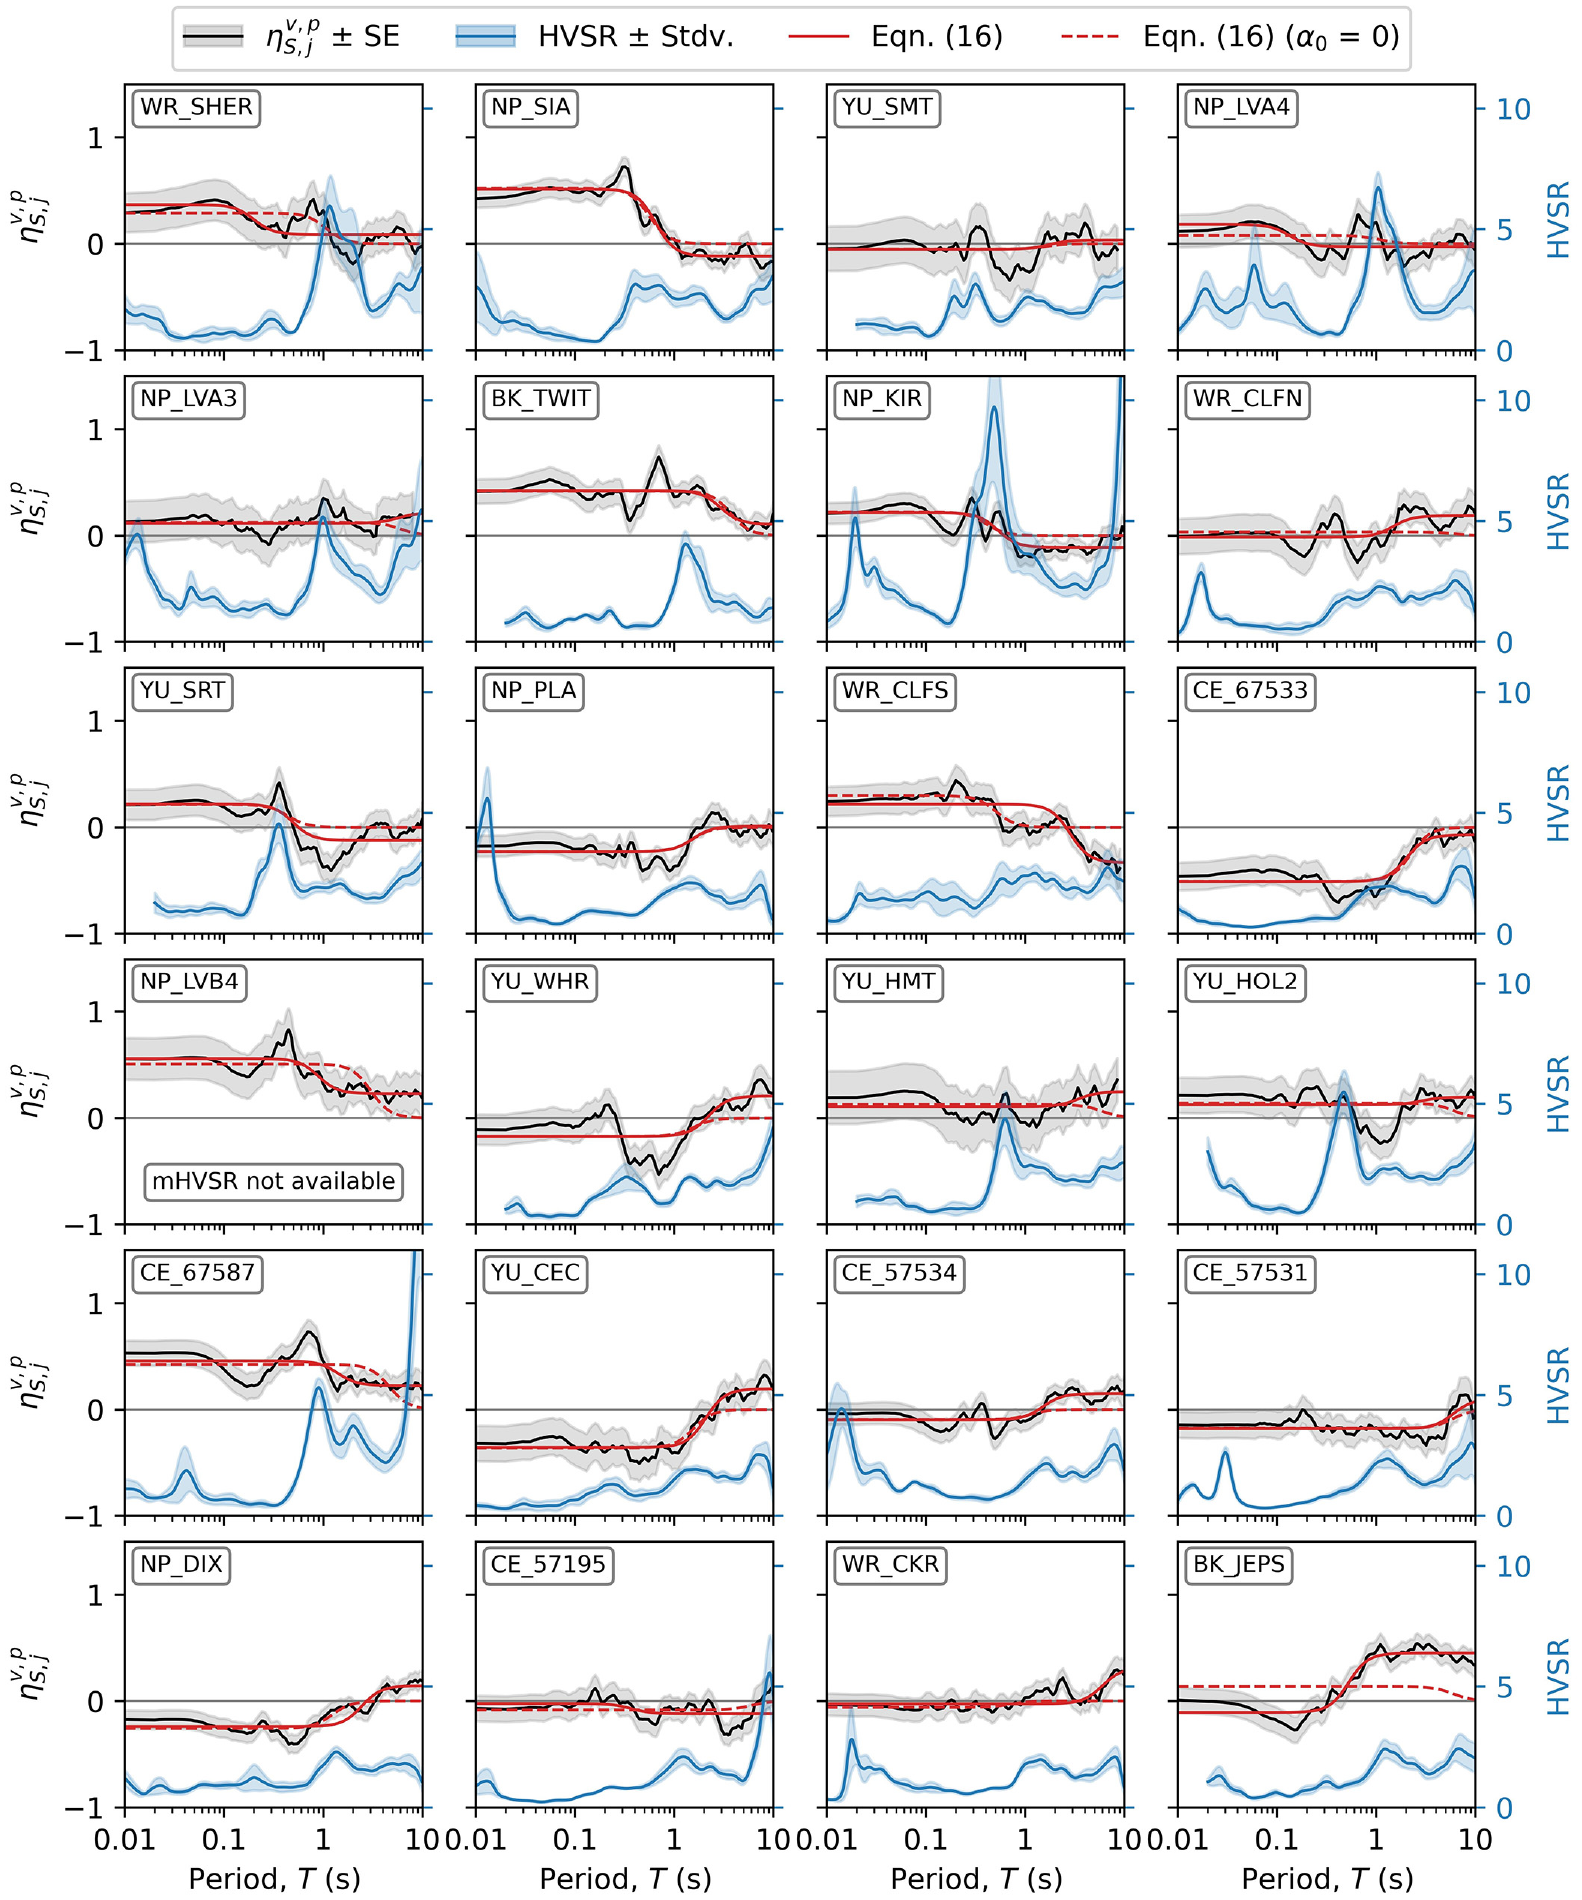
The proposed Delta-specific local model begins with the BSSA14 GMM, updates the anelastic path model as presented in Buckreis et al. (2023b), and updates the linear site response using one of two potential locally calibrated models. The first model requires VS30 only and is denoted Flin(VS30) (Equation 7). The second model uses VS30 in combination with mHVSR parameters and is denoted Flin (VS30, fp, ap, c0,
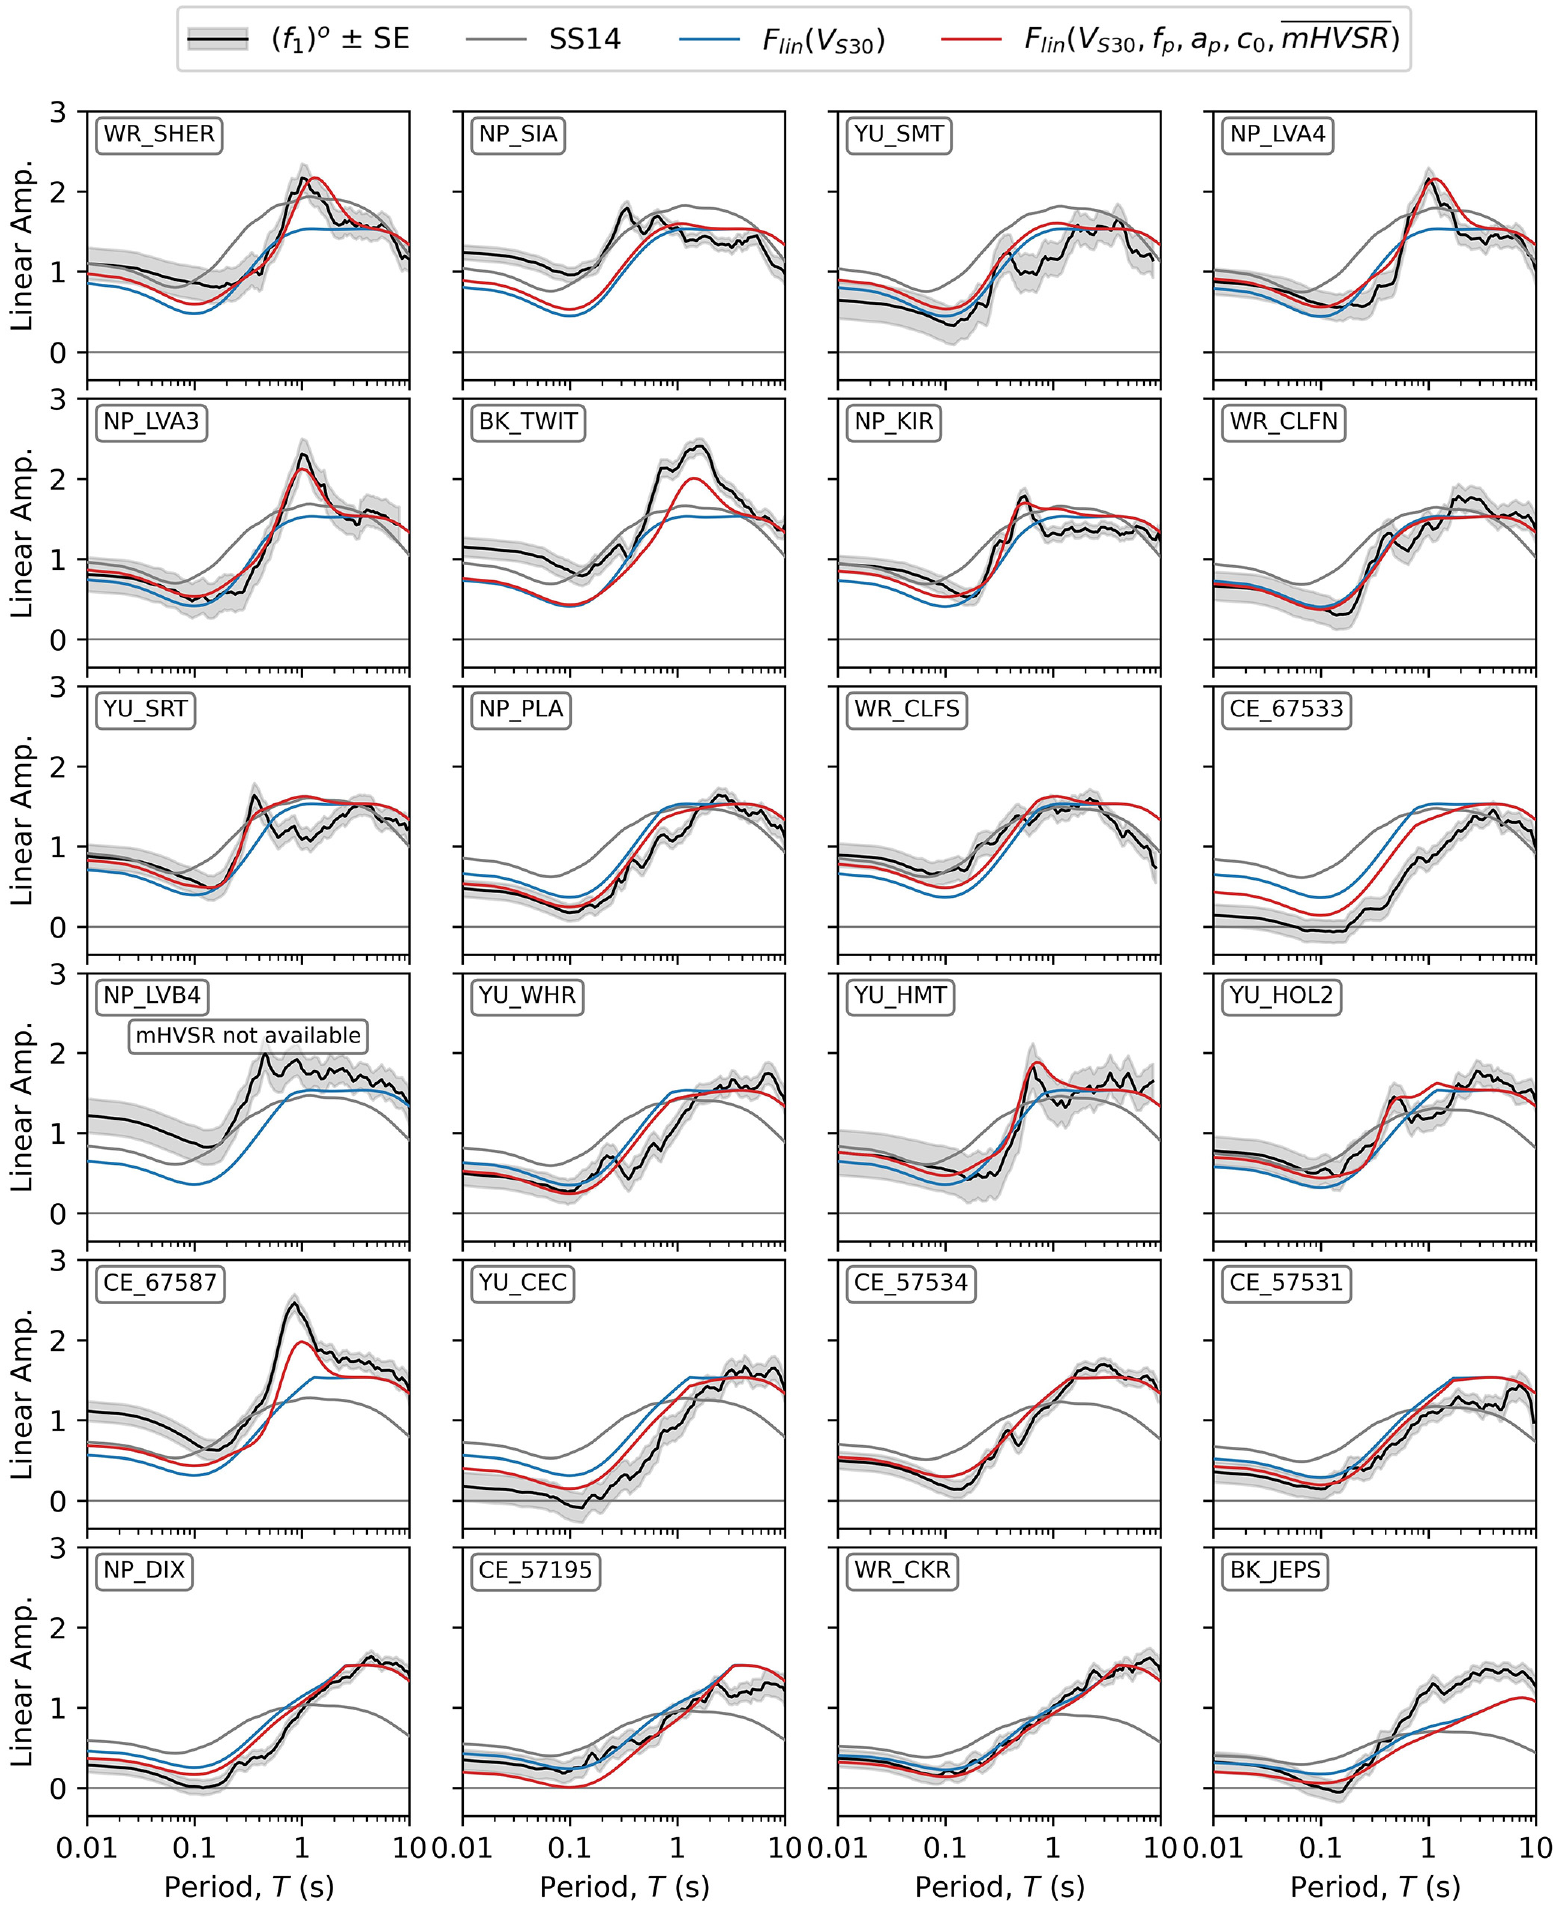
Plots of observed mean linear amplification,
The results shown in Figure 13 illustrate the significant misfit when extrapolating SS14 to the soft-soil conditions encountered in the Delta, and the improved fits that are achieved when using the locally calibrated models. The inclusion of the mHVSR terms is observed to better capture site-specific effects (e.g. resonant peaks and modest short-period amplitude adjustments) as compared to the VS30-scaling-only model. The following subsection quantitatively compares model bias and variability, and present aleatory variability models.
Model bias
Model bias is evaluated as the mean misfit of site terms (
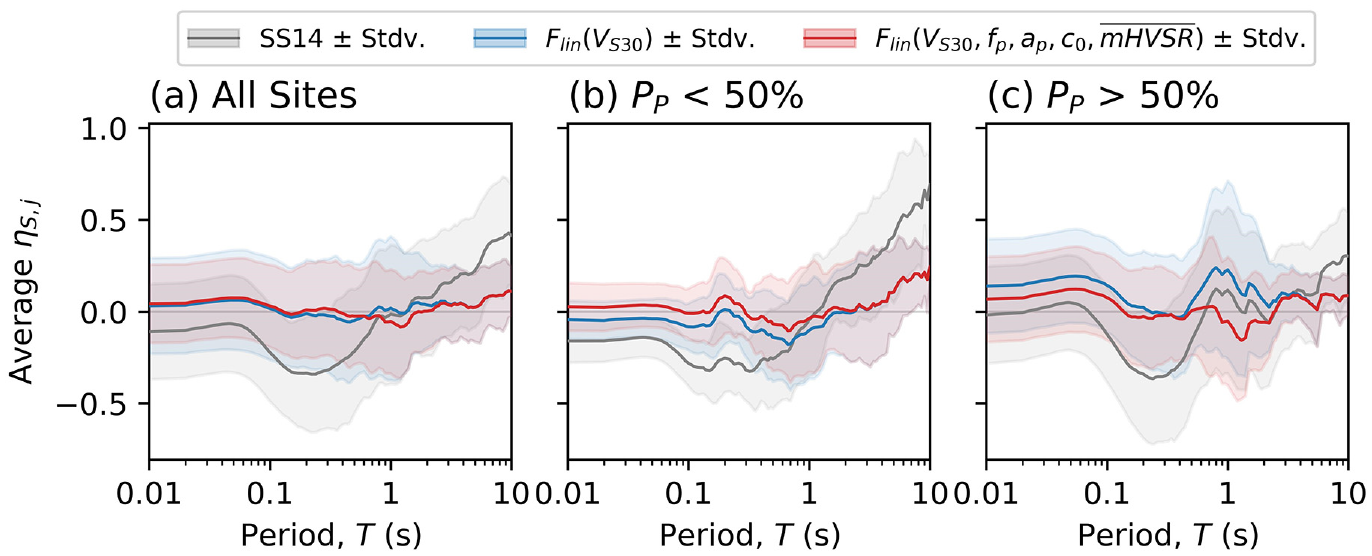
Comparison of bias in average site amplification predicted by SS14 (ergodic model; gray) and two proposed local models for the Delta: simple VS30-scaling (blue) and mHVSR-informed (red) for (a) all sites, (b) sites predicted to have minimal site resonance (Pp < 50%), and (c) sites predicted to have impactful site resonances (Pp ≥ 50%).
When examining biases of the two local models for all sites (Figure 14a), there are negligible differences (biases for each are effectively zero). However, when examining Pp < 0.5 and Pp > 0.5 sites separately (Figure 14b and 14c), the model that considers mHVSR (Flin(VS30, fp, ap, c0,
Aleatory variability
Aleatory variability (or dispersion) terms are computed from residuals calculated for each of the three GMMs (original BSSA14 with subregional path and SS14 for site; previous GMM but with Delta-specific VS30-conditioned site response; previous GMM with both Delta-specific VS30-scaling and mHVSR-conditioned amplitude adjustment). Dispersion terms computed include total (σ), between-event (τ), and within-event (ϕ) standard deviations, which are related as

The within-event term can be partitioned into site-to-site (

Figure 15 shows each of the dispersion terms for the California data set and the Delta subset. The local site response models for the Delta region do not affect the results of the California data set, which is expected since the Delta subset represents only a small fraction. However, there are significant changes of within-event variability and its components (
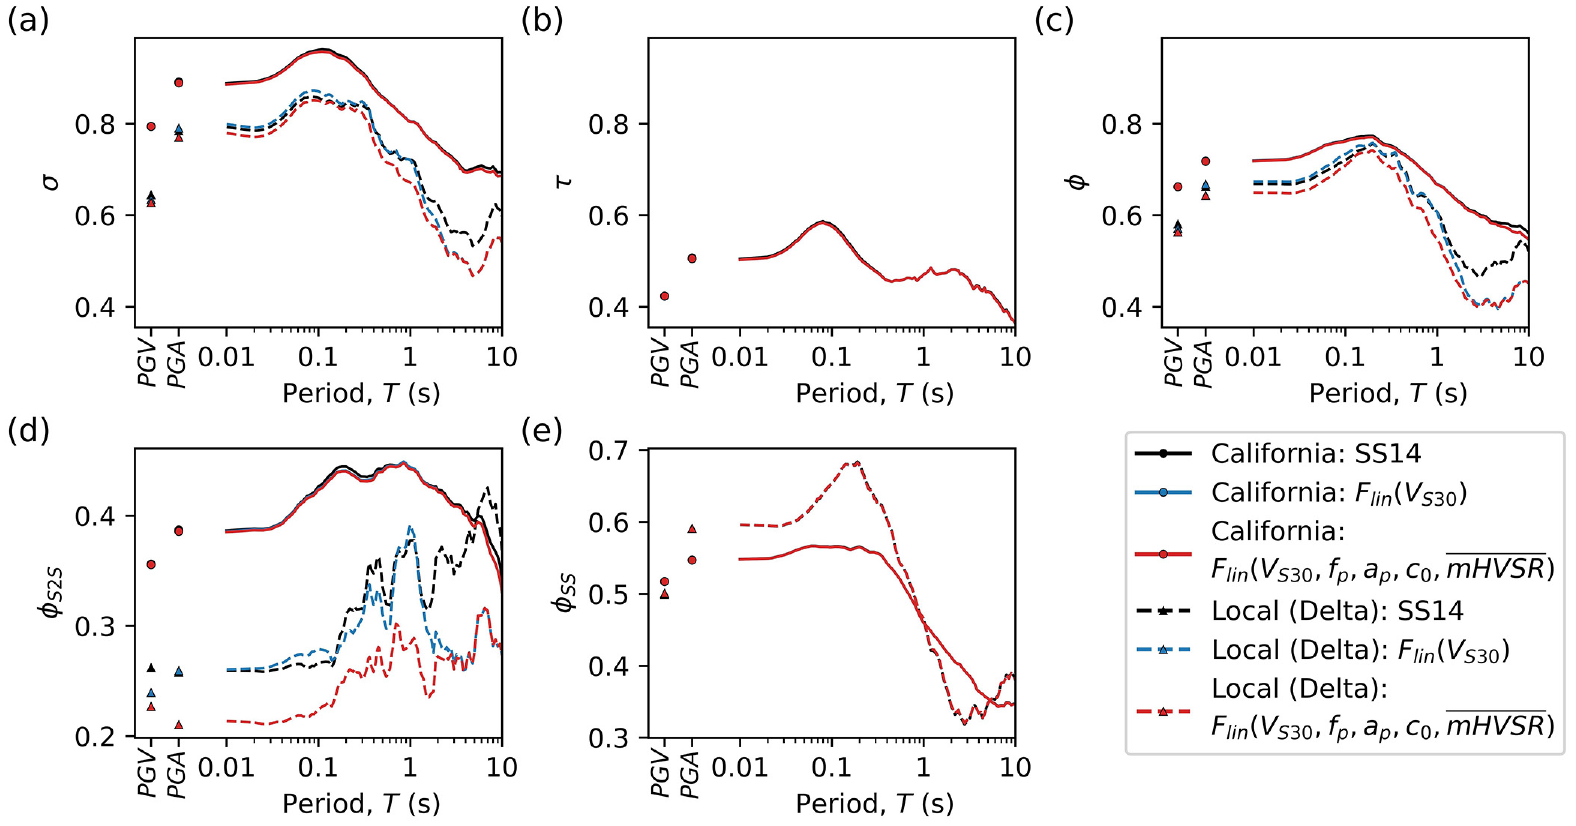
Standard deviations calculated using SS14 (ergodic model; black) and two proposed local models for the Delta: simple VS30-scaling (blue) and mHVSR-informed (red) for (a) total variability (
Site-to-site variability (
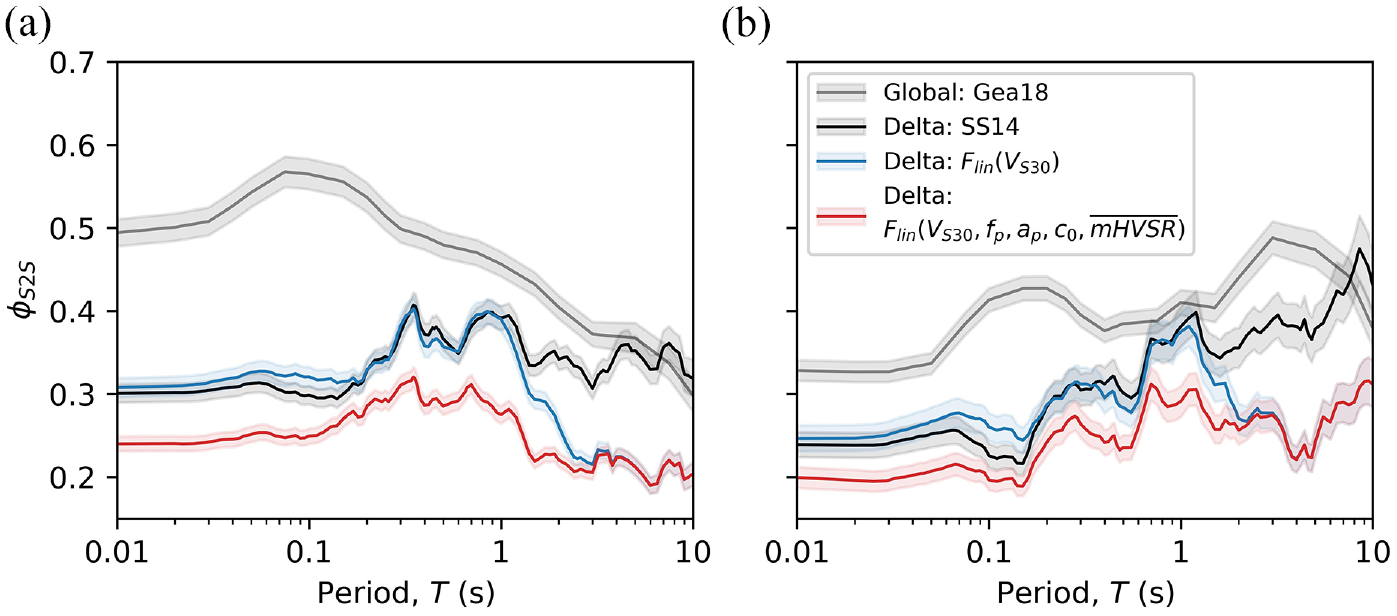
Site-to-site standard deviations (
The application of Flin(VS30) does not significantly change variability when compared to SS14 for T < 1.5 s; however, significant reductions are observed at longer periods. VS30 is the only dependent variable used in both models; however, the multilinear form of Flin(VS30) is better able to capture the trends observed in site response at long periods. The mHVSR-informed model reduces variability with respect to SS14 and Flin(VS30) for T < 3.0 s. For longer periods, the reduction of
We present a model for
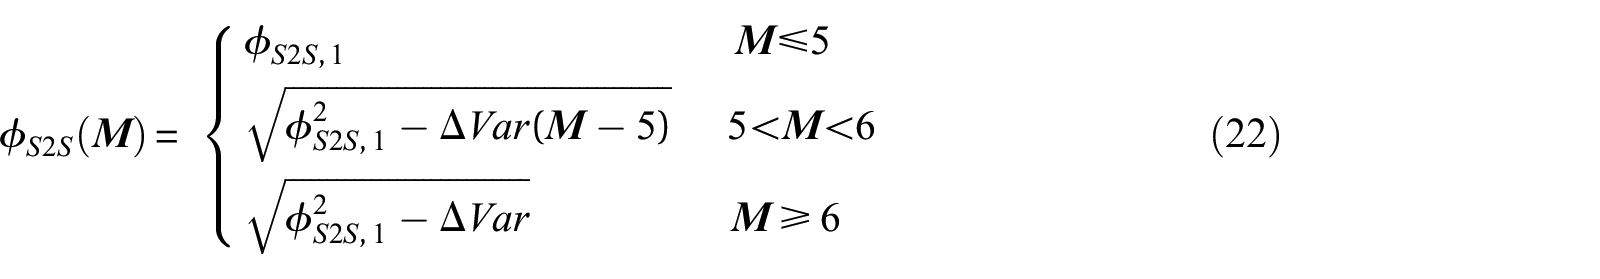
where
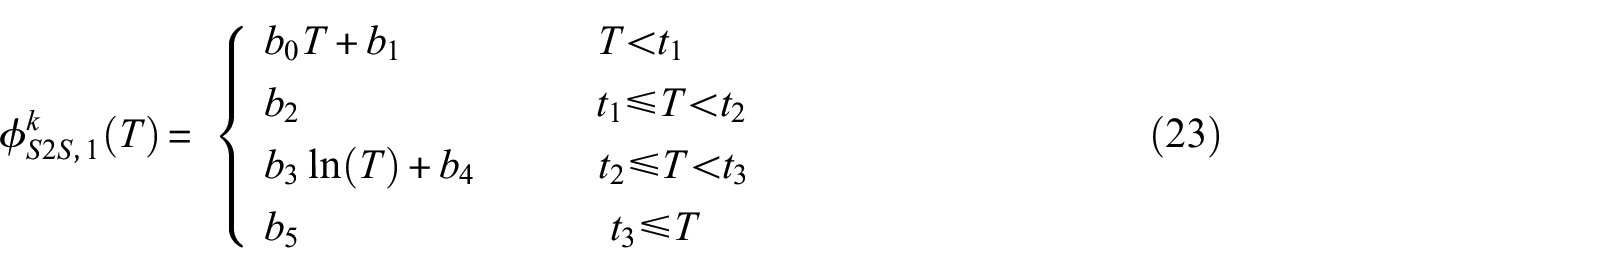
where k is an indicator for which site response model is used (“v” or “
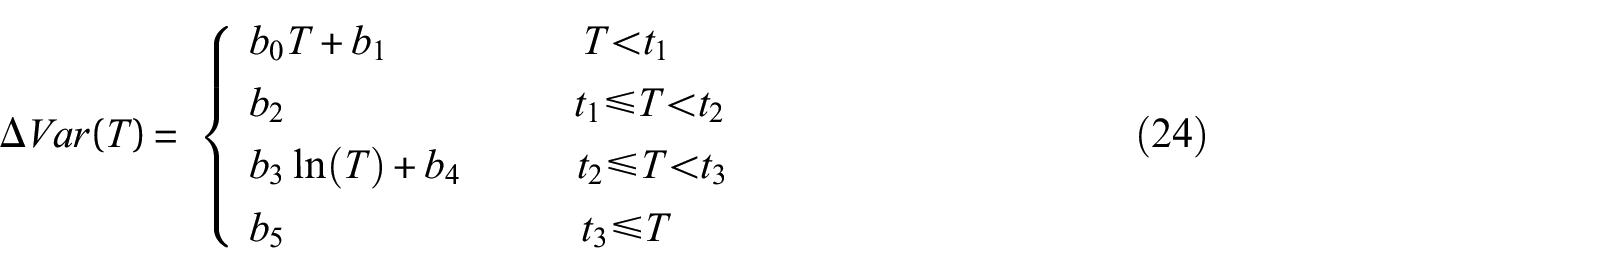
where
Estimated coefficient values for Equations 23 and 24 for each site response model
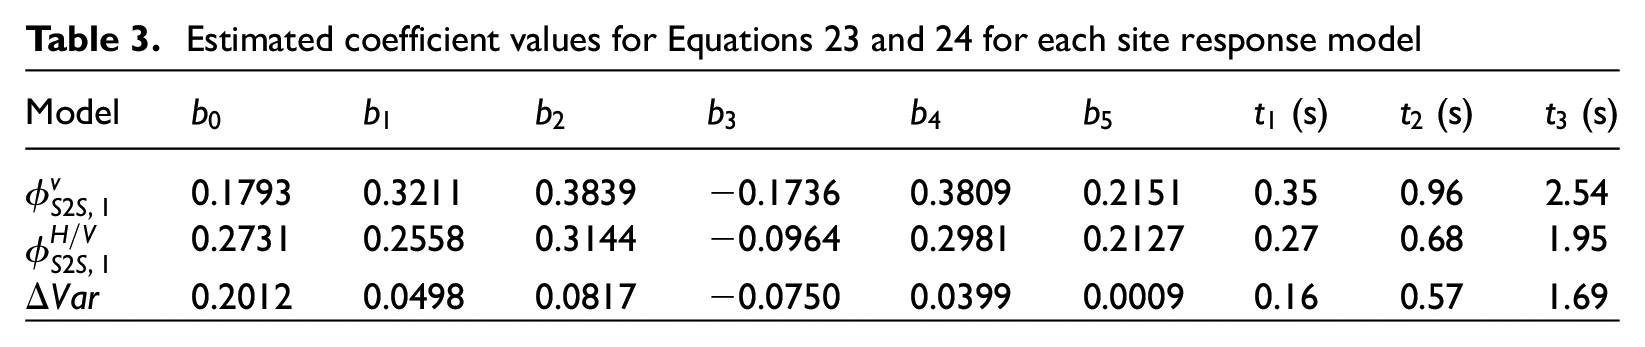
The dependence of
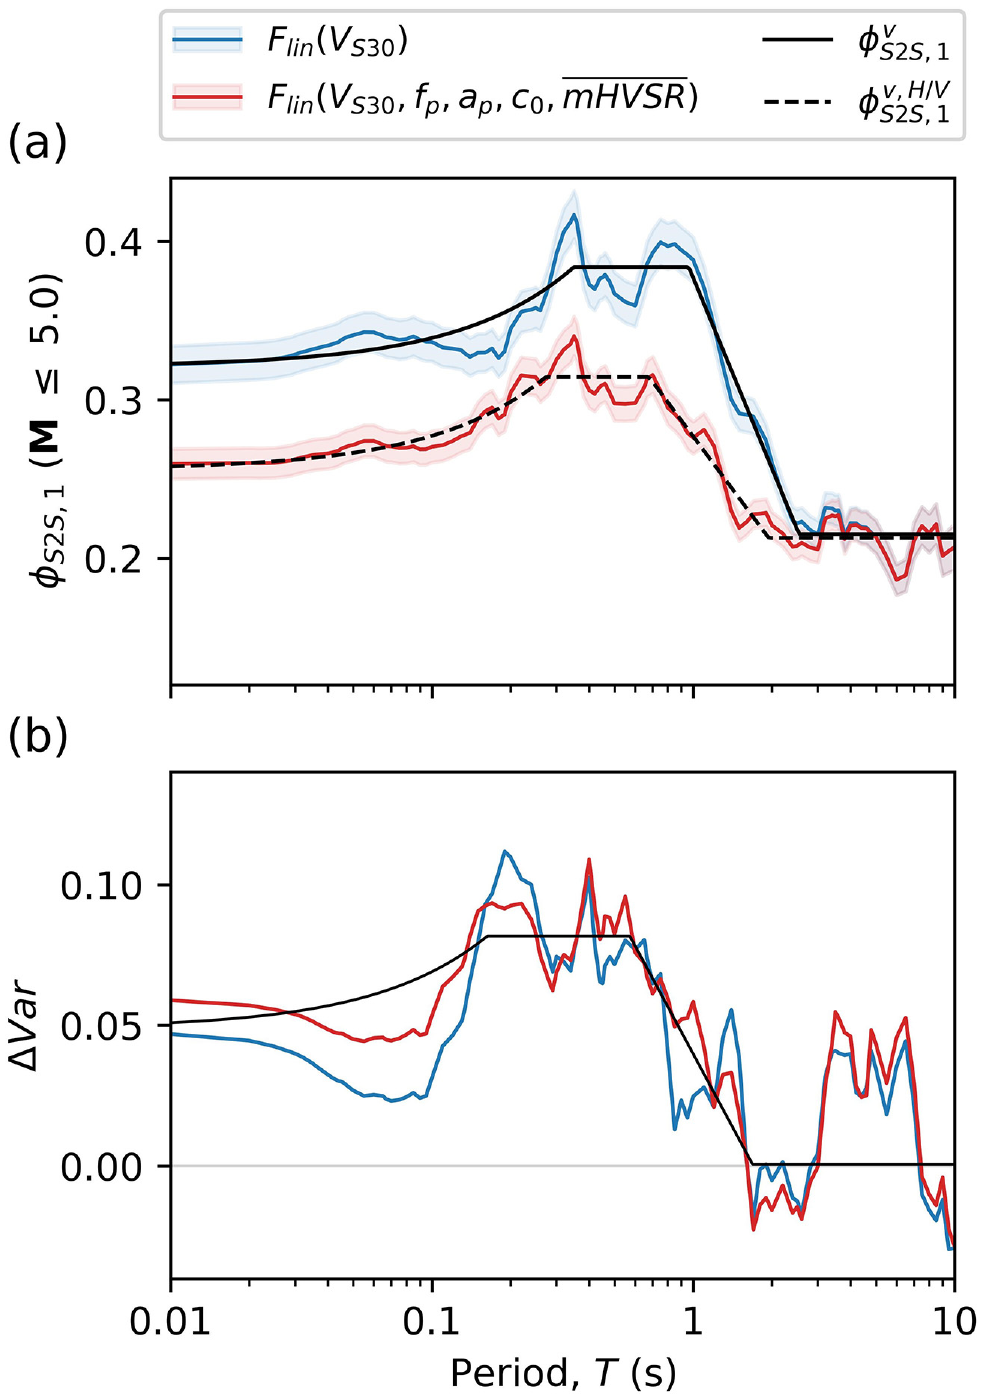
(a) Site-to-site standard deviations (
Conclusions and recommendations
Site conditions in much of the Delta region of California are appreciably softer than the recommended range for global ergodic site response models, such as SS14. Not surprisingly, extrapolation of global models to these softer site conditions leads to biased predictions and is subject to large epistemic uncertainty. In this article, linear site response models specific to Delta sites and the immediate surrounding region are developed to facilitate more reliable ground motion predictions for hazard and risk studies.
We present local site response models conditioned on VS30 and site parameters derived from mHVSR (c0, ap, fp, and
These models were developed using data from 36 seismic stations with VS30 between 100 and 390 m/s, peat thicknesses between 0.4 and 10.1 m, and mHVSR peak frequencies (fp) between 0.6 and 4.0 Hz. Bias could be expected for sites in the study region if they possess site characteristics outside the range of those used during model development. The Delta-calibrated local models should not be considered as applicable to other soft-soil regions without validation. However, the modeling approach outlined herein can be applied to other regions with unusual geologic conditions that may substantially impact site response, or can be generalized for ergodic model development.
This article highlights the utility of mHVSR as a predictor of site response. For Delta sites, the presence or lack thereof of peak features in mHVSR provided a useful indicator of when resonance effects, which act over a relatively narrow range of periods, were manifest. Moreover, we found that site response resonances could be modeled by a parameterization of mHVSR peak features, and general levels of residual site response could be modeled with simple broadband adjustments based on average mHVSR amplitudes. These types of models are advantageous because their functional forms can be easily understood and applied in forward application. It should not be misconstrued that mHVSR on its own can replace VS30, which captures the average response over a wide period range and is generally readily available. Rather, our recommendation is to pair mHVSR with VS30 and other site parameters (e.g. z1.0) to improve site response estimates.
Supplemental Material
sj-xlsx-1-eqs-10.1177_87552930231217165 – Supplemental material for Small-strain site response of soft soils in the Sacramento-San Joaquin Delta region of California conditioned on VS30 and mHVSR
Supplemental material, sj-xlsx-1-eqs-10.1177_87552930231217165 for Small-strain site response of soft soils in the Sacramento-San Joaquin Delta region of California conditioned on VS30 and mHVSR by Tristan E Buckreis, Jonathan P Stewart, Scott J Brandenberg and Pengfei Wang in Earthquake Spectra
Footnotes
Acknowledgements
The authors thank Fabian Bonilla, Jim Kaklamanos, and one anonymous reviewer for their input on this article.
Declaration of conflicting interests
The author(s) declared no potential conflicts of interest with respect to the research, authorship, and/or publication of this article.
Funding
The author(s) disclosed receipt of the following financial support for the research, authorship, and/or publication of this article: Funding for this study was provided by California Department of Water Resources (DWR), Agreement 4600012415. We gratefully acknowledge this support. We want to particularly acknowledge Mike Driller (DWR), Tim Wehling (DWR), and Nick Novoa (DWR) for their assistance and support. Finally, we want to acknowledge Ariya Balakrishnan (Division of Safety of Dams), Albert Kottke (Pacific Gas & Electric), Jamie Steidl (University of California, Santa Barbara and United States Geological Survey), and Ivan Wong (Lettis Consultants International) for their participation and guidance serving as an advisory board.
Supplemental material
Supplemental material for this article is available online.
References
Supplementary Material
Please find the following supplemental material available below.
For Open Access articles published under a Creative Commons License, all supplemental material carries the same license as the article it is associated with.
For non-Open Access articles published, all supplemental material carries a non-exclusive license, and permission requests for re-use of supplemental material or any part of supplemental material shall be sent directly to the copyright owner as specified in the copyright notice associated with the article.