
Abstract
Analysis of prediction–observation residuals from the empirical ground-motion models (GMMs) used in the 2022 New Zealand National Seismic Hazard Model (NZ NSHM) update indicates a general underprediction of ground motions in the period range of
Keywords
Introduction
Historically, empirical ground-motion models (GMMs) have utilized the ergodic assumption (Anderson and Brune, 1999) to predict the mean and standard deviation of earthquake ground-motion amplitudes for sites within broad tectonic categories. Combining ground-motion observations from similar tectonic regions around the world produces sufficient data to constrain global models that are, on average, unbiased. However, because of region-specific variations in earthquake source characteristics, path attenuation, and geologic/geomorphic site conditions, these ergodic global models have large aleatory variabilities (Kotha et al., 2016; Lavrentiadis et al., 2023) and can be biased for specific regions. Bias and variability can also arise from limitations on the data used to constrain these models, for example, the sparsity of soft-soil sites in ground-motion databases (e.g., Campbell and Bozorgnia, 2014).
The comparison of residual standard deviations between global models and site-specific applications illustrates a reduction in variability when site response is constrained at a site using residual analysis from observations (Atkinson, 2006; Lin et al., 2011; Rodriguez-Marek et al., 2011). This reduction in standard deviation, or total sigma, can be on the order of 10%–15% and can be increased to approximately 40% when single-path effects are considered for a given source region and site combination. Efforts continue to further reduce the extent to which the ergodic assumption is employed in empirical GMMs by creating region- or site-specific models.
These models range from regional-scale models that include non-ergodic components for the source, path, and site (Abrahamson et al., 2019; Landwehr et al., 2016; Macedo and Liu, 2022; Sung et al., 2023; Villani and Abrahamson, 2015), to site-specific and basin-specific models that focus on non-ergodic site effects (Rodriguez-Marek et al., 2014; Sung and Abrahamson, 2022). For example, Parker and Baltay (2022) and Nweke et al. (2022) used earthquake observations in the Los Angeles sedimentary basin to empirically constrain site response in the area, while Sung and Abrahamson (2022) used 3D simulations of the Cascadia subduction zone to adjust the Abrahamson and Gülerce (2020) GMM to account for amplification of the Seattle basin. In NZ, Bradley (2013) modified the Chiou and Youngs (2014) GMM based on a NZ-specific crustal earthquake data set, and Bradley (2015) developed non-ergodic adjustment factors for application of this GMM to the Canterbury region. These models sit on an ergodic continuum (e.g., Chapter 8 in Baker et al., 2021) that ranges between the extremes of ergodic, and fully non-ergodic, and is governed by the extent of region- and site-specific data used to constrain the model.
The NGA-West2 (Bozorgnia et al., 2014) and NGA-Sub (Bozorgnia et al., 2022) projects were global efforts to improve GMMs for crustal and subduction regions, respectively. The GMMs developed, which are commonly used in nationwide and site-specific probabilistic seismic hazard analyses (Gerstenberger et al., 2024; Petersen et al., 2020), include global versions and regionalizations for broad geographic regions. For example, the Kuehn et al. (2020), Abrahamson and Gülerce (2020), and Parker et al. (2022) GMMs have regionalization for Japan, Cascadia, Taiwan, Alaska, and other regions around the world. The Next Generation Attenuation (NGA)-West2 and NGA-Sub GMMs were used in the 2022 New Zealand National Seismic Hazard Model (NZ NSHM) update (Bradley et al., 2024). Although some of the NGA-Sub models include NZ-specific regionalizations, these models encompass NZ as a whole, not individual basins such as the Wellington basin. In addition, these NZ-specific regionalizations are constrained with a sparse data set, particularly for the magnitude and distance bins that dominate the hazard (Bradley et al., 2024). These sentiments highlight that additional work is required to regionalize models to account for small-scale basin-specific site amplification globally, and in a New Zealand context.
The Wellington basin, in the capital city of NZ, has been observed to strongly amplify ground motions, especially in the vibration period range of
This article focuses on quantifying the performance of empirical GMMs at predicting site-specific ground motions in the Wellington region of New Zealand. It is the first study that rigorously and systematically assesses residuals in the Wellington region. Unlike prior non-ergodic site-response studies that have considered a single GMM (e.g., Atkinson, 2006; Bradley, 2015; Rodriguez-Marek et al., 2011; Sung and Abrahamson, 2022), this study evaluates all 15 GMMs used in the NZ NSHM logic tree for developing site and basin-specific regionalizations of site-response residuals for all the GMMs. Models from different tectonic types are compared, and the variability between these models is assessed. Site terms are grouped geographically by specific basin or valley sub-regions in Wellington to understand small-scale fluctuations in basin and site effects.
Ground motions and sites considered
Ground-motion database
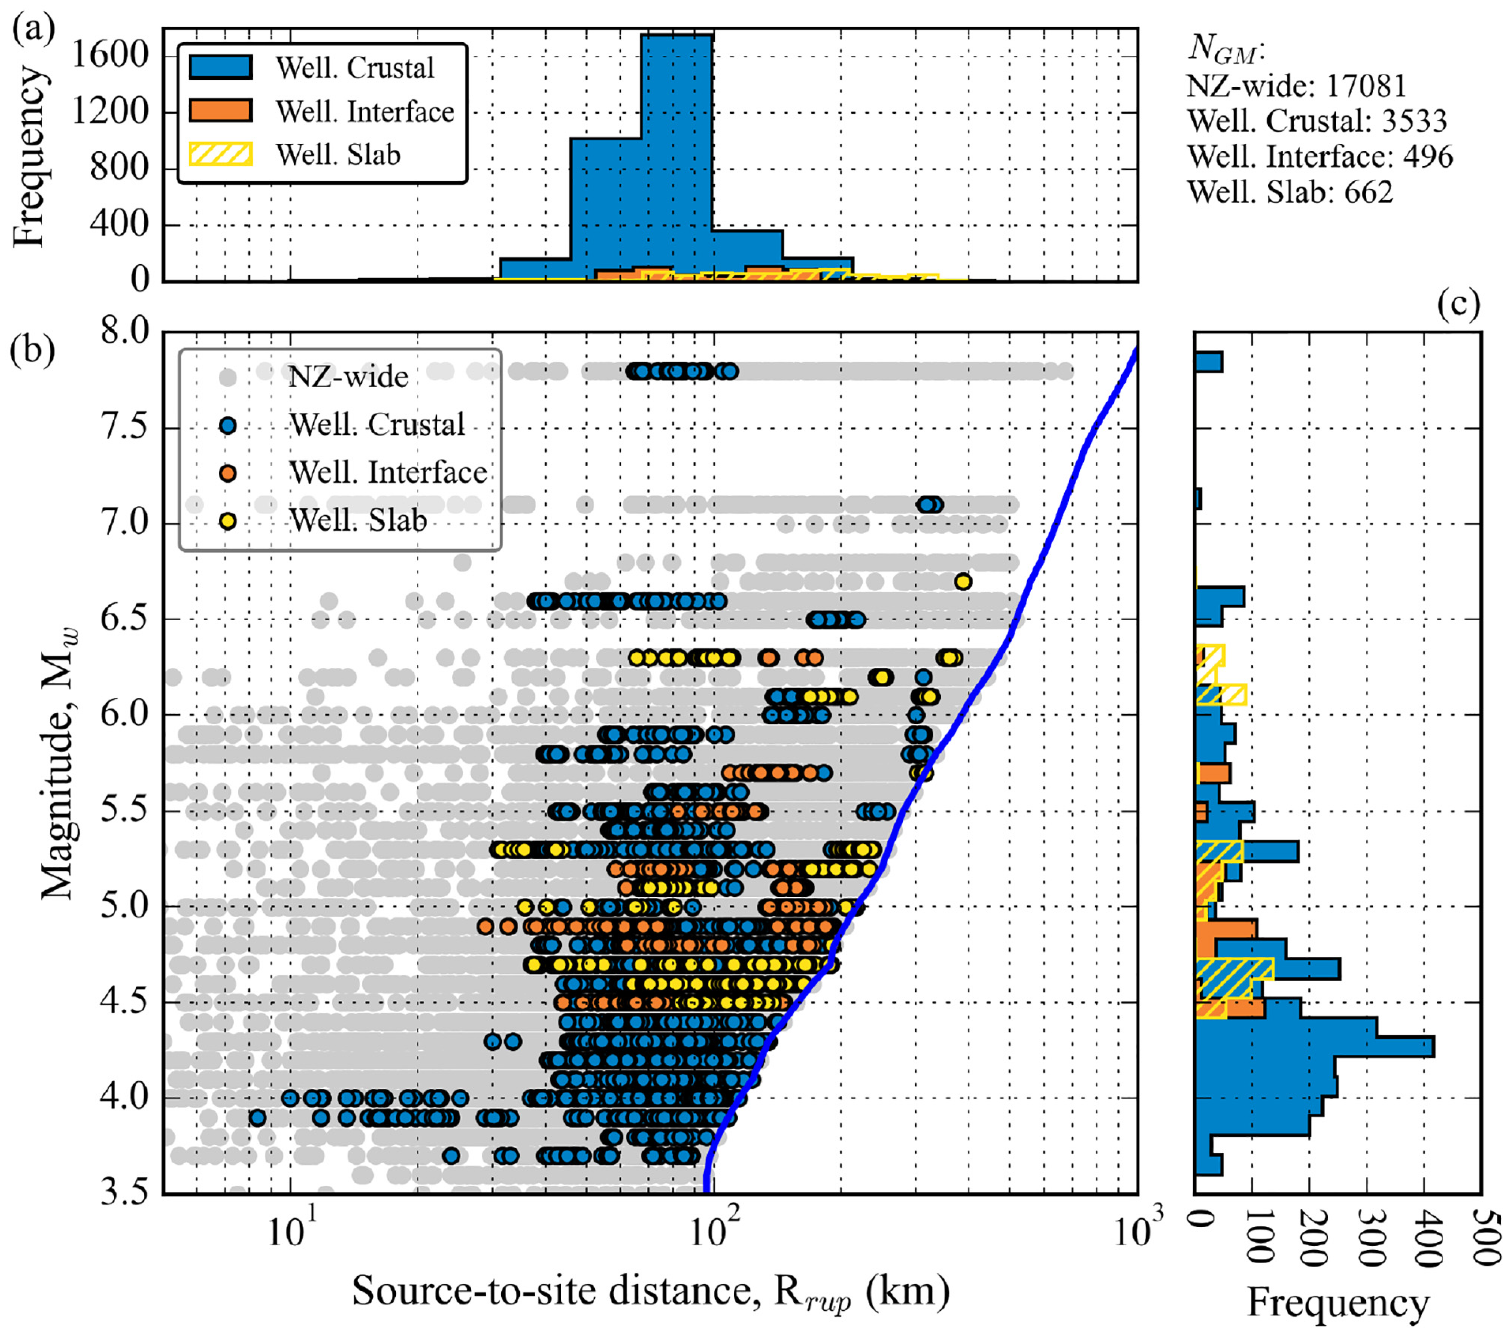
We considered the data set of Lee et al. (2023), which is based on a subset of the New Zealand ground-motion database (NZ GMDB) v1.0 (Hutchinson et al., 2022). The remaining data set, after application of the filtering criteria imposed by Lee et al. (2023), contains 17,081 ground motions across New Zealand, of which 4,691 records exist at sites in the Wellington Region, including the Lower Hutt and Upper Hutt valleys. The filtering criteria by Lee et al. (2023) include minimum magnitude (3.5 and 4.5 for crustal and subduction, respectively), maximum rupture distance (300 and 500 km for crustal and subduction, respectively), accelerometer channels only, and a minimum usable frequency. In addition, we impose a minimum number of three records per event and site for each intensity measure (IM) to robustly calculate event and site residuals. Figure 1 shows the distributions of
Earthquake source and ground-motion
The spatial distribution of earthquake epicenters for the NZ-wide and Wellington region subsets of ground motions is shown in Figure 2 for crustal, and slab and interface subduction sources. The majority of crustal events recorded at Wellington SMSs are located around the north-east corner of the South Island, which could result in some mapping of path effects into the site residuals if the path effects of crustal events originating from the South Island and Cook Strait are not well captured. However, with inclusion of all tectonic types, there is generally good azimuthal coverage. In subsequent results, we show that site residuals are relatively consistent between tectonic type, illustrating that mapping of path effects to site terms is a second-order effect in this data set.
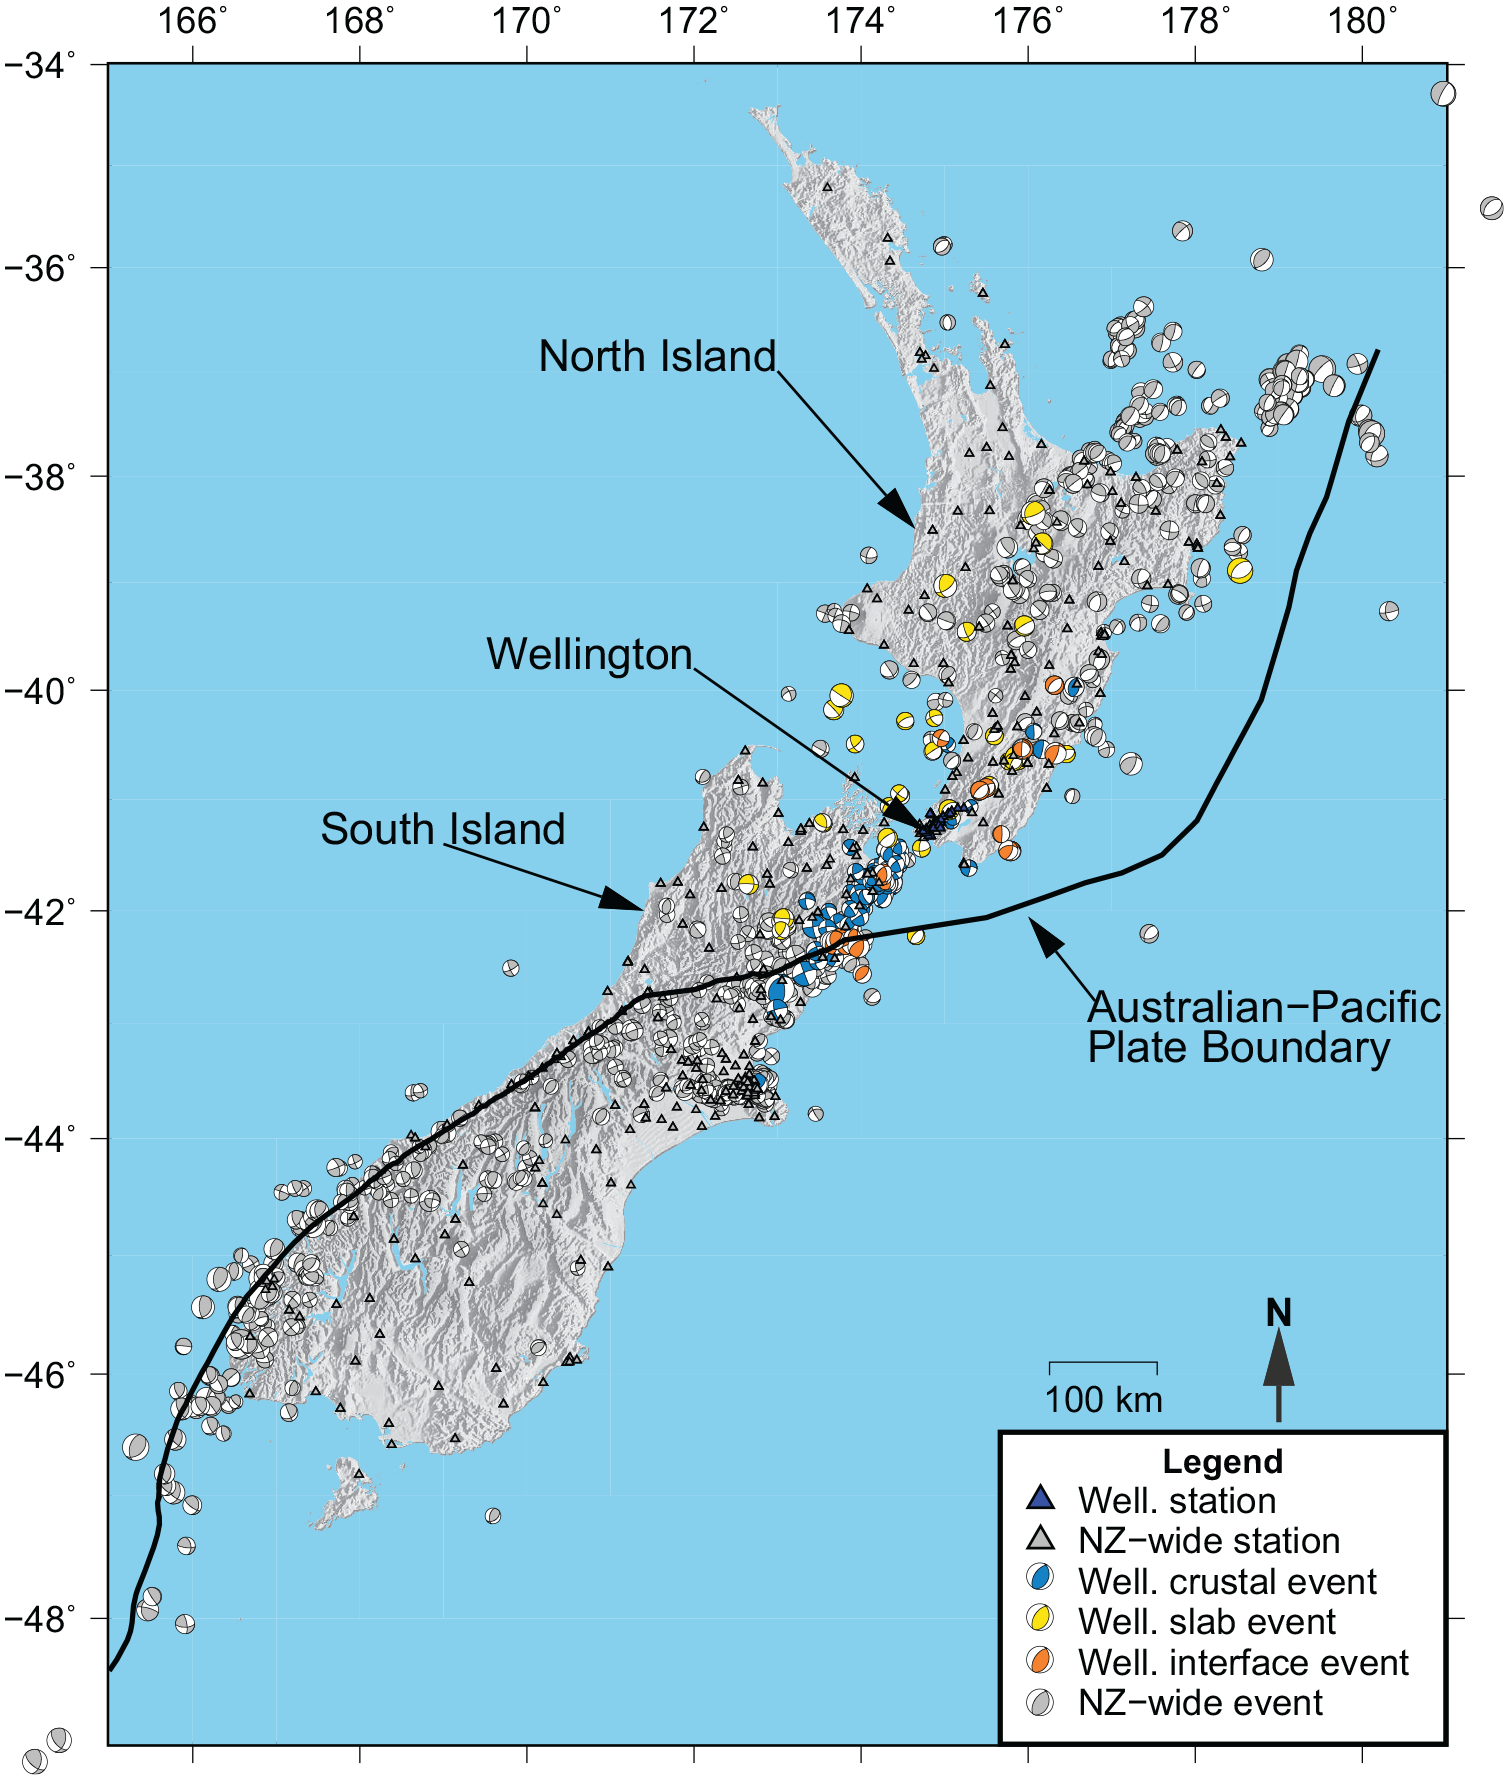
A map showing the spatial distribution of stations and earthquake epicenters used in this study. The colors in the legend distinguish between the Wellington region (“Well” in legend) subset of ground motions, and the NZ-wide subset for which the residual analysis was performed. Focal mechanisms for events with ground motions recorded at Wellington stations are color-coded based on event tectonic type. The size of all focal mechanisms is scaled by moment magnitude. The location of SMS in the Wellington region is shown in blue triangles.
Sites in the Wellington region
SMS sites in the greater Wellington region, including the surrounding hills and valleys, were subdivided based on location, geomorphic categorization, basin geometry, and site-response characteristics. The sub-regions considered generally correspond to specific sedimentary basins and valleys. These sub-regions include Te Aro, Thorndon, Lower Hutt, Upper Hutt, Miramar, Karori, Porirua, and Wainuiomata, as identified on the map in Figure 3. Figure 4 provides more zoomed-in versions of Figure 3 for different regions and identifies the station IDs for all SMS. The Wellington Central Business District (CBD) spans across the Te Aro and Thorndon areas. Sites were also divided into four geomorphic categories including basin, basin edge, valley, and hill by Tiwari et al. (2023) using category definitions by Nweke et al. (2022). Table 1 provides metadata and site characteristics for all the sites in the greater Wellington region, including the depth to a shear wave velocity
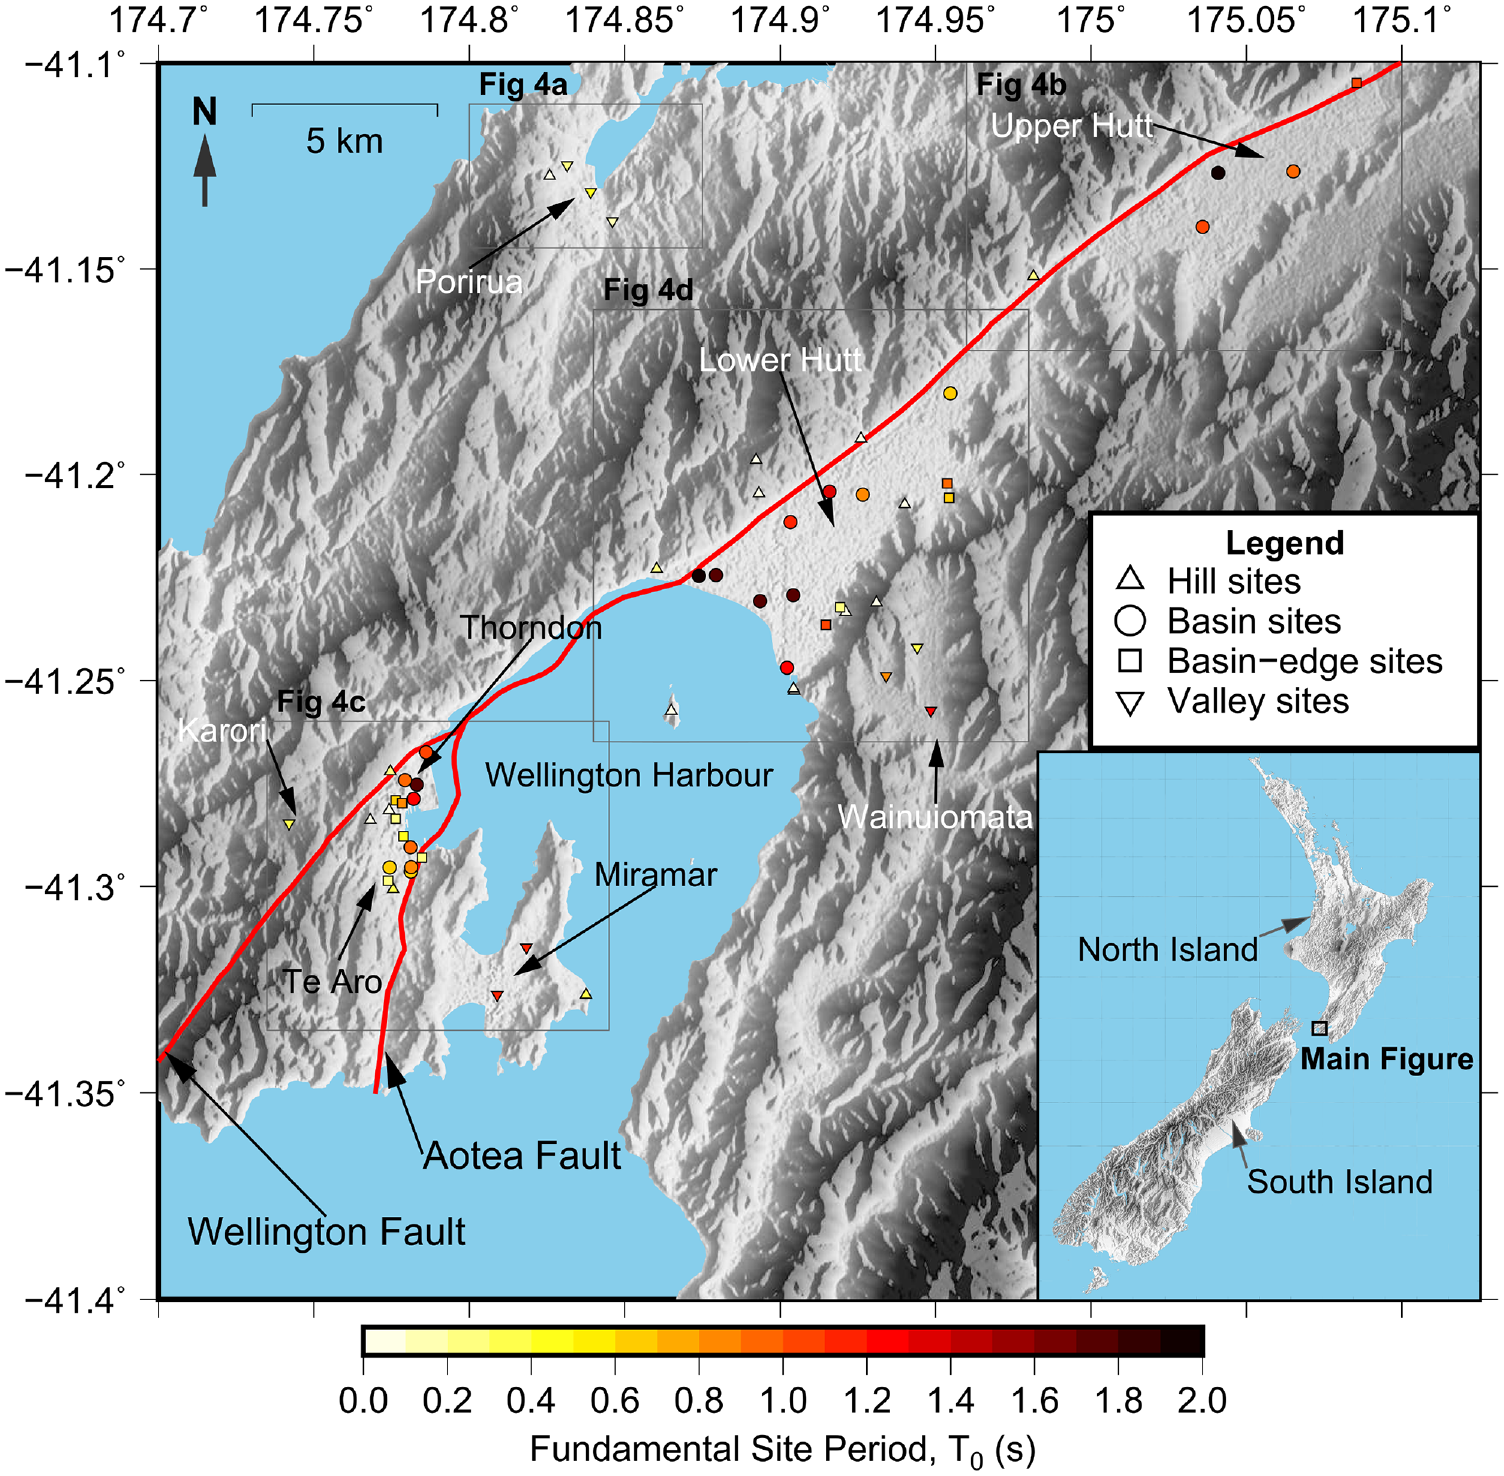
A map showing the location of all sites in the greater Wellington region. Site symbols are color-coded by
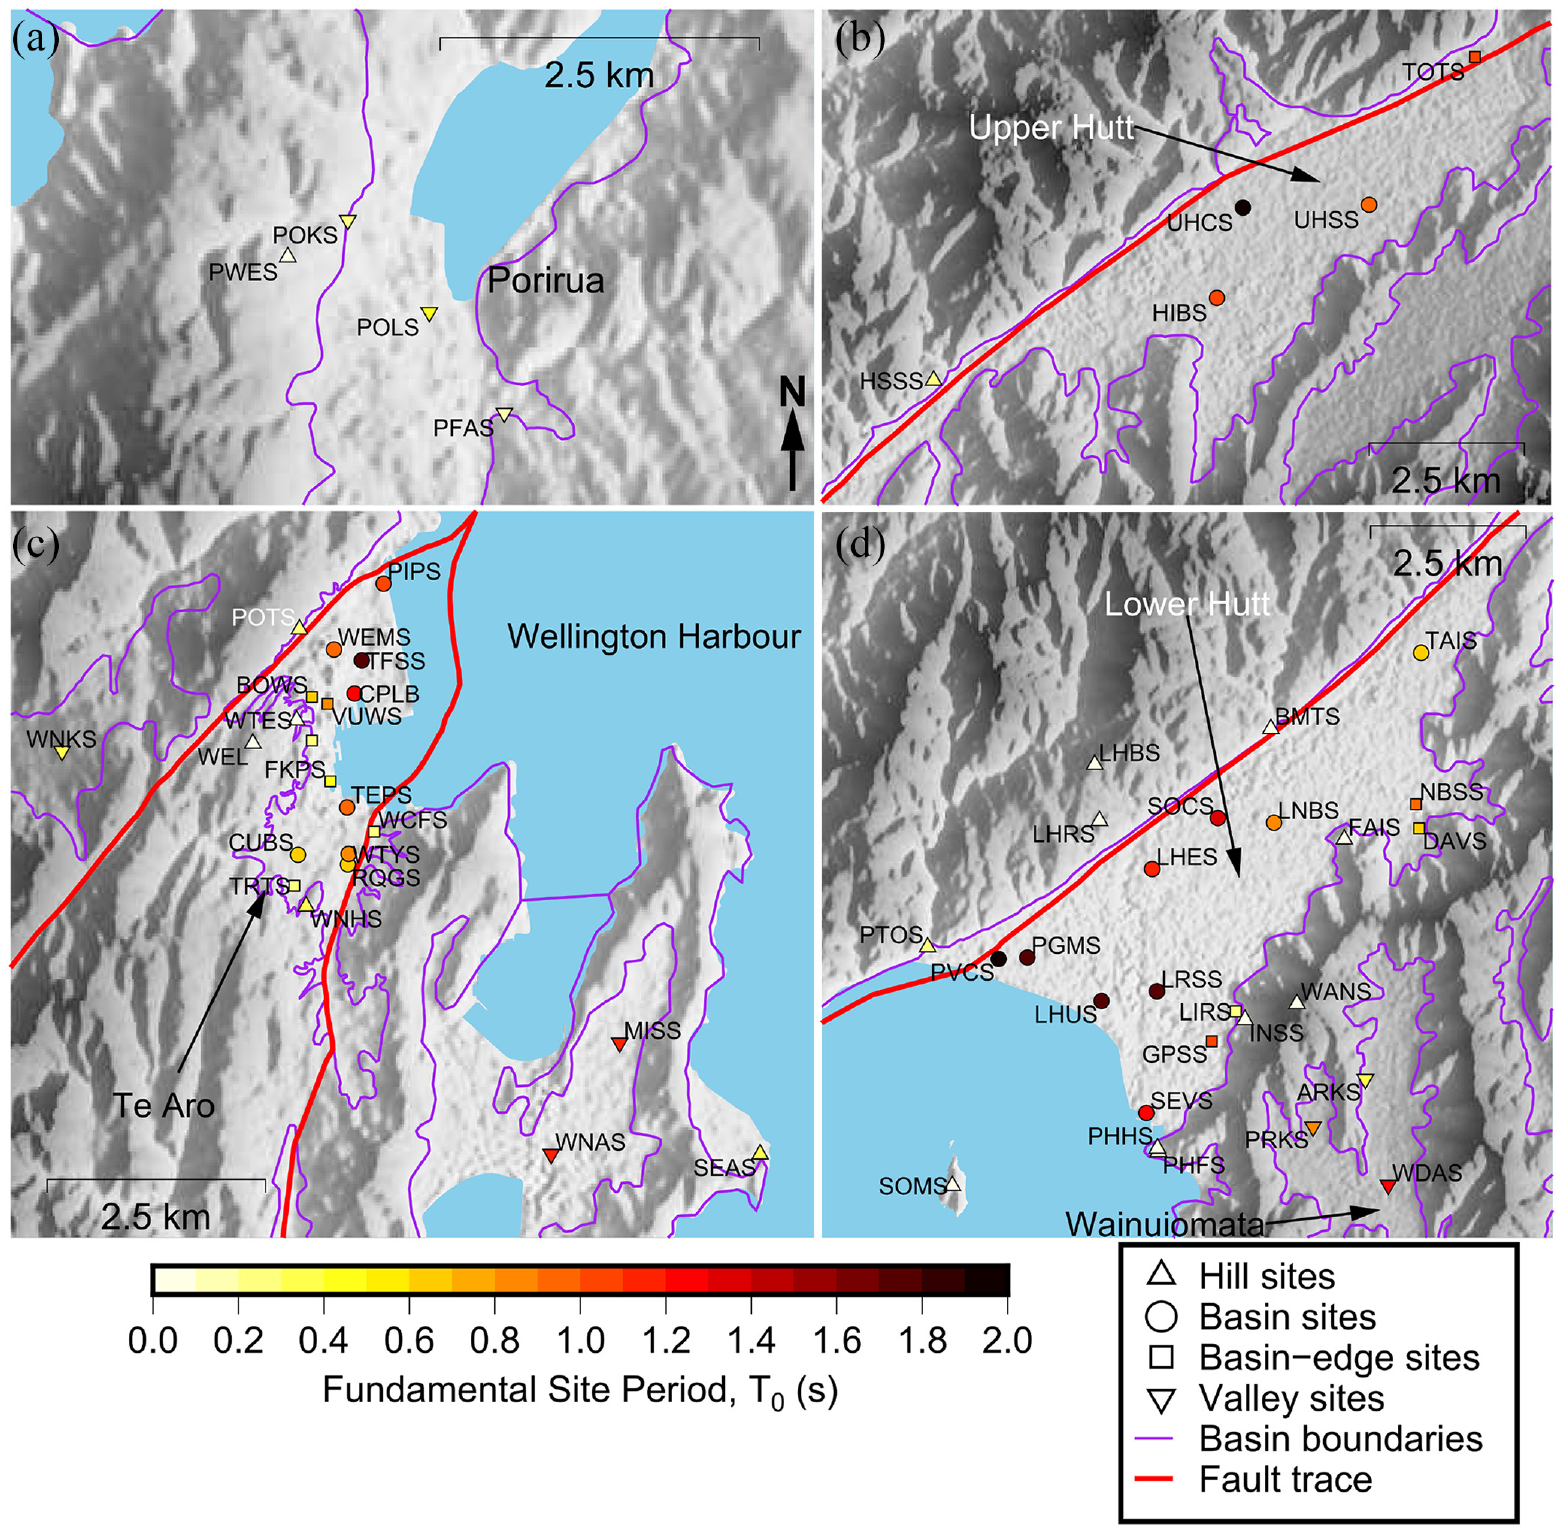
Maps identifying the station ID for all SMS considered in the Wellington region divided into regions as (a) Porirua, (b) Upper Hutt, (c) Wellington CBD, Karori, and Miramar, and (d) Lower Hutt and Wainuiomata. The locations of each subfigure, relative to the entire Wellington region, are identified in Figure 3. Site symbols are color-coded by
Metadata for Wellington region strong motion stations (SMS)
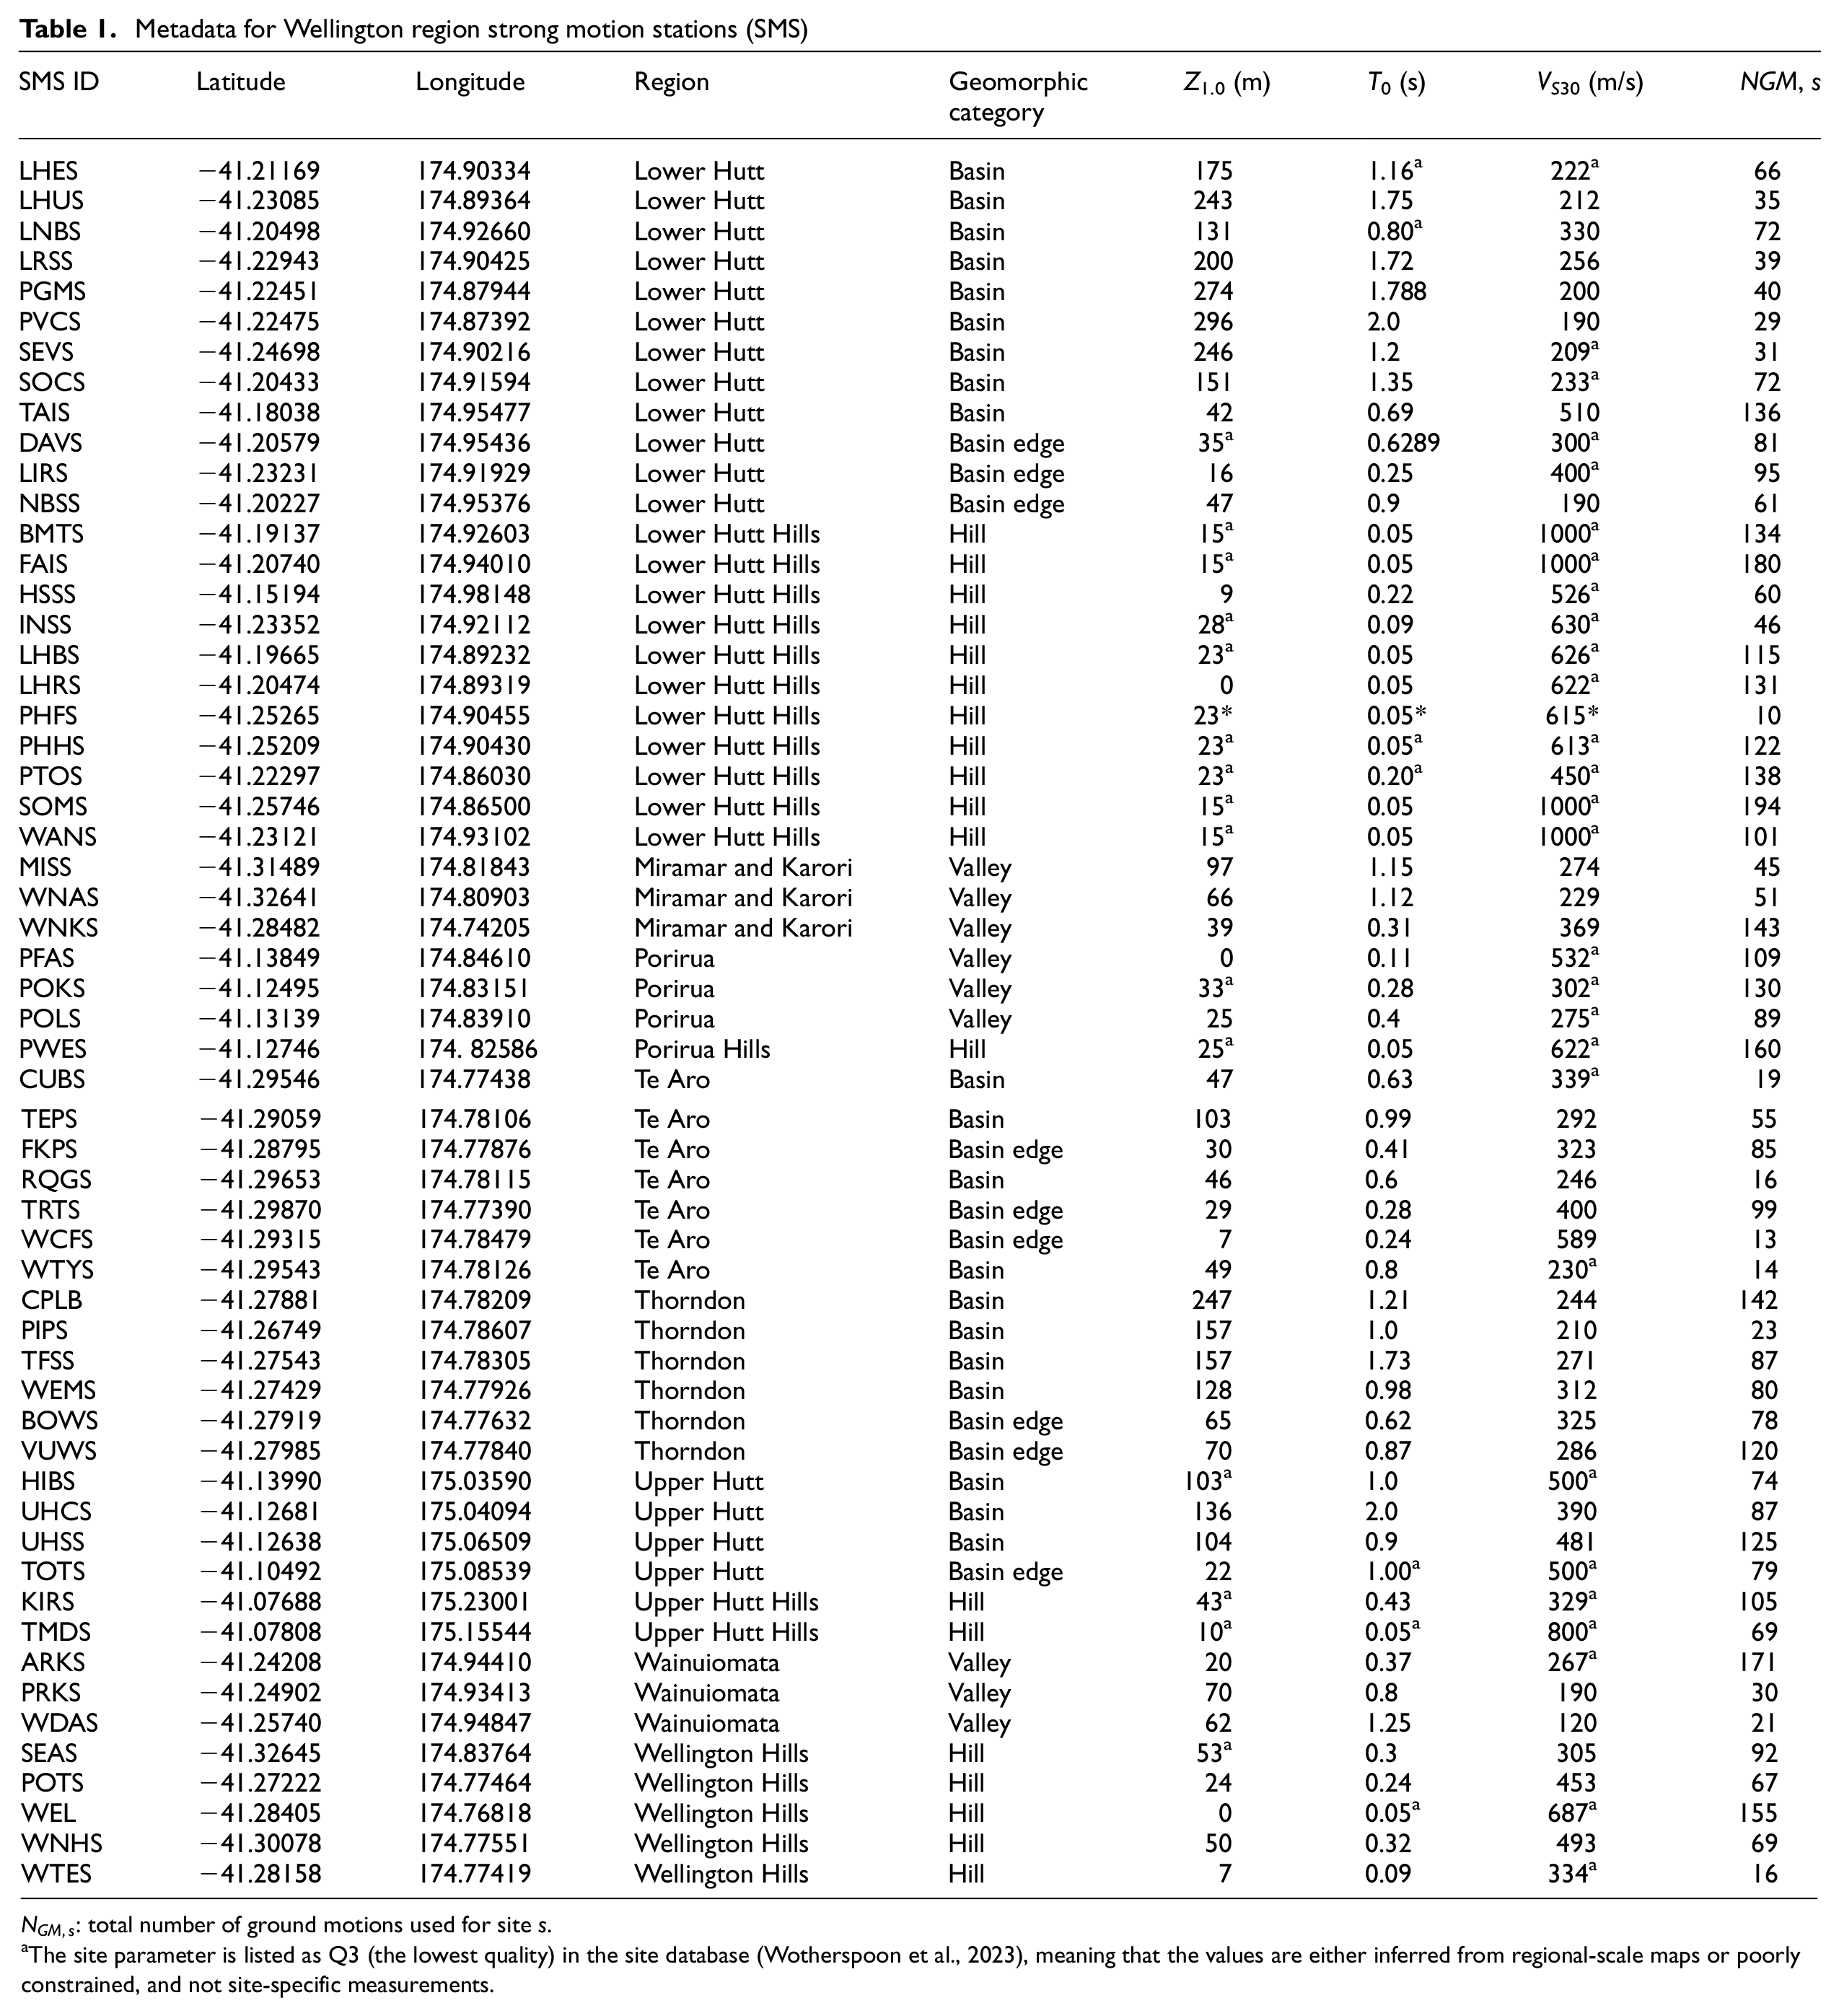
The site parameter is listed as Q3 (the lowest quality) in the site database (Wotherspoon et al., 2023), meaning that the values are either inferred from regional-scale maps or poorly constrained, and not site-specific measurements.
Methodology
Residual analysis
The performance of GMMs on a region-by-region and site-by-site basis is assessed using mixed-effects residual analysis to decompose the residual into its various components (e.g., Al Atik et al., 2010; Bradley, 2015). The total prediction residual,

where
To identify systematic trends in prediction bias for a given GMM

where for each IM,

GMMs investigated and weighting scheme
All 15 GMMs used in the 2022 NZ NSHM (Bradley et al., 2024) are included in the subsequent analysis. In addition to model-specific mixed-effects residuals, we also sought to compute a resulting weighted average over all GMMs considered. The model-specific weight

where
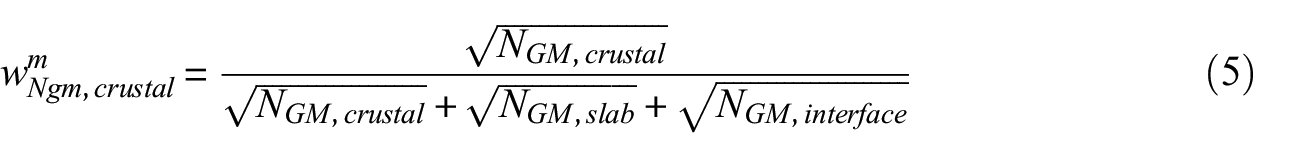
where
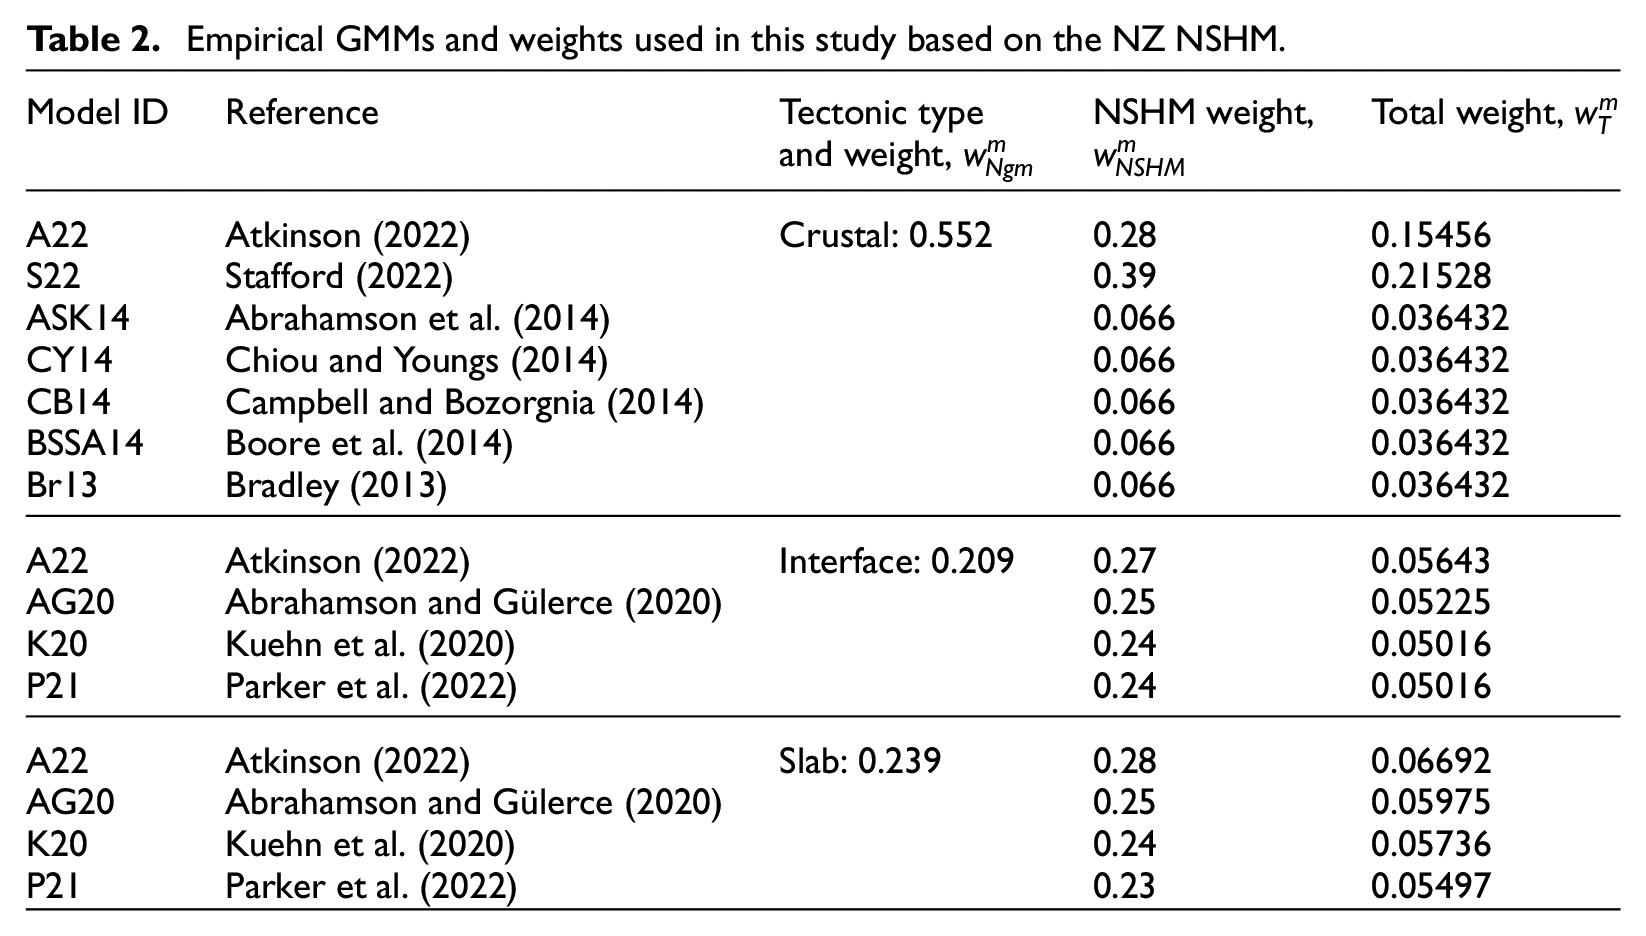
Empirical GMMs and weights used in this study based on the NZ NSHM.
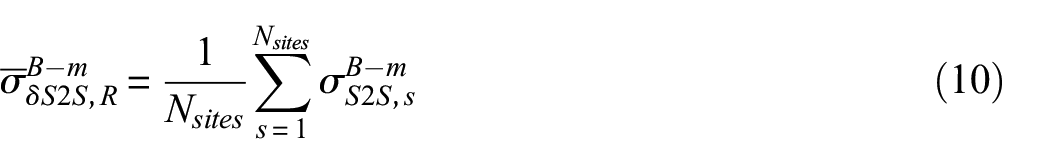
Computation of the weighted mean,
, and between-model variability,
As described in the “Residual analysis” section, the site-to-site residual is calculated for every site
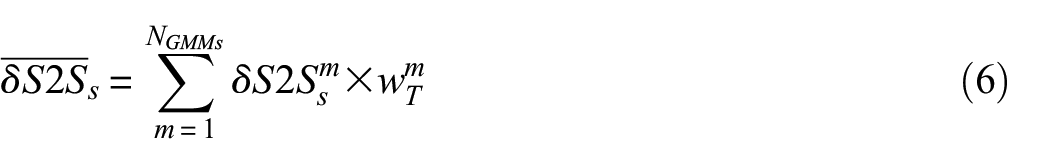
where
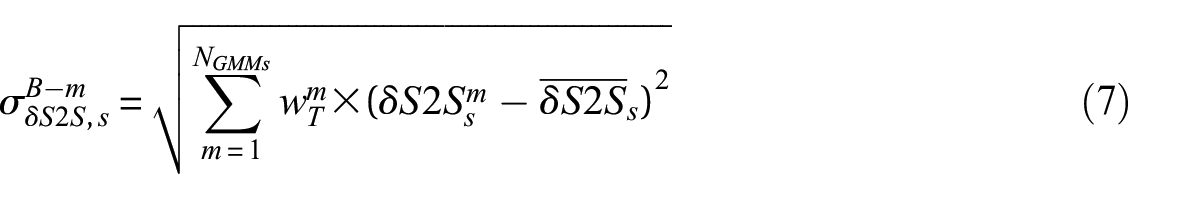
We subsequently also consider the mean and standard deviation of
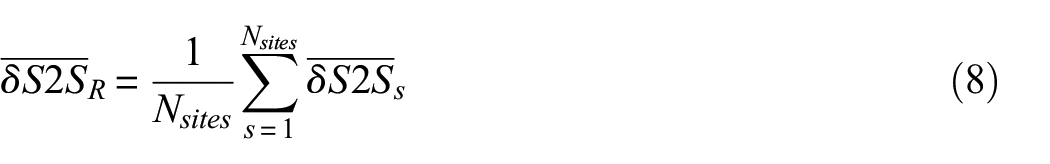
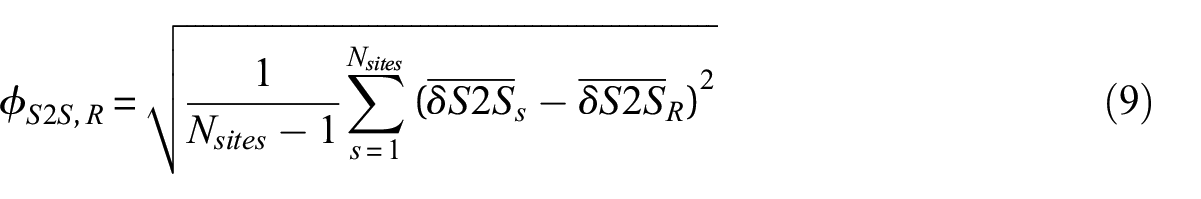
where
Residual analysis results
Between-model variability in site-specific residuals
Figure 5 illustrates the site-to-site residuals,
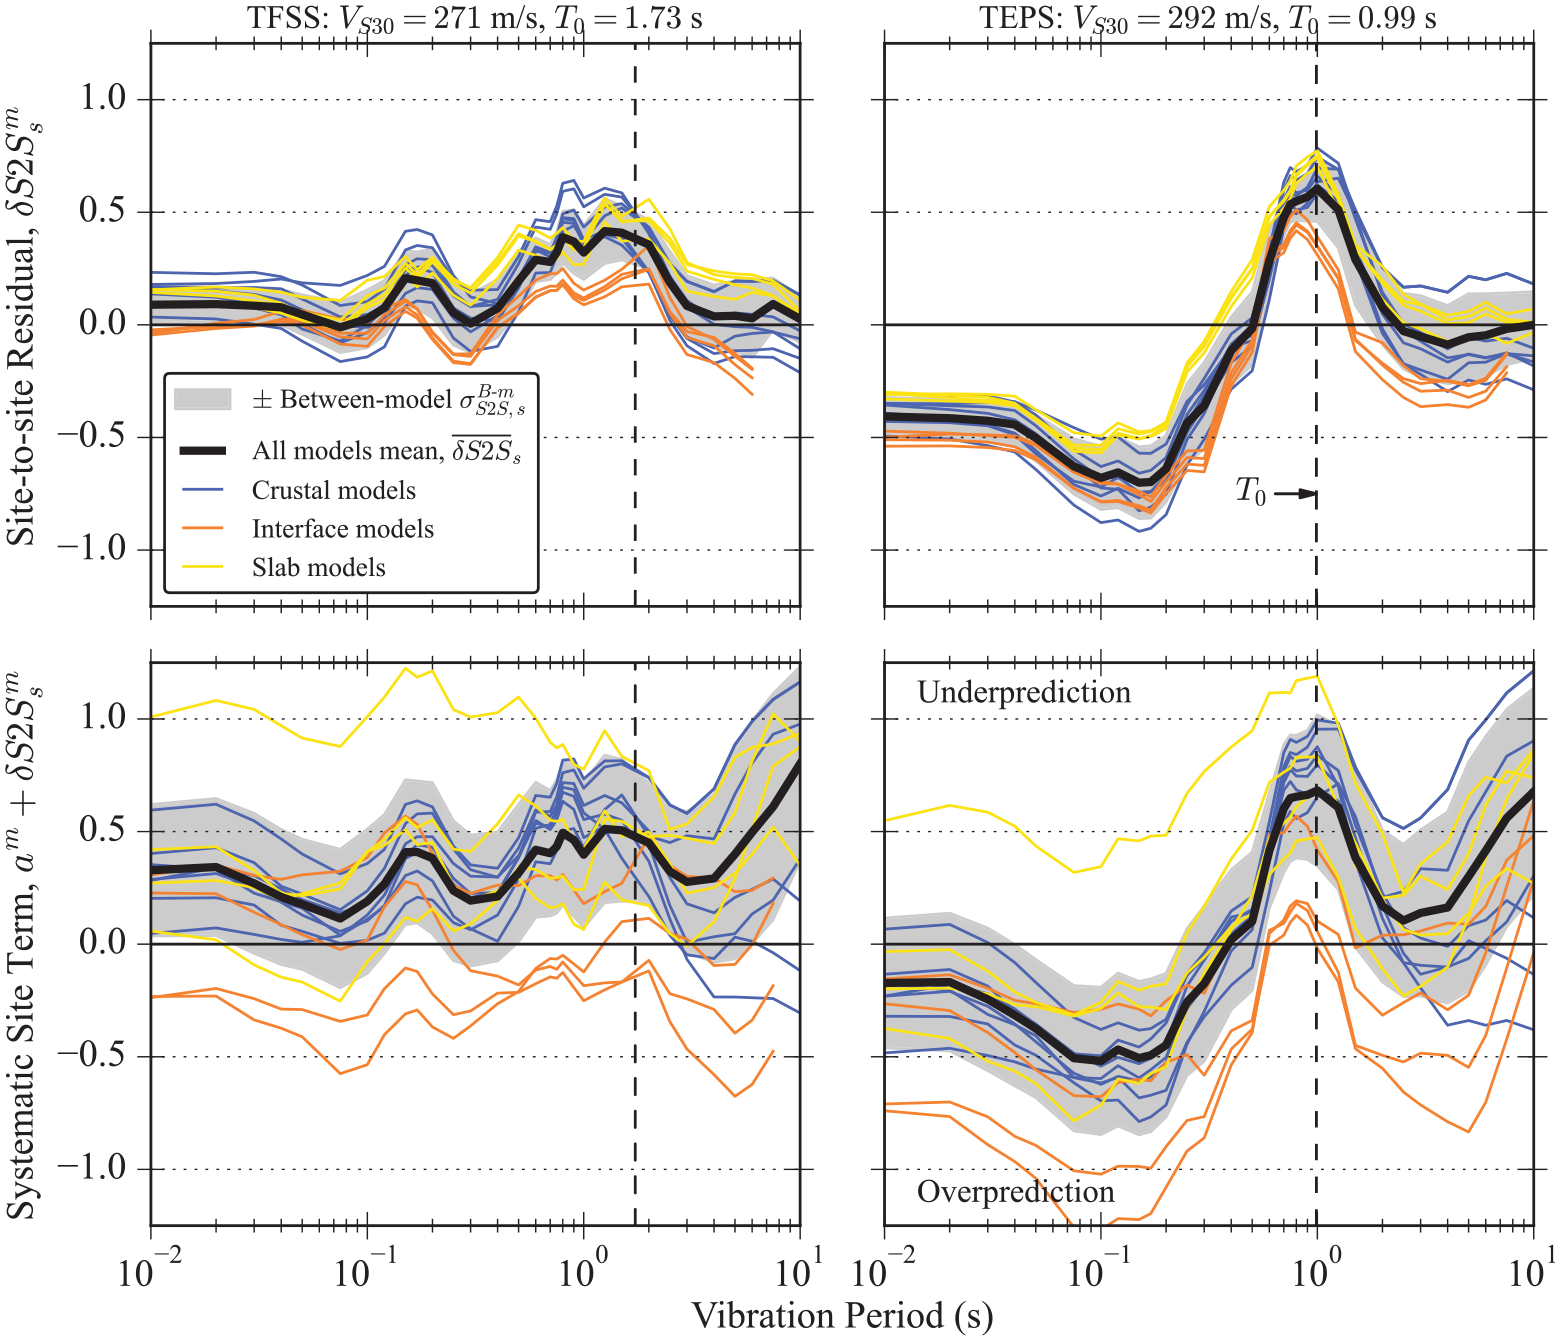
Site-to-site residuals,
It is apparent from Figure 5 that the between-model variability is significantly lower for
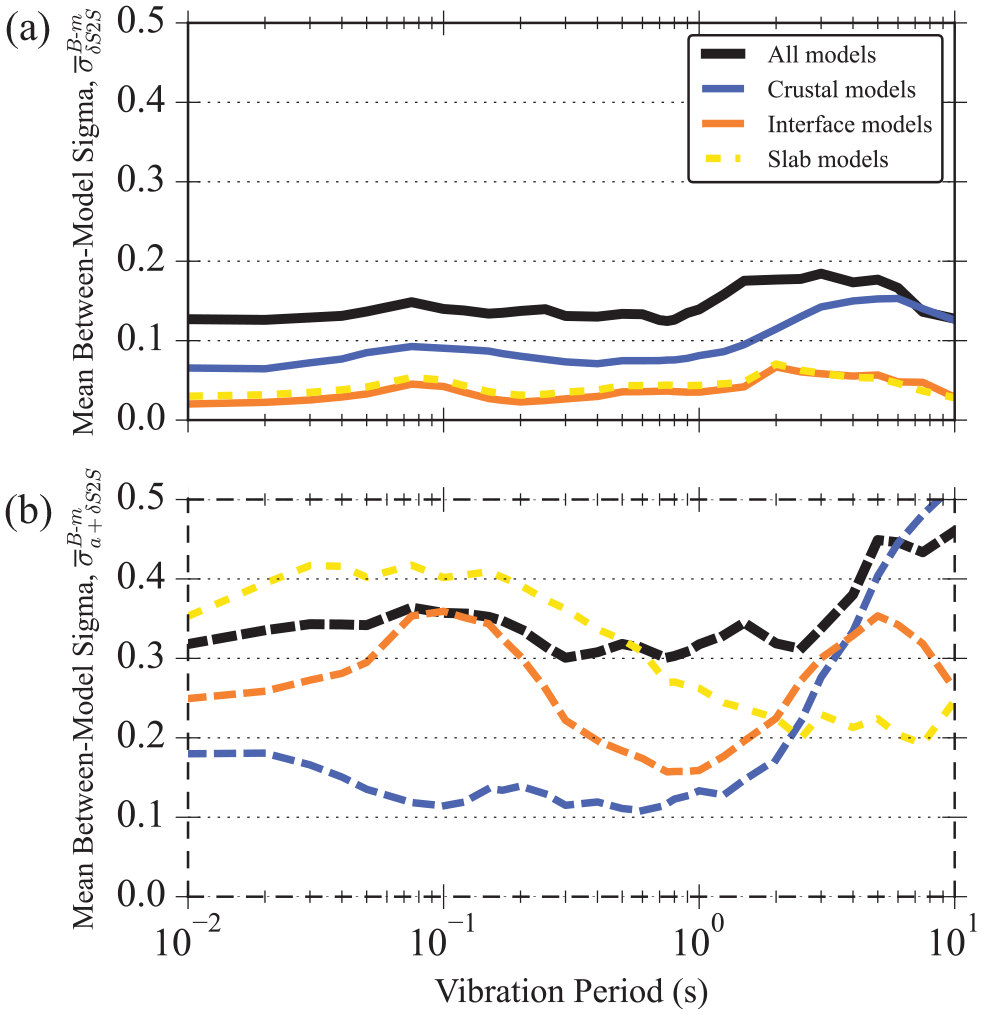
Mean between-model standard deviations of (a)
Interestingly, the site terms between interface and slab events are different even though the predictions for these subduction ground motions use the same base GMMs (refer to Table 2). For example, in Figure 5, the peak value of the site terms for interface events is approximately 50% lower than that from slab and crustal events. Figure A.1 in the Online Supplemental Material, which plots site terms for all sites in three of the basin sub-region separated by tectonic type, also shows that the interface models produce lower peak values of the site term than slab and crustal models across the board. This illustrates, in our opinion, that source and path effects are being mapped into the systematic site term. This is one reason why some previous studies include an additional path-to-path term in the regression and consider single-path effects (e.g., Al Atik et al., 2010; Lin et al., 2011; Rodriguez-Marek et al., 2011).
Previous studies focusing on the removal of the ergodic assumption in site-response models of GMMs have generally focused on a single GMM (e.g., Atkinson, 2006; Bradley, 2015; Rodriguez-Marek et al., 2011; Sung and Abrahamson, 2022); however, in probabilistic seismic hazard analysis (PSHA) applications, a logic tree containing many GMMs is required (Chapter 6 in Baker et al., 2021). One of the novelties of this study is the consideration of all GMMs in the logic tree and investigation into how non-ergodic site-response adjustments can be applied in such a framework. Subsequent sections focus on the average site-to-site residual between GMMs,
The rational for calculating and presenting these average site terms is to retain the natural between-model variability, which partially accounts for the epistemic uncertainty in the ground-motion modeling process. In the weights-on-models logic tree approach of hazard predictions, if a site term for a specific site and model pair is used as an adjustment to the mean prediction for each model, the resulting between-model variability will be heavily reduced. This suppressed variability is not desirable and will likely partially carry into scenarios that dominate the hazard, which are outside the data set considered here. This between-model variability is retained by using the mean site term as an adjustment to all models.
Average and standard deviation of
for all sites in the Wellington region
In Figure 5, it was illustrated that, for two basin sites, the site-to-site residuals indicate relative underprediction at approximately
Weighted average site-to-site residuals,
To further interrogate site residuals in Wellington, site-to-site terms can be examined by geomorphic category to explore causative features not captured by the site-response models. Figure 8 plots the average and standard deviation of site-to-site residuals for basin, basin-edge, valley, and hill sites. This illustrates that basin sites are the only category where the average site response is underpredicted for
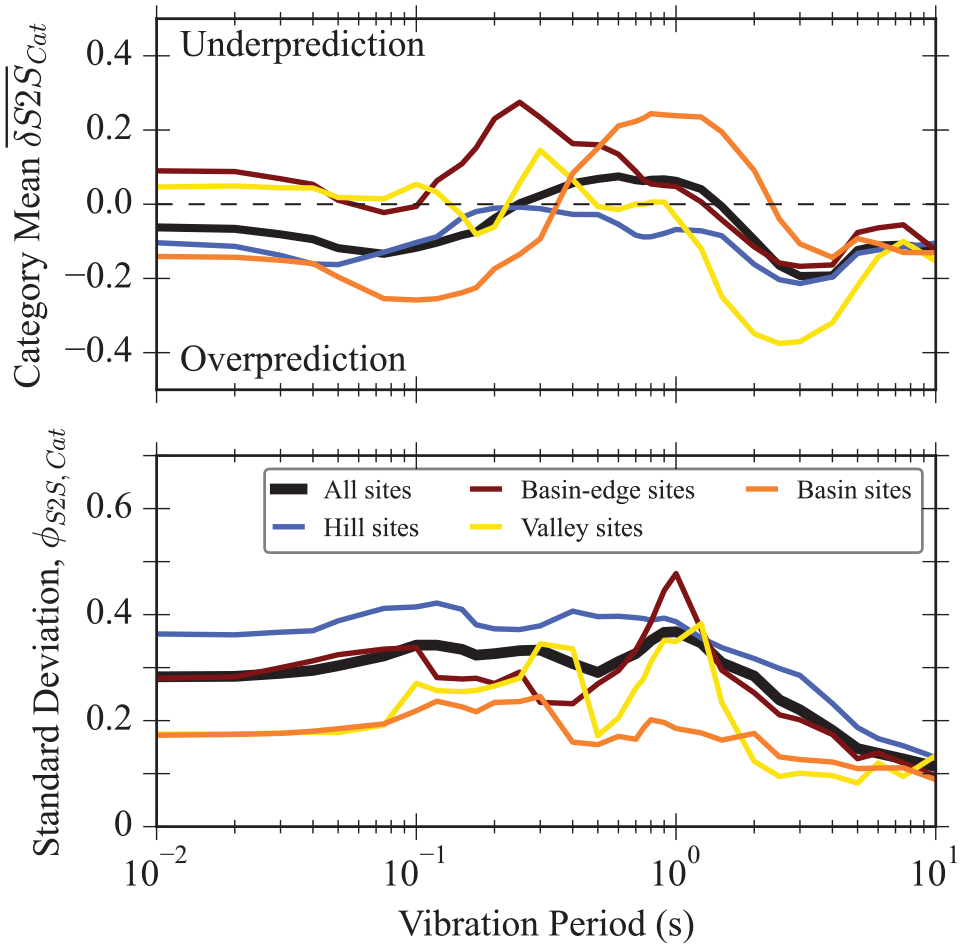
Category mean and standard deviation of site-to-site residuals for sites grouped by geomorphic category.
The segregation of mean site-to-site residuals by geomorphic categories in Figure 8 also illustrates that the site-to-site standard deviation is reduced for basin sites, and to a lesser extent valley sites, compared with all sites together. This is because the nature of the site response for these basin sites is relatively similar between sites compared with other categories, such as hill and basin-edge sites, for which there is significantly higher variability between-site responses. This is shown in Figure A.2 in the Online Supplemental Material where site terms for individual basin sites resemble one another given that the sites are all within similar basins. Figure A.2 in the Online Supplemental Material also shows the higher variability between hill sites which may be complicated due to topographic effects that can amplify or deamplify ground motions at different periods depending on the local concavity and size of the topographic feature (e.g., Rai et al., 2017).
Overall model bias and components of standard deviation
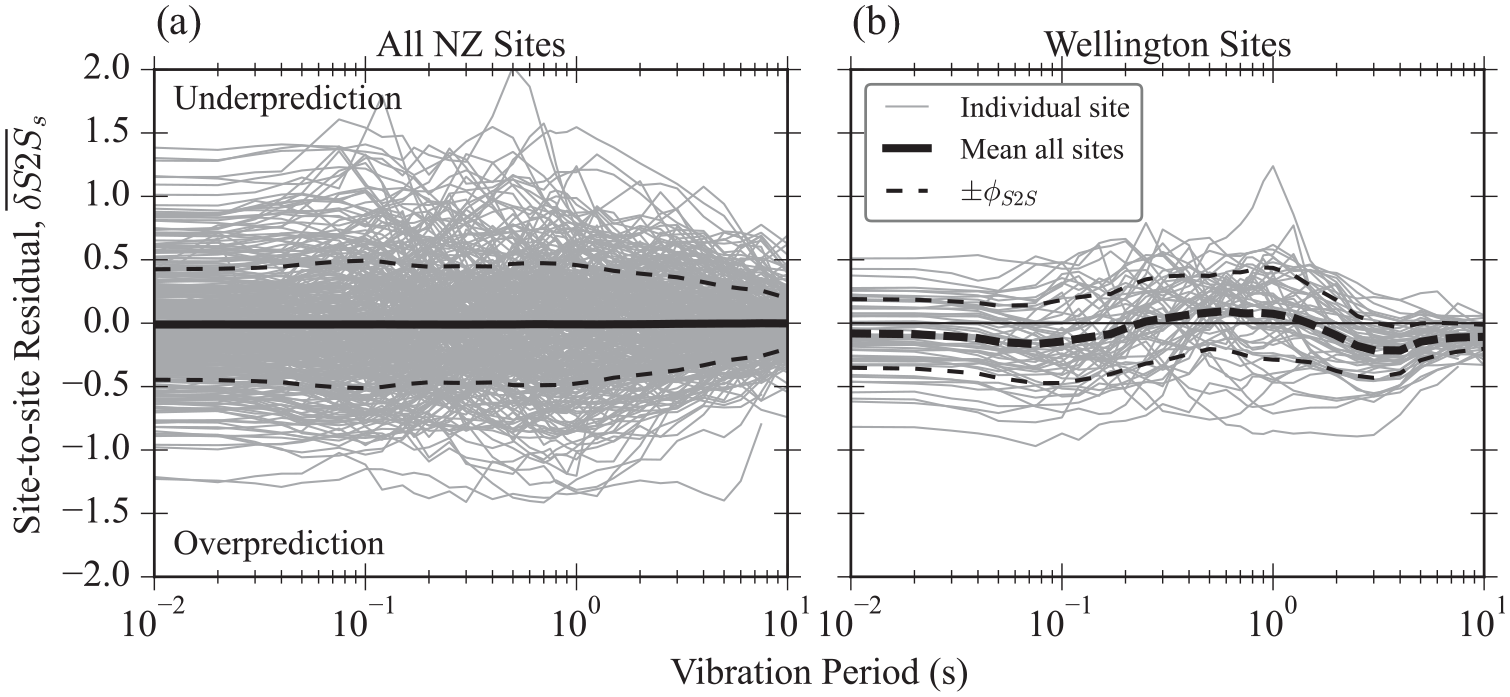
To continue the discussion in the previous subsection regarding the differences in bias between subsets of data (e.g., all NZ sites versus Wellington sites only), residual partitioning was performed for different subsets of the ground-motion database. Previously, and in all other figures outside of this subsection, results are based on residuals from a NZ-wide regression analysis. In this section, the residual analysis via Equation 2 was also performed for both Wellington sites only and Wellington basin sites only (i.e., basin, basin-edge, and valley categories) to understand the sensitivity of residuals and their uncertainties to the region and data set considered. When performing the Wellington region regressions, the between-event residuals
As suspected from inspecting the site terms of all the sites in the Wellington region in the previous subsection (i.e., in Figure 7), Figure 9 illustrates that the bias from the NZ-wide and Wellington subset regressions are not significantly different. Bias for the two Wellington subsets are nearly identical to each other, and they generally follow similar trends to the NZ-wide bias, although they deviate slightly for
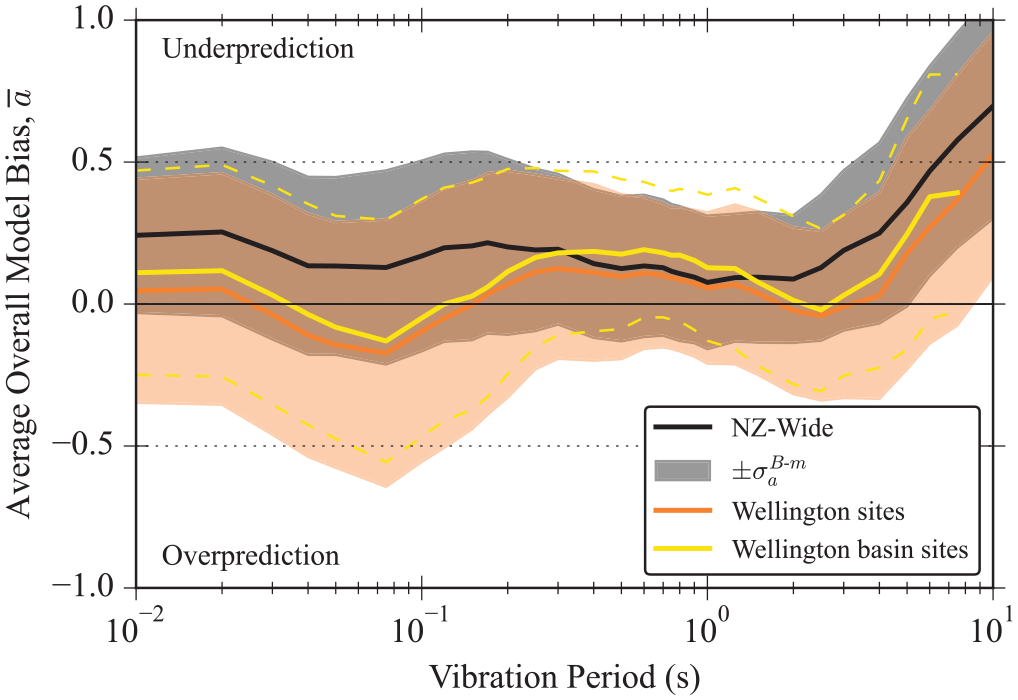
Mean overall model bias across all GMMs
Figure 10 plots the three components of standard deviation and the total standard deviation (Equation 3). Specifically, these components are the between-event
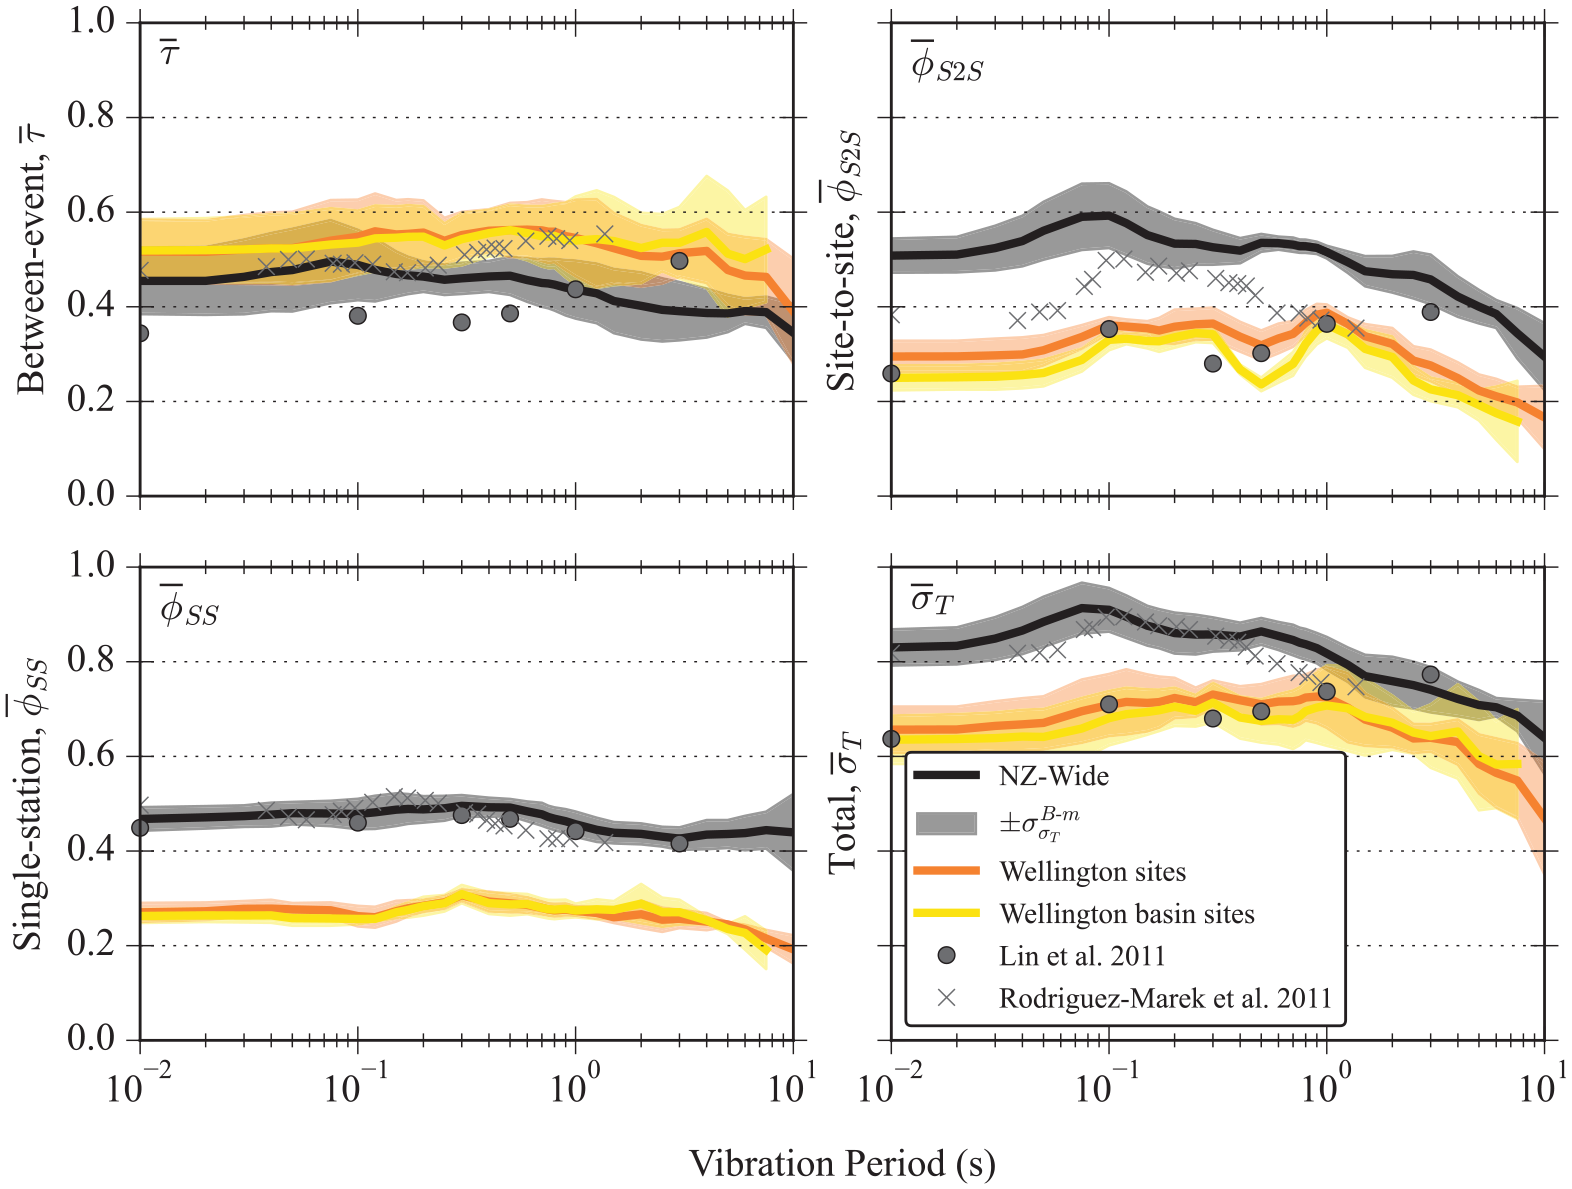
Standard deviations from the mixed-effects regression, averaged across all GMMs, including the between-event
As a comparison, Figure 10 also includes standard deviation estimates from two published papers focusing on single-station standard deviation in other regions of the world (Japan and Taiwan, respectively; Lin et al., 2011; Rodriguez-Marek et al., 2011). The values obtained from the residual analysis in this study are similar to these other studies, suggesting that the performance of GMMs in NZ is comparable to other regions. We note that the estimates of residuals at long periods (e.g.,
Dependence of residuals on site characteristics
To further understand causative parameters for site response and the observed patterns in residuals, it is useful to determine whether the site residuals are dependent on any easily attainable or already-available site parameters. The dependence on site residuals on four site parameters is investigated in Figure 11 for Wellington basin sub-regions (i.e., excluding hill sites). The residual is quantified using three simple metrics:
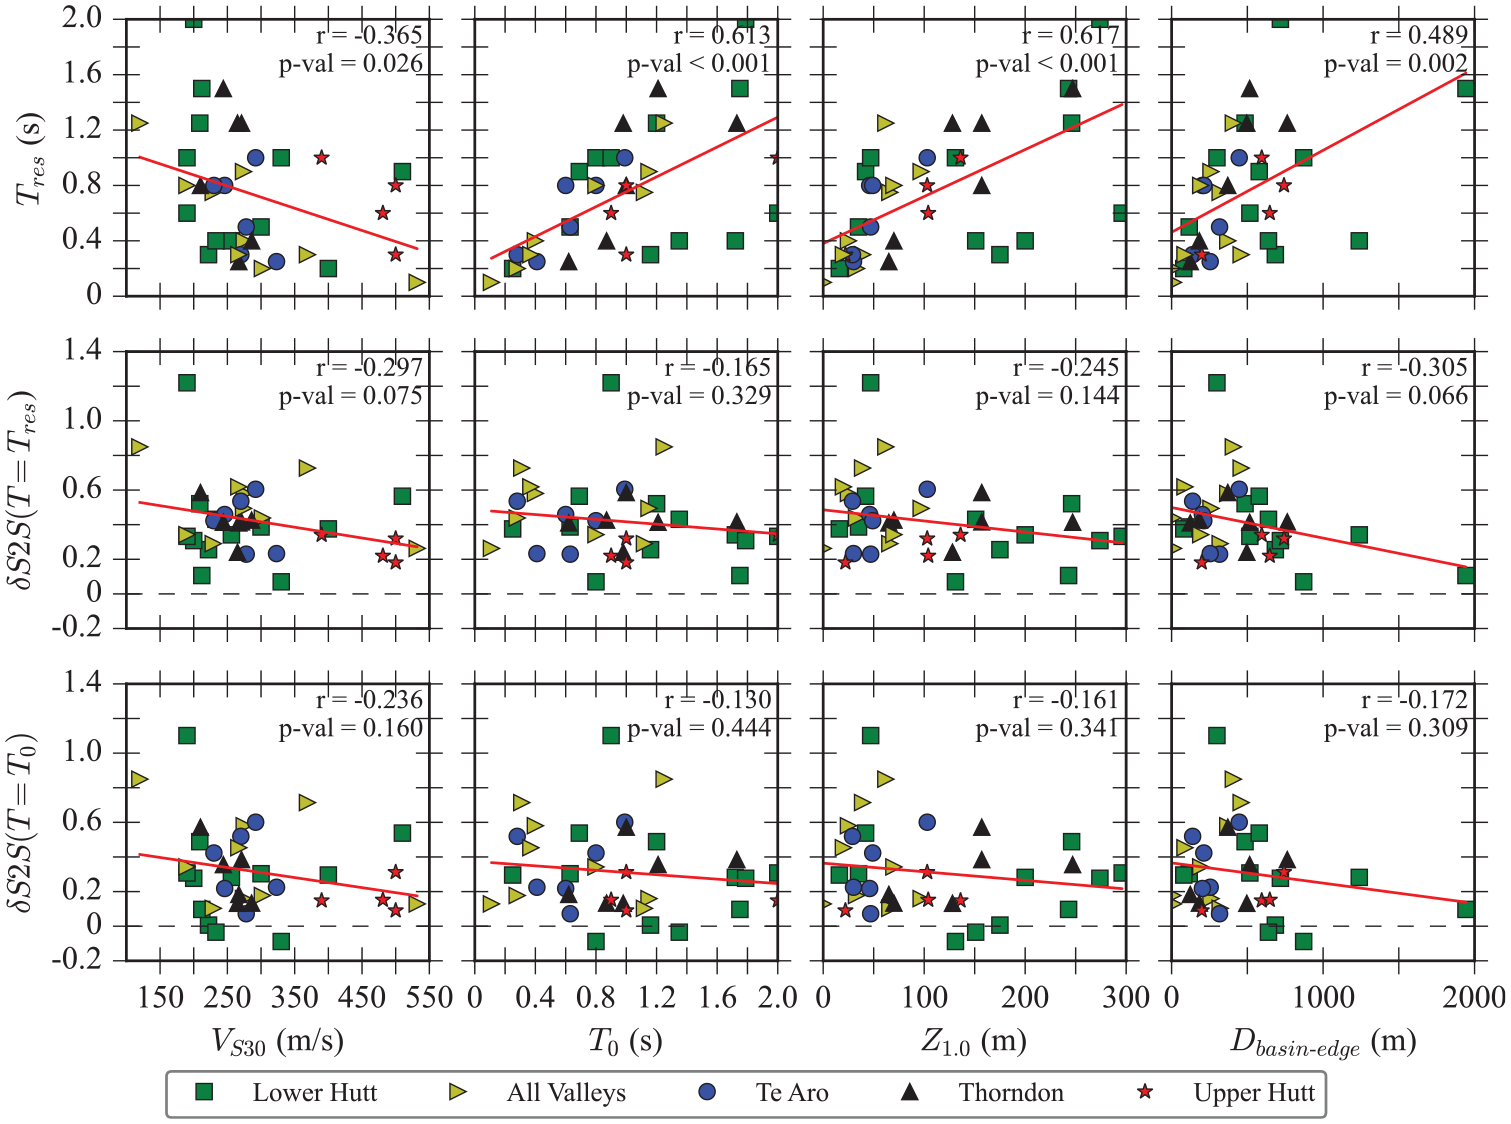
Dependence of three residual metrics
The top panels in Figure 11 show that
The amplitude of
Regionalization of site terms
The site-to-site residuals,
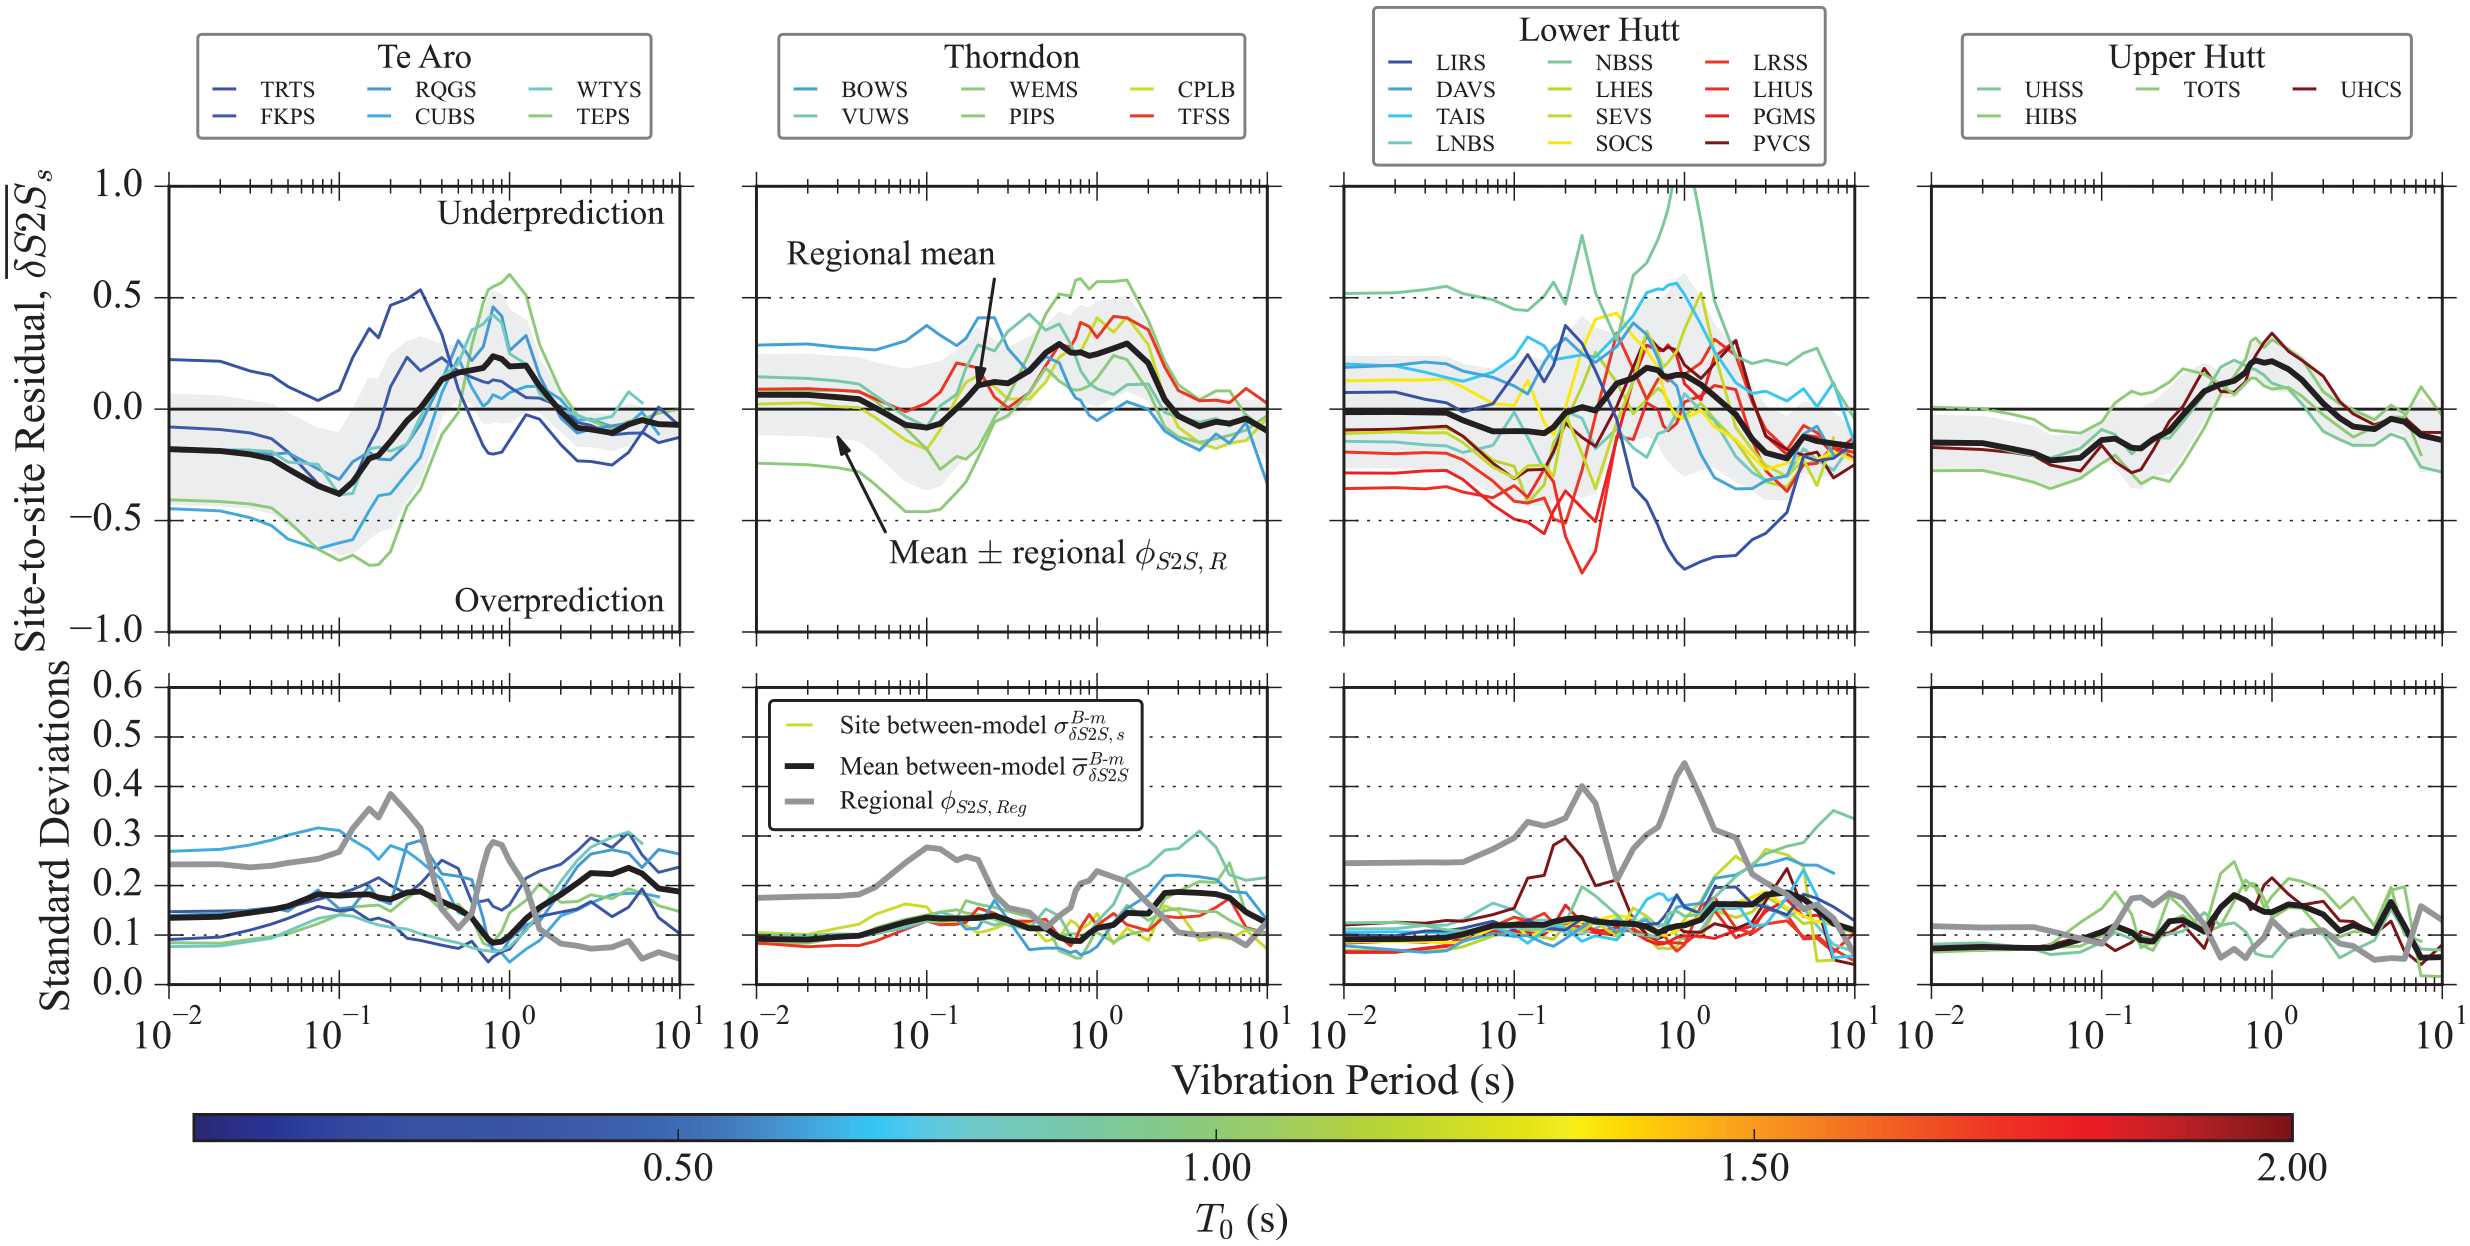
Site-to-site residuals and standard deviations for four basin sub-regions (Te Aro, Thorndon, Lower Hutt, and Upper Hutt) as a function of vibration period. Top panels: mean site-to-site residuals,
The average underprediction for
The results for valleys are regionalized in Figure A.3 of the Online Supplemental Material. This shows that the peaks in residuals of individual sites are pronounced and occur over a narrower frequency band than the basin sites. These pronounced narrow peaks, that generally occur at different periods for different sites, result in a high regional standard deviation,
Normalization of spectral period by site period
Previous work in Wellington has illustrated that patterns of basin/site amplification are consistent with patterns of site period estimates, and that site period may be a good predictor for site response (de la Torre et al., 2024; Kaiser et al., 2023). Other studies have leveraged off this dependence on site period and had success with incorporating site period into empirical site-response models (e.g., Hassani and Atkinson, 2018; Héloïse et al., 2012; Kwak et al., 2017). Figure 11 demonstrated a reasonably strong correlation between
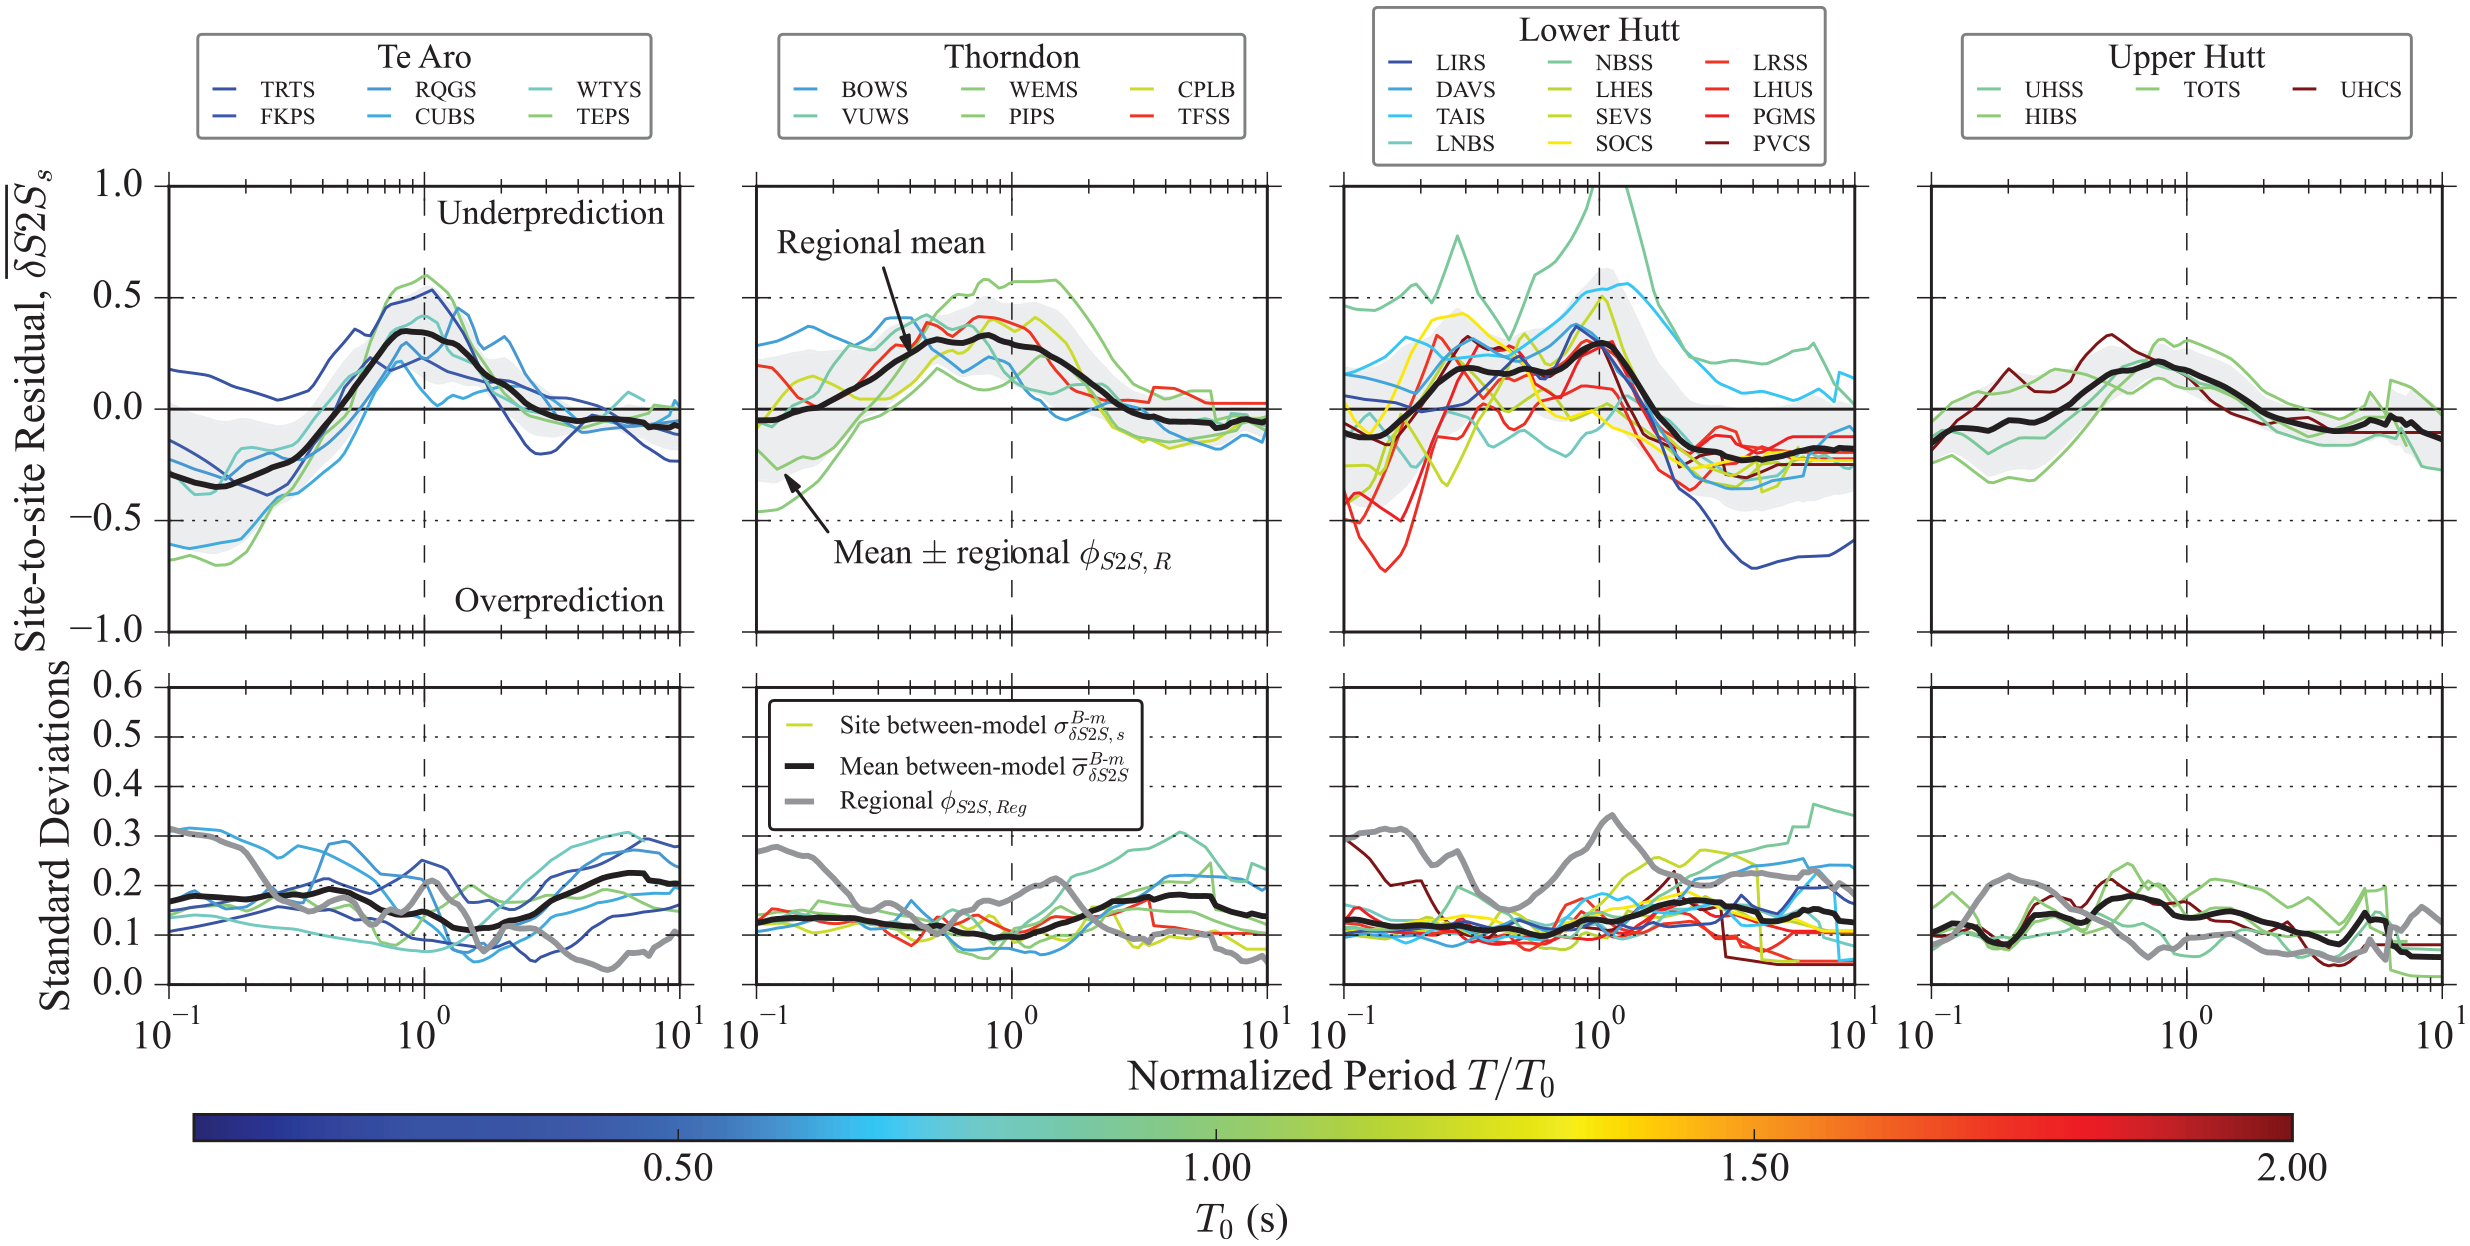
Site-to-site residuals and standard deviations for four basin regions (Te Aro, Thorndon, Lower Hutt, and Upper Hutt) as a function of normalized period (i.e.,
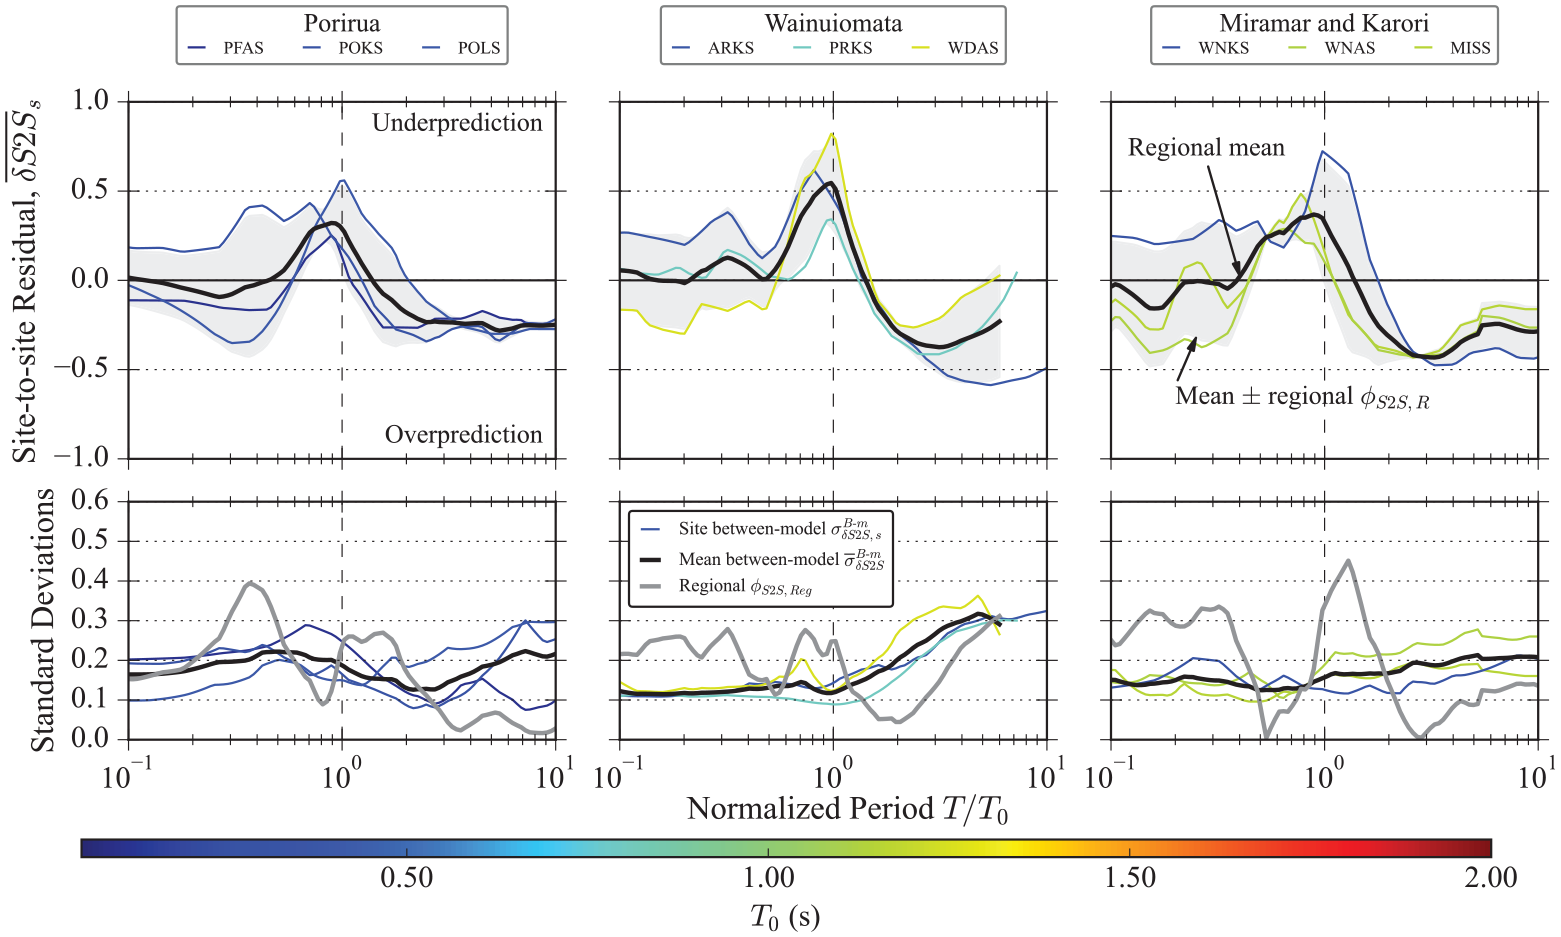
Site-to-site results and standard deviations for three valley regions (Porirua, Wainuiomata, and Miramar and Karori) as a function of normalized period (i.e.,
For many sub-basins, there appears to be consistency between the various sites
In general, normalization by site period results in a significant reduction in the regional between-site standard deviation. For most regions, the maximum regional standard deviation drops from about
Comparison of correlation-based versus site-specific
and
The results in this article are more likely to be used on a site-specific basis, where PSHA is applied to an individual site or project, as opposed to a nationwide PSHA, like the NZ NSHM. In these site-specific applications, typically, best estimates of site-specific basin-depth terms,
The site-specific estimates of
Figure 15 plots regional mean site-to-site residuals and standard deviations for all basin and valley sub-regions as a function of normalized period and compares predictions that used correlation-based values of
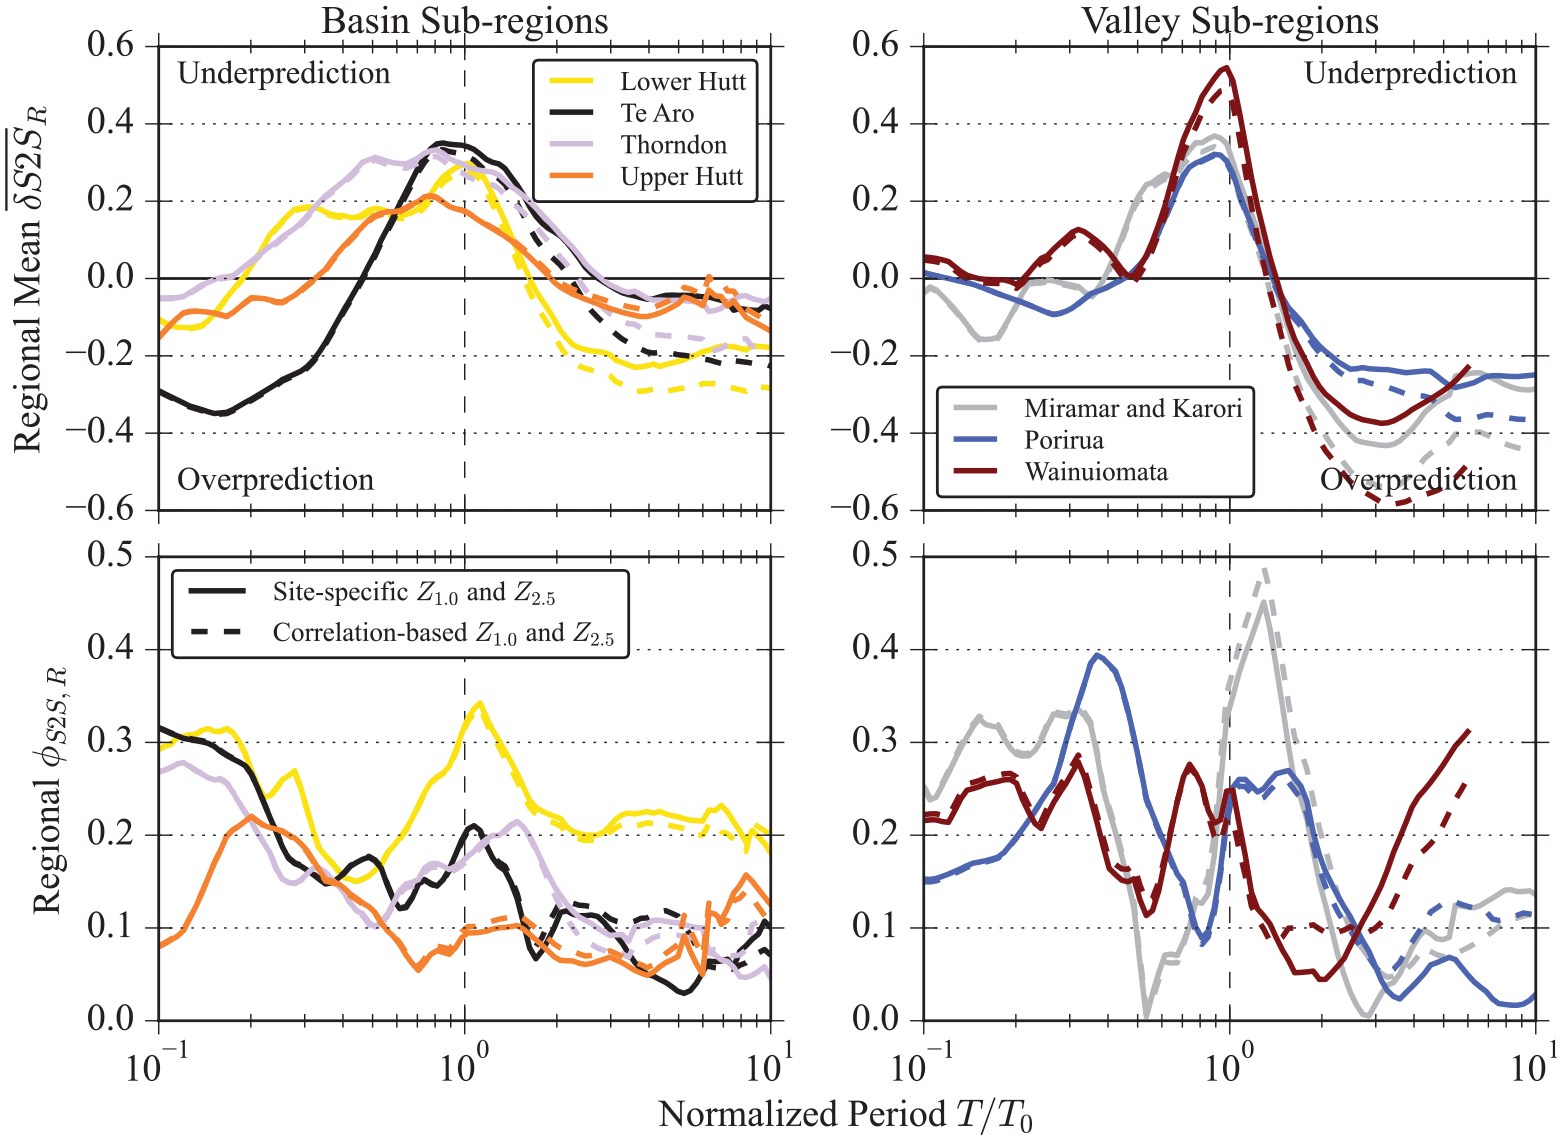
Regional mean site-to-site residuals and standard deviations versus normalized period for all basin and valley sub-regions considered. Predictions that use site-specific estimates of basin-depth terms (
Importantly, the shape of the regional site terms, in normalized period space (Figure 15), is similar between all basin sub-regions and all valley sub-regions. However, the general shape for basin sub-regions is different to that of valley sub-regions. This highlights that similar geomorphic features in the same region may have similar average site responses, and that the distinction between basin and valley sites proposed by Nweke et al. (2022) is useful.
Conclusion
This article analyzed ground-motion residuals for the Wellington region to assess the performance of empirical GMMs used in the 2022 NZ NSHM revision. Specifically, the site-to-site residuals
The between-model variability in site-to-site residuals
When all sites from all geomorphic categories in the Wellington region are combined, no significant systematic bias is observed relative to the rest of the country. However, when segregated into different categories, a clear underprediction is observed for basin sites at periods of
This study identified basin-specific systematic trends in bias and imprecision, based on mean site-to-site residuals, for the following basins and valleys in the Wellington region: Te Aro, Thorndon, Lower Hutt, Porirua, Wainuiomata, Miramar, and Karori. These residual trends form the basis for the development of adjustment factors to the mean site-response model within GMMs, to create partially non-ergodic GMMs for use in PSHA. Further work is required to fully develop and test the framework for application of these adjustment factors to PSHA in the Wellington region.
Supplemental Material
sj-pdf-1-eqs-10.1177_87552930241270562 – Supplemental material for Analysis of site-response residuals from empirical ground-motion models to account for observed sedimentary basin effects in Wellington, New Zealand
Supplemental material, sj-pdf-1-eqs-10.1177_87552930241270562 for Analysis of site-response residuals from empirical ground-motion models to account for observed sedimentary basin effects in Wellington, New Zealand by Christopher A de la Torre, Brendon A Bradley, Robin L Lee, Ayushi Tiwari, Liam M Wotherspoon, Joel N Ridden and Anna E Kaiser in Earthquake Spectra
Footnotes
Acknowledgements
All members of the NZ NSHM ground-motion characterization modeling and Wellington Basin sub-groups and the Technical Advisory Group are gratefully acknowledged for their input and participation throughout the duration of the project.
Declaration of conflicting interests
The author(s) declared no potential conflicts of interest with respect to the research, authorship, and/or publication of this article.
Funding
The author(s) disclosed receipt of the following financial support for the research, authorship, and/or publication of this article: The authors thank the New Zealand National Seismic Hazard Model (NSHM) update program, the New Zealand Earthquake Commission (EQC), and QuakeCoRE, a New Zealand Tertiary Education Commission-funded Centre, for funding this work. This is QuakeCoRE publication ID 955.
Supplemental material
Supplemental material for this article is available online.
Data and resources
The Hutchinson et al. (2022) NZ GMDB files are publicly available at: ![]() . The following versions of the GMDB were used for this study: the site table from Version 3.2 for site parameters and the ground-motion IMs table from Version 1 with IMs from Version 3.2 for the site CPLB.
. The following versions of the GMDB were used for this study: the site table from Version 3.2 for site parameters and the ground-motion IMs table from Version 1 with IMs from Version 3.2 for the site CPLB.
References
Supplementary Material
Please find the following supplemental material available below.
For Open Access articles published under a Creative Commons License, all supplemental material carries the same license as the article it is associated with.
For non-Open Access articles published, all supplemental material carries a non-exclusive license, and permission requests for re-use of supplemental material or any part of supplemental material shall be sent directly to the copyright owner as specified in the copyright notice associated with the article.