
Abstract
Site response estimates from one-dimensional (1D) site response analyses (SRAs) carry inaccuracies due to modeling and parametric errors. Modeling errors are due to the condensation of the three-dimensional (3D) wave propagation phenomenon to the vertical propagation of a horizontally polarized wave through a soil column, and parametric errors are due to the incomplete knowledge of the distributions of soil parameters, leading to the selection of nonoptimal input parameters for a site of interest. While parametric errors are traditionally handled using different soil parameters (e.g. alternative shear-wave velocity profiles), modeling errors are generally neglected. This paper proposes an approach for conducting linear elastic 1D SRAs to improve site response predictions and account for modeling errors. First, ground-motion data from borehole array sites are collected, processed, and screened for appropriateness (e.g. expected shear strains lower than 0.01%, signal-to-noise ratio higher than 3). Second, 1D SRA predictions in terms of transfer functions and amplification factors are compared against observations, and the discrepancies are quantified as residuals. Finally, the residuals are partitioned into a model bias term
Keywords
Introduction
Predictions from one-dimensional site response analyses (1D SRAs) carry modeling and parametric errors, as well as errors intrinsic to the 1D SRA as a numerical modeling tool. The simplest approach for estimating site response consists of the propagation of the input ground motions through a soil column characterized with best-estimate shear-wave velocity (VS) and damping profiles. Modeling errors in the predicted response come from the simplification of the 3D wave propagation phenomenon to the vertical propagation of a horizontally polarized wave through a simple 1D model, which fails to capture the effects of unmodeled non-1D site-specific features on-site response. Parametric errors are due to the lack of knowledge about the range of soil’s properties and, in the case of linear elastic simulations, the most appropriate VS and damping profiles. Finally, there are errors associated with 1D SRA as an imperfect tool when conducted with a best-estimate VS profile and an uncalibrated amount of damping, even for sites relatively compliant with the 1D SRA assumptions. Such errors are referred to as “intrinsic errors.” While parametric errors are commonly addressed by using multiple alternative input parameters, for example, baseline, upper, and lower VS profiles (Electric Power Research Institute (EPRI), 2013), intrinsic and modeling errors are generally overlooked. This and the companion paper (Pretell et al., 2023) develop and propose an approach for conducting 1D SRAs that removes the intrinsic errors and reduce the discrepancies between observations and 1D SRA-based predictions given by the modeling errors.
The proposed approach for conducting linear elastic 1D SRAs, hereafter referred to as 1D SRAs, consists of two main parts: (1) using calibrated input parameters (damping and randomized VS profiles) under the hypothesis that using the right amount of damping and VS randomization removes the 1D SRA intrinsic errors, and (2) bias-correcting the response to compute the best-estimate along with the 5th’ and 95th percentile median site response. Damping multipliers (Dmul) are used to increase laboratory-based damping values and the VS randomization model by Toro (1995) is used to generate suites of randomized VS profiles. Based on comparisons with borehole array data from 39 1D-like sites, it is observed that using Dmul = 3 and a standard deviation for VS randomization,
A database of 495 3D-like borehole array sites from Japan and the United States is used to estimate the method bias
Capturing modeling errors in 1D SRAs
Framework
Errors carried by 1D SRA predictions can be quantified using ground-motion data from borehole array sites. For an intensity measure (IM) of interest estimated using 1D SRAs and the corresponding observed earthquake component “e” at a site “s,” the following relation can be established:

where

where

where

In Equation 4, the term

Previously, in Equations 2 to 4,

where
Site response predictions can be improved by accounting for
Proposed approach
The proposed approach for conducting 1D SRAs (1) uses Dmul and VS randomization to improve site response predictions, and (2) accounts for
Step 1: site characterization
The best-estimate VS profile is selected, and the small-strain damping after Darendeli (2001) is estimated for a site of interest. The model by Darendeli is used assuming a plasticity index (PI) of 0, a loading frequency (fload) of 1 Hz, a coefficient of lateral pressure at rest (K0) of 0.5. The same layering in the VS profiles is considered for the development of damping profiles.
The proposed approach is developed using damping profiles estimated based on the Darendeli relation with the aforementioned values for PI, fload, and K0, and thus, they must be used in forward applications. The use of site-specific parameters could lead to an increase in damping by a factor of 2 and the underprediction of the median site response. It is expected that cases with PI, fload, and K0 that significantly deviate from the assumed values (e.g. a site on a fat clay deposit with very high PI) will require methods more advanced than the proposed approach.
Step 2: site response input parameters
A Dmul = 3 is used to increase the single small-strain damping and a suite of 50 randomized VS profiles is generated from the best-estimate profile. The randomized VS profiles are obtained using the Toro (1995)VS model with
Step 3: uncorrected median site response
The 50 randomized VS profiles are used with the same single damping profile (Dmul = 3) to compute the site response for each selected input ground motion. The median site response
Step 4: bias correction
The estimated
Best-estimate median site response:
Step 5: accounting for modeling errors
The potential for site-specific modeling errors leading to a median site response that is systematically higher or lower than the average median response is accounted for. The site-specific error in analytical modeling,
5th percentile of the median site response:
95th percentile of the median site response:
All the quantities in Steps 4 and 5 are in natural logarithm units; for instance, the bias-corrected best-estimate median site response in arithmetic units is
The proposed approach is intended to be used for a site, defined as a punctual location that does not account for spatial variability of soil properties across a structure’s footprint. However, the approach can be used multiple times for alternative baseline VS profiles to account for parametric epistemic uncertainty. In the following sections, the associated components, the assumptions, and the data used in the development of the proposed approach are discussed. Finally, an example application is presented to show how the proposed approach can be used in the forward prediction of site response.
Aleatory variability and epistemic uncertainty associated with the proposed approach
A framework for the identification of sources of aleatory variability (AV) and epistemic uncertainty (EU) in ground-motion modeling (Abrahamson et al., 1990) is described in the companion paper for site response applications. The separation of AV and EU helps understand the different factors affecting the response, as well as the benefits and the limitations of a selected numerical approach. This framework is developed and discussed within the context of the proposed approach and potential extensions to it (Table 1).
Matrix for the separation of sources of aleatory variability and epistemic uncertainty associated with the proposed approach for conducting 1D SRAs
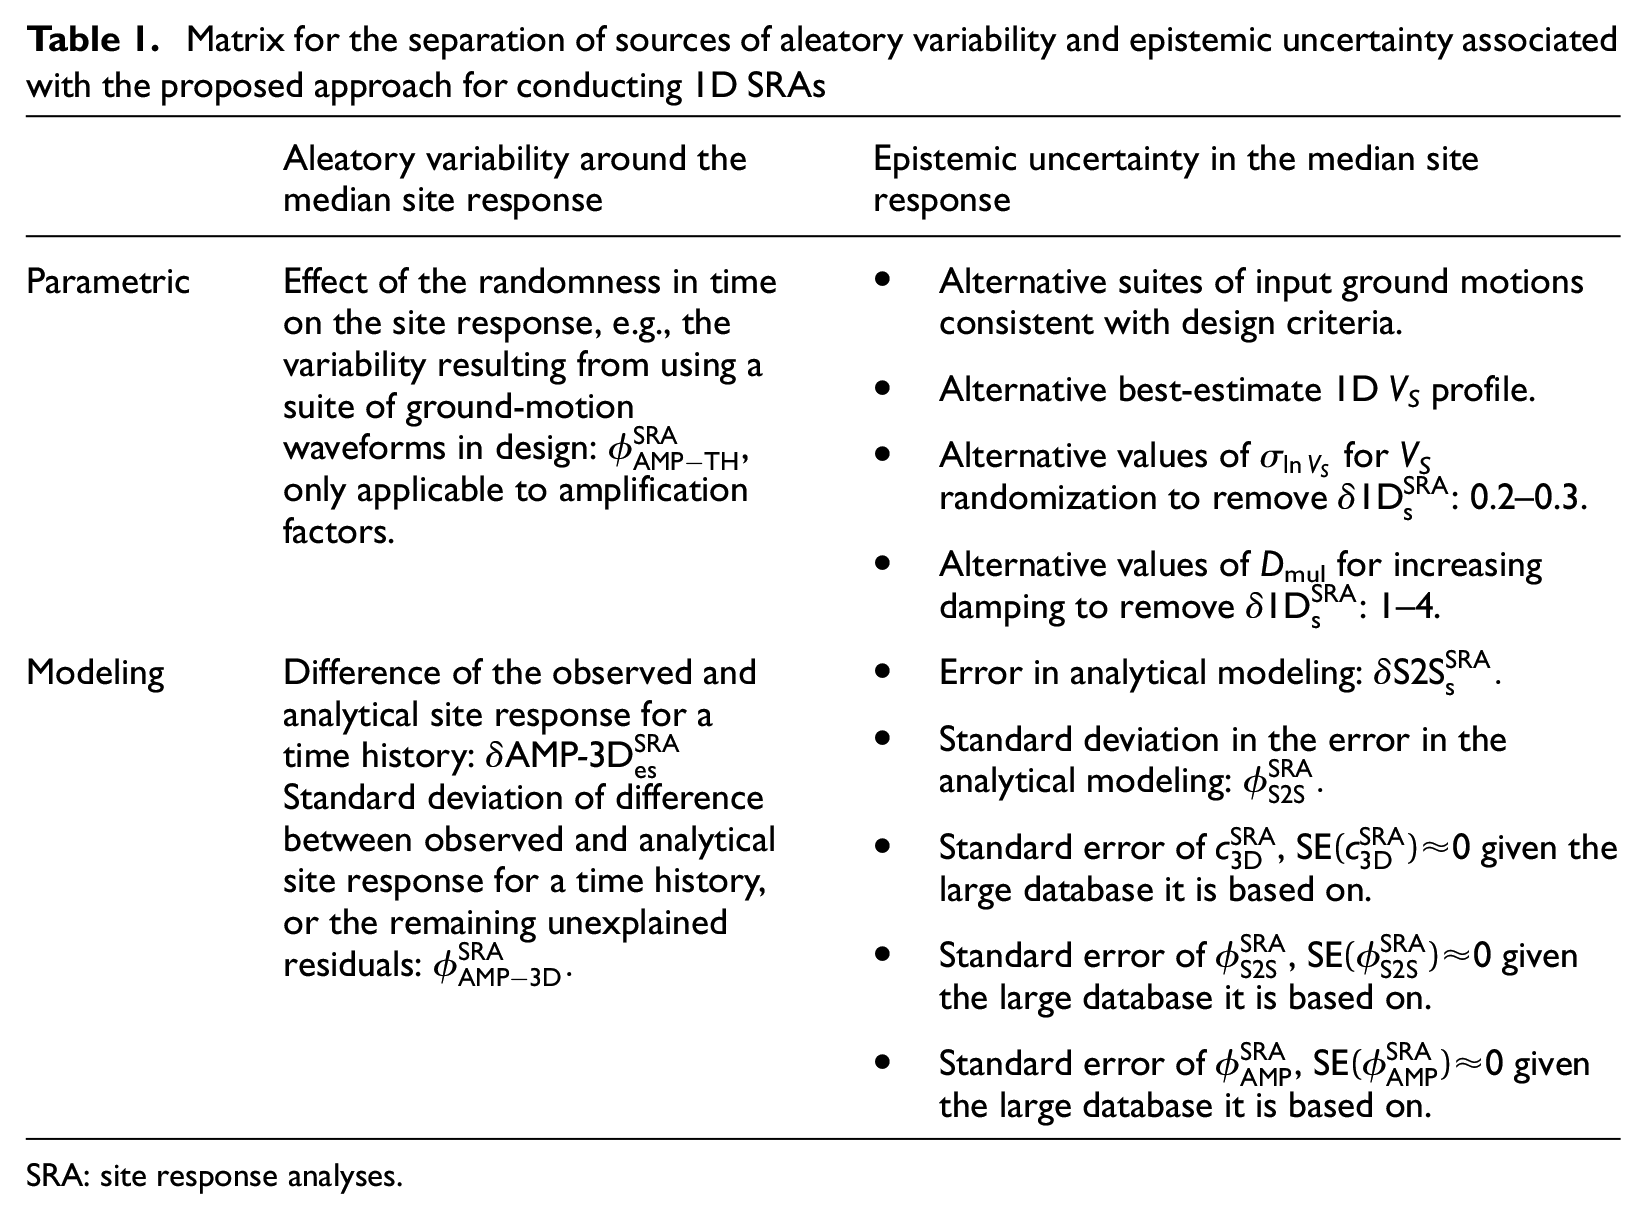
SRA: site response analyses.
The parametric AV (PAV) consists of random factors affecting the site response that can be explicitly modeled by the selected modeling approach. Such factors include randomness in time given by the ground-motion waveforms, which can be captured by using multiple time histories. These time histories lead to variability in the response for PSA at surface that can be quantified as a standard deviation associated with time histories “TH”:
The parametric EU (PEU) consists of the plausible alternative input parameters associated to the selected modeling approach. The PEU can include multiple suites of parameters depending on the available information and problem-specific needs (e.g. Rodriguez-Marek et al., 2020). Within the context of the proposed approach, the PEU consists of suites of input ground motions, selected based on some demand criteria, and best-estimate VS profiles (e.g. based on different geophysical tests). The PEU also includes Dmul to increase damping and
The modeling AV (MAV) consists of the variability in the estimated site response given the factors affecting the site response but uncaptured by 1D SRAs. These factors include the wave propagation direction and wave inclination, the presence of other wave types, the presence of a basin edge, a dipping bedrock, or complex subsurface structures. From the perspective of common 1D SRA applications, the effect of these factors on site response are regarded as random, leading to uncontrolled under- or overpredictions. Herein, the MAV is reduced by quantifying
Finally, the modeling EU (MEU) consists of the site-specific error in analytical modeling or site term
Relation to seismic hazard
The AV and EU components associated with the proposed approach should be consistent with seismic hazard calculations. In particular, the characterization of the seismic demand at the location of interest at depth (i.e. half-space), and the subsequent convolution of the hazard at ground surface, if required, should capture different fractions of the ground-motion variability. The seismic hazard at the half-space should be calculated using single-station sigma to remove
Main assumptions
There are four primary assumptions associated with the proposed approach:
Applicability to outcropping applications: The calibration of Dmul and
Perfectly measured VS profiles: The calibration of Dmul and
Ergodicity:
Applicability to any site type:
Previous estimates of site response residuals
Previous studies provide estimates of
Kaklamanos et al. (2013) conducted 1D SRAs for 100 sites from the Kiban Kyoshin Network (KiK-net) database (National Research Institute for Earth Science and Disaster Resilience (NIED), 2019) using constant damping values optimized to fit observations at each site (Thompson et al., 2012) and computed residuals for PSA. The authors found an overall underprediction as high as 0.5, except between 0.5 and 2 Hz;
Stewart and Afshari (2021) conducted 1D SRAs for 21 sites in California using three damping models and computed residuals for PSA. The authors found an overall trend of underprediction with
Zhu et al. (2022) conducted 1D SRAs for a large database of borehole and surface sites in Japan to investigate the efficacy of various methods for predicting FAS. Such methods include “full-resonance” 1D SRAs (i.e. the commonly used 1D SRAs), the square-root-impedance (SRI) 1D SRAs (Boore, 2003; Joyner et al., 1981), and the horizontal-to-vertical spectral ratio (HVSR) correction (Nakamura, 2019). Zhu et al. used two damping formulations for SRAs and found that HVSR provides more accurate predictions, whereas the SRA and SRI have an overall poor performance, attributed to high parametric and modeling errors in their dataset. The authors estimated
These studies provide valuable insights into the site response bias and variability of
Quantification of site response modeling error
Site response residuals are quantified using publicly available borehole array data from Japan and the United States (California and Alaska), downloaded from the KiK-net database, the Network for Earthquake Engineering Simulation (NEES) and the Center for Engineering Strong Motion Data (CESMD) databases.
Four cases are investigated for comparative purposes:
Case 1: Damping with Dmul = 1 and best-estimate VS profile. Baseline case.
Case 2: Damping with Dmul = 3 and best-estimate VS profile.
Case 3: Damping with Dmul = 1 and 50 randomized VS profiles.
Case 4: Damping with Dmul = 3 and 50 randomized VS profiles. Proposed approach.
Site characterization
The site characterization for 1D SRAs consists of profiles of small-strain damping, VS, and bulk density. Given the significant impact of VS on the predicted site response at the surface (e.g. Kaklamanos et al., 2020; Passeri et al., 2019), only sites with a measured VS profile are used. The measured VS profiles from Japan are provided on the KiK-net database website, whereas various sources are used for the VS profiles of sites in the United States (Afshari et al., 2019; Gibbs et al., 2000; Holzer and Youd, 2007; Thompson et al., 2010; Thornley et al., 2019). A compromise is made to include a few sites with gaps in the VS profile, typically at the top 1–2 m (e.g. KOCH05, SBSH01, YMTH02). Such VS profiles are considered acceptable given that the shallow layer is expected to minimally impact the amplitudes at the site response around the fundamental mode. In these cases, VS corresponding to the immediately underlying layer is considered for the missing portion. In cases where multiple VS profiles are available, preference is as to profiles measured using the P-S suspension logging or any other invasive test, as they can provide high resolution regardless of the depth (e.g. Passeri, 2019). Multiple VS are available for a minority of sites in the United States, and selecting a different profile is not expected to have an impact on this work. Figure 1 shows the location of the sites selected for the development of the proposed approach, including the 1D-like sites used for the calibration of Dmul and
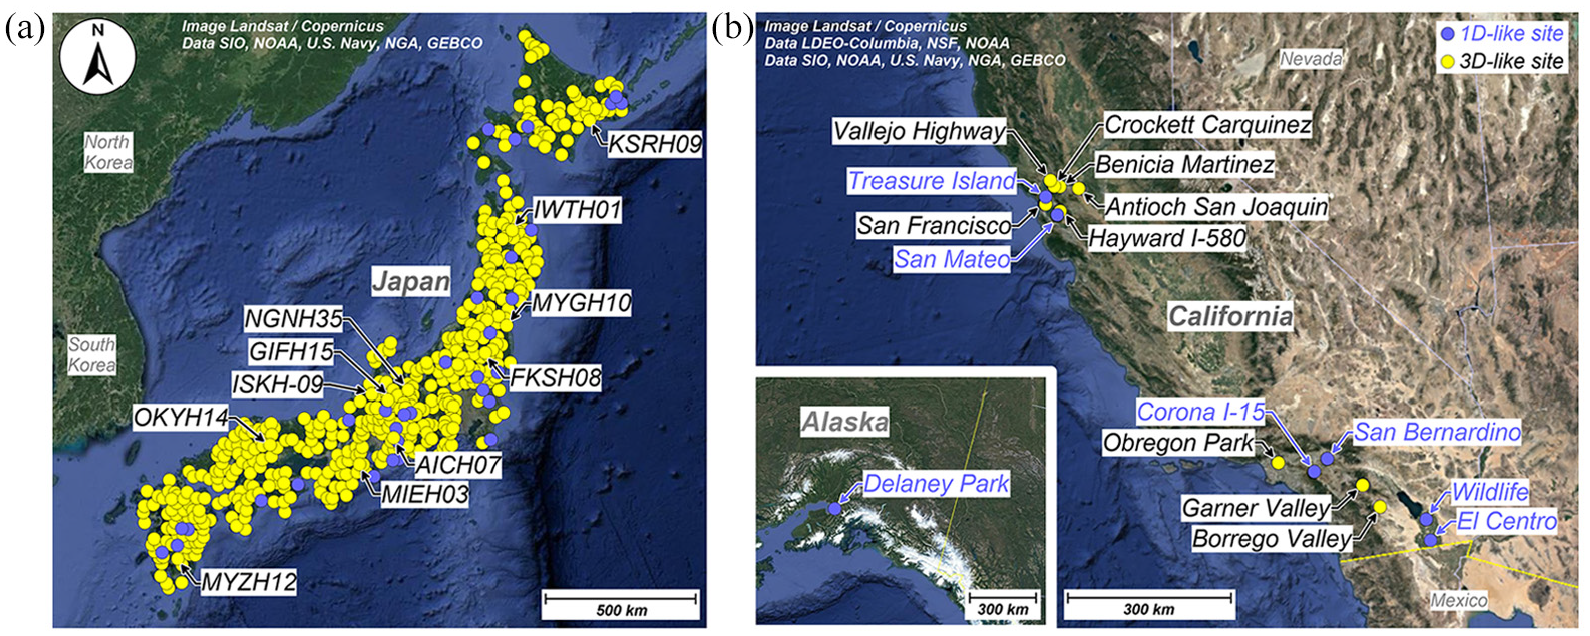
Borehole array site locations differentiating types as 1D- or 3D-like: (a) sites in Japan, (b) sites in California with an insert closeup view of the Delaney Park site in Alaska. 3D-like KiK-net sites used as examples throughout this paper are labeled for reference.
The measured VS profiles are considered flawless and discrepancies in site response predictions are attributed to modeling errors. VS profiles could be adjusted based on the observed TF’s fundamental mode as done by Tao and Rathje (2020a). However, this correcting approach implicitly assumes that deviations from a 1D-like TF are due to errors in the VS profile, which might be accurate for some sites but could also be explained by non-vertical wave propagation and non-1D effects (Thompson et al., 2009). In lieu of a better approach, measured VS profiles are used as published.
The damping profiles are estimated based on a laboratory-based relationship and density values are assumed based on VS. The damping is estimated after Darendeli (2001) assuming PI = 0, fload = 1 Hz, and K0 = 0.5. The resulting damping profiles are factorized by Dmul = 3. The bulk density is assumed as 1800 kg/m3 for materials with VS values lower than 760 m/s, and 2200 kg/m3 otherwise. Figure 2 shows examples of the input parameters for four sites.
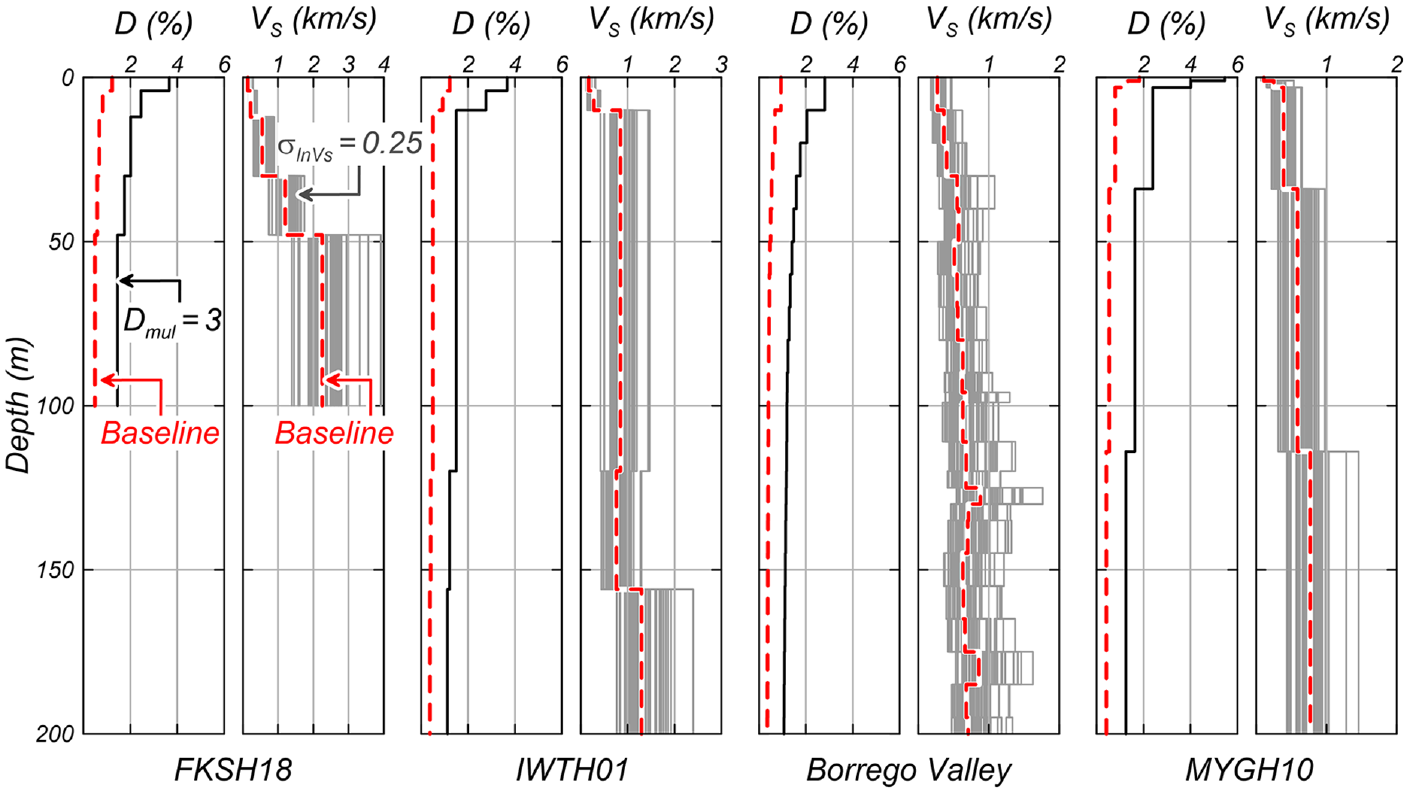
Examples of input VS and damping profiles for 1D SRAs.
Ground-motion data
Ground-motion processing
Ground-motion data are accessed from the KiK-net, NEES, and CESMD databases. In addition, the dataset for California is complemented with ground-motion recordings made available by Afshari et al. (2019). Ground motions from KiK-net and NEES are downloaded in raw format (count units) and processed using the software PRISM v2.1 (Processing and Review Interface for Strong Motion by Jones et al., 2017). Downloading the data in raw format allows for uniform processing across databases and the estimation of the event onset (t0) using PRISM. t0 is the time of the P-wave arrival estimated from the acceleration time history and is determined based on the rate of change of dissipated energy using the PPHASEPICKER algorithm (Kalkan, 2016). The t0 differentiates the noise from the noise and earthquake signals together in the acceleration time histories (Figure 3a) and thus allows for the computation of the signal-to-noise ratio (SNR) used to assess the quality of ground-motion recordings. Data from CESMD are not available in raw format; thus, data in Volume 2 (V2) format are used, and data from Afshari et al. (2019) are used in their processed form.
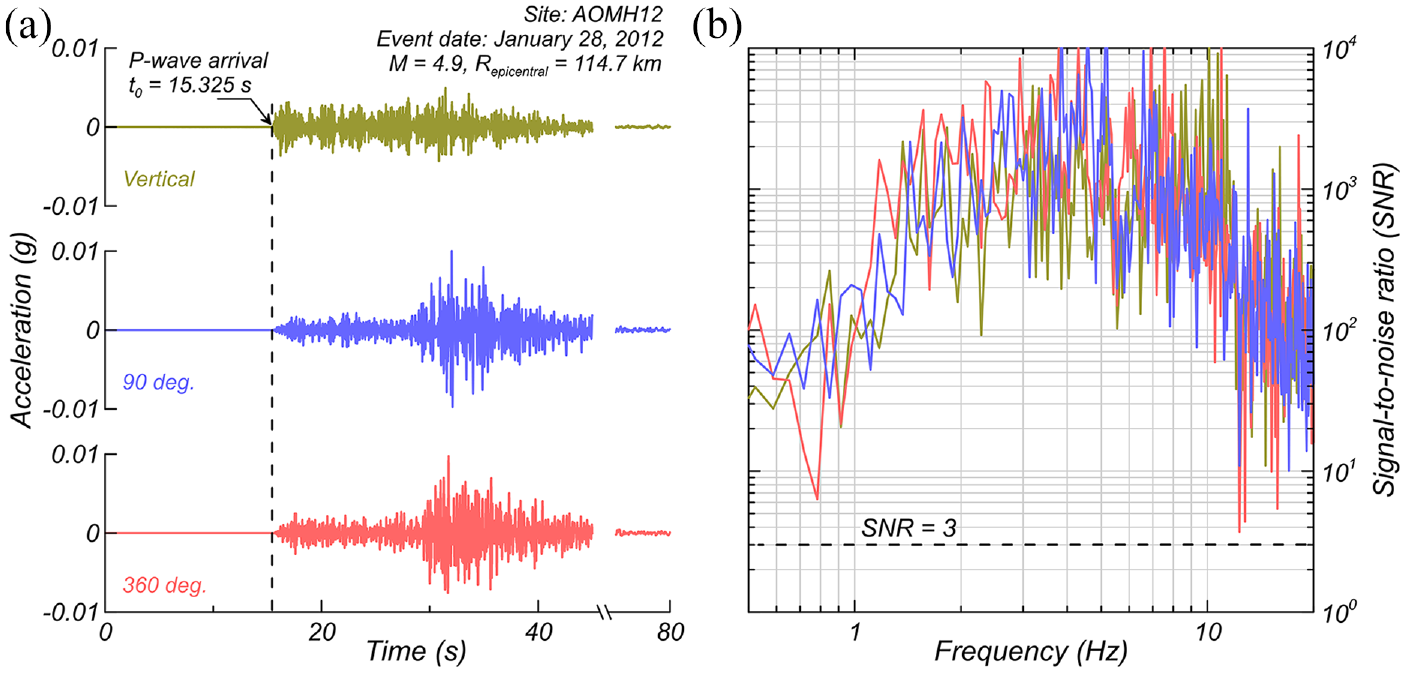
(a) P-wave arrival time in ground-motion recordings and (b) signal-to-noise ratio (SNR).
Raw data are converted from counts to accelerations, baseline corrected, and filtered. An acausal filter is used with a lower corner frequency of 0.1 and a maximum of 25 Hz or higher, depending on the earthquake magnitude (Massa et al., 2010). The ground-motion data are only used up to 20 Hz as higher frequencies are affected by the instruments’ antialiasing filters (Aoi et al., 2004). Most recordings have a sampling frequency of 200 Hz (time step of 0.005 s), and recordings with lower sampling frequencies are resampled using the frequency-domain zero-padding technique proposed by Lyons (2014) and implemented in PRISM and MATLAB (Kalkan, 2021). To estimate t0 using PRISM for the processed data from CESMD and Afshari et al. (2019), these recordings are converted to count units using arbitrary yet reasonable shifts and scaling factors. The artificially raw recordings are then processed using PRISM, the estimated t0 is stored for the computation of SNR using the downloaded processed recordings, and the resulting processed recordings are disregarded.
Ground-motion selection
Three criteria are considered to select ground-motion recordings appropriate for the quantification of site response residuals: (1) record component completeness, (2) SNR appropriateness, and (3) linear site response. An event is considered complete if all six components are available (three components from the sensor at depth and three from the sensor at the ground surface) or at least four horizontal components, which is the case for data from CESMD and Afshari et al. (2019). The SNR of ground-motion recordings is computed as:

where
Only ground-motion recordings not expected to yield soil nonlinearities are used. Recordings potentially leading to nonlinear behavior of soils are identified using the shear-strain index (Iγ), proposed by Idriss (2011), defined as:

where PGVin is the peak ground velocity of the input motions, in the same units as VS30. The ground motions yielding
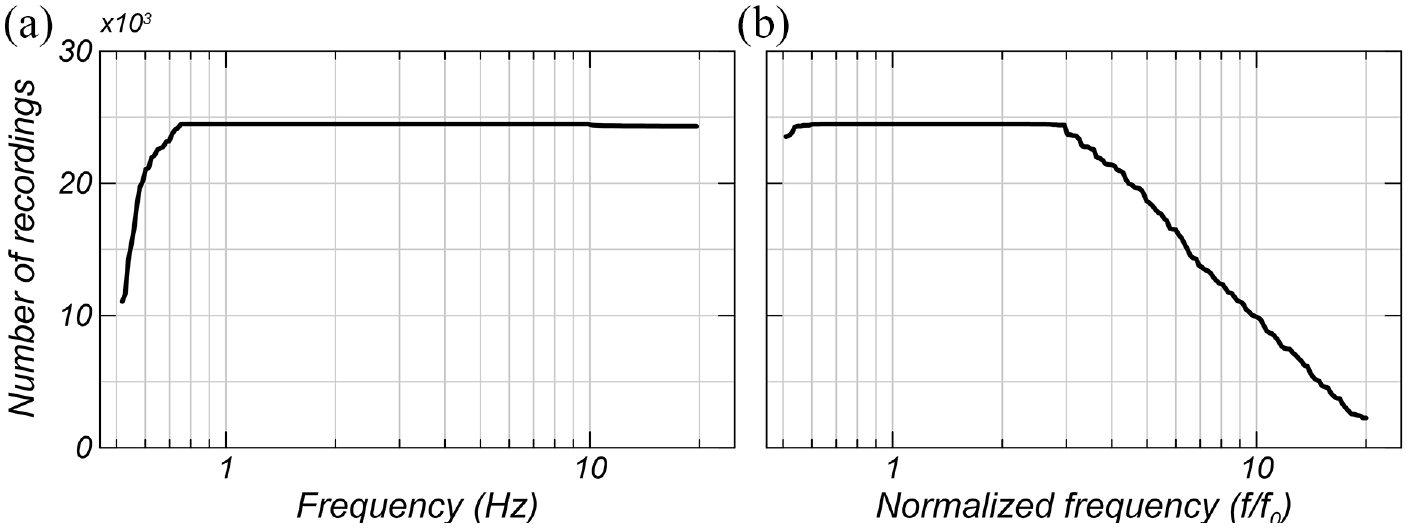
Number of usable ground motion recordings per frequency, f (a) and per frequency normalized by the site’s fundamental frequency, f0 (b).
Finally, all ground motions are visually screened and recordings presenting obvious anomalies are disregarded. The maximum number of events per site is set at 120 (240 recordings) to reduce computational cost. Sites with more than 120 events are re-screened to keep the recordings with the wider frequency range of acceptable SNR values. The final screened dataset consists of 534 sites, 518 from Japan and 16 from the United States (Table 2). From them, 39 sites are identified as 1D-like and used to calibrate Dmul and
Databases and ground-motion selection criteria, including 1D- and 3D-like sites
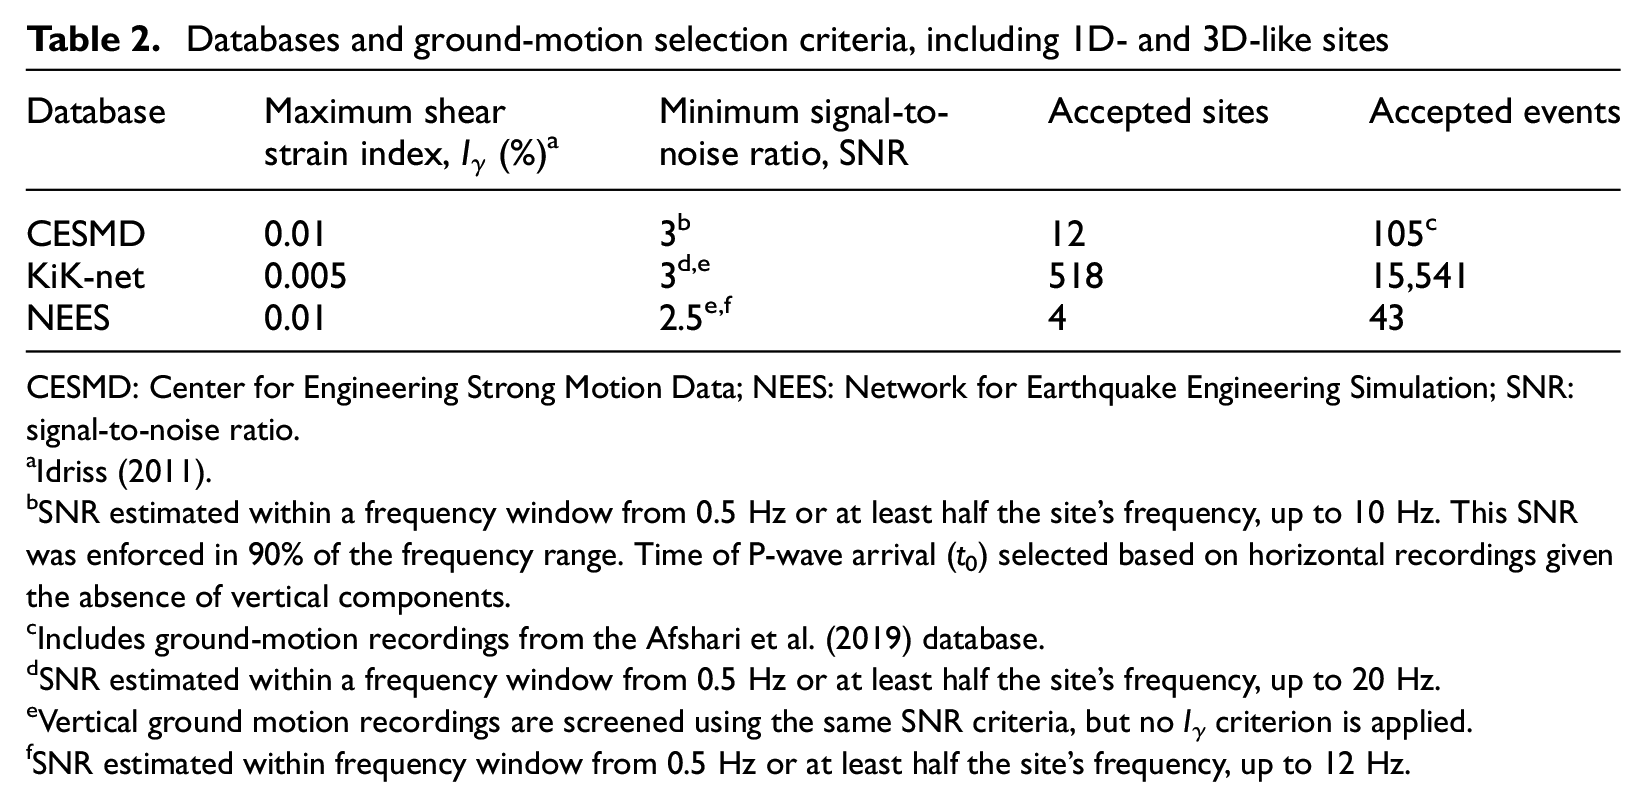
CESMD: Center for Engineering Strong Motion Data; NEES: Network for Earthquake Engineering Simulation; SNR: signal-to-noise ratio.
SNR estimated within a frequency window from 0.5 Hz or at least half the site’s frequency, up to 10 Hz. This SNR was enforced in 90% of the frequency range. Time of P-wave arrival (t0) selected based on horizontal recordings given the absence of vertical components.
Includes ground-motion recordings from the Afshari et al. (2019) database.
SNR estimated within a frequency window from 0.5 Hz or at least half the site’s frequency, up to 20 Hz.
Vertical ground motion recordings are screened using the same SNR criteria, but no Iγ criterion is applied.
SNR estimated within frequency window from 0.5 Hz or at least half the site’s frequency, up to 12 Hz.
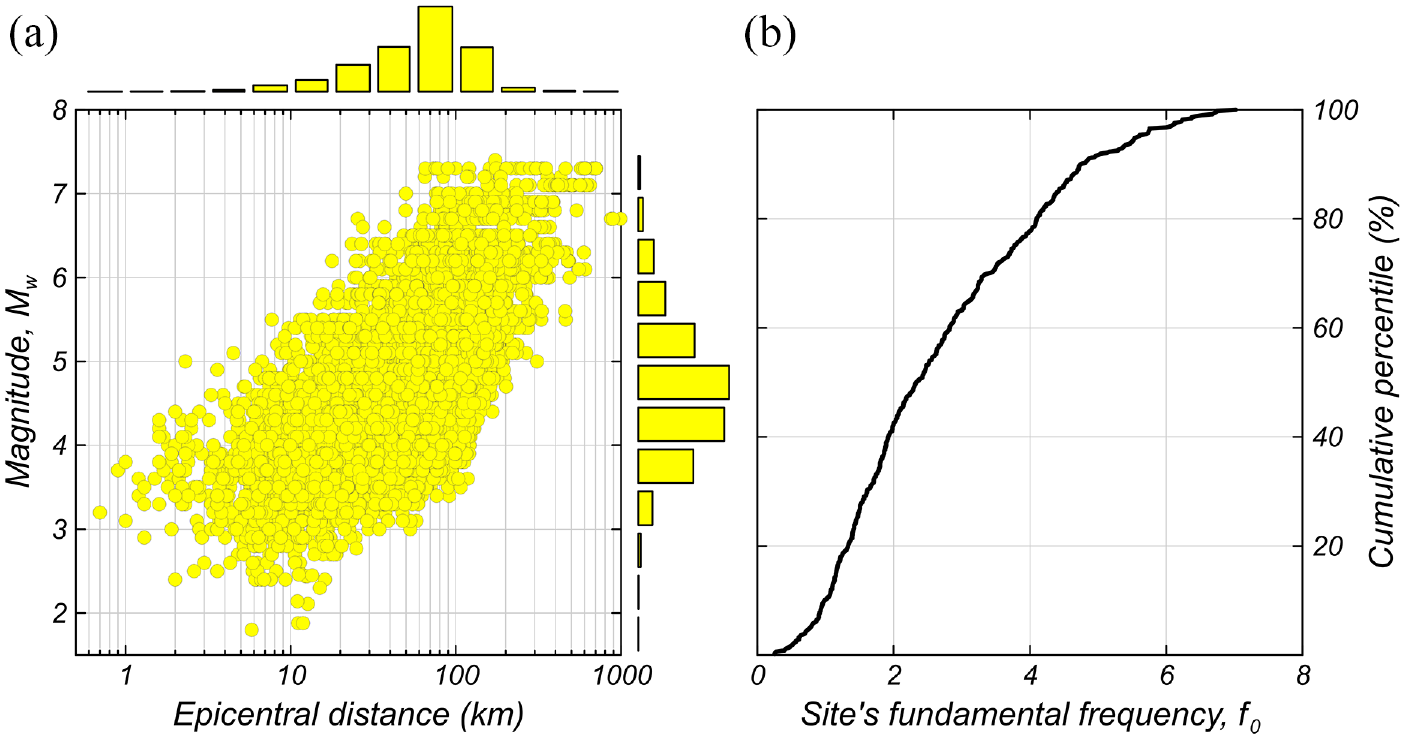
Data used in the development of the proposed approach: (a) distribution of epicentral distance and earthquake magnitude for selected events and (b) cumulative distribution of the site’s fundamental frequencies for 3D-like sites.
Site response analysis
SRAs are conducted using NRATTLE, code written by C. Mueller, modified by R. Herrmann, and included in the suite of strong-motion programs Stochastic-Method SIMulations (SMSIM) by Boore (2005). NRATTLE uses the Thomson–Haskell solution to compute the 1D SH-wave TF (Haskell, 1953; Thomson, 1950) based on a VS profile, density, and quality factors
Observed and theoretical TFs for four representative sites are presented in Figure 6. In general, the theoretical TFs present higher amplitudes than the observed TFs at the site’s fundamental mode and often at some higher modes. The baseline theoretical TFs are more sharply peaked than the observed TFs and generally overpredict the fundamental and some higher modes. Results from the proposed approach (Dmul = 3 and
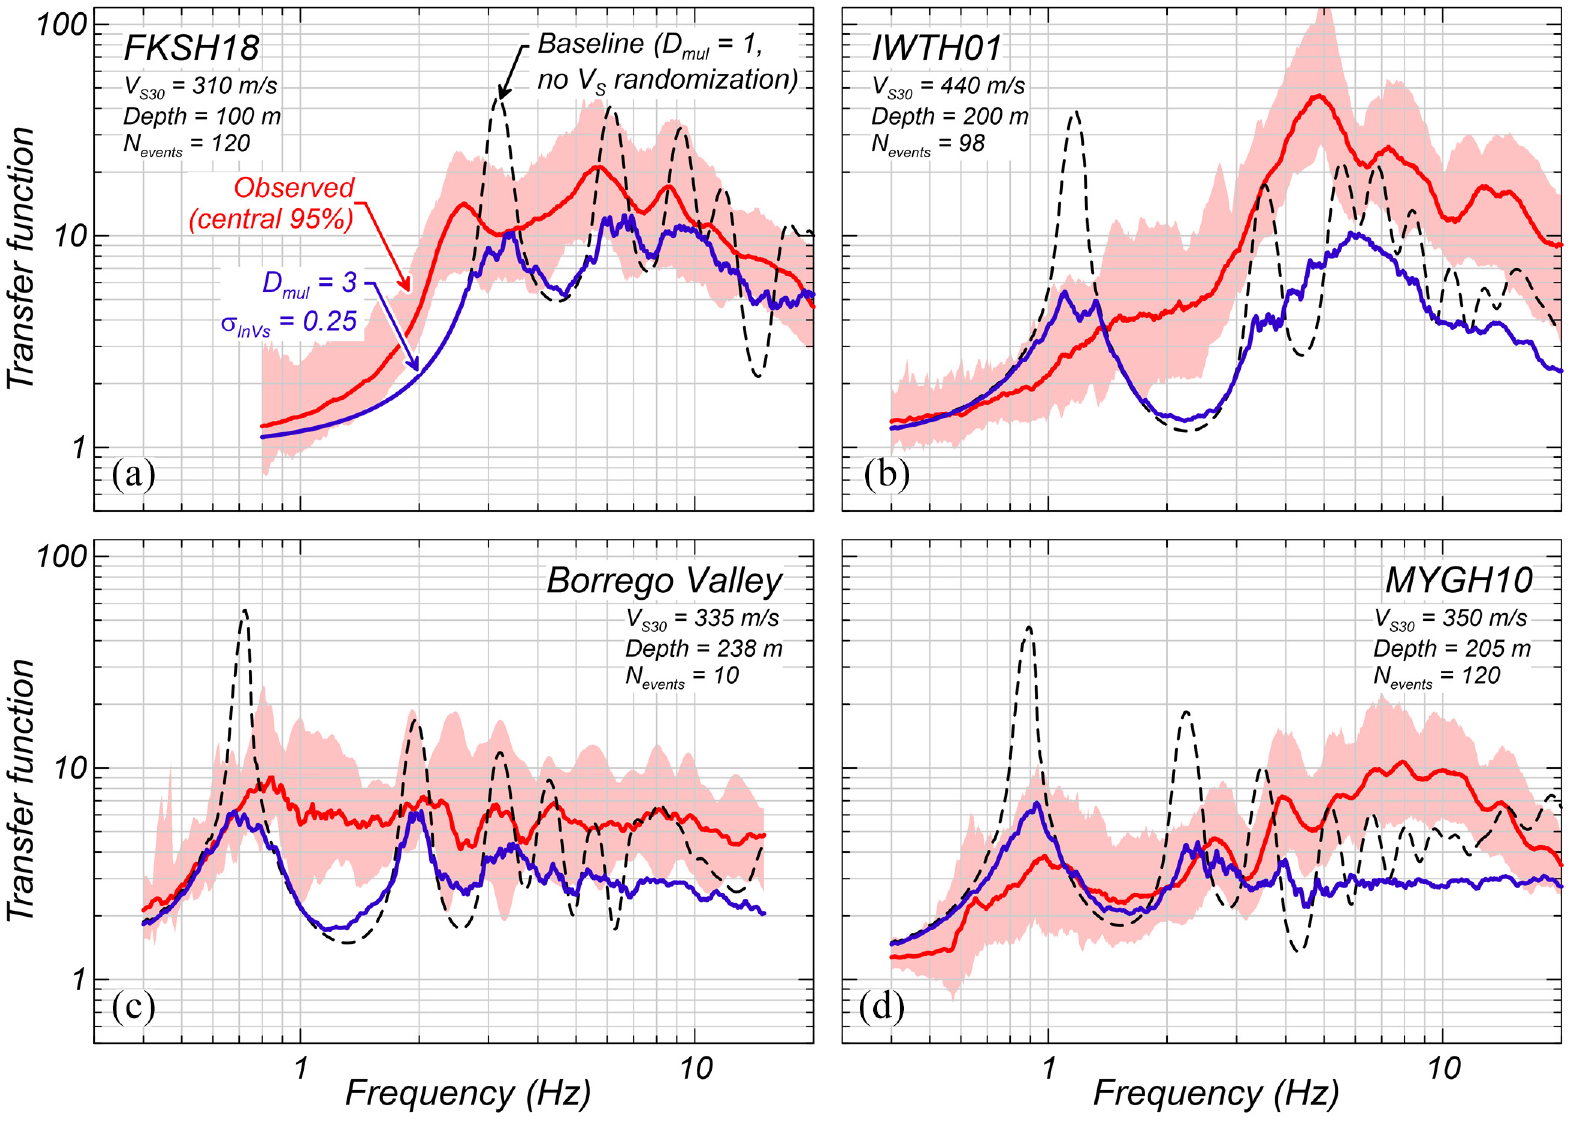
Comparison of observed transfer functions (TFs) and 1D SRA-based TFs for Case 1: Baseline (damping with Dmul = 1 and best-estimate VS profile), and Case 4: Proposed approach (damping with Dmul = 3 and randomized VS profiles). Results for four example borehole array sites: (a) FKSH18, (b) IWTH01, (c) Borrego Valley, and (d) MYGH10.
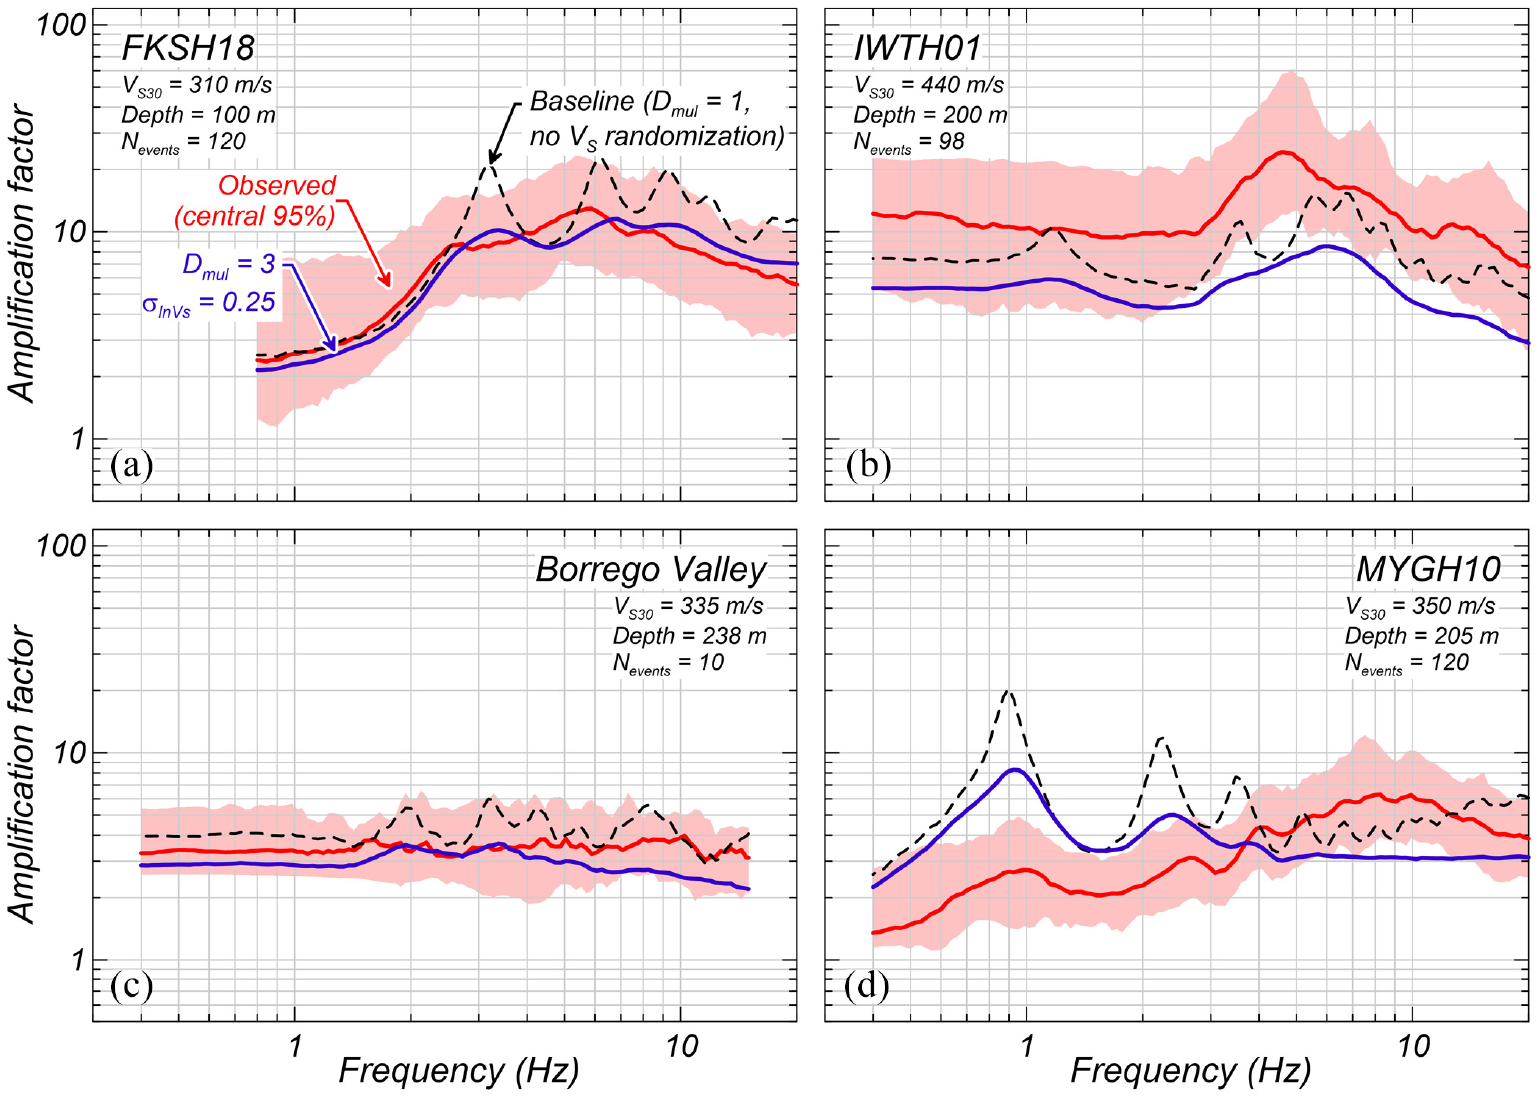
Comparison of observed amplification factors (AFs) and 1D SRA-based AFs for Case 1: Baseline (damping with Dmul = 1 and best-estimate VS profile), and Case 4: Proposed approach (damping with Dmul = 3 and randomized VS profiles). Results for four example borehole array sites: (a) FKSH18, (b) IWTH01, (c) Borrego Valley, and (d) MYGH10. The median AFs in Case 4 result from all the median AFs estimated from each ground motion recording propagated through 50 randomized VS profiles (i.e. median of median AFs).
Method bias and modeling epistemic uncertainty
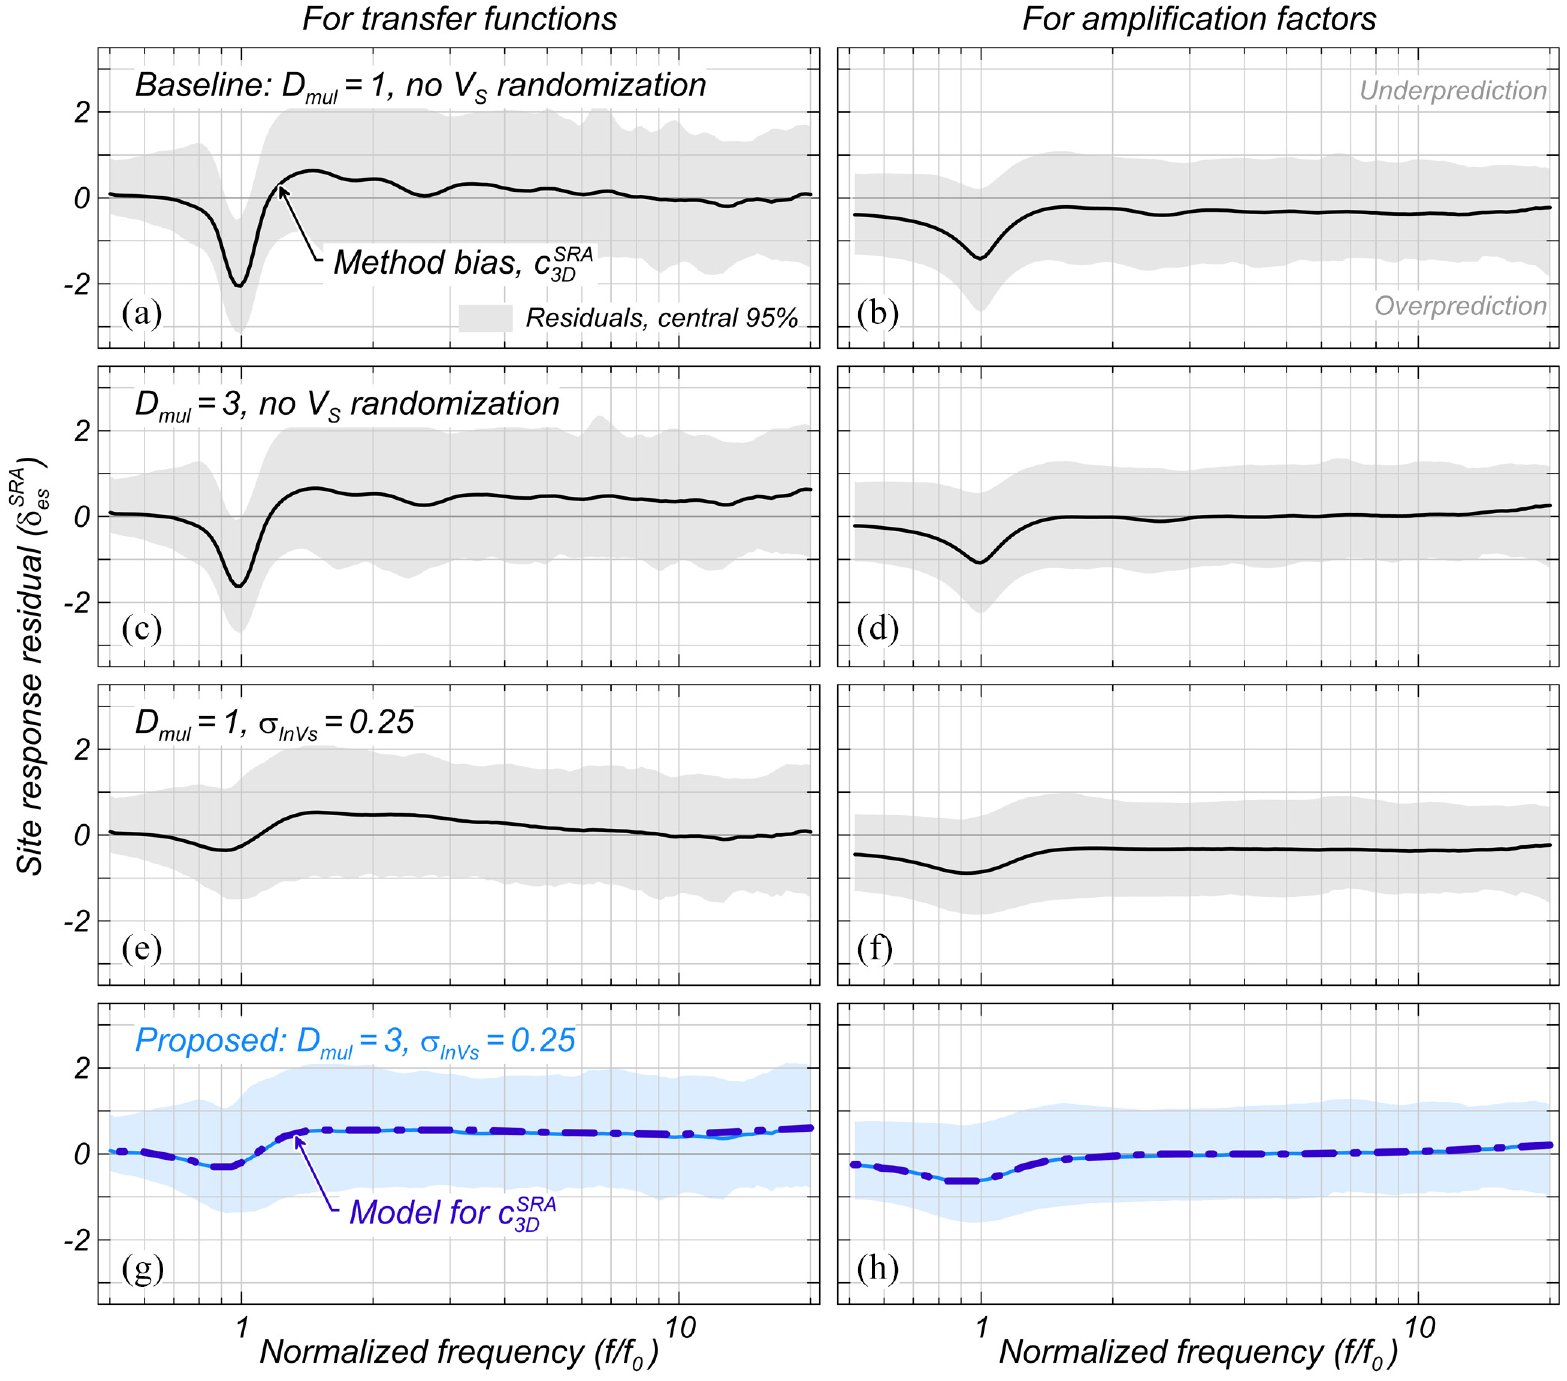
The site response residuals are calculated for TFs and AFs using Equation 1 and the partition of residuals into the components
Comparison of site response method bias
The estimated
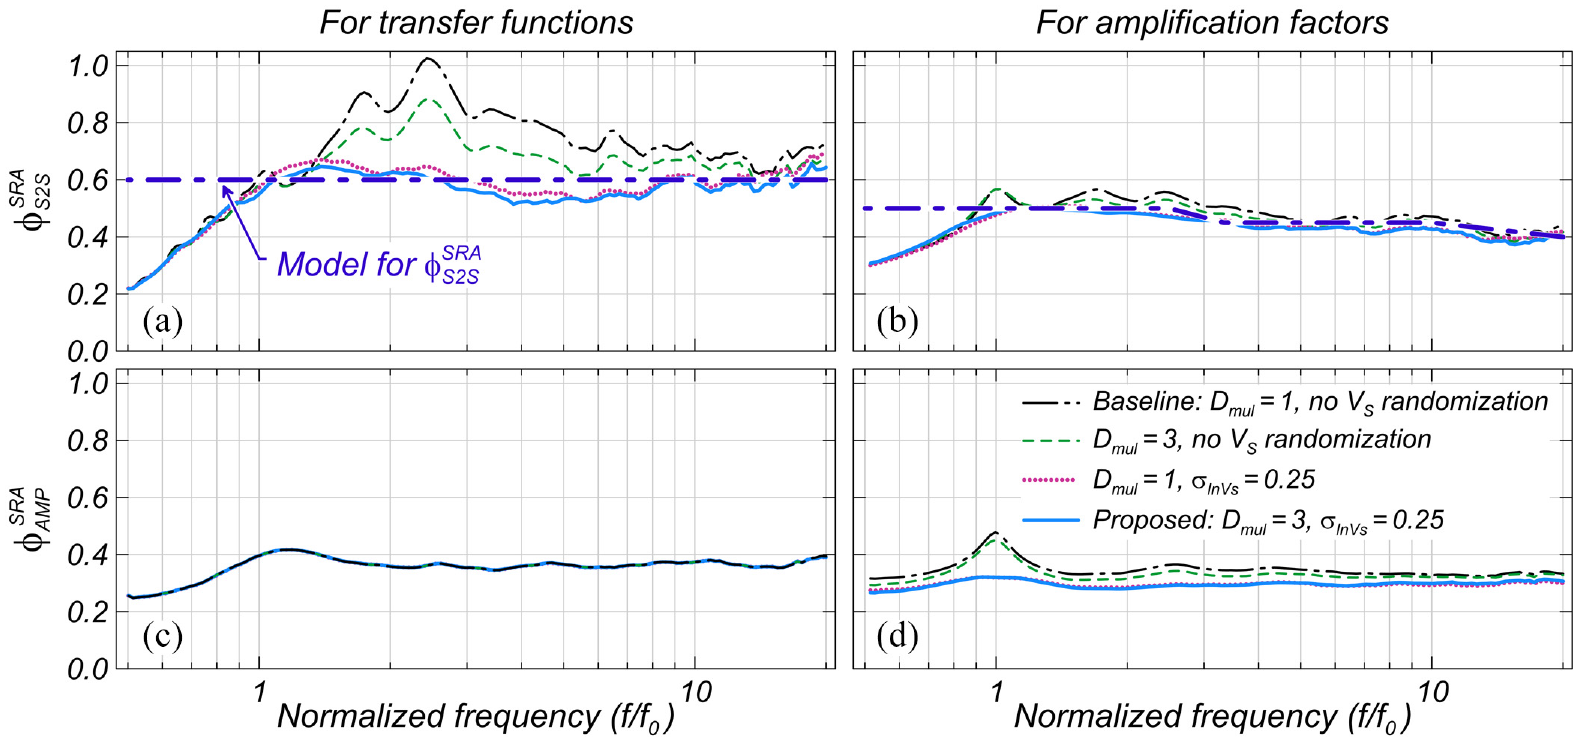
Comparison of site response residual standard deviations (
Conducting 1D SRAs following the proposed approach leads to an overall reduction in
Recommended models for method bias
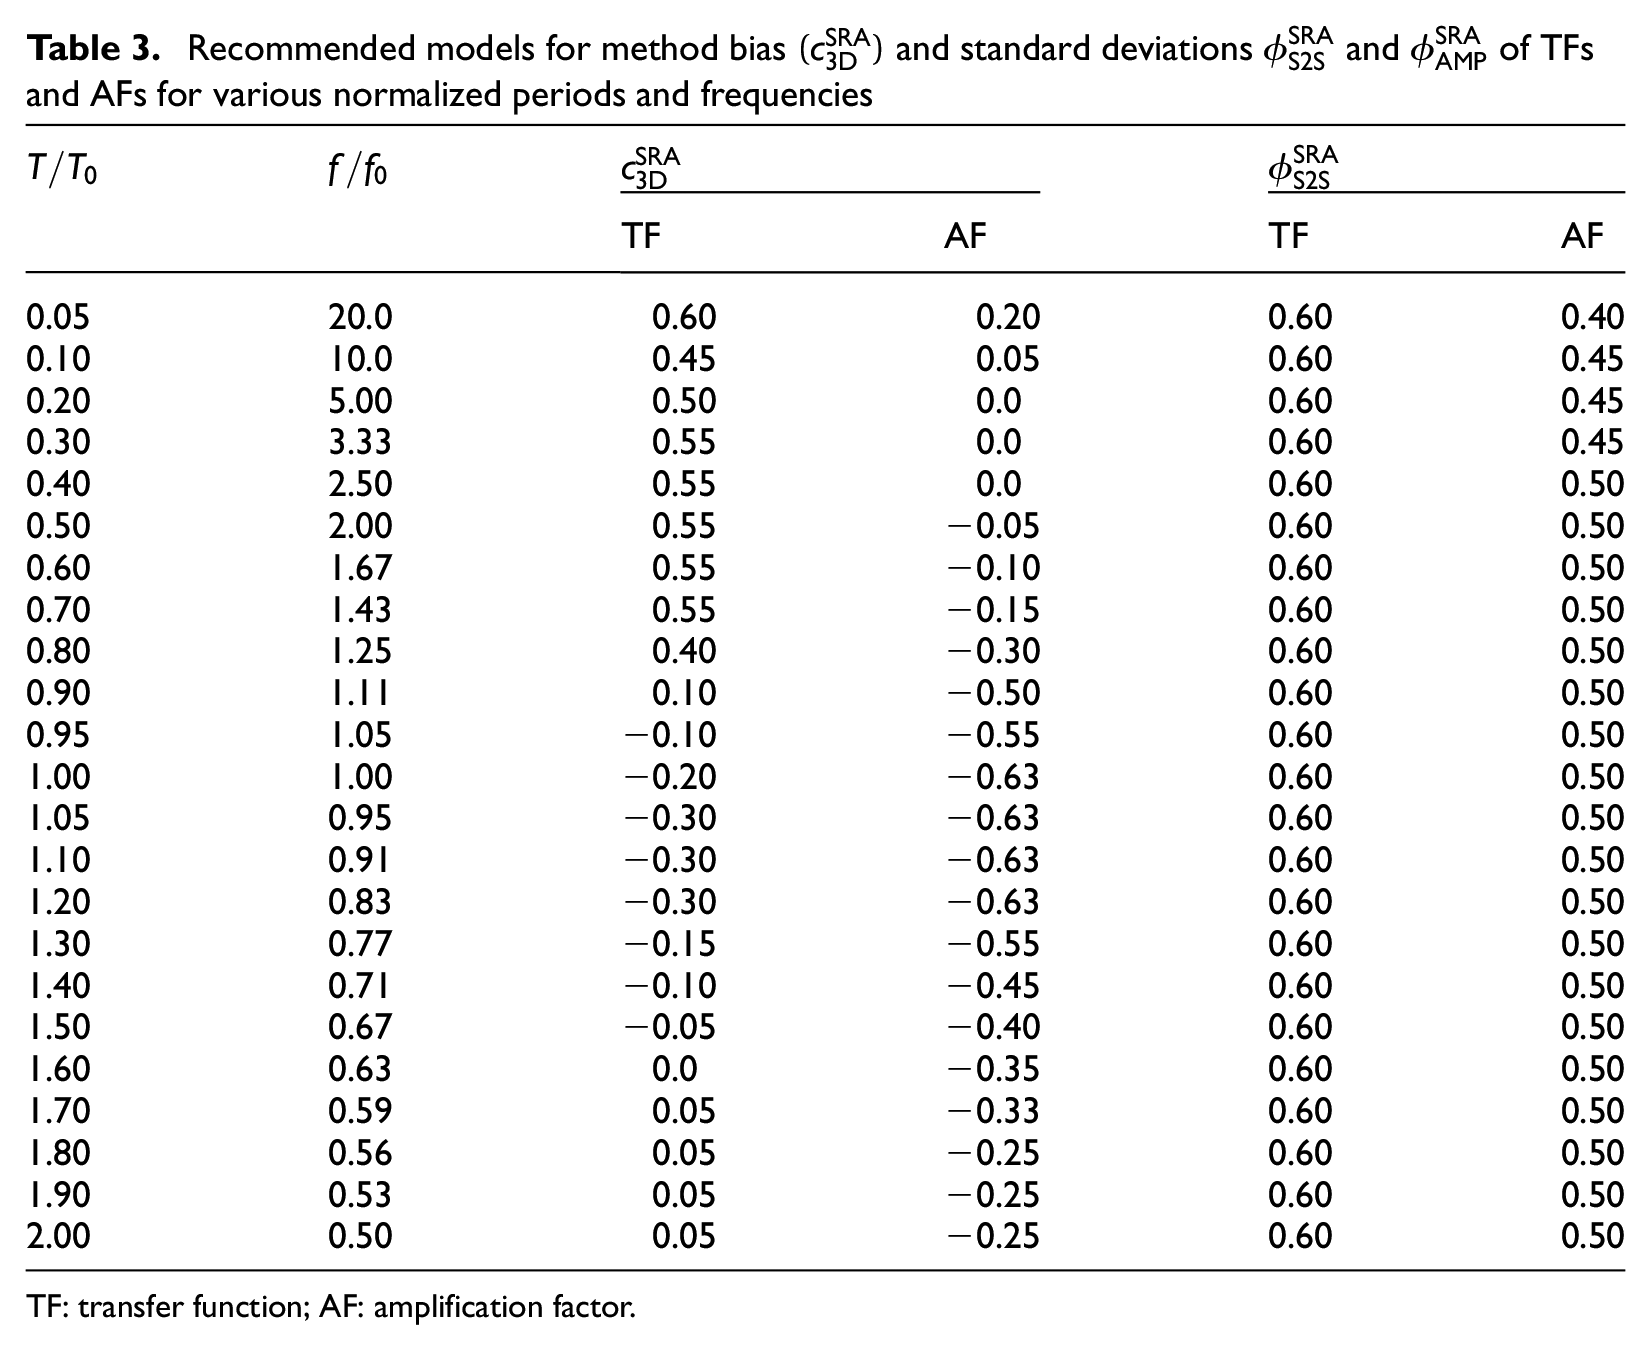
TF: transfer function; AF: amplification factor.
These results are consistent with findings from previous studies that have used a similar database. The results are not fully comparable as such studies did not use the normalized frequency in the estimation of the residual analysis, but some trends can be observed. For TFs, the estimated
Comparison against borehole array data
To illustrate the predictive capability of the proposed approach, TFs and AFs are computed for five KiK-net sites and results compared to observations. These sites
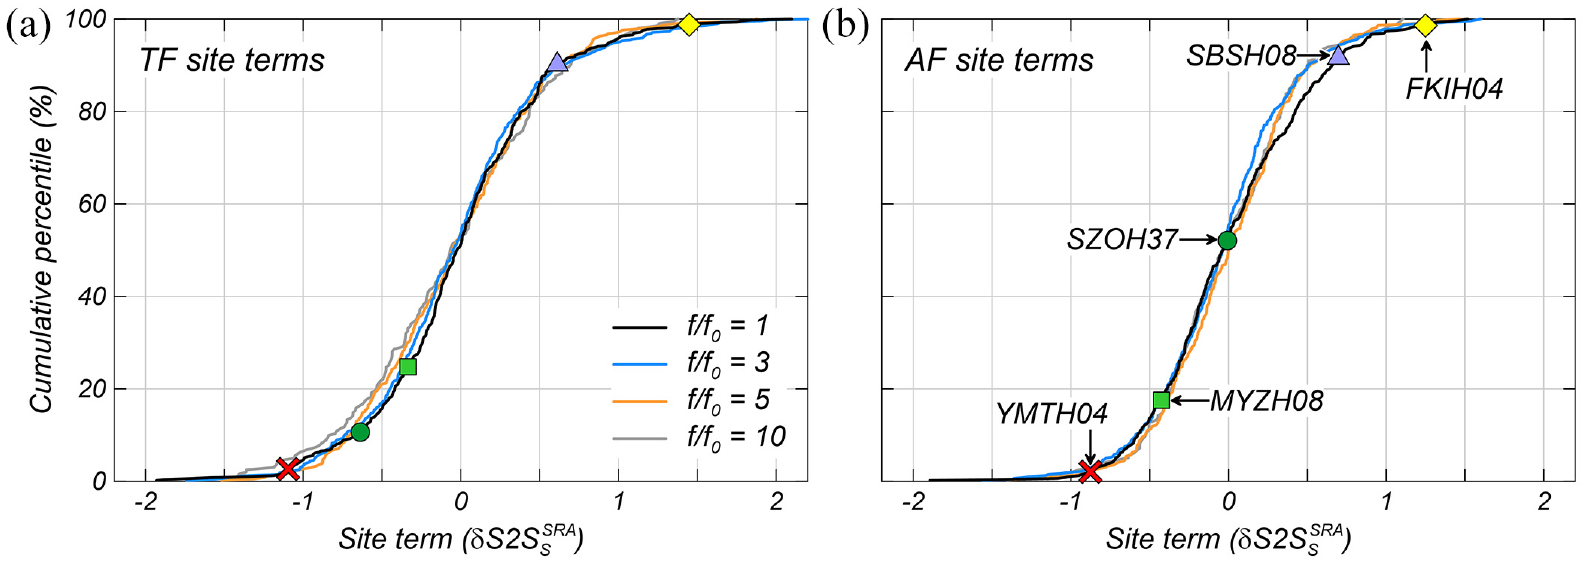
Cumulative distribution of site terms
Figure 11 illustrates a comparison between observations and results from the proposed approach for the five KiK-net sites in terms of TFs and AFs. The best-estimate responses show an overall ability to capture well the median observed responses (Figures 11c to f) but also the potential for discrepancies. The discrepancies observed in AFs at the fundamental modes cover the range of possible accuracy achieved by the proposed approach. In cases where the best-estimate median site response does not capture the observed median well, the 5th and 95th percentiles of the median site response manage to better represent it, although with exceptions (e.g. SZOH37 around 10 Hz, SBSH08 around 2 Hz). Such high amplitudes are explained by the additional variability in site response residuals,
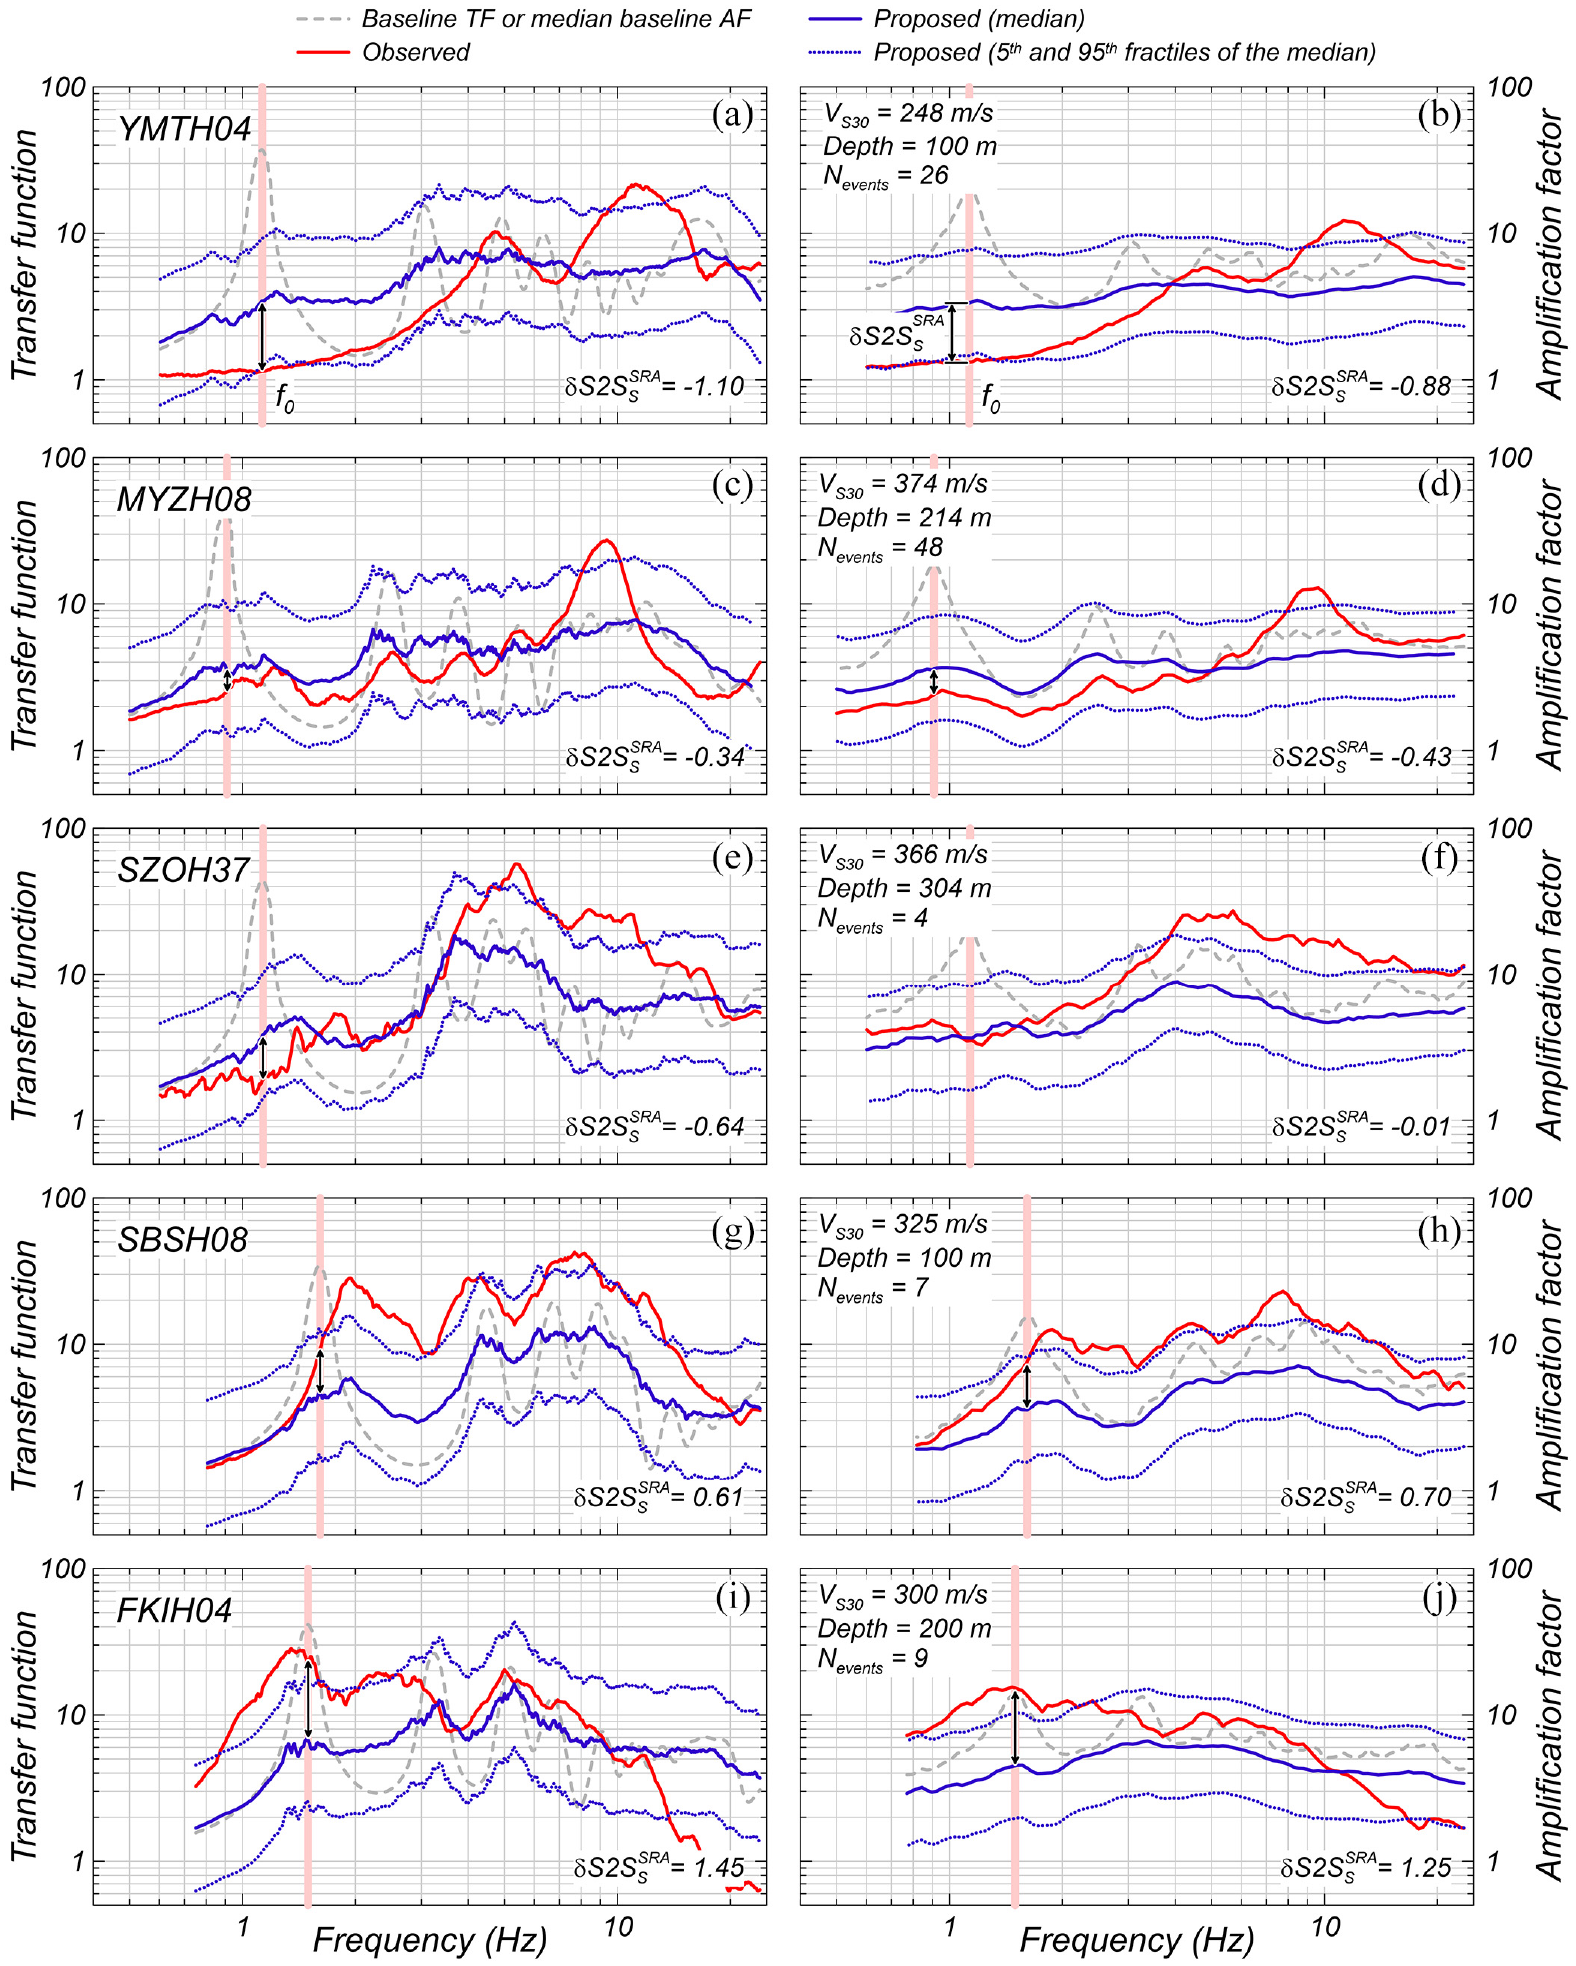
Transfer functions (TFs) and amplification factors (AFs) estimated using Cases 1 (baseline or theoretical) and Case 4 (proposed approach) for five KiK-net sites. The sites are selected to cover the range of site terms
Effect of sites’ region and type
As previously described,
The site response residuals for 1D-like sites indicate underprediction at
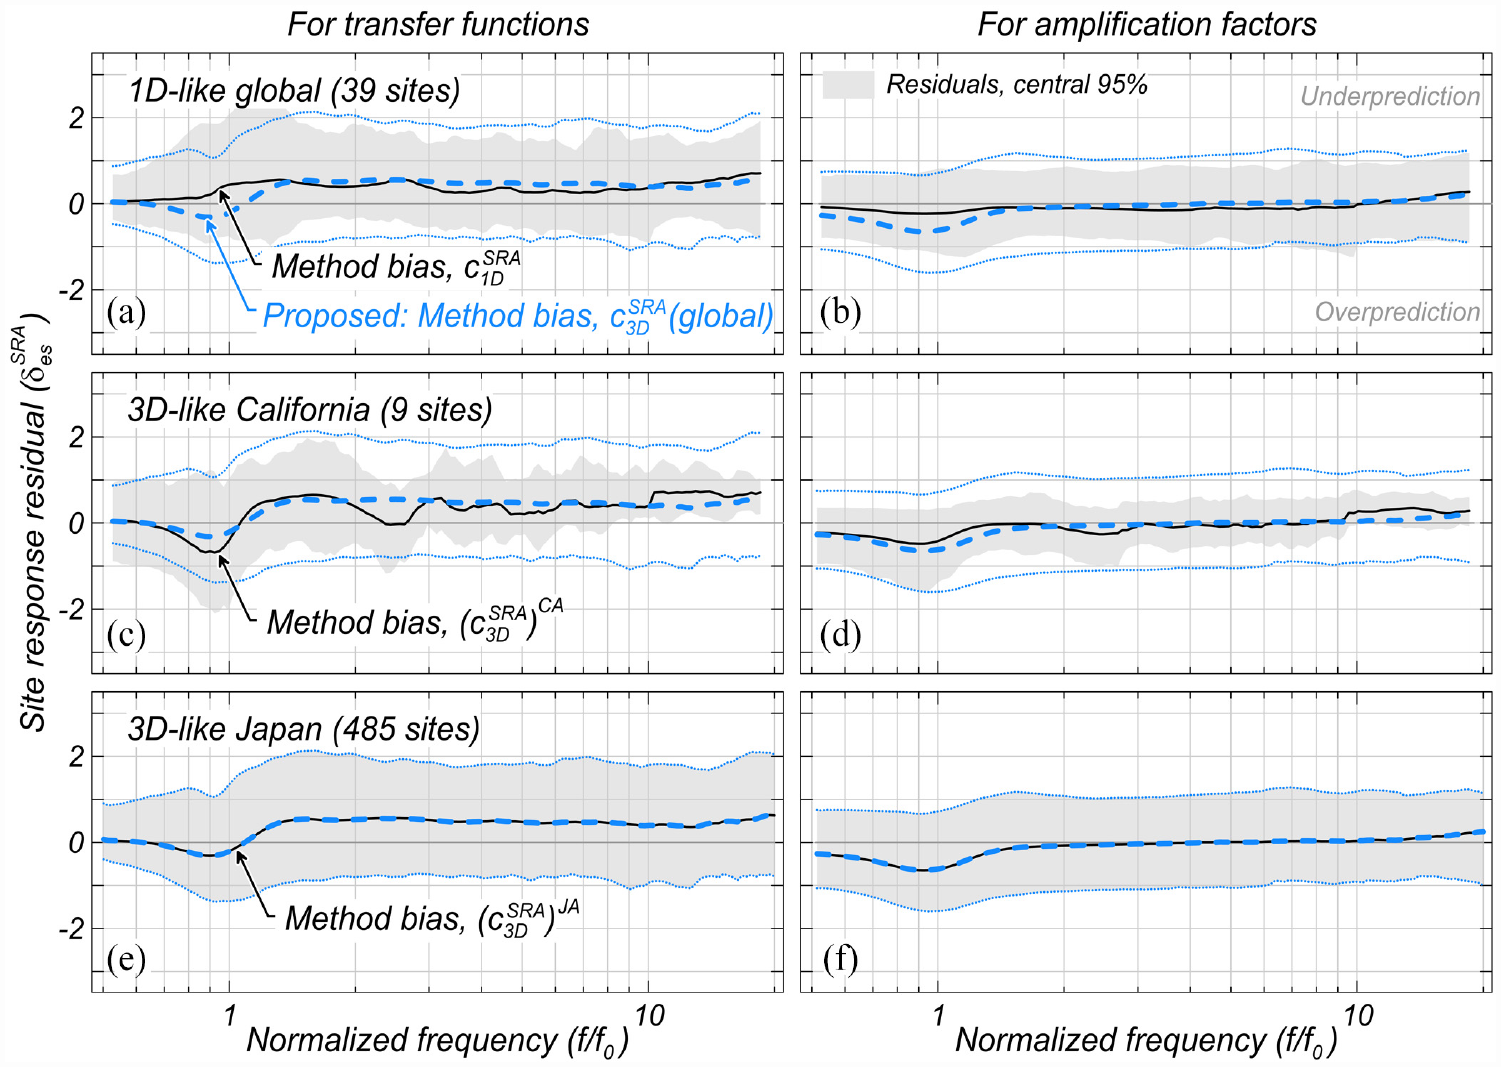
Comparison of site response method bias (
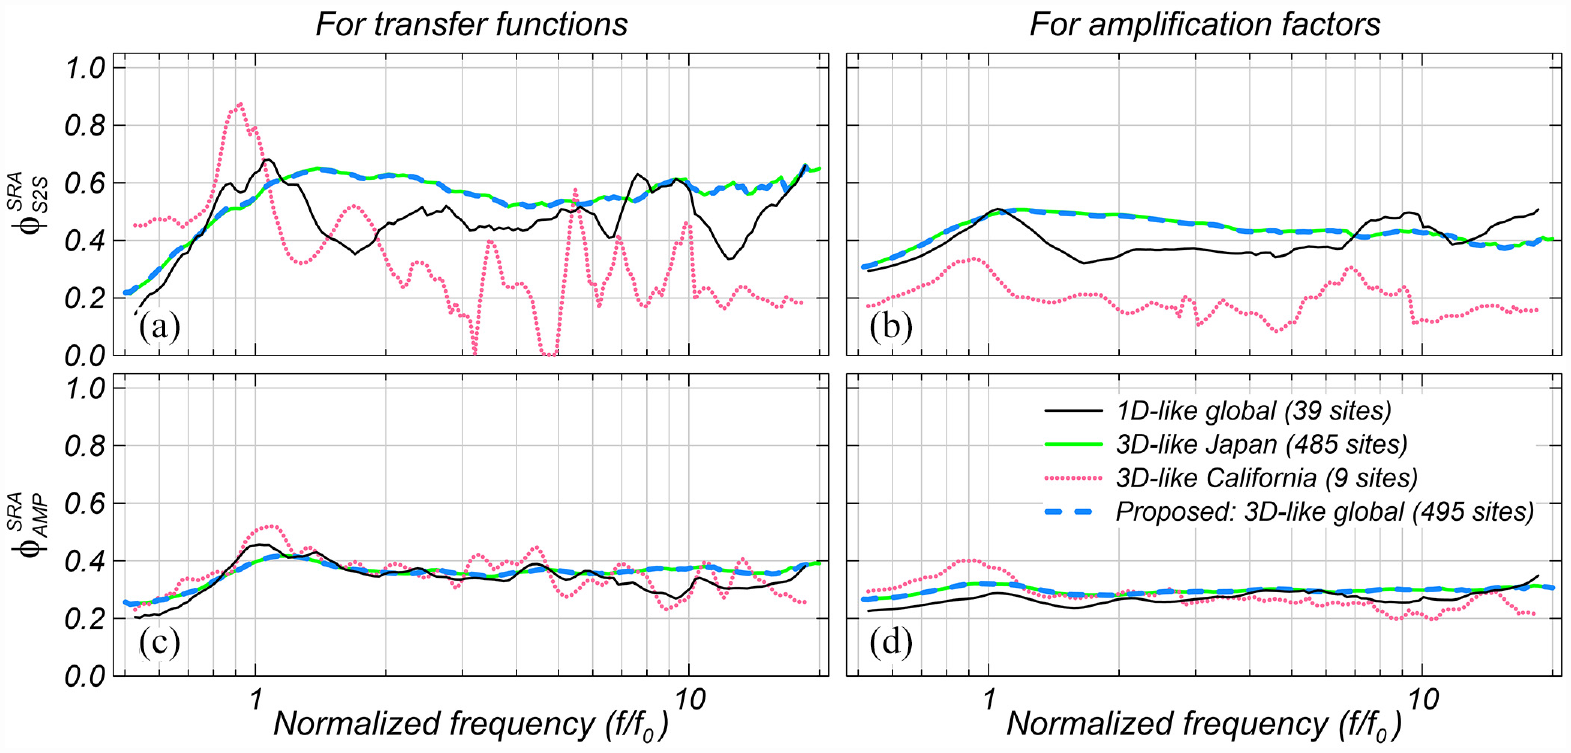
Comparison of site response residual standard deviations (
The site response residuals for California are similar in the tendency to the global data, clearly dominated by the sites in Japan, but they show a different trend in the observed
Applicability to outcrop ground motions
The proposed approach is developed based on borehole array data, whereas forward site response predictions and ground-motion model developments are based on rock outcropping and free field data. Concerns regarding the use of borehole recordings are due to the wave-canceling effects that such recordings carry. The wave-canceling effect refers to the destructive interference of the upgoing and downgoing waves (Bonilla et al., 2002) that leads to near-zero amplitude at some frequencies in borehole recordings and thus unrealistically high amplitudes in observed TFs (e.g. site OKYH14 at 5 Hz in Figure 14e). Given that these TF amplitudes are not associated with the subsurface structure or site-specific factors controlling the site response, they are referred to as pseudo-resonances (Tao and Rathje, 2020b).
Various researchers investigated wave-canceling effects and proposed methods for using borehole array data (e.g. Cadet et al., 2011; Chandra et al., 2015; Clayton and Wiggins, 1976; Mehta et al., 2007; Parolai et al., 2010); however, no method is established to date. Tao and Rathje (2020a, 2020b) propose a taxonomy for identifying sites affected by pseudo-resonances and recommend that these sites not be used in site response validation studies. Contrary to this, Stewart and Afshari (2021) suggest that pseudo-resonances be embraced and considered in the evaluation of the 1D SRA predicting capabilities. While the effect of pseudo-resonances leads to the overestimation of TF amplitudes, in this study, the question we try to answer is whether pseudo-resonances affect the site response bias,
An initial investigation to evaluate the effect of pseudo-resonances on
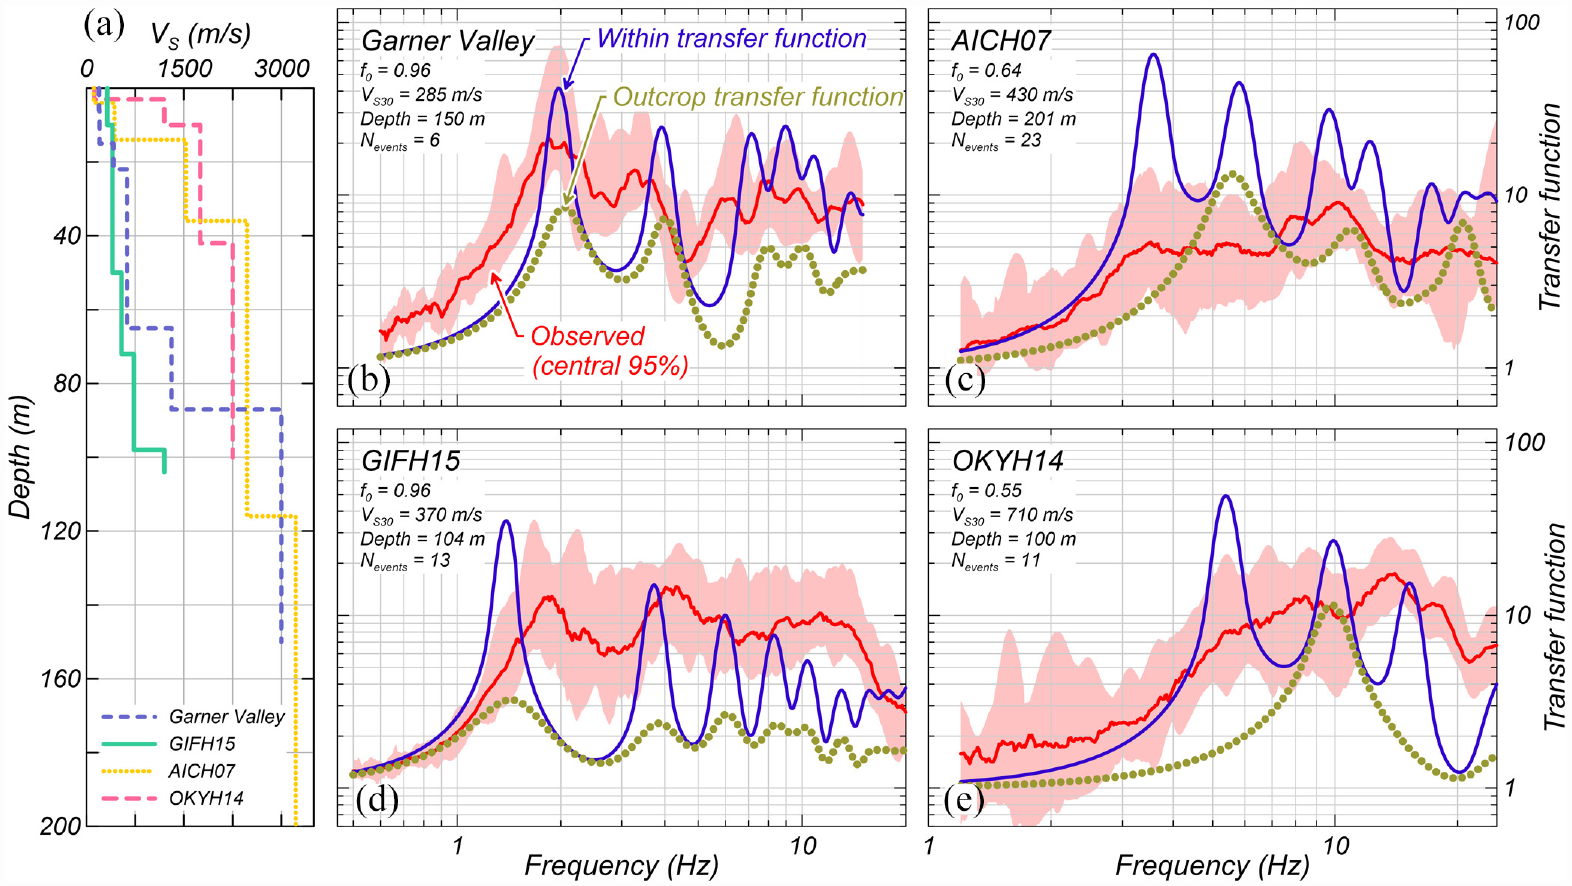
Example of sites unaffected and affected by pseudo-resonances: (a) measured VS profiles, (b) and (d) transfer functions (TFs) for sites free of pseudo-resonances, (c) and (e) TFs for sites with pseudo-resonances.
The 495 sites used for the statistical analysis are separated into 40 sites identified as free of pseudo-resonances (N-P), and the remaining 455 sites with pseudo-resonances (P). Residuals are computed for each group, and the statistical analyses conducted to recompute
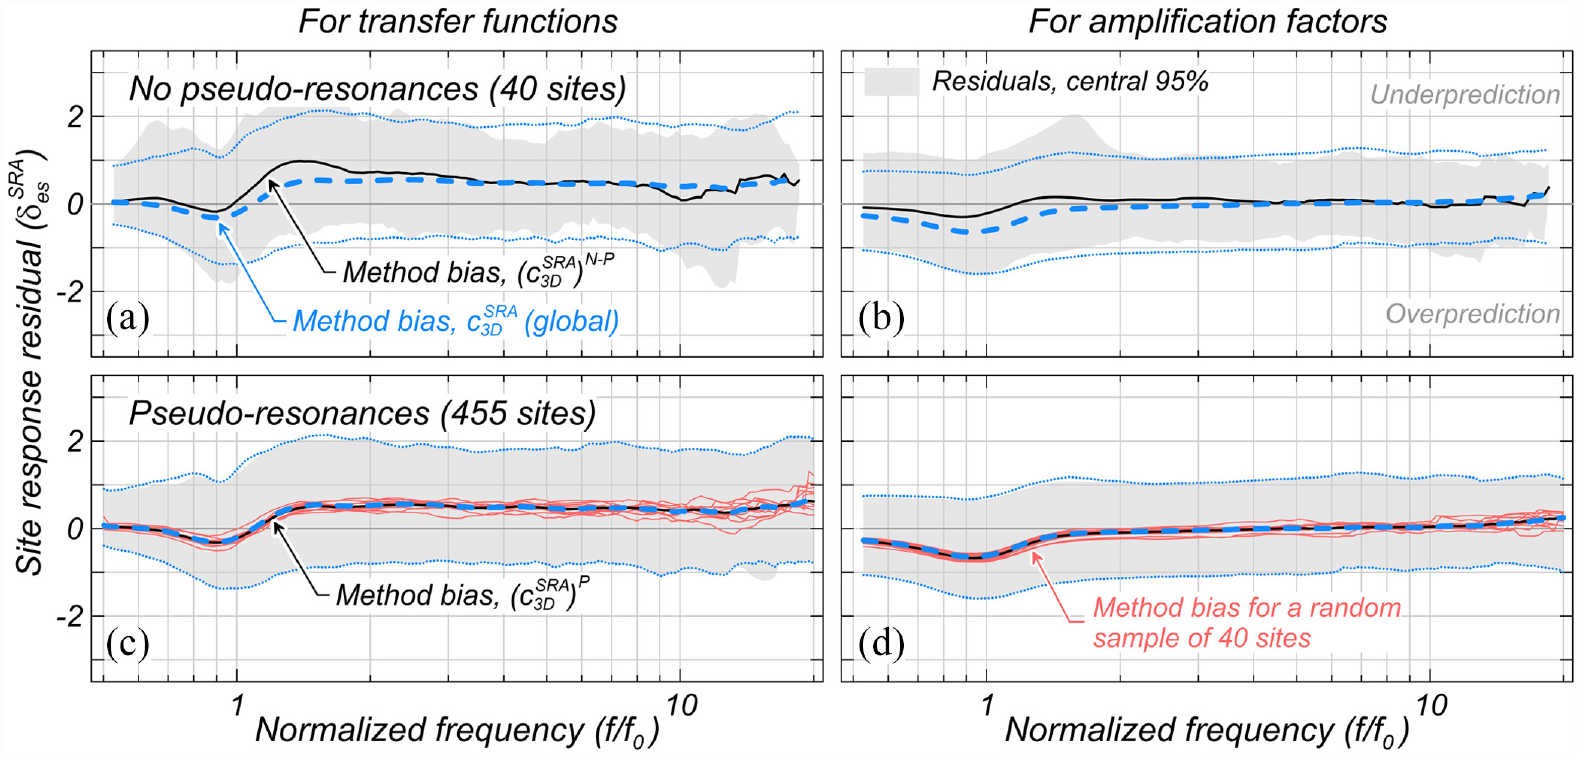
Comparison of site response method bias
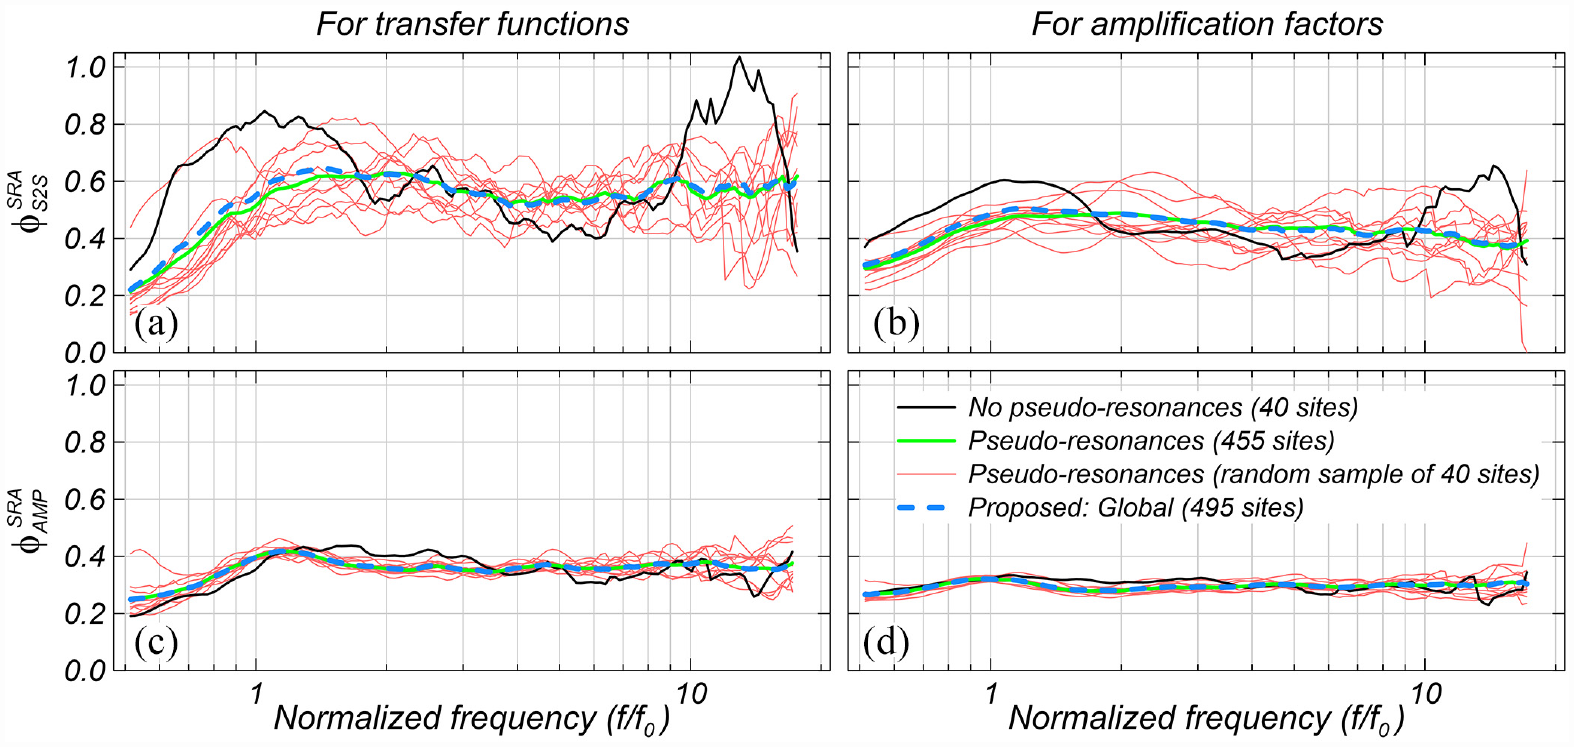
Comparison of site response residual standard deviations (
Overall, results for sites considered unaffected by pseudo-resonances indicate higher
These findings show that there is potential for further underprediction of the median site response, and higher
Example application
The proposed approach is used to estimate the site response at a hypothetical project site selected for the construction of a rigid structure with a period of approximately 0.1 s. The site is located on 30-m-thick old deposit of dense alluvial soils overlying a bedrock with VS = 1080 m/s at the top 30 m. A single measured VS profile available for the site (Figure 17b). The closest active fault is located 25 km away from the site, and the highest historical earthquake magnitude is Mw6.0. The engineers leading the design of the structure are concerned about the seismic demands during an earthquake of similar magnitude and with a predominant period close to the structure’s resonant period. The analysts decide to conduct a deterministic seismic hazard analysis and 1D SRAs to estimate the seismic demand at the foundation level of the structure, assuming free field conditions.
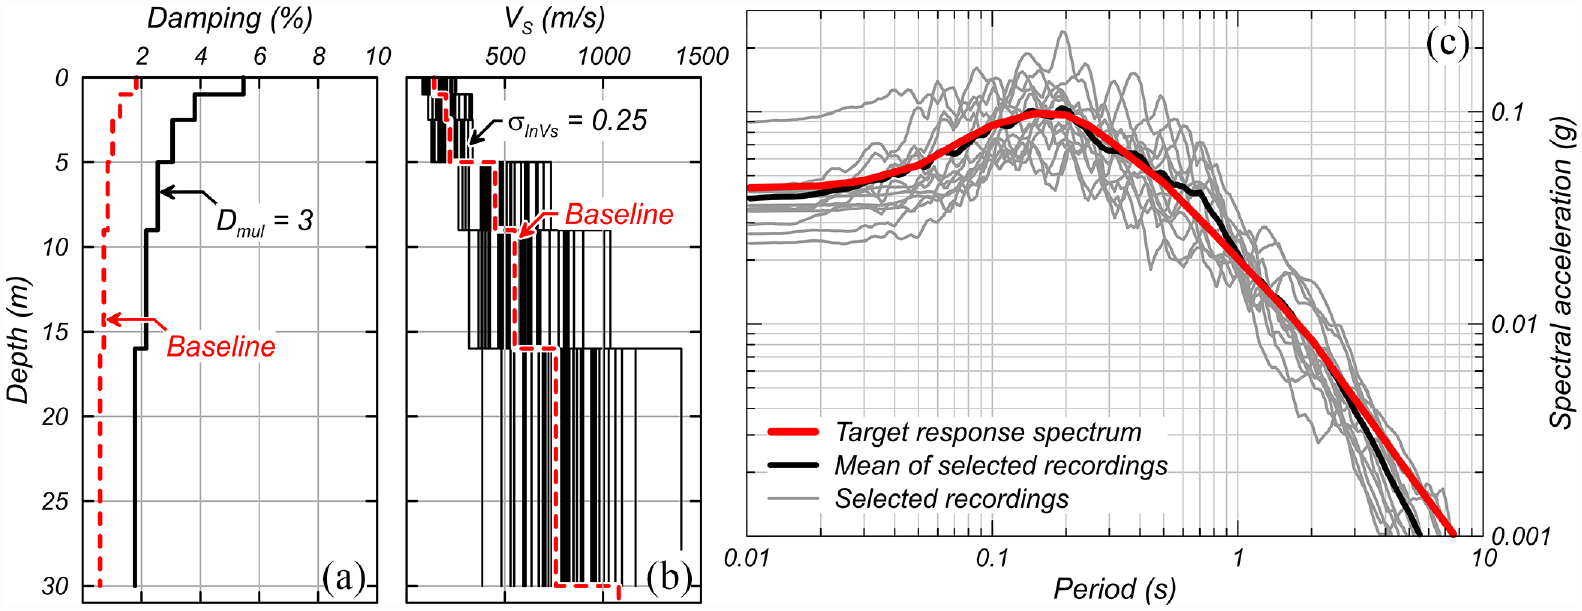
(a) Baseline and factorized damping profiles. (b) Baseline and randomized VS profiles. (c) Target response spectrum and selected input ground motions.
Seismic demand
A deterministic scenario is defined based on the site’s characteristics, and the response spectrum estimated using the Abrahamson et al. (2014) GMM (Figure 17c). For practical purposes, this spectrum is considered representative of the seismic demand at the base of the alluvial deposit. A more appropriate estimation requires (1) accounting for the differences in the site-specific VS profiles and the implied by the GMM (Williams and Abrahamson, 2021), (2) the application of the input ground motions at the bottom of the deposit, and (3) the estimation of the response spectrum at surface using a single-station sigma given that the site response is estimated using 1D SRAs (e.g. Al Atik, 2015).
Thirteen ground motions are selected from the NGA-West2 database (Ancheta et al., 2013) and scaled such that their mean approximately matches the target response spectrum (Figure 17c). The potential for soil nonlinearity is evaluated based on the shear strain index,
Proposed approach
Step 1: site characterization
The site characterization consists of estimating the baseline VS profile, and laboratory-based damping profile. The baseline VS profile is taken from the available field measurement (Figure 17b), whereas the damping profile is estimated after Darendeli (2001), considering the mean effective stress at the middle of each VS layer (Figure 17a). The site’s
Step 2: site response input parameters
The baseline damping and VS profiles are adjusted to remove the errors intrinsic to 1D SRAs as a tool and improve the accuracy of site response predictions. The small-strain damping profile estimated after Darendeli (2001) is increased by Dmul = 3. In addition, the top 30 m of the baseline VS profile corresponding to the alluvial deposit are randomized to generate 50 VS profiles using the VS model after Toro (1995) with
Step 3: uncorrected median site response
The input ground motions are propagated through each of the randomized VS profiles to obtain the response at ground surface (Figure 18). An outcropping boundary condition is considered for the base of the models. Fifty FAS and acceleration response spectra per input ground motion are obtained at surface, and the median values considered the uncorrected (biased) best-estimate responses for each one of the input motions (Figure 18e and f). Results are presented in FAS from 0.04 to 0.25 s (half
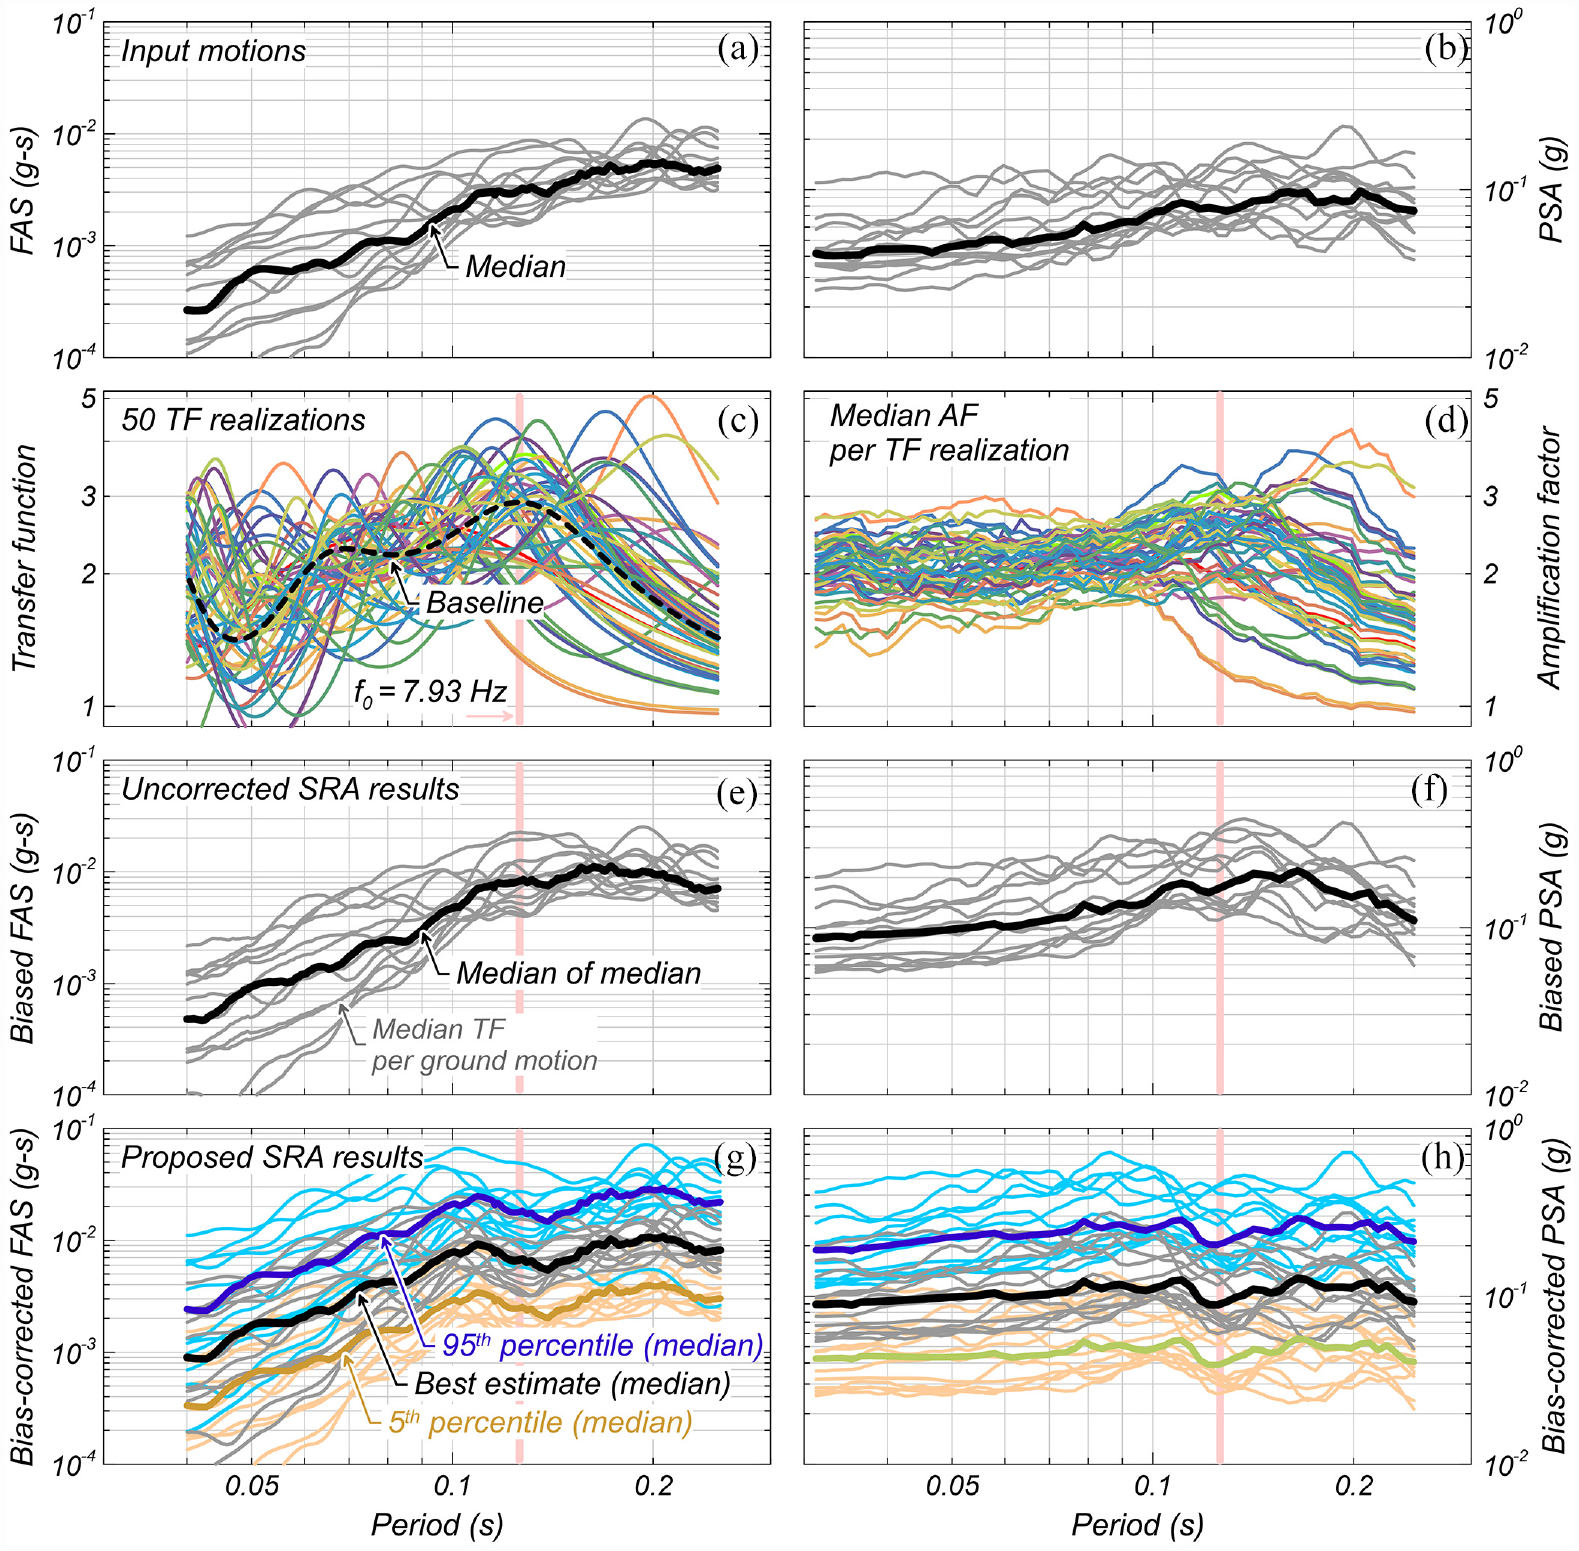
Estimated site response for a hypothetical site, step-by-step results for Fourier amplitude spectra (FAS) and pseudo-spectral acceleration (PSA) response spectra: (a) and (b) input ground motions, (c) and (d) transfer functions and amplification factors (median of all input motions) per randomized VS profile; (e) and (f) uncorrected FAS and uncorrected PSA response spectra (median of all input motions) at surface; (g) and (h) best-estimate, and 5th and 95th percentiles of bias-corrected FAS and PSA response spectrum at surface (median of all input motions).
Step 4: bias correction
The median FAS and PSA response spectrum at ground surface are corrected to account for the 1D-SRA bias. The bias correction is conducted by scaling
Step 5: accounting for modeling errors
The bias-corrected best-estimate TFs and AFs assume that the proposed approach and 1D SRAs are capable of perfectly estimating the site response, which is unrealistic. To account for the potential response to be higher or lower due to unmodeled features affecting the response with a 90% confidence interval, the best-estimate bias-corrected median TF and AF are shifted by
Recommended path forward
The site response evaluation indicates that the median PSA expected at a period of 0.1 s is approximately 0.145g. However, when accounting for modeling errors, it is possible that the PSA be 0.32g (median with 90% confidence interval). Whether the best-estimate median PSA or 95th percentile of the median PSA is used for design of the structure depends on the project-specific engineering- and non-engineering-related aspects. However, it is recommended that (1) the bias-corrected best-estimate median site response be used for design and (2) the 95th median site response percentile be checked. Using the 95th percentile median site response allows the responsible team to adjust the design to prevent a potential catastrophic failure, or to make an informed decision about the best path forward.
Conclusions
An approach for conducting linear elastic 1D SRAs developed based on borehole array data was presented. This approach (1) uses a damping multiplier (Dmul = 3) and VS randomization
Comparisons of ground-motion data from 534 borehole array sites against 1D SRA predictions in terms of transfer functions (TFs) and amplification factors (AFs) showed global trends in the discrepancies. An overall site response overprediction is observed in the low-frequency range and underpredictions in the high-frequency range. The use of randomized VS profiles reduces the overpredictions at the frequency modes and leads to median TFs and AFs with a more uniform distribution of energy (i.e. site response amplitudes) across frequencies, similar to empirical median responses. The use of Dmul = 3 to increase damping leads to the estimation of nearly unbiased AFs across frequencies. Despite these improvements, site response estimates from 1D SRAs conducted with Dmul and randomized VS profiles are still biased and present significant variability in their site terms
An investigation of the effect of pseudo-resonances on the proposed approach indicates that outcropping applications could potentially require a stronger bias-correction to prevent underpredictions and a larger shift of the bias-corrected median response to account for 1D SRA modeling errors. This finding further stresses the need for investigating the applicability of findings from site response studies using borehole array data for engineering applications. Given the assumptions made in this investigation and recognizing that current practices assume
The recommended values for
Supplemental Material
sj-pdf-1-eqs-10.1177_87552930231173443 – Supplemental material for A borehole array data–based approach for conducting 1D site response analyses II: Accounting for modeling errors
Supplemental material, sj-pdf-1-eqs-10.1177_87552930231173443 for A borehole array data–based approach for conducting 1D site response analyses II: Accounting for modeling errors by Renmin Pretell, Norman A. Abrahamson and Katerina Ziotopoulou in Earthquake Spectra
Supplemental Material
sj-pdf-2-eqs-10.1177_87552930231173443 – Supplemental material for A borehole array data–based approach for conducting 1D site response analyses II: Accounting for modeling errors
Supplemental material, sj-pdf-2-eqs-10.1177_87552930231173443 for A borehole array data–based approach for conducting 1D site response analyses II: Accounting for modeling errors by Renmin Pretell, Norman A. Abrahamson and Katerina Ziotopoulou in Earthquake Spectra
Supplemental Material
sj-pdf-3-eqs-10.1177_87552930231173443 – Supplemental material for A borehole array data–based approach for conducting 1D site response analyses II: Accounting for modeling errors
Supplemental material, sj-pdf-3-eqs-10.1177_87552930231173443 for A borehole array data–based approach for conducting 1D site response analyses II: Accounting for modeling errors by Renmin Pretell, Norman A. Abrahamson and Katerina Ziotopoulou in Earthquake Spectra
Supplemental Material
sj-pdf-4-eqs-10.1177_87552930231173443 – Supplemental material for A borehole array data–based approach for conducting 1D site response analyses II: Accounting for modeling errors
Supplemental material, sj-pdf-4-eqs-10.1177_87552930231173443 for A borehole array data–based approach for conducting 1D site response analyses II: Accounting for modeling errors by Renmin Pretell, Norman A. Abrahamson and Katerina Ziotopoulou in Earthquake Spectra
Footnotes
Acknowledgements
The authors appreciate the detailed review of the two anonymous reviewers, whose suggestions greatly improved this article.
Declaration of conflicting interests
The author(s) declared no potential conflicts of interest with respect to the research, authorship, and/or publication of this article.
Funding
The author(s) received no financial support for the research, authorship, and/or publication of this article.
Supplemental material
Supplemental material for this article is available online.
References
Supplementary Material
Please find the following supplemental material available below.
For Open Access articles published under a Creative Commons License, all supplemental material carries the same license as the article it is associated with.
For non-Open Access articles published, all supplemental material carries a non-exclusive license, and permission requests for re-use of supplemental material or any part of supplemental material shall be sent directly to the copyright owner as specified in the copyright notice associated with the article.