
Abstract
In many countries, seismic characterization of the site selected for a critical structure or industrial facility is required in terms of site-specific seismic ground motion hazard. For this purpose, a probabilistic seismic hazard analysis (PSHA), performed under the Senior Seismic Hazard Analysis Committee (SSHAC) protocol, is an extended practice for nuclear facilities. In the past decade, SSHAC Level 3 studies have been performed for sites in North America, Europe, Japan, Taiwan, and South Africa. When analyzing PSHA results, the mean-to-median spectral acceleration ratios given by the hazard curves can be interpreted as a measure of the degree of epistemic uncertainty associated with the results. In this article, results of 33 SSHAC Level 3 studies have been used to determine mean-to-median spectral acceleration ratios and the statistics of these ratios, as a function of spectral frequency and annual frequency of exceedance (AFE). The purpose was to develop a reference for the range of uncertainty that is typically captured in this kind of studies. It has been found that, for a given AFE, ratios corresponding to different sites are within a relatively small interval, especially for the spectral frequency band between 2.5 and 10 Hz, which is the band normally more relevant for the seismic design of nuclear installations. In this band, for 10−4 yr−1 AFE, a mean/median ratio of 1.40 would envelop practically all investigated sites.
Keywords
Introduction
For critical structures or industrial facilities, like large dams or power generating stations, seismic characterization of the site in terms of site-specific seismic ground motion hazard is nowadays a requirement in many countries. In case of nuclear installations, the International Atomic Energy Agency (IAEA) requires an evaluation of seismic ground motion hazards at the site, to provide the input needed for the seismic design of the installation (IAEA, 2019). International good practices for seismic hazard assessment are gathered in IAEA Specific Safety Guide No. SSG-9 (Rev. 1) (IAEA, 2022).
Probabilistic seismic hazard analysis (PSHA) is currently the most extended practice for nuclear facilities (American Nuclear Society [ANS], 2008). The main output of a PSHA is a set of hazard curves, usually covering about 20 spectral frequencies. A hazard curve provides the annual frequency of exceedance (AFE) of different levels of horizontal, 5% damped, spectral acceleration (Figure 1).
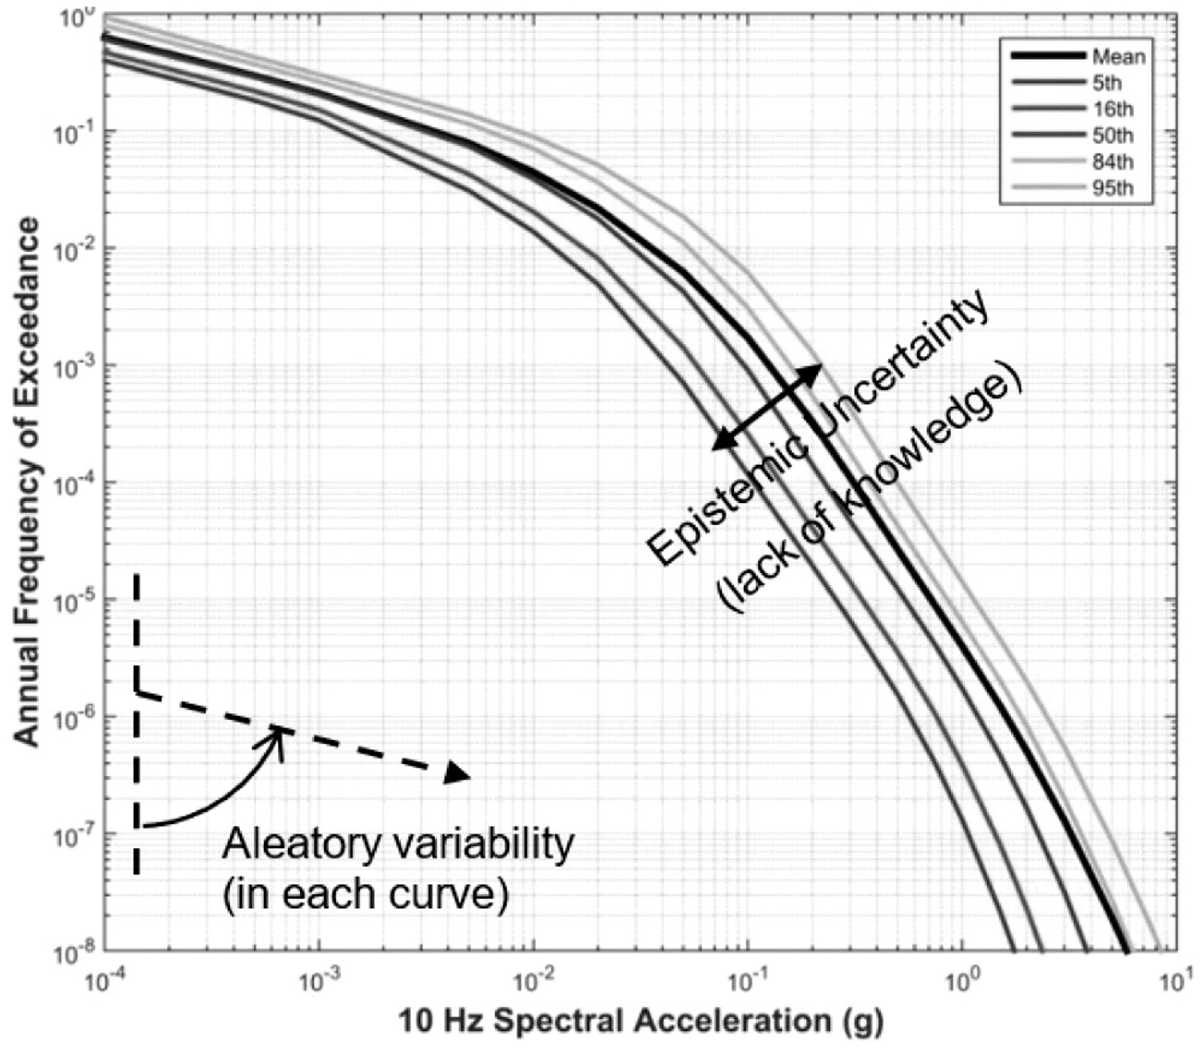
Sample set of seismic hazard curves for 10 Hz spectral frequency. In each curve, slope is connected with aleatory variability, whereas dispersion of the curves with respect to the median hazard curve is an indicator of epistemic uncertainty.
In performing a PSHA, uncertainties in the state of knowledge of seismic sources and seismic wave propagation need to be considered. In the current practice, two types of uncertainties are taken into account: aleatory variability and epistemic uncertainty. Aleatory variability is natural variability in the physical processes as they have been modeled, and it cannot be reduced by additional data. On the contrary, epistemic uncertainty is the result of lack of knowledge and, theoretically at least, it can be reduced by further investigation or data collection.
These two categories of uncertainty are treated differently within a PSHA. Aleatory variability is commonly introduced when integrals are carried out over sources of aleatory variability to get the probability that the selected ground motion parameter is exceeded, given one assumption on the state of nature. When the PSHA is performed, this gives a single hazard curve for each assumed state of nature. The slope of this hazard curve is related to the aleatory variability considered in the analysis (Figure 1).
On the contrary, uncertainty about this hazard curve, the epistemic uncertainty, is taken into account using logic trees to incorporate multiple assumptions, hypotheses, models, or parameter values. Each realization of the overall logic tree corresponds to an interpretation of the state of nature and results in a hazard curve. Thus, the multiple interpretations of the state of nature result in a set of hazard curves, which may be very large if the number of branches in the overall logic tree is large. Each hazard curve has an associated weight, which corresponds to the level of confidence assigned by the PSHA team to the model and parameter choices behind the curve. The sum of all weights is unity. The weights are used to obtain a statistical distribution of the resulting hazard. At the end of the study, results are presented as curves of statistical parameters (e.g. mean, median, and percentiles) of the annual exceedance frequency for each ground motion parameter amplitude. The central tendency is given by the median hazard. The mean hazard curves tend to track across the fractile curves, moving to higher percentiles as the AFE becomes smaller. For the AFEs of interest in nuclear installations, the mean tends to be closer to the 84% percentile rather than to the median. The mean is commonly used to derive the design basis earthquake for the nuclear installation (American Society of Civil Engineers (ASCE), 2019). The distance between percentile curves is an effect of the epistemic uncertainty in the source characterization and ground motion prediction (Figure 1).
It is important to note that there are various scientific challenges associated with populating the logic tree branches, which often require the development of new models, as well as with assigning appropriate weights to these branches. One of the most significant challenges currently faced by the profession is a lack of qualified and experienced experts (Bommer, 2012). These issues, as well as the discussion of aleatory variability and epistemic uncertainty in hazard curves, are well-known among experts and practitioners, and have been extensively discussed and addressed in publications such as a series of Opinion Papers in Earthquake Spectra, including works such as Bommer (2012), Musson (2012), Scherbaum and Kuehn (2011), and Abrahamson and Bommer (2005).
After seminal work by Esteva (1967) and Cornell (1968), the formal procedure for a PSHA was already available in the 1970s (McGuire, 1976). A first mass application of this technology to nuclear sites was performed in the 1980s, when PSHA studies were carried out for about 70 sites in the United States, by two independent organizations: the Electric Power Research Institute (EPRI, 1989), sponsored by industry, and the Lawrence Livermore National Laboratory (LLNL, Bernreuter et al., 1989), sponsored by the United States Nuclear Regulatory Commission (US-NRC). The outcome of this first mass application of the PSHA technology was disappointing, since the EPRI and Livermore mean seismic hazard curves for many sites in the Eastern United States differed significantly. For example, for 2 × 10⁻⁴ yr−1 AFE, there were factors from 2 to 3 between the mean spectral acceleration values reported by LLNL and EPRI (for illustration, Figure 2 compares the hazard curves for peak ground acceleration, PGA, obtained by LLNL and EPRI studies for a particular site in South Carolina). Note that the discrepancy has a big transcendence in terms of nuclear safety policy, since mean values are the ones used for definition of design basis earthquakes (ASCE, 2019). In his analysis of the discrepancies, Cornell (1992) pointed out that the two studies produced hazard results that were similar in terms of their central or median estimates, but quite different in their estimates of the uncertainty about the central estimate. There were major differences in the 15% percentile, the 85% percentile, and the mean hazard. The conclusion was that the large discrepancies in the mean values of the hazard were a result of differences in the consideration of (epistemic) uncertainties. Based on this idea, Cornell developed a procedure to estimate the mean hazard at a site by using the more stable median hazard results by LLNL and EPRI and a factor to modify (increase) the median hazard estimates into an approximation of the mean hazard (Cornell, 1992).
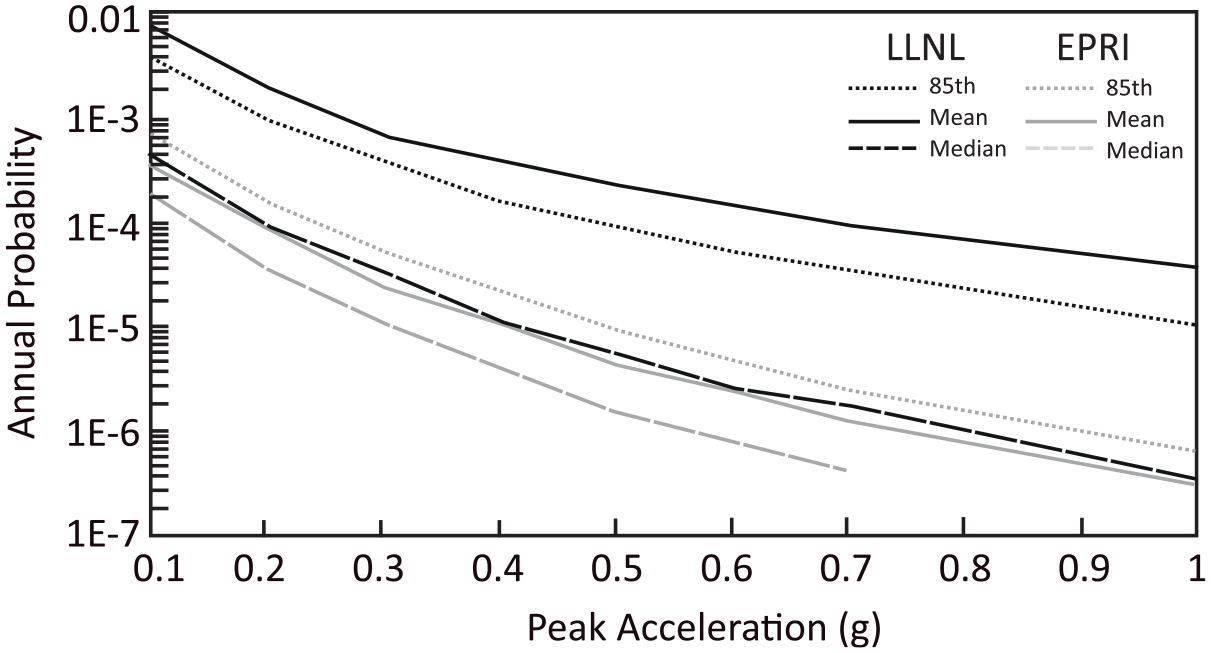
Comparison between LLNL and Electric Power Research Institute seismic hazard results for the Savannah River site, in South Carolina (figure reprinted from Kimball, 1991).
Moreover, this experience led to the establishment of a committee of senior experts: the Senior Seismic Hazard Analysis Committee (SSHAC), and after several years of investigation, the key conclusion of the SSHAC was that discrepancies in PSHA results were due to procedural rather than technical differences (US-NRC, 1997). As a result, procedural recommendations were issued for the performance of a PSHA, in what is known nowadays as the SSHAC protocol. The SSHAC protocol has two distinct phases: (1) evaluation of the complete set of relevant data, models, and methods proposed by the larger technical community, and (2) integration into a seismotectonic model, in the light of the evaluation phase (US-NRC, 2018). The goal is to capture the center, body, and range of all technically defensible interpretations, when building the models to be used in the PSHA. Several levels of the protocol were defined, from Level 1 to Level 4, which require an increasing amount of time and effort.
From the present day’s perspective, what happened in the EPRI-LLNL experiment can be seen as that two competent independent teams, using basically the same available information, working under different procedures, obtained a not very different central (median) estimate of the hazard, but assessed (epistemic) uncertainties very differently, which resulted in major differences in the mean estimates of the hazard. In our opinion, the larger stability of the median hazard estimates, as pointed out by Cornell (1992), is an important outcome of that experiment.
Some nuclear regulators require a Level 3 PSHA for seismic characterization of a new nuclear power plant (NPP) site. In the past decade, SSHAC Level 3 studies have been performed for sites in North America, Europe, Japan, Taiwan, and South Africa. The average duration of a PSHA study following the SSHAC Level 3 protocol is in the order of 36+ months. Reducing the level of the SSHAC protocol to Level 1 roughly reduces duration by a factor of 3 and cost by a factor of 10 (Coleman, 2015). The difference between required time and effort in the different levels of the SSHAC protocol is mainly due to the evaluation of epistemic uncertainties (ANS, 2008). The smaller the level, the more likely is that epistemic uncertainty (i.e. dispersion with respect to median estimates of the hazard) is underestimated.
In a particular PSHA, the mean-to-median spectral acceleration ratios given by the hazard curves can be interpreted as a measure of the degree of epistemic uncertainty (Cornell, 1992). In this article, published results of 33 SSHAC Level 3 studies have been used to determine mean-to-median spectral acceleration ratios and the statistics of these ratios as a function of spectral frequency and AFE. The purpose is to develop a reference for the range of uncertainty that is typically captured in this kind of studies.
It should be acknowledged that a comparison of the ranges of uncertainty captured in different seismic hazard studies has been previously reported by Douglas et al. (2014). Those authors considered various published PSHA studies (eight sites with a SSHAC level protocol ranging from 1 to 4) and a different metric to assess the variability or uncertainty in the hazard estimates, that is, the ratio between the 85th and 15th percentiles of the hazard curves. However, to the best of our knowledge, there are no published studies referring only to SSHAC Level 3 analyses, and where the range of AFEs having more interest in nuclear sites is considered (i.e. 10−4 to 10−6 yr−1).
A discussion of the relative merits of alternative measures of epistemic uncertainty in seismic hazard estimates (i.e. mean-to-median ratios vs the ratios of 85th to 15th percentiles) is given by Douglas et al. (2014). We selected the mean-to-median ratio because we are mainly interested in the part of the distribution above the median, in (presumably) asymmetric hazard distributions.
Database of SSHAC Level 3 studies
A total of 33 SSHAC Level 3 studies have been considered in this work. In particular, we used 25 SSHAC Level 3 studies performed in the United States, five in Spain (Almaraz, Ascó, Cofrentes, Trillo and Vandellós 2), one in Turkey (Sinop), one in South Africa (Thyspunt), and one in Japan (Ikata) (Figure 3). Among the 25 sites in the United States, 23 are located in the Central and Eastern United States (CEUS), and two (Hanford and Diablo Canyon), in the Western United States (Figure 3). In all cases, hazard results include local site effects, except for Hanford site, where hazard results were produced for the reference rock horizon (Coppersmith et al., 2014).
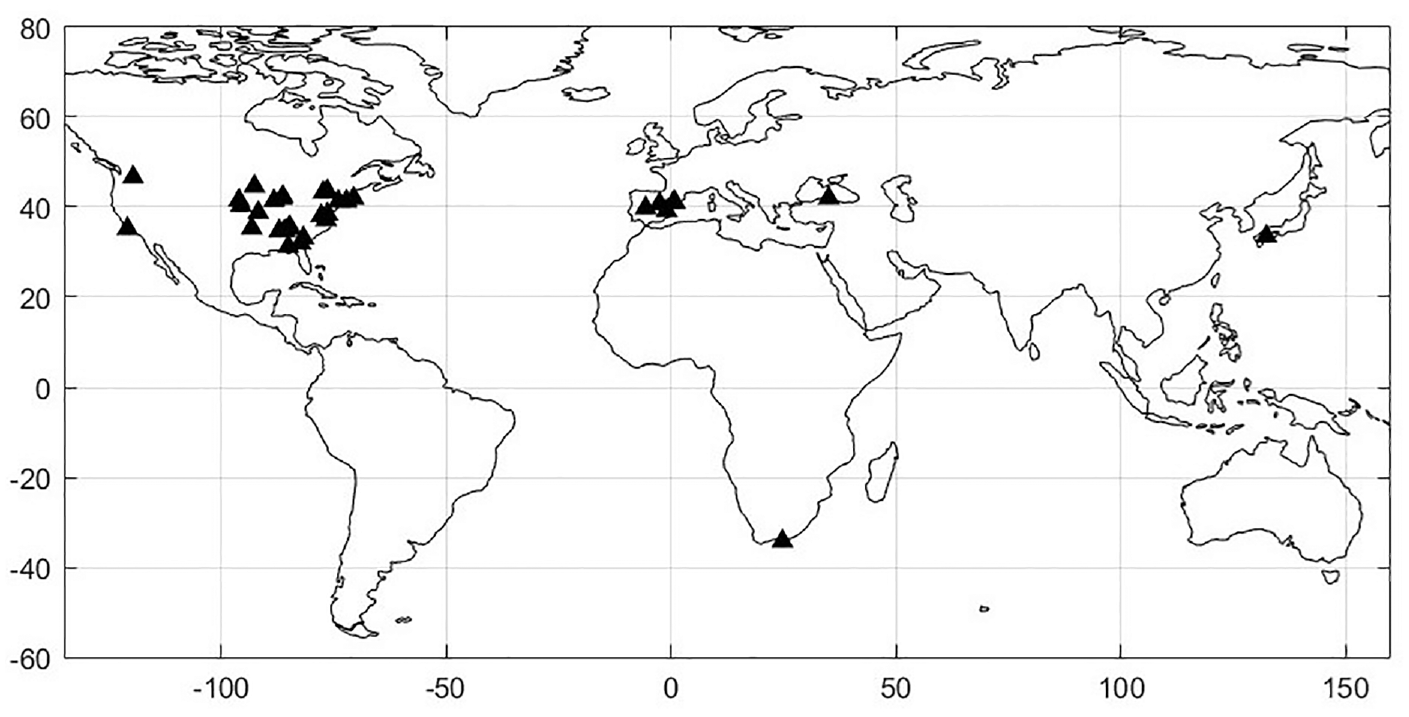
Location of the 33 NPP sites used in this work. The 23 Central and Eastern United States sites are the following: Arkansas Nuclear One Unit 2, Bellefonte Nuclear Plant, Browns Ferry Nuclear Plant, Callaway Energy Center, Calvert Cliffs NPP, Cook Nuclear Plant, Cooper Nuclear Plant, Dresden Nuclear Power Station, E.I. Hatch Nuclear Plant, Forth Calhoun Station, Indiana Point Unit No. 3, J.M. Farley Nuclear Plant, Millstone Power Station, North Anna Power Station, Palisades Nuclear Plant, Pilgrim Nuclear Power Station, Prairie Island Nuclear Generating Plant, R.E. Gina NPP, Sequoyah Nuclear Plant, Surry Power Station, Vogtle Electric Generating Plant, and Watts Bar Nuclear Plant. NPP: nuclear power plant.
The CEUS is a low-to-moderate seismic activity area, with few active faults but with three major historical earthquakes (magnitude: 7 to 7.7), which occurred near the town of New Madrid in 1811–1812 (e.g. Hough et al., 2000), and a large earthquake (magnitude: 7) that occurred in 1886, the Charleston earthquake (e.g. Rasanen and Maurer, 2023). The seismic hazard for the 23 CEUS sites has been recently updated as a final outcome of the Generic Issue 199 (GI-199), initiated by the US-NRC in 2005 (US-NRC, 2010) and subsumed within the post-Fukushima activities requested by the US-NRC to the US NPPs. New seismic ground motion hazard curves were developed for CEUS NPP sites based on a common seismic source model (US-NRC, 2012), developed using the SSHAC Level 3 protocol, and on a common ground motion prediction model (EPRI, 2004), developed using the SSHAC Level 3 protocol, and updated and reviewed using the SSHAC Level 2 protocol (EPRI, 2006, 2012). Note that a SSHAC Level 2 review of a SSHAC Level 3 study maintains the conceptual framework of the SSHAC Level 3 study (Salomone et al., 2013). The seismic source model and the ground motion prediction model were integrated with the consideration of site effects in a site-specific PSHA for each NPP site (EPRI, 2013). The publicly available reports for the 23 CEUS sites considered in this work can be retrieved from the US-NRC website. They contain the updated mean and fractile seismic hazard curves in terms of AFE, for seven spectral frequencies (100, 25, 10, 5, 2.5, 1.0, and 0.5 Hz) and for different spectral accelerations (0.005 thru 10 g).
It should be said that site effects in the CEUS sites included in the present work were assessed using the guidance in Appendix B of the Screening, Prioritization and Implementation Details (SPID) document (EPRI, 2013), which takes into account the uncertainty in the parameters for site response analysis as a function of the characteristics of the particular site and the amount of available information. However, this is not a site-specific SSHAC Level 3 characterization of site effects. Recent research shows that epistemic uncertainty about site effects can be significant, and it may warrant a site-specific SSHAC Level 3 characterization (US-NRC, 2021).
The other sites in the United States are the Hanford and Diablo Canyon sites. Hanford site is located east of the region tectonically dominated by the Cascadia subduction zone, in the Western United States (Figure 3). For this site, a report presenting the results of a PSHA conducted using the SSHAC Level 3 protocol is publicly available (Coppersmith et al., 2014). In this case, the PSHA study was motivated by a requirement to update the previous seismic hazard assessment. The report provides hazard results at five locations within the Hanford Site (A thru E). Results are provided in terms of seismic hazard curves at the reference rock horizon, showing the mean total hazard, and uniform hazard response spectra for the mean hazard, and the 5%, 16%, 50%, 84%, and 95% hazard fractiles, for 20 spectral frequencies, at different AFEs (10−2, 10−3, 5 × 10⁻⁴, 10−4, 5 × 10⁻⁵, 10−5, 10−6, and 10−7 yr−1). In this work, we used only results for the location designated as Site A in the report.
Diablo Canyon site is situated along the central coast of California, approximately 19 km to the west of San Luis Obispo, California. The geographical area surrounding Diablo Canyon NPP falls within the expansive boundary between the Pacific and North American tectonic plates. The primary movement between these plates is primarily managed by the San Andreas fault zone, a right-lateral strike-slip fault system. In addition, there are other faults and folds in the coastal and offshore regions near the facility that also contribute to the deformation at the plate boundary. In terms of historical seismic activity in the site vicinity, the area has experienced earthquakes of varying magnitudes, ranging from moderate to large. The highest recorded ground motion at the site resulted from the 2003 San Simeon earthquake, which had a moment magnitude of 6.5. Similar to the CEUS sites, the seismic hazard for Diablo Canyon has been updated as a final outcome of GI-199. The publicly available data can be retrieved from the US-NRC website. They contain the updated mean and fractile seismic hazard curves in terms of AFE, for seven spectral frequencies (100, 20, 10, 5, 2.5, 1.0, and 0.5 Hz) and for different spectral accelerations (0.02 thru 5 g).
Assessing ground motion seismic hazard using the SSHAC Level 3 protocol is not a regulatory requirement for Japanese NPPs. However, in 2016 the Shikoku Electric Power Company (EPCO) began, and successfully concluded 4 years later, the first implementation of the SSHAC Level 3 protocol in Japan, which corresponds to Ikata NPP (Sakai et al., 2022; Shikoku EPCO, 2020). Ikata NPP site is located in the northwestern part of Shikoku Island (Figure 3), close to one of the longest active fault systems in Japan, the Median Tectonic Line, and to the subduction zone called Nakai Trough, where the maximum historical earthquake is about magnitude of 8.7. The site is a very hard rock site, with shear wave velocity (Vs) of 2600 m/s, and there is a deep seismometer installed at the site to evaluate site effects. The final report of the SSHAC Level 3 study (Shikoku EPCO, 2020) contains seismic hazard curves for eight spectral frequencies (50.0, 11.1, 7.7, 4.0, 1.7, 1.0, 0.5, and 0.2 Hz) and uniform hazard spectra for the mean hazard, and for the 5%, 16%, 50%, 84%, and 95% hazard fractiles, at different AFEs (10−3, 10−4, 10−5, and 10−6 yr−1).
In Spain, reassessment of seismic hazard at NPP sites was included in the post-Fukushima National Action Plan, addressing a recommendation made during the peer review of the results of the so-called European Stress Tests. As in other European countries, the Stress Tests were carried out in Spain after the Fukushima accident, following Western European Nuclear Regolatory Association (WENRA)–ENSREG specification (European Nuclear Safety Regulators Group (ENSREG), 2011). Reassessment of seismic hazard was performed between 2015 and 2022 using a SSHAC Level 3 protocol. The seismic source model and the ground motion model were common to all sites, whereas site effects were assessed separately for each site. Hazard results are not yet publicly available, but the mean/median ratios used in the present work were provided to the authors. NPP sites in Spain are located in a stable continental region. In general terms, seismic ground motion hazard at these sites is governed by crustal earthquakes with magnitudes between 6 and 7.
Due to the increasing energy demands from South Africa’s growing population, there are plans for the construction of several new NPPs. In this context, a PSHA following the SSHAC Level 3 protocol was conducted for a potential NPP site located at Thyspunt, on the coast of South Africa (Figure 3). The Thyspunt site is located within a stable continental region, the Cape Fold Belt, where seismic activity tends to be scattered and marked by the infrequency of significant earthquakes. Thyspunt is a hard rock site, with a Vs30 parameter of 1680 m/s in the average profile. The area is characterized by a low seismic activity and minimal strain rates, as deduced from the examination of global positioning system (GPS) data. A report presenting the mean hazard results of a PSHA conducted using the SSHAC Level 3 protocol is publicly available (Bommer et al., 2015). The median hazard results were provided by the sponsor of the PSHA, Eskom, and the mean/median ratios used in this work have been computed by the authors.
The seismic hazard assessment for the Sinop NPP site was carried out in support of the technical feasibility study required to take an informed decision regarding the investment for the project (Martin et al., 2018). As part of the feasibility study, a PSHA following the SSHAC Level 3 protocol for seismic source characterization (SSC) and following an enhanced SSHAC Level 2 protocol for the ground motion characterization (GMC) was conducted. The Sinop NPP site is located in a geologically complex and seismically active region. Sinop is situated on the coast of the Black Sea, in northern Turkey, one of the most seismically active countries in the world due to its proximity to several tectonic fault lines, including the well-known Northern Anatolian Fault. Particularly, the Sinop NPP is relatively close to the Northern Black Sea Fault, and this region has experienced significant earthquakes throughout history. Hazard results are not yet publicly available, but the mean/median ratios used in the present work were provided directly by the experts involved in this project (for seven spectral frequencies and two AFEs, 10−4 and 10−5 yr−1).
Figure 4 shows the median and mean hazard curves, only for two spectral frequencies (i.e. 5 and 100 Hz, Figure 4a and b, respectively) gathered for this work. For the 23 CEUS sites, only the minimum and maximum hazard curves are displayed. The remaining 21 sites are enveloped by the range defined by the two limit sites. Figure 4 shows the wide range of spectral acceleration and curve slopes, covered by the hazard curves considered in this article. In total, we gathered 161 mean and 161 median hazard curves for the CEUS sites (23 sites × 7 spectral frequencies), 7 mean and 7 median hazard curves for Hanford (1 site × 7 spectral frequencies), 7 mean and 7 median hazard curves for Diablo Canyon (1 site × 7 spectral frequencies), and 4 mean and 4 median hazard curves for Ikata (1 site × 4 spectral frequencies), making a total of 358 hazard curves.
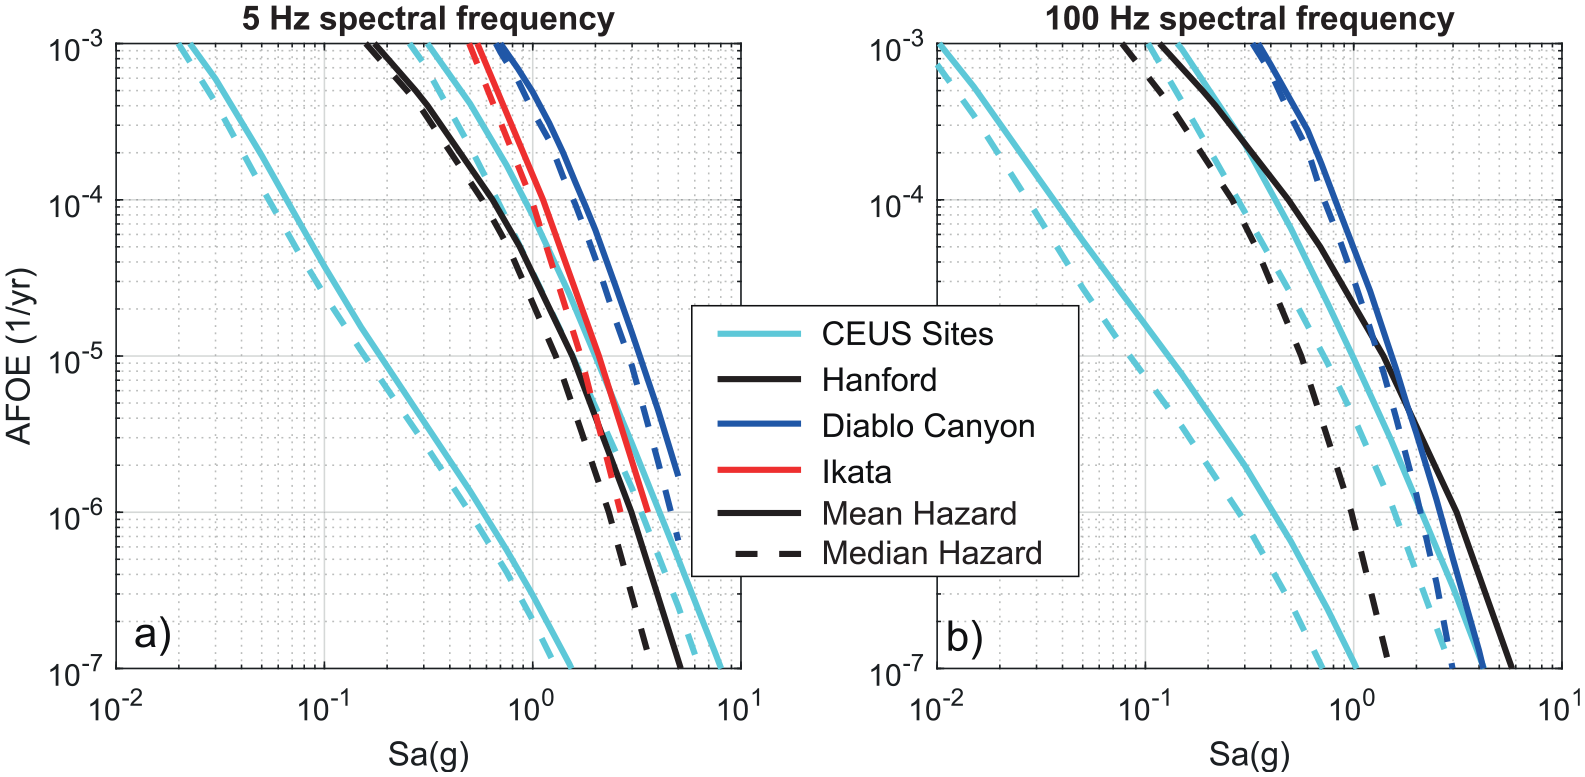
(a) 5 and (b) 100 Hz spectral frequency hazard curves used in this work for CEUS sites, Hanford, Diablo Canyon, and Ikata. Hazard curves for the five nuclear power plant sites in Spain, for Sinop site, and Thyspunt site are not shown because they have not been published. For the CEUS sites, only the two end members are displayed, namely the minimum and the maximum hazard curves among the ones gathered for the 23 sites. The solid curves give the mean hazard whereas the dashed curves represent the median hazard. AFE: annual frequency of exceedance; Sa: spectral acceleration; CEUS: Central and Eastern United States.
Analysis of reported hazard results in SSHAC Level 3 studies
Statistics of mean/median spectral acceleration ratios
Table 1 provides the mean and standard deviation (SD) of the mean/median ratios for the 33 sites within the database of SSHAC Level 3 studies described above, for spectral frequencies of 0.5, 1.0, 2.5, 5, 10, 25, and 100 Hz, and annual frequencies of exceedance of 10−4, 10−5, and 10−6 yr−1. Figure 5 provides a pictorial representation of the ratios obtained for all these sites. The full range of ratios at each spectral frequency can be seen in Figure 5. Table 1 includes the difference between the 85% and 15% percentiles of the computed ratios, as a quantitative measure of those ranges.
Statistics of ratios of mean-to-median spectral acceleration obtained from hazard curves in 33 PSHAs performed following the SSHAC Level 3 protocol
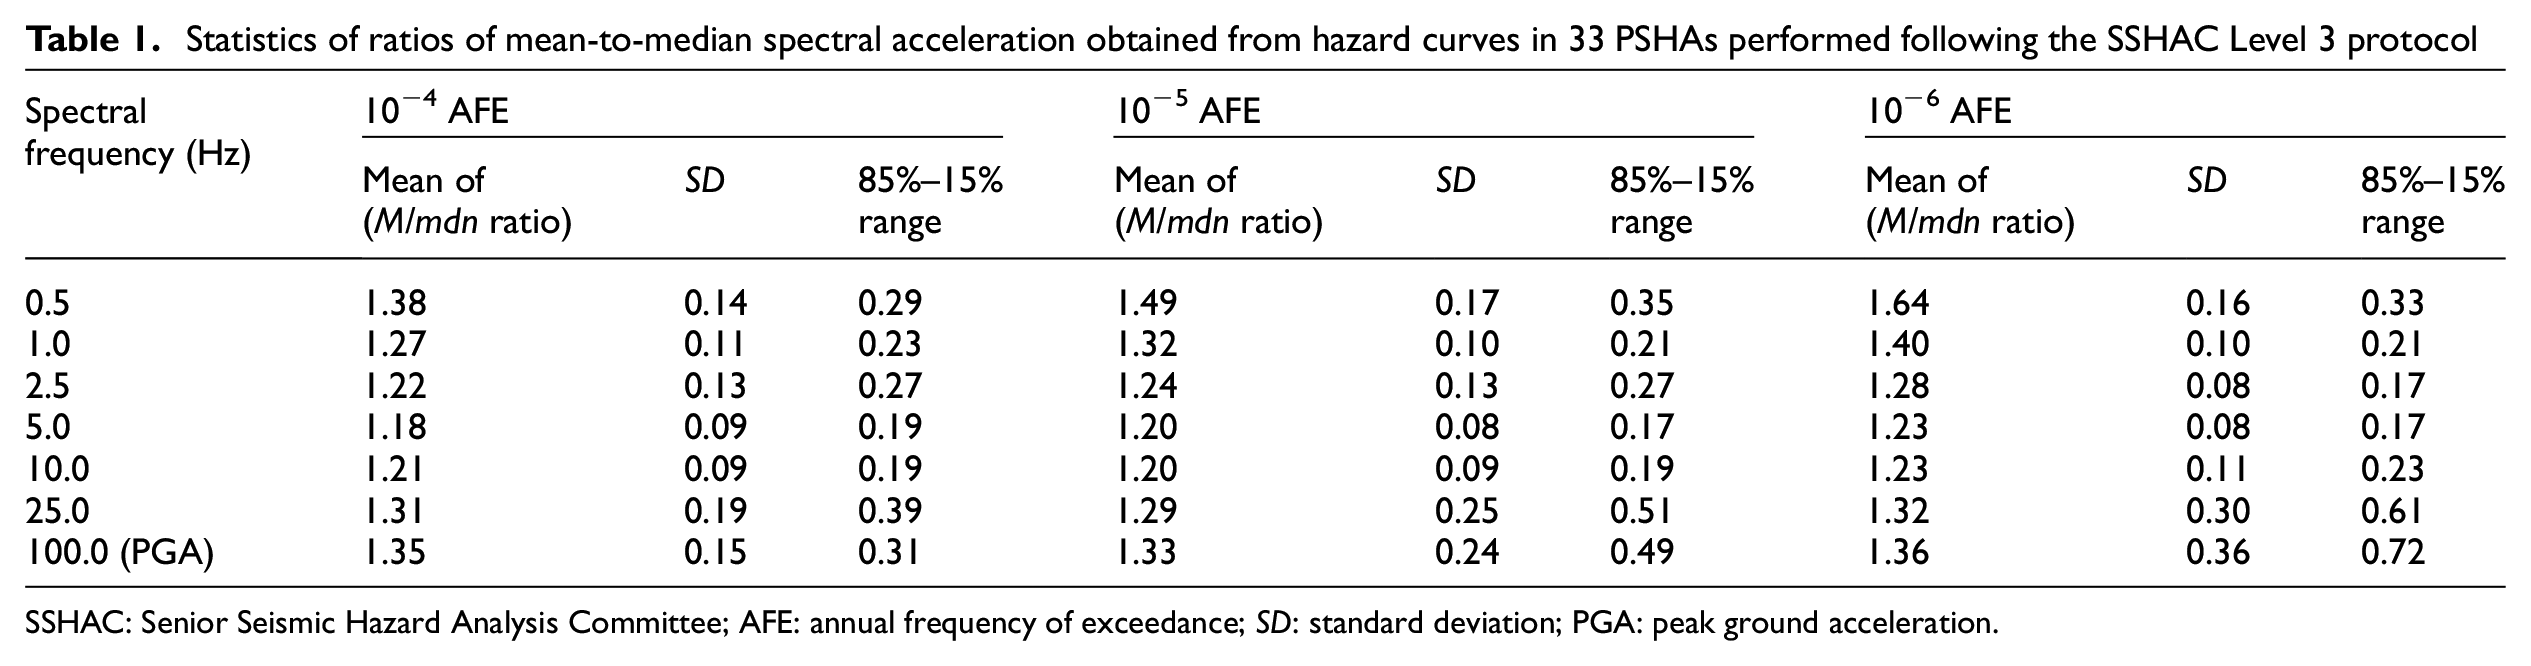
SSHAC: Senior Seismic Hazard Analysis Committee; AFE: annual frequency of exceedance; SD: standard deviation; PGA: peak ground acceleration.
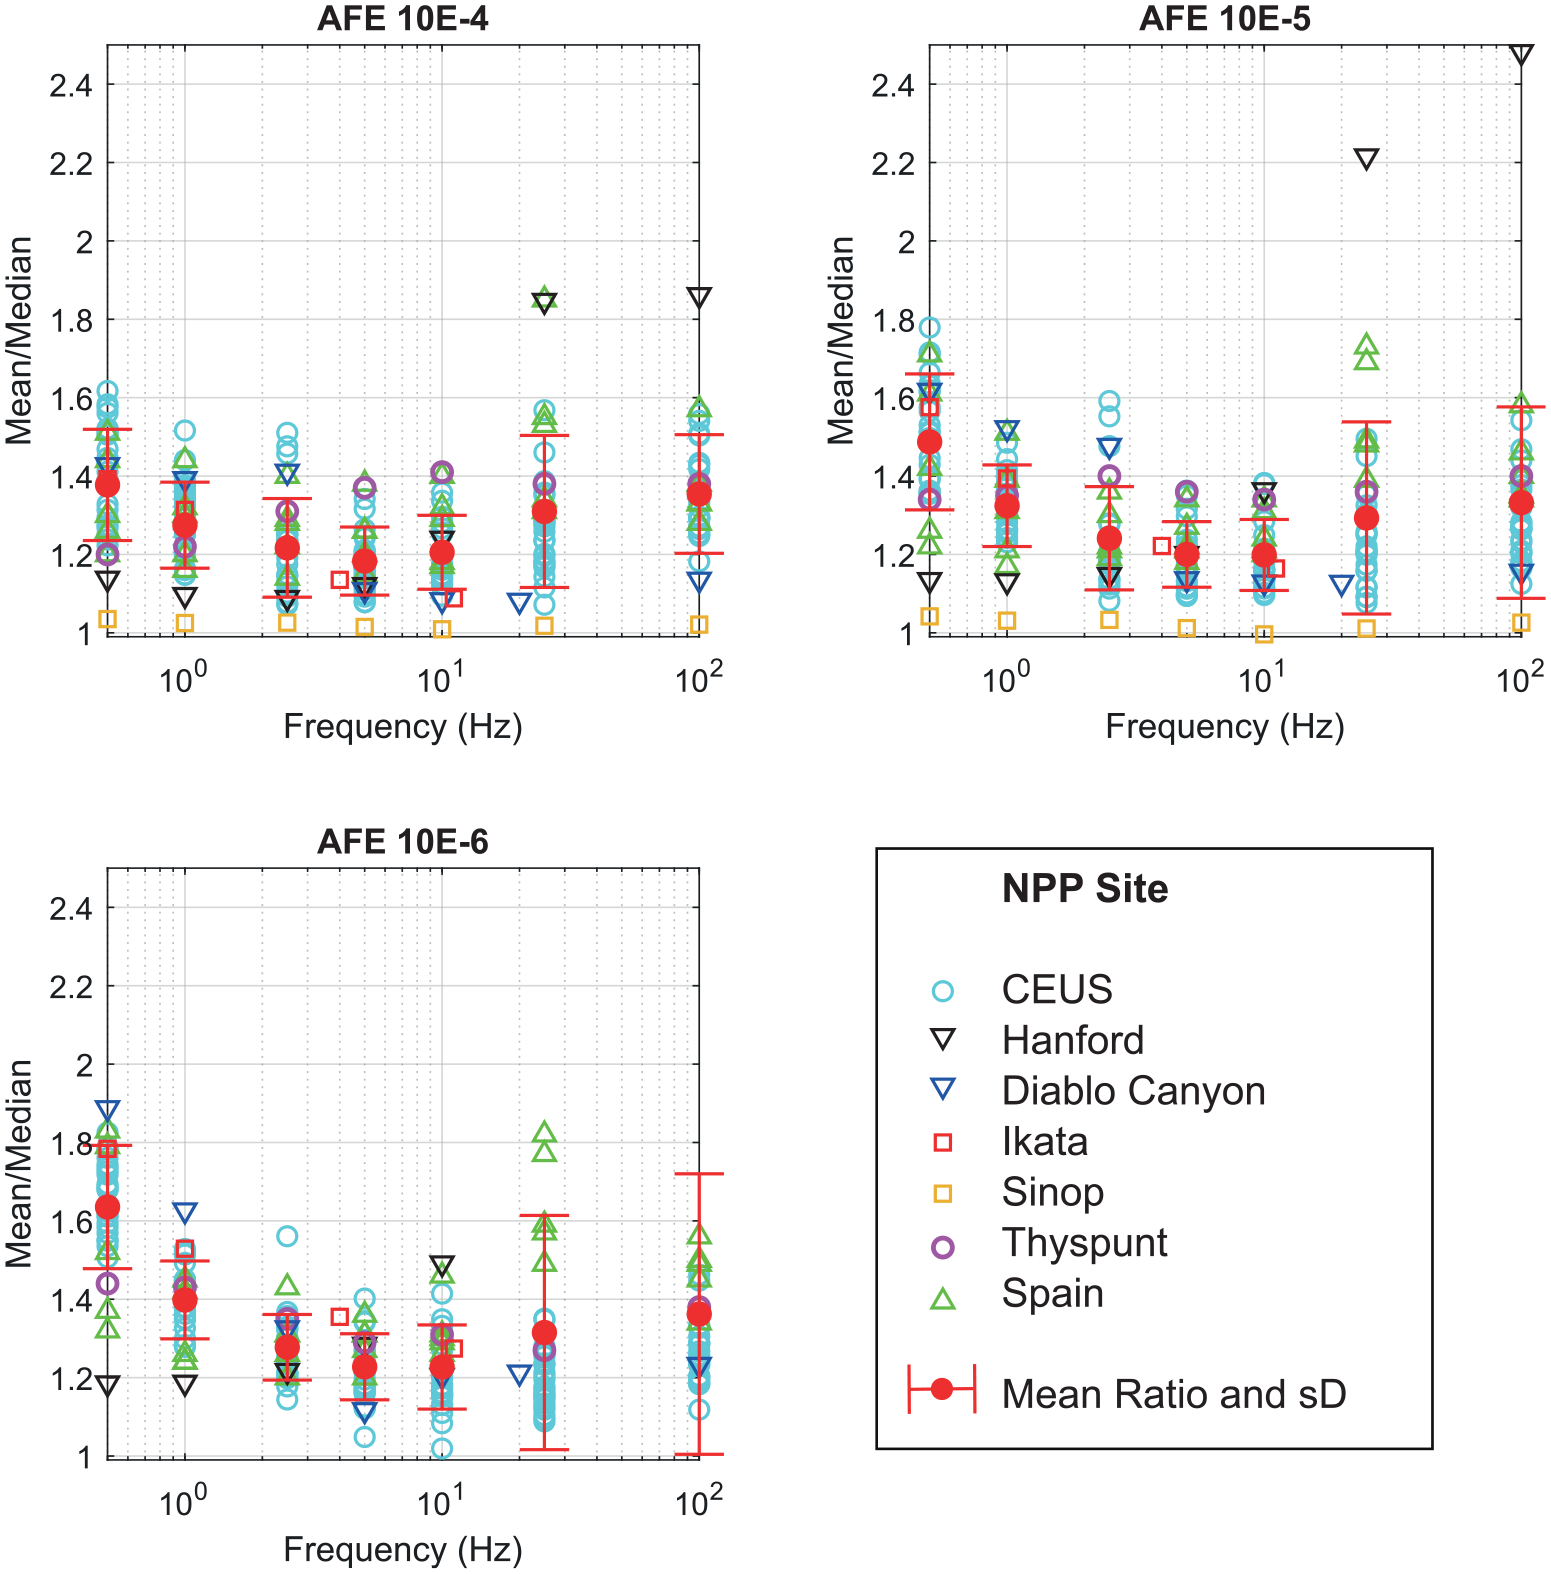
Mean-to-median spectral acceleration ratios in the seismic hazard results from 33 SSHAC Level 3 studies and for three AFE (10−4, 10−5 and 10−6 yr−1). Solid red dots mark mean values of the ratios. Red error bars define the range of mean +/− one standard deviation. For Hanford site, ratios at 10−6 AFE for 25 and 100 Hz are 2.6 and 3.2, respectively.
Discussion
It is clear that the database of sites with available Level 3 PSHA results needs to be expanded as much as possible, to improve statistical significance. This is not an easy task in practice, due to confidentiality of the results and to the difficulties in finding the right contact person for each study. However, the ratios obtained from 33 sites and reported in Table 1 and Figure 5 cover a wide range of seismological and geological conditions, in four continents. Therefore, we consider that these results start being indicative of what may be expected, in terms of the selected metric of epistemic uncertainty, according with today’s state of practice.
For each AFE, ratios in different sites are within a relatively narrow interval, especially for the spectral frequency band between 2.5 and 10 Hz, which is the band usually more relevant for the seismic design of nuclear installations. In this band, for 10−4 yr−1 AFE, a mean/median ratio of 1.40 would envelop practically all investigated sites. For spectral frequencies of 25 and 100 Hz, a slightly larger factor, in the order of 1.50, is obtained using the mean ratio plus 1 SD. In no case has a ratio larger than 1.90 been obtained for any of the sites at 10−4 yr−1 AFE. In many countries, 10−4 yr−1 AFE is the reference for establishing the design basis earthquake of a regular large NPP. Similar results have been obtained for AFEs equal to 10−5 and 10−6 yr−1 (Table 1 and Figure 5), with the only difference that the SD for spectral frequencies of 25 and 100 Hz at 10−6 AFE is larger due to the large ratio for some sites. Uncertainty in the kappa-0 parameter used in the assessment of site effects (Bard et al., 2020) might have contributed to these larger ratios.
It should be noted that for CEUS sites, the hazard results were obtained using the same SSC and GMC models. The same happens for sites in Spain: they share the same SSC and GMC models. In the framework of the present work, we have not been able to rigorously assess the impact of the potential correlations in the individual site assessments on our statistics of mean/median ratios. However, we believe that, as far as the sites are not very close together and if site conditions are different (shallow and deep soil profiles), then the hazard results will have some degree of statistical independence. Nevertheless, it is clear that hazard results are not independent in the same way as if they came from different SSC and GMC models.
Another point to note is that consideration of site effects is not uniform across the sites included in the database. The available results for Hanford site do not include site effects. In CEUS sites, the available hazard results include site effects and their uncertainty, but they were introduced following a predefined guidance (EPRI, 2013), that is, a site-specific SSHAC Level 3 protocol was not followed for this purpose. For sites in Spain, whose study is the most recent one within the database, a SSHAC Level 3 protocol was followed for the inclusion of site effects at each site. This lack of uniformity in the treatment of site effects is indicative of an evolution of the state of practice in the past 10 years. Modern practice tends to include the development of logic trees for site response characteristics using the SSHAC protocol (Rodriguez-Marek et al., 2021; US-NRC, 2021). For the sake of comparison of the results obtained for different sites, it is reasonable to expect a smaller level of captured uncertainty in Hanford site, since uncertainty in site effects is not included in the hazard results. This is clearly seen in Figure 5 for the Hanford site, at least for the lower frequencies. At high frequencies, a large uncertainty in the reference rock kappa-0 probably dominates and counteracts the effect of hazard curves not including the near-surface site effects.
An additional observation is that, at some sites, hazard estimates seem to carry equal or less uncertainty at 10−5 AFE than at 10−4 AFE. This result is somewhat counterintuitive, but it has already been observed by other researchers (Douglas et al., 2014). A possible explanation for this counterintuitive result is that an uncertain seismic source is dominant for larger AFEs, whereas a better-characterized source is dominant for smaller AFEs (Douglas et al., 2014).
Observations
The previous part of this article presents factual data and results of a statistical analysis. Apart from the completeness and self-consistency of the database, we believe that there is little room for discussion. On the contrary, implications of these results are of a more subjective nature, and it can be subject to controversy. It is far from our intent to place an ideological view on the potential implications or applications of the results. However, we would like to share with the reader some thoughts suggested to us by these results, with the aim of fostering further research on the subject.
Range of uncertainty
The results presented in the previous section define a range of mean-to-median ratios derived from a sample of SSHAC Level 3 studies. Even though the sites correspond to a wide spectrum of seismotectonic settings (e.g. subduction zone and stable continental region), site conditions, and methodological approaches (e.g. ergodic and nonergodic ground motion prediction model), the computed ratios are within a relatively narrow band, especially at those spectral frequencies more relevant for the seismic design of nuclear installations (i.e. 2.5 to 10 Hz).
Every site is unique and different from others. However, the computed range of mean-to-median ratios defines what could be expected as indicator of epistemic uncertainty following the current state of practice, except for special circumstances.
As pointed out by other authors, if the range of uncertainty of a particular study is much narrower than the uncertainty present in comparable PSHAs, then this fact could be indicative that uncertainties in the input parameters, such as the characterization of seismic sources or ground motion, have not been fully captured (Douglas et al., 2014). In this sense, the statistics presented in the previous sections may be useful as a reference for SSHAC Level 3 practitioners, when identifying and quantifying sources of uncertainty.
On the contrary, note that a small range of epistemic uncertainty (i.e. mean-to-median ratios in the lower range of the statistics presented in the previous section) may also be a direct result of a larger-than-average effort spent in data collection activities. This is an important consideration to be born in mind since, in this case, the reduced uncertainty would actually be indicative of a high-quality study.
Grading of PSHA level for low and medium radiological hazard installations
Site investigations and seismic hazard assessments for a regular commercial NPP can be relatively time- and effort-consuming. This is justified when the radiological risk posed by the nuclear installation is high. Namely, when the consequences of potential accidents in terms of doses to workers and the public are large, there is a need to develop assessments as accurate as possible. However, for low and medium radiological hazard installations, international safety standards allow for a “grading” of the effort (IAEA, 2021, 2022). The idea is that requirements for site investigations and site hazard assessment in place for regular NPPs might be overshooting the effort necessary for achieving the same ultimate safety goals in case of installations which pose smaller radiological risks. Ultimate safety goals are established by the nuclear regulator in terms of annual frequency of exceeding a threshold dose in workers and the public, and they are the same for all kinds of nuclear installations. Within a risk-informed performance-based regulatory framework, the implication is that a less hazardous facility will require a less stringent (seismic) performance to achieve the same ultimate safety goal.
Thus, for low and medium radiological hazard installations, less accurate methods and procedures might be used, as far as the additional uncertainty introduced by the less accurate methods is taken into account, and it does not lead to incompliance with the safety goals set by the nuclear regulator. An effort is now made by the industry toward finding ways of grading site characterization for medium and low radiological hazard facilities. In the case of the level of the SSHAC protocol to be used, see, for instance, the suggestion by Lettis et al. (2022) to use a Level 2 protocol for small modular reactor (SMRs), depending on the design level earthquake used to develop the standard plant design.
Inspired by the work by Cornell (1992) during his investigation of the EPRI-LLNL discrepancies, we have explored the use of the results of mean-to-median ratios in grading the level of the SSHAC protocol for low and medium radiological risk hazard installations.
What happened with the LLNL-EPRI PSHAs suggests that there will be acceptable differences between the median hazard determined using different PSHA levels, for instance, using Level 2 or Level 3 PSHAs. However, differences in mean hazard might be very significant. A Level 2 study might underestimate or overestimate the mean hazard with respect to the more accurate Level 3 study. Mean hazard is the one required to define the design basis earthquake (ASCE, 2019). Hence, a poor estimate of the mean hazard may not be acceptable, especially if it underestimates the hazard.
In grading from Level 3 to Level 2 PSHA, we would be interested in estimating Level 3 mean hazard from the median hazard obtained by the smaller PSHA level, in a way similar to what Cornell (1992) did using the median hazard derived from the LLNL and EPRI studies. Our idea is that, if we assumed that a competent team developing a SSHAC Level 2 PSHA would obtain an acceptable approximation to the median hazard, the statistics of mean-to-median ratios in SSHAC Level 3 studies can be used to develop multiplicative factors to convert the approximate median hazard into a conservative estimate of the mean hazard that would have been obtained with a Level 3 study. The way to develop those multiplicative factors is a matter of additional research. In our view, the particular characteristics of the site, when compared with the sites in the database, will need to be considered. In any case, the idea will need to be tested in a real case for which, for whatever reason, both Level 2 and Level 3 studies are available.
For low-to-moderate seismicity sites, a conservatively biased mean hazard might be acceptable, if the standard plant design of the nuclear installation (e.g. an SMR) has been carried out for a large design earthquake. In contrast, for high seismicity sites, a PSHA at Level 3 will be probably unavoidable, since a conservatively biased mean hazard might exceed the design earthquake of the standard plant design and this would require time-consuming modifications in the standard design (Lettis et al., 2022).
Conclusion
The SSHAC Level 3 protocol is currently the most extended practice to develop a PSHA for a high radiological hazard nuclear installation, and it is probably the best tool we have at hand to perform a PSHA for a critical structure or industrial facility. A key goal of the protocol is to make a good assessment of uncertainty, since the mean hazard, the one normally used to define the design basis earthquakes, may be highly sensitive to uncertainty (Abrahamson and Bommer, 2005).
In this article, the mean-to-median spectral acceleration ratio has been used as a metric of the uncertainty in PSHA results. Results of 33 SSHAC Level 3 studies have been gathered to determine mean-to-median spectral acceleration ratios and the statistics of these ratios as a function of spectral frequency and AFE. Spectral frequencies of 0.5, 1.0, 2.5, 5, 10, 25, and 100 Hz, and annual frequencies of exceedance of 10−4, 10−5, and 10−6 yr−1 have been considered in this exercise.
The database of SSHAC Level 3 studies is as large as we have been able to compile and, unfortunately, there are some studies, known to have been performed, which are missing. In addition, since the database gathers results of PSHAs carried out in the past 10 years, the practice of assessment of uncertainties in site effects has evolved. As a consequence, the studies included in the database are not completely consistent in this respect.
Results of a statistical analysis show that, for each AFE, ratios corresponding to different sites are within a relatively small interval, especially for the spectral frequency band between 2.5 and 10 Hz, which is the band normally more relevant for the seismic design of nuclear installations. In this band, for 10−4 yr−1 AFE, a mean/median ratio of 1.40 would envelop practically all investigated sites.
The 33 sites included in the database cover a wide range of seismological and geological conditions, in four continents. Therefore, despite the database-related drawbacks pointed out above, we consider that the results of the statistical analysis start being indicative of the range of uncertainty typically found in this kind of studies, according with today’s state of practice.
Footnotes
Acknowledgements
The comments and suggestions to the first version of this article by the Associate Editor, Dr. Julian Bommer, and another anonymous reviewer are very much appreciated. The deep insights provided by the reviewers have greatly contributed to the improvement of the article. The support of the sponsors of the SSHAC Level 3 studies in providing results that are not publicly available are gratefully acknowledged. Particularly, we would like to thank Eskom, in South Africa, and Foro Nuclear, in Spain.
Data and resources
Hazard curves used in this study are published and freely available for all sites except for the sites located in Spain, Turkey, and South Africa. The reports for the CEUS sites and Diablo Canyon site can be downloaded from the US-NRC website (![]() ), and the reports for Hanford and Ikata are listed in the References. The mean and median hazard curves for the five Spanish sites and for the South African and Turkish sites are not yet published. In these cases, the mean/median ratios have been provided to the authors of this article, with the support of experts who participated in Thyspunt and Sinop studies.
), and the reports for Hanford and Ikata are listed in the References. The mean and median hazard curves for the five Spanish sites and for the South African and Turkish sites are not yet published. In these cases, the mean/median ratios have been provided to the authors of this article, with the support of experts who participated in Thyspunt and Sinop studies.
The authors would have liked to expand the database of sites with the mean-to-median ratios corresponding to other SSHAC Level 3 studies, which are known to have been carried out in Asia, North America, and the Middle East. However, even though mean-to-median ratios do not reveal absolute hazard levels, the authors were not able to access the data.
Declaration of Conflicting Interests
The author(s) declared no potential conflicts of interest with respect to the research, authorship, and/or publication of this article.
Funding
The author(s) received no financial support for the research, authorship, and/or publication of this article.