
Abstract
We explore a novel acquisition geometry that can be used to estimate the linear component of site amplification using a dense nodal seismic network installed in Yangon, Myanmar’s largest city. The city is surrounded by several seismically active faults, including the Sagaing Fault, which is capable of generating Mw > 7.0 earthquakes. As part of the Irrawaddy delta system, this densely populated city sits on young water-saturated alluvium that is likely to amplify earthquake ground motions. Assessing site response is crucial for understanding the seismic hazard potential to minimize the loss of property and lives. Using a dense seismic array comprised of 110 three-component nodes, we estimated the frequency-dependent site amplification pattern of Yangon from regional (Lg) and local (Sg) seismic phases. Since this acquisition geometry is not sensitive to Q or geometric spreading, this approach provides a fast and cost-effective way to estimate the linear component of site response as a function of frequency. Our Lg and Sg site response results identify regions with high site amplification that have significantly greater seismic hazard risks for regional and local distance earthquakes. We observed consistent site response characteristics between both Lg and Sg phases. Site amplification patterns correlate well with the surficial geology and subsurface structure beneath the city. De-amplification is observed across all frequencies at stations located above an anticlinal structure composed of older Pliocene rocks (i.e. the Irrawaddy Formation). Conversely, highly amplified areas correspond to younger Pleistocene to recent alluvial plains consisting of loose, unconsolidated alluvium. We found a dominant horizontal-to-vertical spectral ratio (HVSR) peak at ∼1.0 Hz from ambient noise, likely corresponding to the thickness of unconsolidated sediments. We suggest that the growing number of nodal networks worldwide can be used to estimate frequency-dependent site amplification, addressing key data gaps in seismic hazard assessment.
Keywords
Introduction
Yangon is the largest city in Myanmar, with a population of over 5.7 million and an international port handling > 90% of the country’s exports and imports (Yangon Ports, 2025). The city is constantly expanding to accommodate an increasing population, which has doubled in the last 40 years and is vulnerable to multiple geohazards such as cyclones and earthquakes (Heinkel et al., 2022). Located within the Irrawaddy delta basin, this densely populated city sits on young water-saturated alluvium (Giosan et al., 2018; Kravtsova et al., 2009) that can significantly amplify earthquake ground motions (Ergin et al., 2004; Hough et al., 2002). Tectonically, it is situated on the southern tip of the Bago anticlinal ridge and surrounded by several seismically active faults (Figure 1) including the Sagaing Fault (Aung, 2011). The ∼1200 km long, strike-slip Sagaing Fault located just 40 km from the city center has historically produced Mw > 7.0 earthquakes (Hurukawa and Maung, 2011). Repeated earthquakes in 1927, 1930, and 1978 along the Sagaing Fault caused considerable damage to buildings and loss of life in the Yangon region (Thein et al., 2009). The recent Mw 7.7 earthquake on 28 March 2025 ruptured the northern section of the Sagaing Fault, causing significant damage in major cities such as Mandalay and Naypyidaw, demonstrating the importance of earthquake hazard assessment in this region. In the west, active subduction of the India plate has the potential to generate megathrust earthquakes of Mw > 8.0 (Steckler et al., 2016). Although the potential epicenters of subduction zone earthquakes are relatively far (over 250 km), large magnitude megathrust earthquakes like the ∼Mw 8.5 1762 Arakan earthquake (Cummins, 2007; Wang et al., 2013) can have devastating effects even at regional distances due to the high amplitude and frequency of the regional Lg phase. In addition, notable earthquakes in this region are correlated to other lesser-known faults or associated with underlying blind faults (Aung, 2011; Thant, 2014). Several probabilistic seismic hazard models indicate the peak ground acceleration (PGA) of Yangon and its surroundings can reach up to 0.5 g (Somsa-Ard and Pailoplee, 2013; Thant, 2014; Yang et al., 2023), suggesting a significant seismic risk to buildings and infrastructure. Moreover, reclaimed land makes up most of the city where the liquefaction risk is noted to be extremely significant (Htet et al., 2018; Tint et al., 2018). Assessing site response at a high spatial resolution is important for understanding the seismic hazard and potential risks to critical infrastructure. Such information can be used to minimize the loss of life and property. This study aims to estimate site amplification variability from local and regional seismic phases using a dense nodal seismic network deployed in Yangon city.
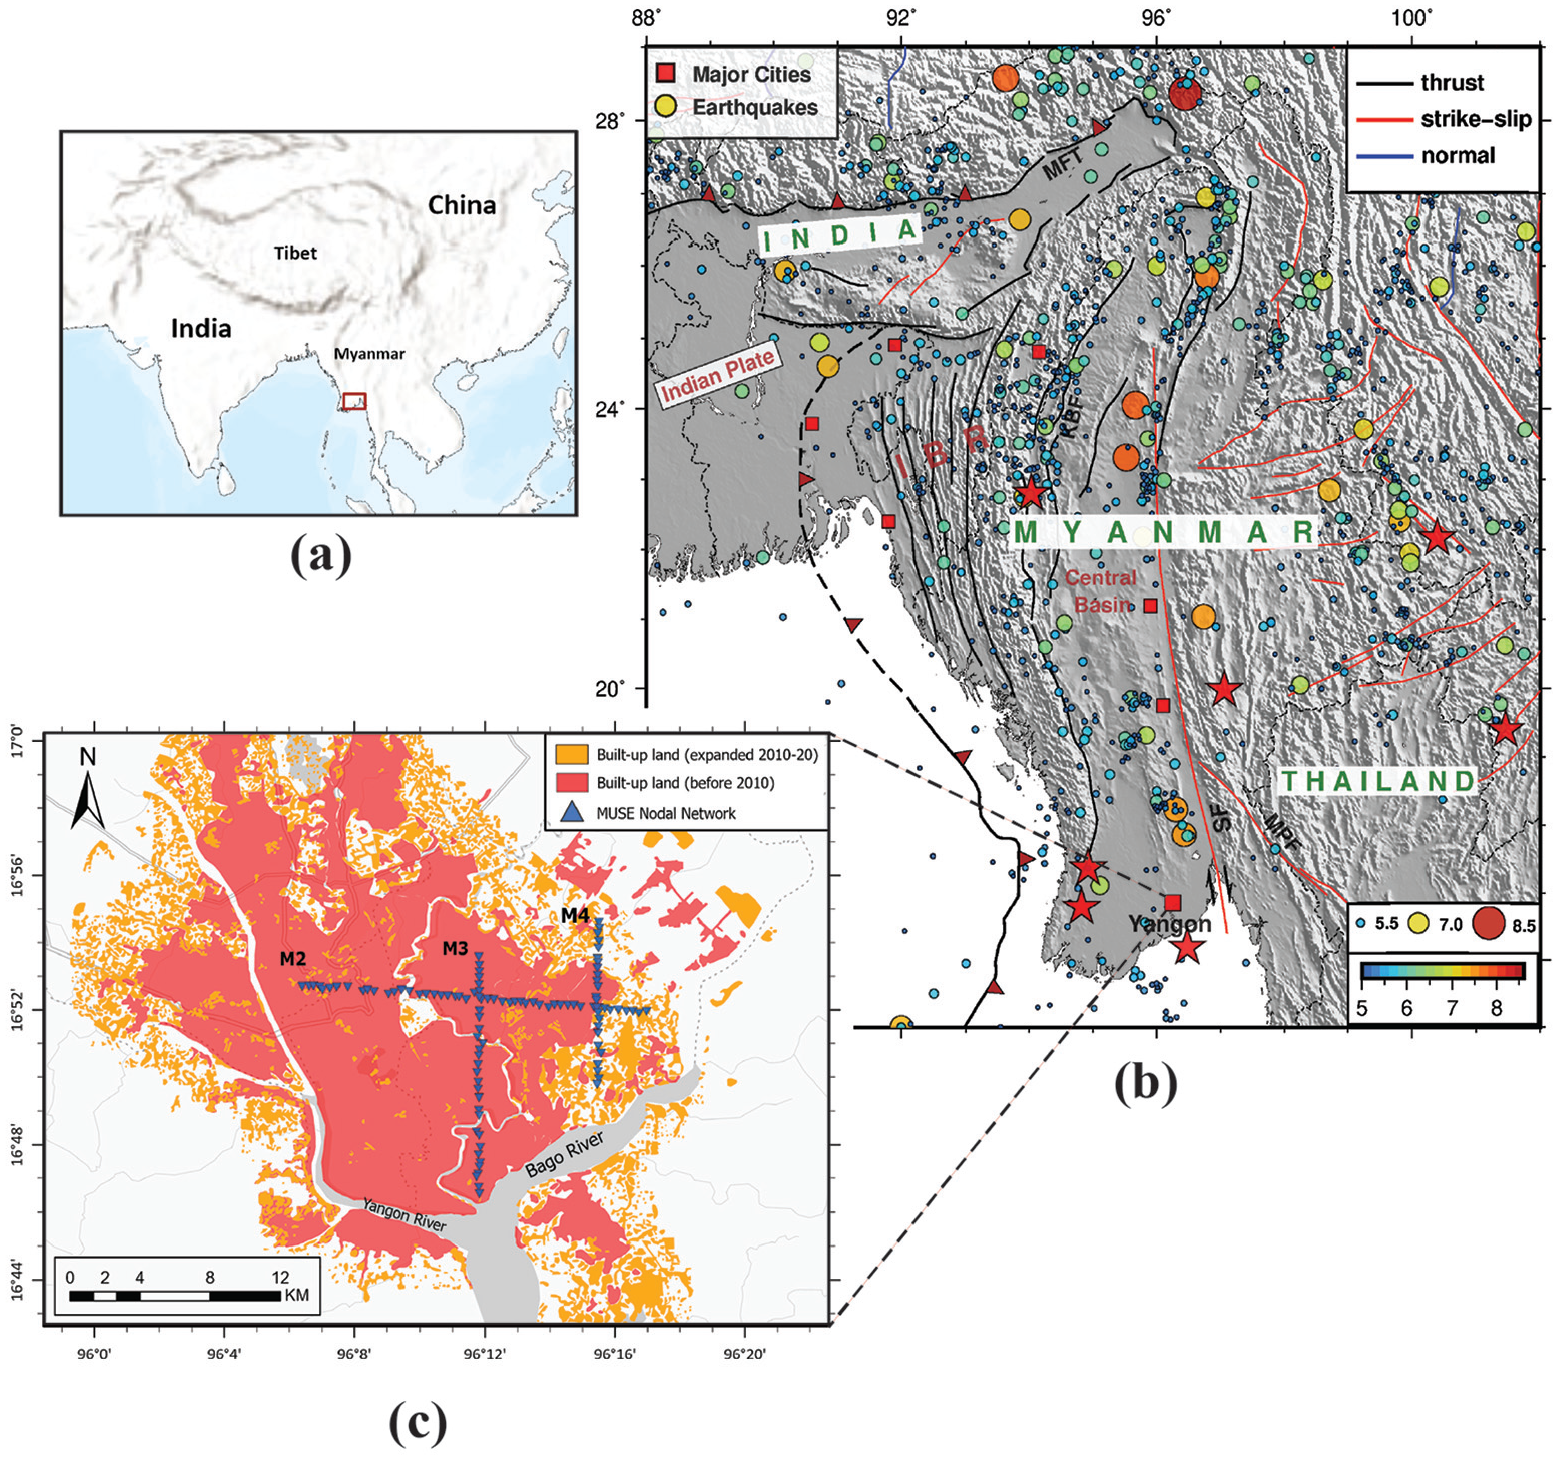
(a) Location of the study area; (b) seismotectonic map of Yangon and surroundings showing the major faults and seismicity of the study area. Earthquakes from 1901 to 2024 with magnitudes greater than 5.0, taken from the ISC catalog (International Seismological Centre, 2024), are shown here, color-coded and scaled by magnitude. Red stars show the local and regional earthquakes used in this study. IBR: Indo-Burman Ranges; KBF: Kabaw Fault; MFT: Main Frontal Thrust; MPF: Mae Ping Fault; SF: Sagaing Fault; (c) MUSE nodal seismic network and urban development of Yangon city (modified from Fan et al., 2022).
When seismic waves propagate from the source to a specific site, they often encounter near-surface geologic materials that can significantly amplify high-frequency ground motions. Site response is defined as the near-surface effects on seismic waves that can alter the amplitude, duration, and frequency content of the original ground motion (Kaklamanos et al., 2021). It plays a key role in controlling the spatial distribution of structural damage in earthquake-prone regions (Boore, 2003). Variations of site response over a short distance have been observed in past earthquakes (Kramer, 1996), such as the 1985 Mw 8.0 Mexico City earthquake (Mexico) and the 1989 Mw 6.9 Loma Prieta earthquake (CA, USA). In general, the local site amplification observed during an earthquake is the result of the high impedance contrast and lateral heterogeneity of the unconsolidated sediments (Fischer et al., 1995; Pratt et al., 2017; Shearer and Orcutt, 1987), basin effects (Field, 1996; Frankel et al., 2002), and the nonlinear behavior of rocks at high strain (Frankel et al., 2002; Riga et al., 2018). We also observed frequency-dependent site amplification due to resonance effects in near-surface layers (Boore and Joyner, 1997; Koyanagi et al., 1992). Amplification factor of up to several orders of magnitude have been observed in sedimentary basins around the world, primarily due to the presence of unconsolidated rocks and complex basin structures (Pratt et al., 2003; Wirth et al., 2019). Considerable efforts have been dedicated to accurately characterize basin structure in urban settings by producing high-resolution seismic velocity, seismic attenuation, and basin depth models (Ghose et al., 2023; Jiang and Denolle, 2022; Li et al., 2023b; Nardoni and Persaud, 2024; Villa et al., 2023). To estimate seismic hazard and risks at the city scale and design earthquake-resistant infrastructure, it is also necessary to assess the fine-scale local variations in site amplification. Dense nodal arrays are being increasingly used to image sedimentary basins and velocity structures around the world. It also offers a unique data set that we have utilized to investigate variations in site amplification using weak-motion data.
One of the key sources of uncertainty in seismic hazard models is the estimation of site response, which remains challenging to evaluate over a wide frequency range (Manea et al., 2024) and over small spatial scales. Site-specific detailed investigation of geotechnical properties of the local soil is typically conducted for any engineering construction project. Often, shear-wave velocity profiles are obtained to calculate the average shear-wave velocity over the top 30 m (Vs30). This information is then used to develop predictive models of site-specific amplification; however, many applications require estimating locally amplified ground motions across a region, especially for seismic hazard micro-zonation mapping. Seismic micro-zonation studies are widely acknowledged as an essential component in the development of seismic risk mitigation strategies in a specific region (Crespellani, 2014; Liam Finn et al., 2004; Moscatelli et al., 2020). A key aspect of a micro-zonation study is the development of accurate subsoil models, which play a dominant role in governing site response. In areas lacking a 3D or 2D subsurface model, such as Yangon, site conditions are usually inferred from Vs30 proxies (Heath et al., 2020; Wald and Allen, 2007) and incorporated into ground motion models (GMMs). Many studies have been carried out to calibrate the Vs30 models inferred from topography or geological proxies (McNamara et al., 2014; Thompson and Wald, 2016).
The standard spectral ratio (SSR) approach is one of the most popular and reliable methods of evaluating amplification (Bonilla et al., 1997; Borcherdt, 1970). SSR is the ratio of earthquake spectra recorded at a given site and a reference site, commonly located on a hard rock outcrop where site effects are negligible. However, it is expensive and challenging to deploy dense seismic networks for a long period of time to access the site effects at small scales (Manea et al., 2024). To address these challenges, methods relying on ambient noise measurements were developed. Ambient noise-based methods are usually a fast, easy, and inexpensive way to estimate site response compared to the earthquake-based alternatives. Methods like horizontal-to-vertical spectral ratio (HVSR) (Nakamura, 1989) and noise-based spectral ratio (Kagami et al., 1982) have been popular in the past two decades to estimate site response as well as the fundamental resonance frequency. However, the assumption of identical vertical and horizontal components at the sediment-bedrock interface and the Rayleigh wave nature of the micro-tremor wave field are debatable (Mucciarelli and Gallipoli, 2001). The physical meaning of HVSR amplitudes is not clear and does not directly represent the real site amplification; rather, it is likely a function of the near-surface shear-wave velocity (Haghshenas et al., 2008; Kawase, 2003; Kawase et al., 2019; Pratt and Brocher, 2006). Perron et al. (2018) introduced a hybrid SSR approach to estimate empirical site amplification using both traditional SSR and ambient noise spectral ratios. The applicability of this approach in estimating empirical site amplification has been validated in various sedimentary basins (Janusz et al., 2022; Manea et al., 2024; Perron et al., 2022). However, in urban areas with low seismic activity, the effectiveness of this method is constrained by the limited availability of earthquake recordings, as the data sets are predominantly influenced by noise-based SSR (Janusz et al., 2022). Kawase et al. (2019) proposed a double empirical approach, utilizing the systematic difference between traditional micro-tremor HVSR and weak-motion HVSR under the diffuse wave concept to estimate true site amplification. Successful applications of this method require a decent amount of weak-motion recording, which sometimes is not available in places like Yangon.
In this study, we employed a new approach to estimate frequency-dependent site amplification using a dense nodal network. With the recent introduction of nodal seismometers, it has become feasible to deploy dense networks consisting of hundreds of nodes. Our definition of dense is a sensor spacing of 500 m or less. Deployment of a large number of nodes allows us to record the amplitude change over small distances (<500 m). Leveraging the dense nodal array deployed in Yangon, we have estimated the site amplification using local and regional seismic phases. Accounting for quality factor (Q), this direct approach provides a quick and easy way to estimate the linear component of site response with very few assumptions. Furthermore, we can explore site amplification for both regional and local seismic phases to see if there are any systematic differences due to differences in propagation characteristics.
Data and methods
Data
We utilized a nodal seismic network deployed in Yangon as a part of the Myanmar Universities Seismic Experiment (MUSE) project (Persaud et al., 2021). The seismic array consists of three-component Fairfield ZL and 3C nodal seismometers, deployed along three densely spaced seismic profiles (Figure1c). The nodes are battery-powered, short-period (corner frequency of 5 Hz) seismometers with a recording duration of ∼35 days. Their small size, low cost, and ease of installation make the nodes perfect for urban settings. A total of 110 nodes were deployed in the period of March to April 2020 along the M2, M3, and M4 profiles (Figure 1c). The array design and installation were based on a previous urban seismic experiment in the Los Angeles metropolitan area that aimed to fill a data gap in seismic hazard studies by leveraging short-period instruments to provide dense seismic recordings and high-resolution images of the sedimentary basin using passive seismic methods that rely on relatively low-frequency (<4 Hz) recordings (Clayton et al., 2019; Liu et al., 2018). The Los Angeles Basin Amplification Seismic Investigation (BASIN) experiment was comprised of four 1-month-long field experiments that occurred between January 2017 and December 2019 with a total of 758 nodes installed along ten dense linear arrays. These efforts were followed by other volunteer-led urban seismic experiments such as the San Fernando Valley, California nodal array (Juárez-Zúñiga and Persaud, 2025; Persaud et al., 2024). With a station spacing of ∼400 m, local and regional events recorded by the MUSE array present an ideal high-resolution data set for assessing variation in ground motions over small distances.
Several studies have shown that the performance of nodal seismometers is similar to the traditional broadband seismometer in the ∼1–5 Hz frequency range and are suitable for passive seismic studies in urbanized areas where broadband stations are sparse (Ghose et al., 2023; Juárez-Zúñiga and Persaud, 2025; Liu et al., 2018; Wang et al., 2021). Liu et al. (2018) showed that recordings from the BASIN nodes were comparable to those from broadband stations in terms of waveforms and spectra, even for events located more than 3300 km from their array. Compared to nearby broadband stations, a higher percentage of nodes gave usable ∼1 Hz teleseismic receiver functions. Li et al. (2023a) performed ambient noise tomography using nodal sensors in South China, with dispersion measurements spanning periods from 1.4 to 7 s, demonstrating their ability to recover ambient ground motion at longer periods, down to approximately 0.15 Hz. To assess the reliability of the node’s performance in our study area, we compared the waveform similarity of a local earthquake recorded by a nearby broadband station (YGN) and a node (306) (Figure 2a). YGN is located approximately 3.84 km from node 306 and recorded waveforms closely resembling those captured by the node. In addition, we examined the spectrogram (i.e. the time-varying frequency spectrum) for both the broadband and nodal stations for the same event (Figure 2b), which revealed the primary energy is concentrated within the 1–6 Hz frequency range in both seismograms. A normalized cross-correlation between the two waveforms yielded a value of 0.81 (Figure 2c), indicating a high level of similarity. We also found the Fourier spectra of nodal and broadband sensors to be very similar after removal of the instrument response for local and regional events, indicating the reliability of nodal sensors in recovering true ground motion within the 1–4 Hz frequency range.
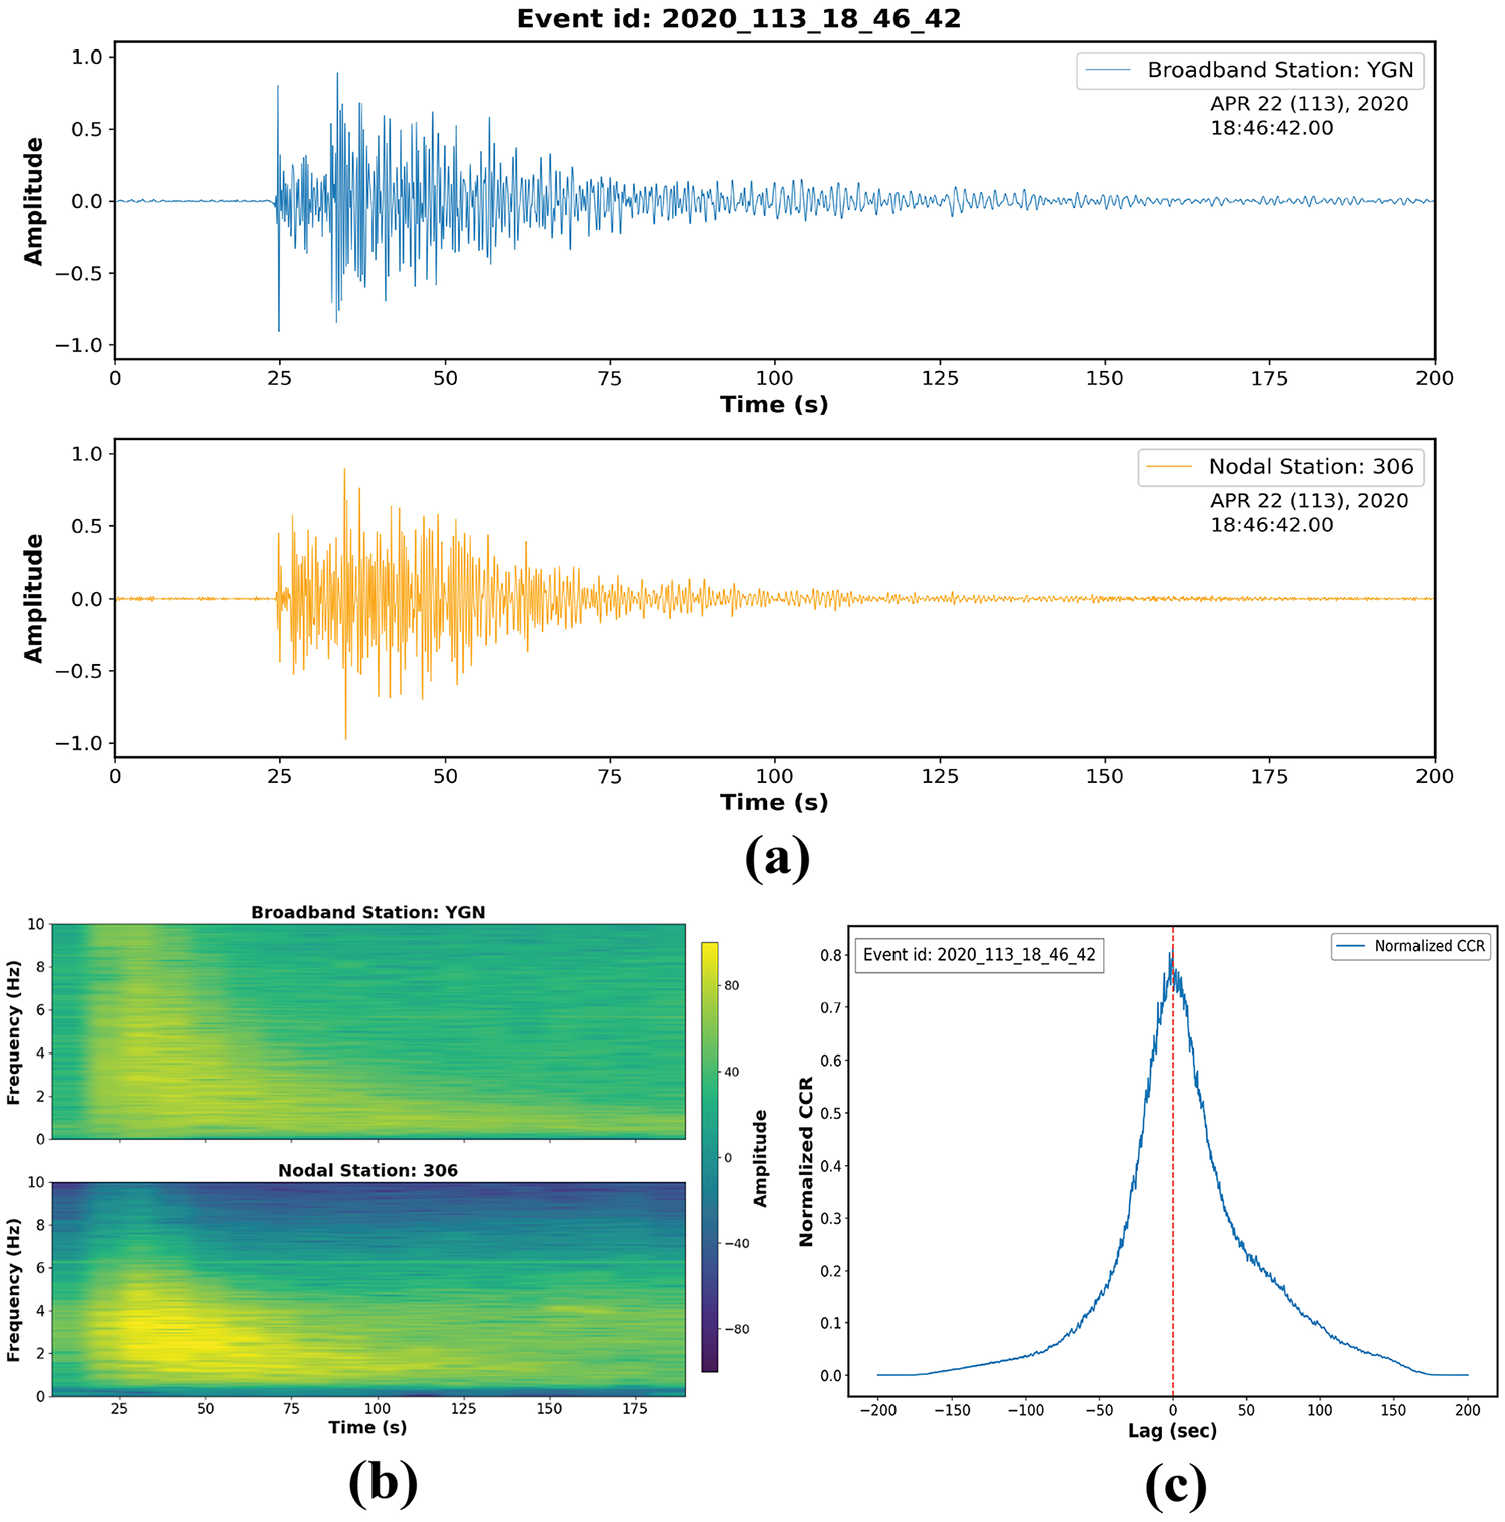
(a) Example waveforms (vertical component) of a local earthquake used in this study, recorded at broadband station (YGN) and nodal station (306); (b) the corresponding spectrogram; (c) normalized cross-correlation coefficient between the broadband (YGN) and nodal station (306) for the same event.
We are estimating frequency-dependent site terms for both the Sg and Lg phases in order to understand near- and far-field site amplification. These two phases are well-suited for source-based site amplification studies because they represent the highest amplitude phases at local and regional distances, respectively. At local distances (<3°), the Sg phase can be either an upgoing S-wave from a source in the upper crust or an S-wave bottoming in the upper crust. The Sg phase typically includes arrivals resulting from multiple S-wave reverberations within the crust beyond the cross-over distance (Storchak et al., 2003). On the contrary, the Lg phase is composed of multiple, postcritically reflected shear waves or higher-mode surface waves trapped within the crustal waveguide on continents (Bouchon, 1982; Kennett and Mykkeltveit, 1984). It typically represents the largest amplitudes in the seismogram at regional distances (∼3°–15°) with a group velocity of approximately 3.5 km s−1. The Lg phase is of primary engineering interest due to its destructive potential at regional distances.
After data extraction and preprocessing, Lg/Sg phases were windowed manually. Later, a narrow bandpass filter was applied to isolate the energy at specific frequencies, and the maximum amplitude was estimated for each nodal station. We only used waveforms that had a high signal-to-noise ratio (SNR > 2.0) to minimize the effects of local noise. The SNR was calculated using a pre-event Pn/Pg background noise level window with a duration of 10–20 s relative to the Lg/Sg window. Most of the stations of the MUSE array recorded for 35–40 days. During this period, we found several local and regional events that generated high SNR seismograms (see Supplementary Materials, Figure S1.1 and Figure 2). One notable regional event was the Mw 5.9 Falam earthquake, located ∼5.5° (610.5 km) away from Yangon city center. This shallow-focused (∼10 km) earthquake was associated with the Kabaw fault, which ruptured the Tripura segment of the Indo-Burma subduction zone (Aung, 2020). For each station, site terms for multiple events were averaged to obtain a mean value as a function of frequency.
Methods
Isolating the site term is often difficult since seismic amplitudes depend on the source, propagation path, attenuation (Q), and velocity structure. In the frequency domain, the spectral amplitude recorded from event

where
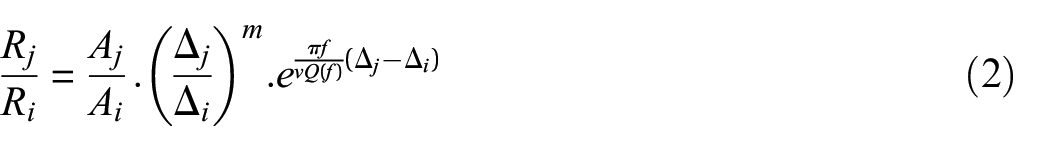
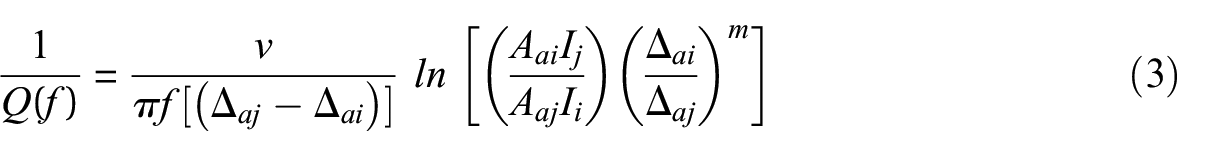
We can estimate the effective path Q using the two-station method (TSM) (Xie, 2002) assuming same geometry in Figure 3:
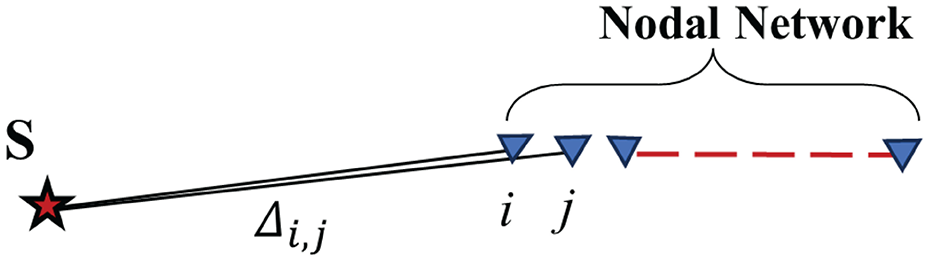
Geometry of the direct site term measurement method.
Removing the instrument response and geometric spreading, we can simplify Equation 3 to:
where
We have also implemented the horizontal-to-vertical (H/V) spectral ratio (HVSR) method to estimate the fundamental frequency of resonance (
Results
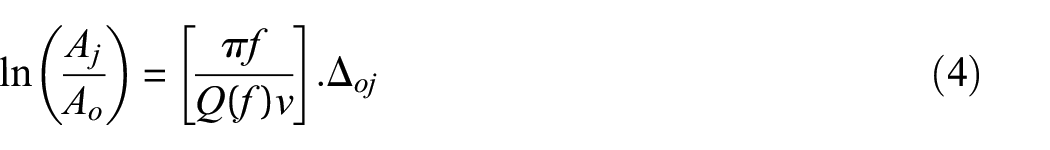
Using the TSM approach, we estimated the Lg and Sg Q at different frequency bands (Figure 4). Previous regional attenuation models captured the frequency-dependent variation of Lg Q in the Central Myanmar Basin (CMB) and surroundings, with a spatial resolution ranging from 2° to 0.5° (He et al., 2021; Islam et al., 2022; Luo et al., 2021). The average path Q surrounding Yangon (within 600 km) ranges from 180 to 250 for 1.0 Hz, 300 to 450 for 2.0 Hz, and 450 to 600 for 3.0 Hz. Our two-station Q values are comparable to the background large-scale Q model. Since Q is not exceptionally low (<50), the local site effect will be the primary factors for the observed variations in amplitude. It is important to note that, due to the smaller distance scale and site amplification, the estimated Q value tends to have higher uncertainty. The Lg relative site response at different frequencies (Figure 5) reveals the ground motion variability in Yangon city.
TSM Lg Q estimates at different frequencies. Here, the two-station distance is defined as the difference between the reference station (closest to the event) and the station of interest. The red lines are the best-fit lines.
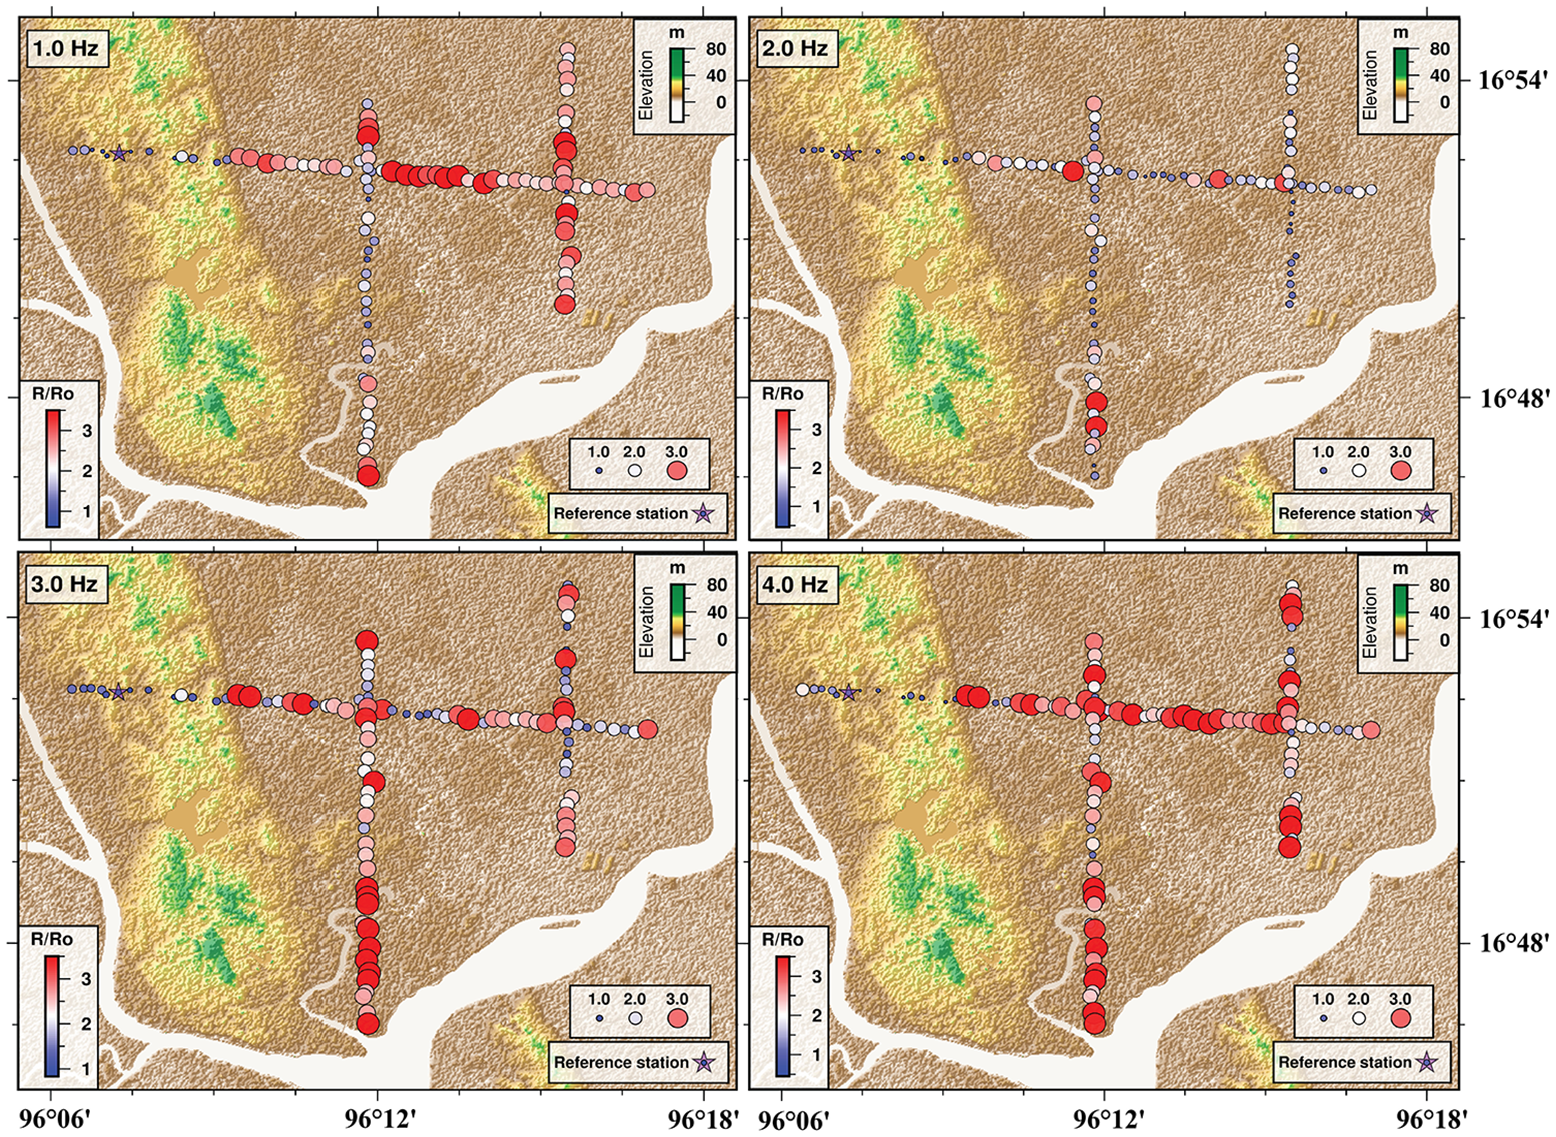
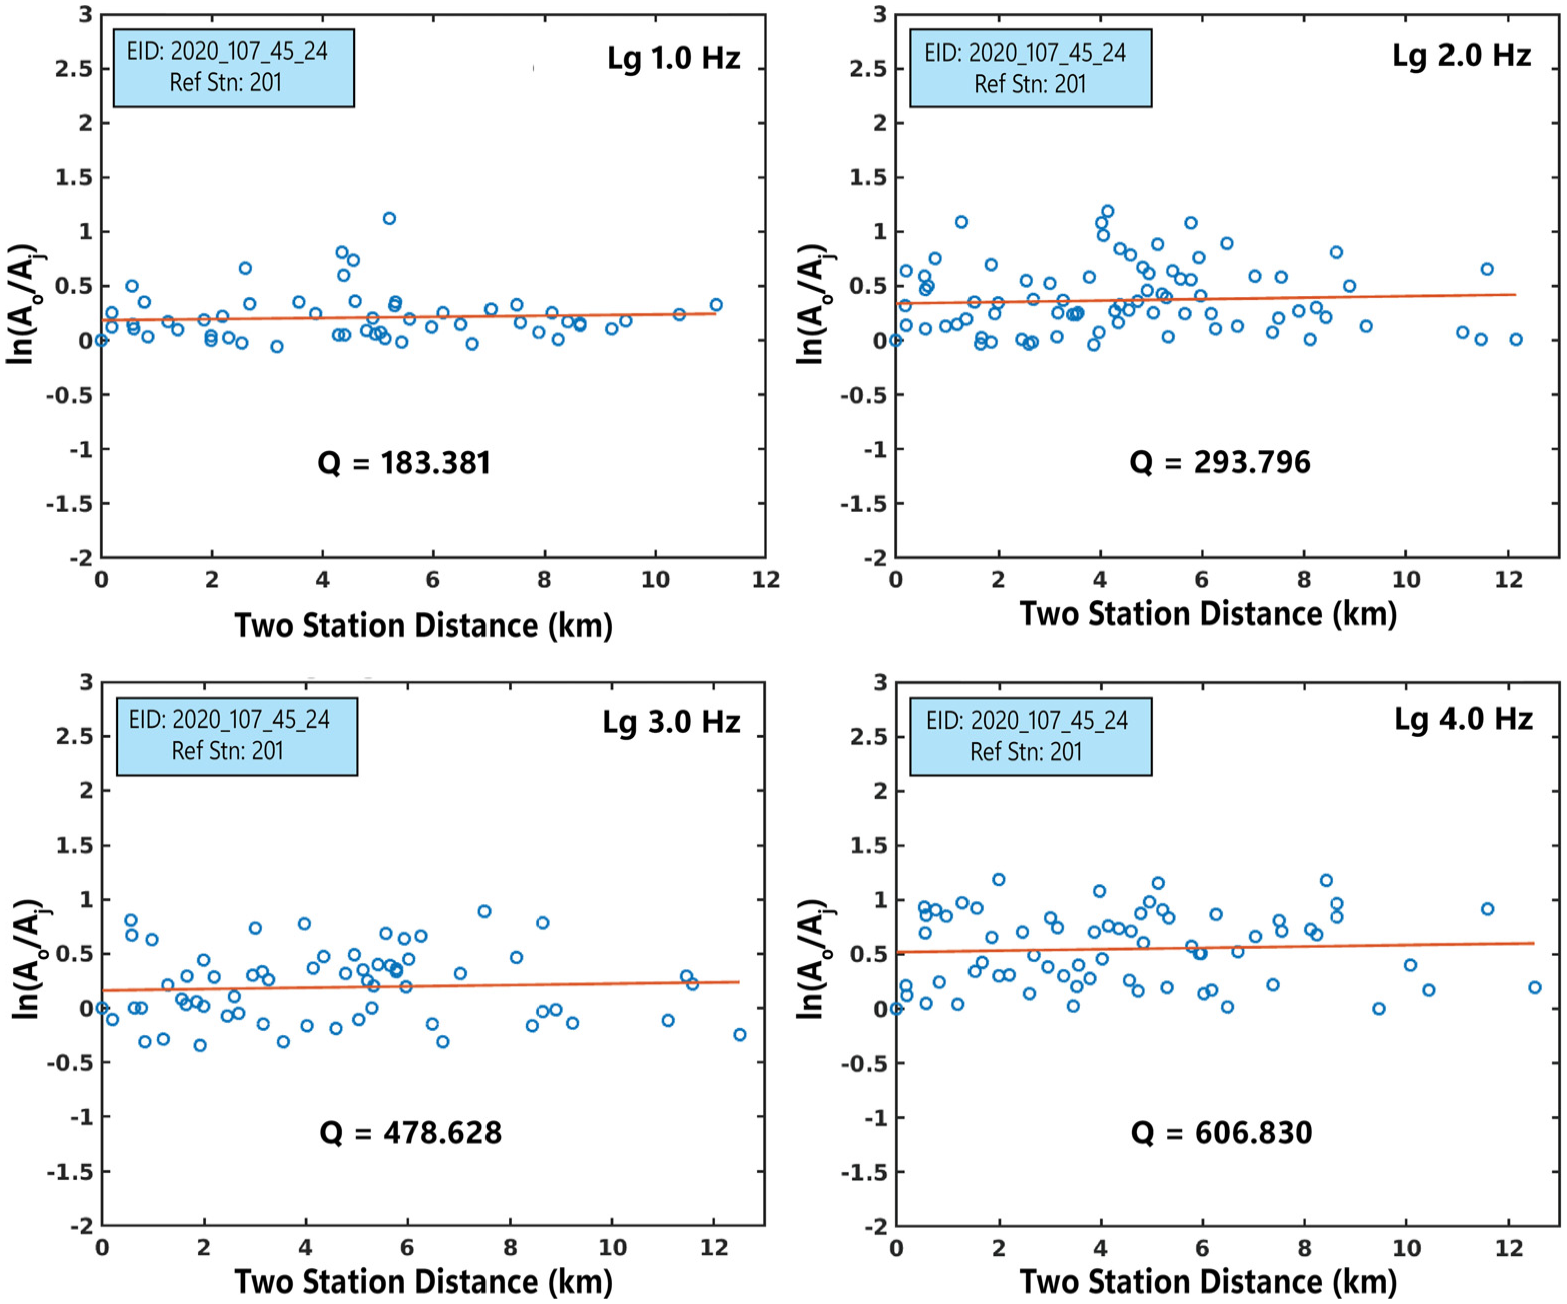
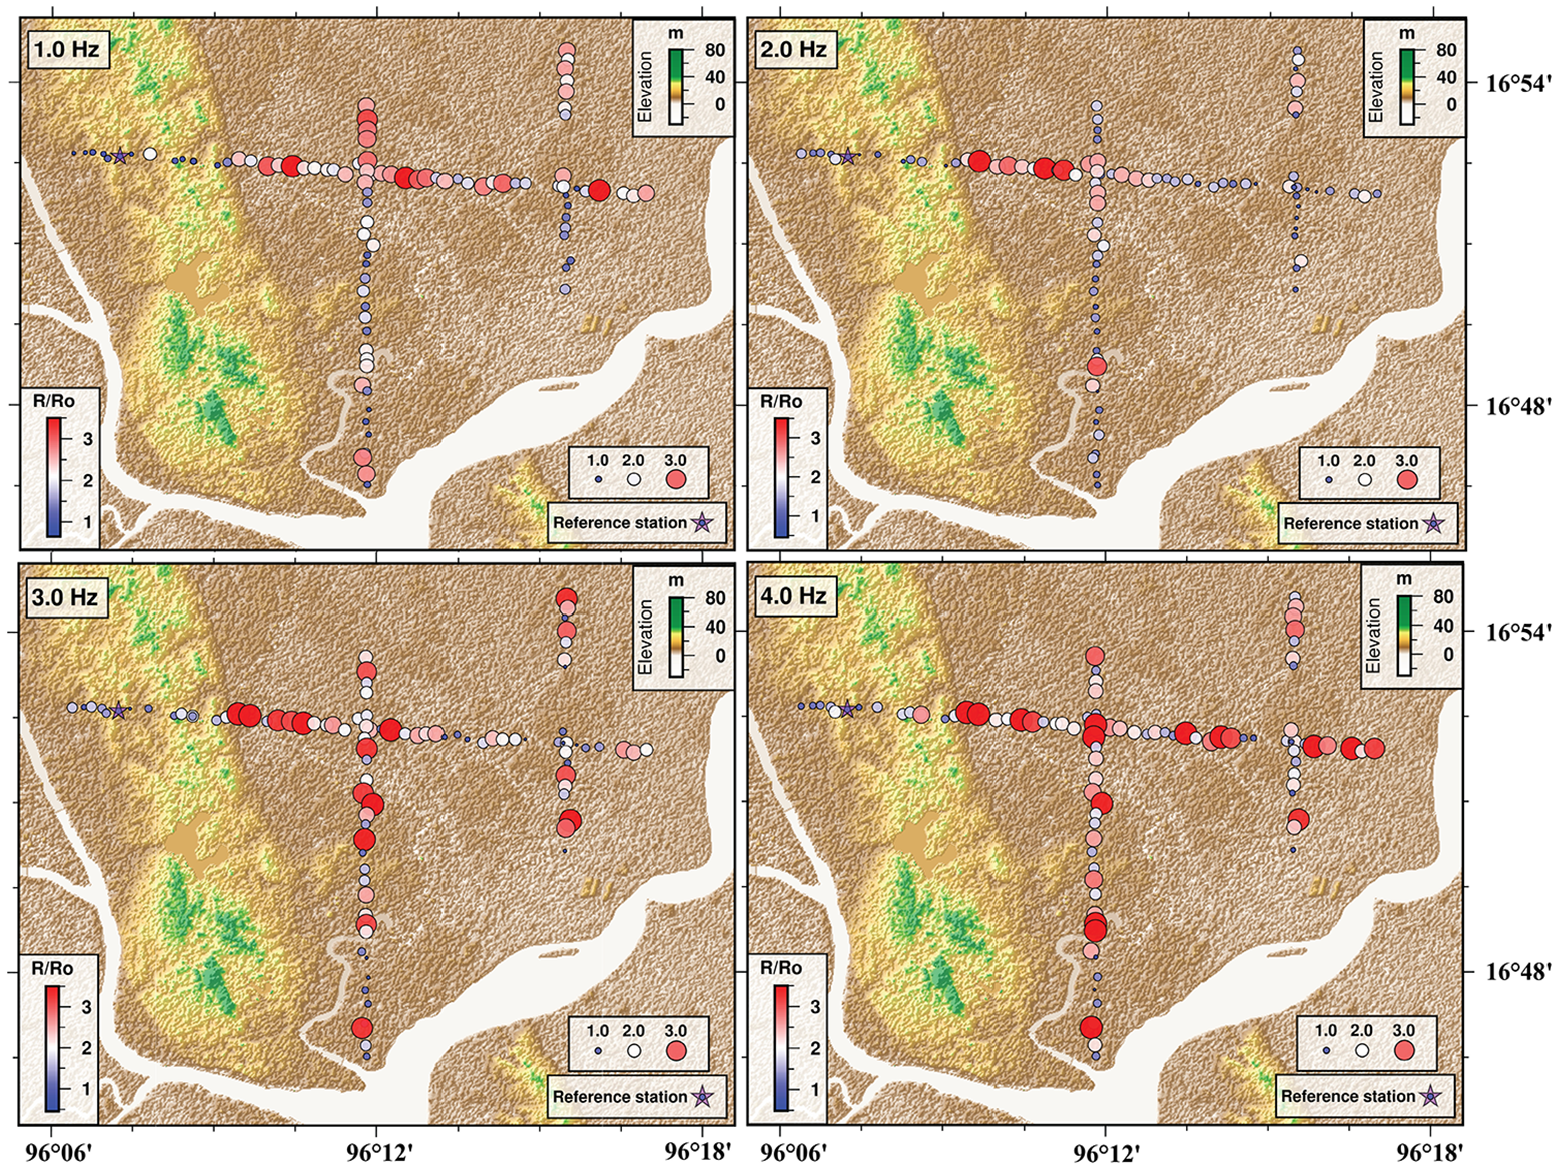
Lg relative site amplification results of Yangon in different frequency bands plotted on top of the digital elevation model (DEM).
It is evident that site response characteristics change over short distances, sometimes varying within approximately 1 km, as captured by the dense nodal network. The observed amplification factor is significantly higher than the theoretical amplitude changes when the site term is not considered (see Supplementary Materials, Figure S2.1). Site response is also highly frequency dependent, with amplification factor reaching as high as 5.0. The western part of the city exhibits a lower amplification across all frequency bands. Conversely, in the southern part, near the confluence of the Bago and Yangon rivers, we observe high amplification, especially at frequencies above 1.0 Hz. Significant amplification is also observed in the north-central and eastern parts of the city. Except for local variations, the eastern part of the array appears to be amplified at all frequencies except 2.0 Hz. Lg site amplification greater than 4.0 Hz becomes unreliable for most stations due to low SNR values. The Supplementary Materials (Figure S5.1) show the frequency-dependent variability in average Lg site amplification at several key stations. The Sg relative site response (Figure 6) shows a similar pattern, with overall de-amplification in the western part and amplification in the central and southern parts of the array. The southern riverbank areas and central parts experience greater amplification, especially at 2.0 and 4.0 Hz. We observed consistent amplification or de-amplification in site response across different events, with lower overall variability (see Supplementary Materials, Figure S5.2) across all frequency bands for most stations. This indicates our new approach can effectively eliminate the source and path effects for a small-aperture nodal array. However, some stations tend to show higher uncertainty ranges, indicating anisotropic or directional dependent behavior in site amplification. We also estimated site terms using vertical components, which produced similar results (see Supplementary Materials, Figures S3.1 and S3.2).
Sg relative site amplification results of Yangon in different frequency bands plotted on top of the DEM.
We have implemented the SESAME criteria (SESAME, 2004) to assess the reliability and stability of the H/V peaks. We categorized the resulting H/V curve into four distinct types (single peaks, multiple peaks, broad peak, and flat response). Supplementary Figure S6.1 shows the example H/V curves showing the representative peak types. We have identified 68 stable peaks that satisfy SESAME standards. Several stations showed another peak (see Supplementary Materials, Figure S6.1b) at the higher (6–7 Hz) frequency end, possibly representing another velocity contrast in the upper layer. We found stable H/V peaks at locations with higher peak amplitudes, as observed at station 216 (Supplementary Materials, Figure S6.1a), where the H/V peak amplitude reaches 7.6. Detailed H/V parameters, uncertainty, and stability results are available in the Supplementary Materials (Supplemental Table S6.1). Sources of uncertainty in the HVSR measurements include seasonal variability in ambient noise sources (Hillers and Ben-Zion, 2011; Panou et al., 2005), anthropogenic activity in urban environments such as Yangon (D’Amico et al., 2008), choice of window length (D’Alessandro et al., 2016), and sensor type and sensitivity (Molnar et al., 2022).
The HVSR results along the profiles show that the area is characterized by a single peak frequency ranging from ∼0.7 to 1.5 Hz (Figure 7). Previous HVSR studies in Yangon have also observed the fundamental frequency between 0.7 and 1.3 Hz (Hirokawa et al., 2017; Morio et al., 2019). The HVSR peak amplitude varies across the profile, potentially due to changes in subsurface geology, sedimentary layer thickness, or variations in the shallow Vs structure. In the M2 profile, HVSR amplitudes show sharp peaks, indicating higher impedance contrast, which gradually decreases toward the eastern part of the array. Similarly, HVSR fundamental frequency also decreases in the eastern section of the M2 profile. In contrast, HVSR amplitudes along the M3 profile show a near-constant value at frequencies between 0.7 and 1.3 Hz. The southern part of the M4 profiles does not show clear HVSR peaks which can be due to the presence of thick unconsolidated sediment.
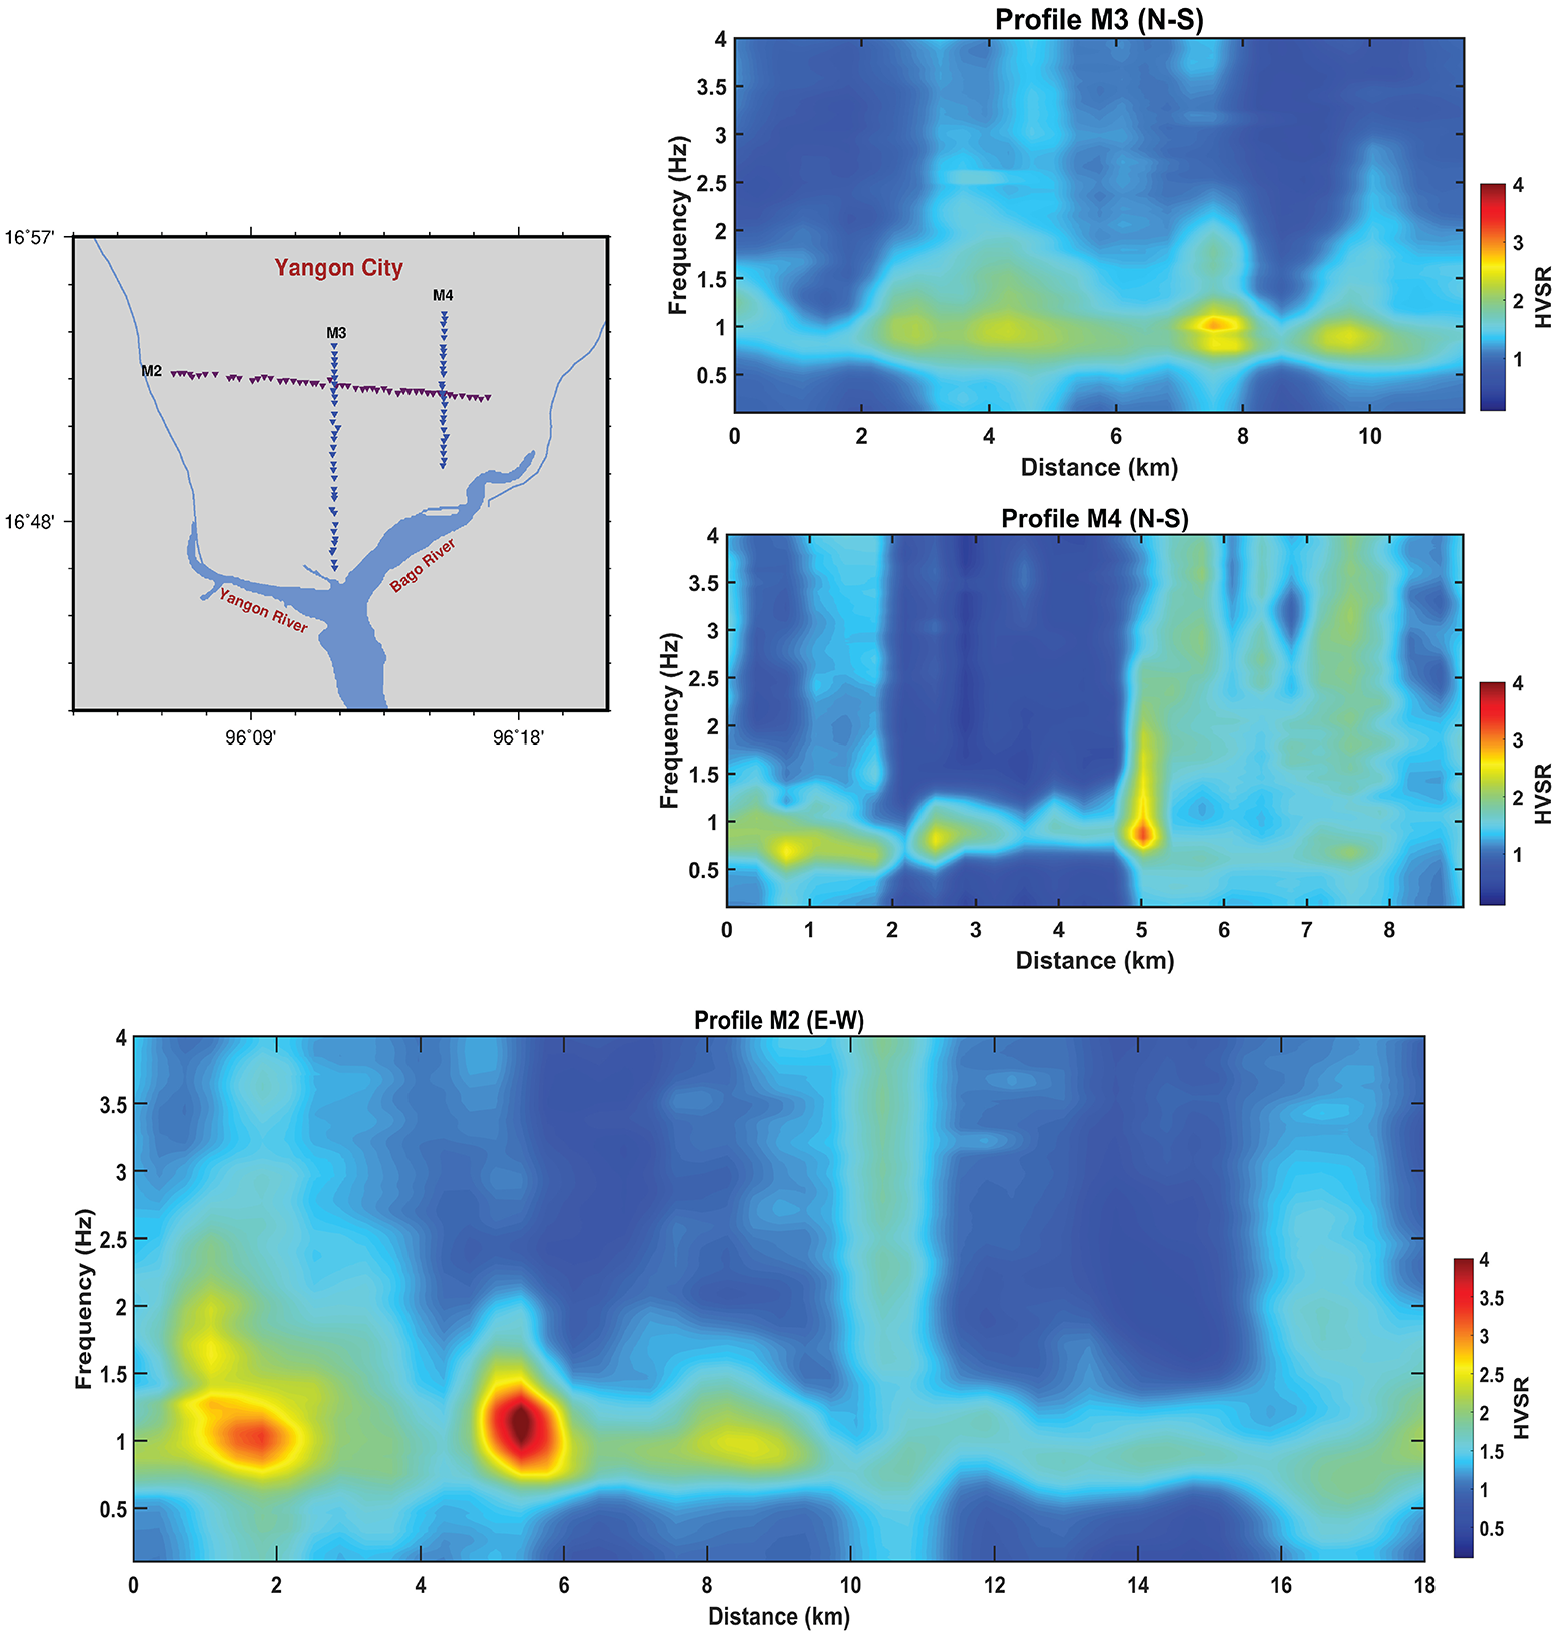
Variation of HVSR amplitudes with respect to frequency along the M2, M3, and M4 profiles.
Discussion
Accurate sediment thickness beneath Yangon is uncertain due to the lack of deep borehole data; however, previous studies indicate that the Irrawaddy delta basin reaches a maximum depth of up to 5 km in the Yangon region (Racey and Ridd, 2015; Tainsh, 1950), which is much deeper than the inferred from the peak frequency of the HVSR results. The absence of a deeper contrast in the H/V curve could likely be due to the limitations of the nodal sensor. A low-frequency peak, particularly below 0.5 Hz, would be difficult to detect with the nodes, making it challenging to constrain the depth of geological bedrock beneath Yangon. Therefore, our HVSR peaks represent a shallower section of the basin, not the overall depth. Since borehole explorations in Yangon city do not extend beyond 50 m, direct observation of the subsurface geology and engineering bedrock depth is lacking. Several previous studies have estimated 1D shear-wave velocity profiles (Hirokawa et al., 2017; Morio et al., 2019) in Yangon city that are relatively close to our array. Hirokawa et al. (2017) estimated the shear-wave velocity profile from the dispersion curve of Rayleigh wave phase velocity and the H/V spectral ratio of micrometer at the University of Yangon campus, located 2.3 km south from the western site of the M2 profile. They identified a sharp velocity contrast at a depth of 130 m, with a Vs of 800 m/s. Using their average shear-wave velocity profile, the mean ∼1.2 Hz H/V peaks in the western part of the M2 represent the same boundary. Another study by Morio et al. (2019) also found a velocity sharp contrast (Vs 1200 m/s) at a similar depth, near the middle section of our M3 array. Therefore, the fundamental peak frequency observed throughout our array most likely marks this engineering bedrock interface.
Several studies have established the empirical nonlinear regression relationship between the fundamental frequency and the thickness of the soft sedimentary cover (Delgado et al., 2000; Parolai et al., 2002; Seht and Wohlenberg, 1999). Although these regression relationships are site-specific, using derived coefficient from similar deep sedimentary basins around the world (Thabet, 2019; Tün et al., 2016), we found the corresponding soft sedimentary layer thickness beneath Yangon ranges from ∼86 to 200 m, taking (a = 140 and b = 1.35) which likely represents the depth to the consolidated sediments. The observed average ∼1.0 Hz resonant frequency may thus arise from a high impedance contrast within the deeply buried lithified sedimentary rocks that have sufficiently higher shear-wave velocity to be called engineering bedrock. This implies that the observed site amplification variability originated from the shallower part of the basin. Furthermore, we observe clear peak frequencies in some parts of the profile and less evident peaks in others (Figure 7), suggesting that the consolidated-to-unconsolidated boundary may be more gradational, especially in the southern part of the M4 profile. We also observed that the peak resonance frequency is higher in the western part of the M2 profile, where site amplification is low (Figure 8b). This indicates that the soft sedimentary layer in the western part is thinner than in the eastern part of the array.
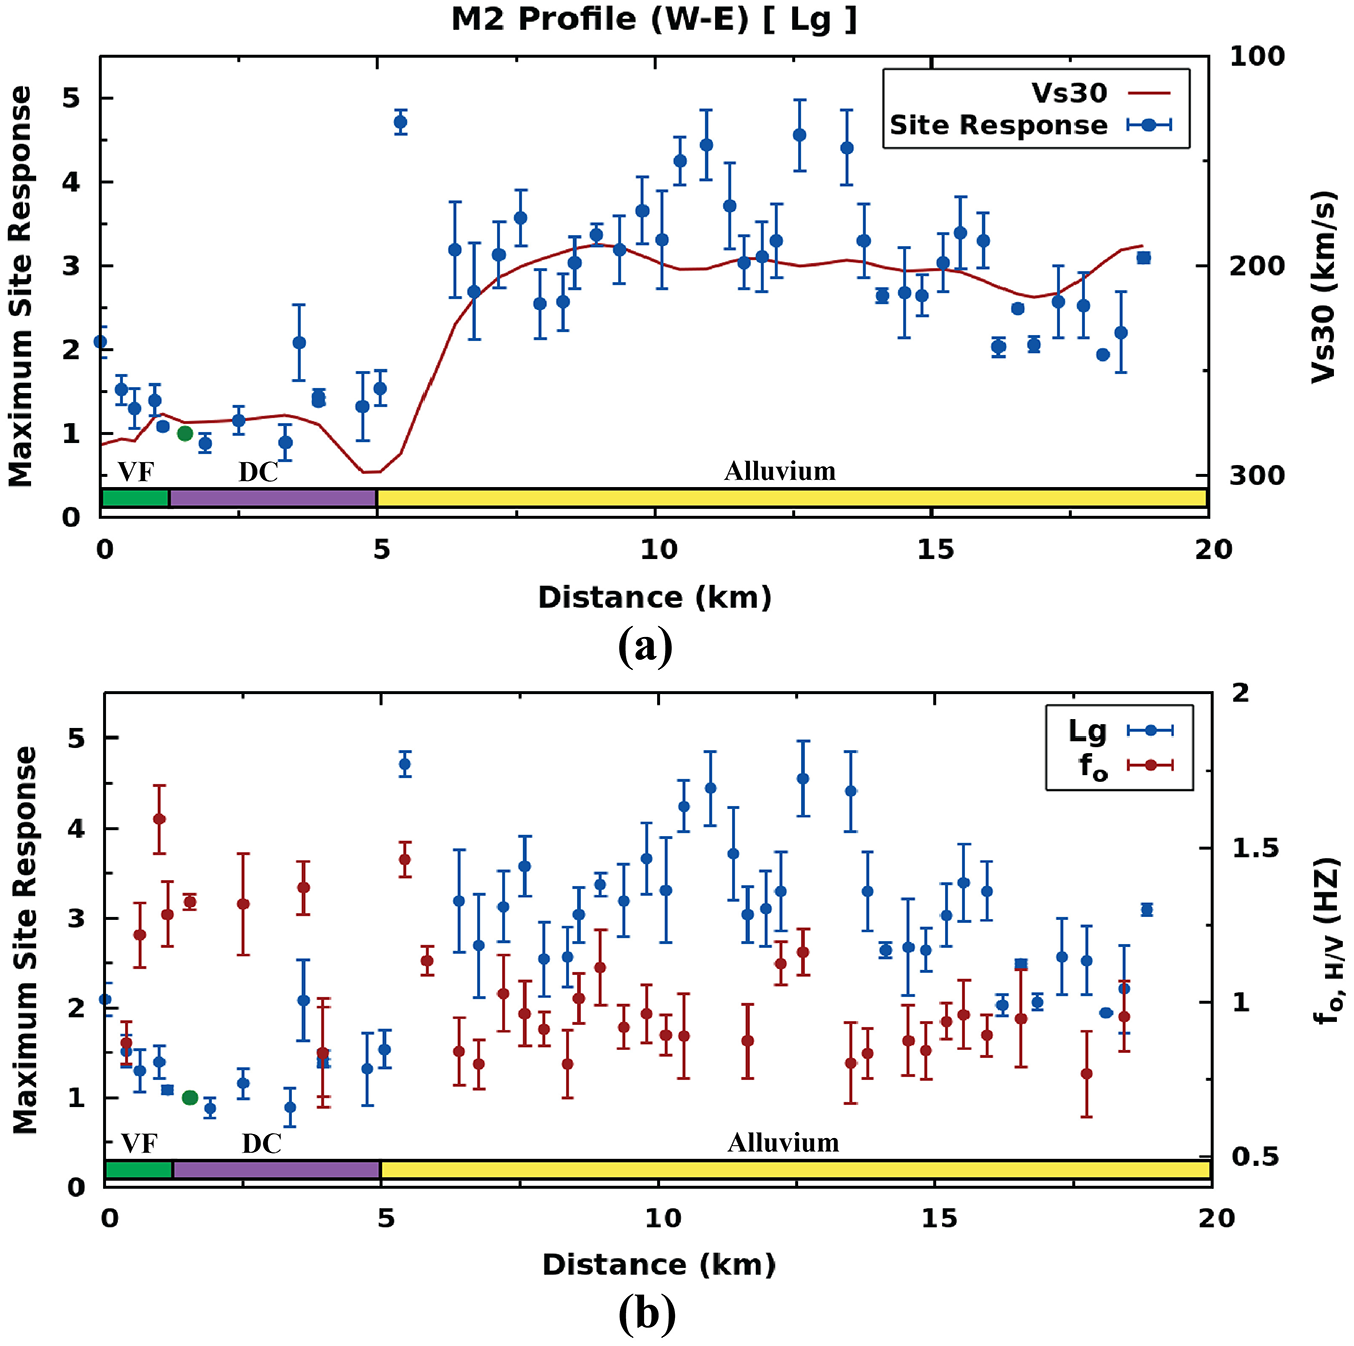
Comparison of maximum Lg site amplification variability along the M2 profile with (a) Vs30 and (b) HVSR fundamental peak frequency. Changes in surficial geology along the profile are marked at the bottom. VF: valley-filled deposits; DC: Danyingon clays.
Given the scale of geological heterogeneities, the travel distances of incoming seismic waves, and the frequencies relevant to earthquake engineering, it is evident that local geological conditions play a crucial role in site amplification (Pitilakis, 2004; Su et al., 1992; Trifunac, 1979). When examining the local geology and structure of Yangon and its surroundings, we found a strong correlation between the site amplification and the shallow geological structure beneath the city. Both the local geology (Figure 9) and digital elevation model (DEM) (Figures 5 and 6) demarcate an anticlinal structure at a higher elevation than its surroundings which is offset by a strike-slip fault in the north. Strong de-amplification is observed in all frequency bands at stations located above the anticlinal structure. This N-NE trending anticline is composed of the older Pliocene Irrawaddy Formation (Aung, 2011; Tint et al., 2018), which has a thinner soft sedimentary layer, as evidenced by a higher H/V fundamental frequency. The laterite soil cover (Aung, 2011) provides additional stiffness of the underlying rocks. On the contrary, highly amplified areas are part of the younger Pleistocene to recent alluvial plain consisting of loose unconsolidated deposits which generally have low seismic velocities. Typically, we would expect to see regions with low seismic velocities associated with high site amplification and, subsequently, higher seismic hazard. One ground motion study in Yangon, using a scenario earthquake of Mw 7.0 at the Bago section of the Sagaing Fault, Swe (2018) showed the eastern section experienced higher ground shaking, which could be intensified by site amplification. We also observed frequency-dependent variations in both Lg and Sg site amplification, resulting from the combined contribution of impedance contrast, resonance, and basin effects. Isolating the individual factors contributing to frequency dependency is challenging without accurate velocity models, 3D basin geometry, waveform simulations, and basin-wide observations. A detailed geological profile of Yangon city is not available in published articles, partly due to a lack of borehole data. The unconsolidated soft sedimentary layer is thicker in the eastern section, as indicated by the lower H/V peak frequency. We observed abrupt changes in Lg and Sg site response between neighboring stations which reflect the heterogeneities in the local geology and small-scale structures. Our results are consistent with the available Vs30 model (Heath et al., 2020) (see Supplementary Materials, Figure S4.1), where the western anticlinal area exhibits higher shear-wave velocity ranging from 250 to 350 m/s. Comparisons with maximum Lg site amplification and Vs30 along the M2 profile (Figure 8a) show overall lower shear-wave velocity in the eastern alluvium outcrops (180–200 m/s) where we see higher site amplification. However, our study captures small-scale site amplification variability along the profile that the Vs30 estimates. As previously mentioned, this topographic slope-based Vs30 proxy does not always correlate perfectly with true site amplification (Thompson and Wald, 2016). Vs30’s utility in deep sedimentary basins and urbanized areas is likely to be more problematic. Since the propagation characteristics of Lg and Sg are different, coherent amplification patterns indicate our approach can reliably estimate the linear component of site amplification.
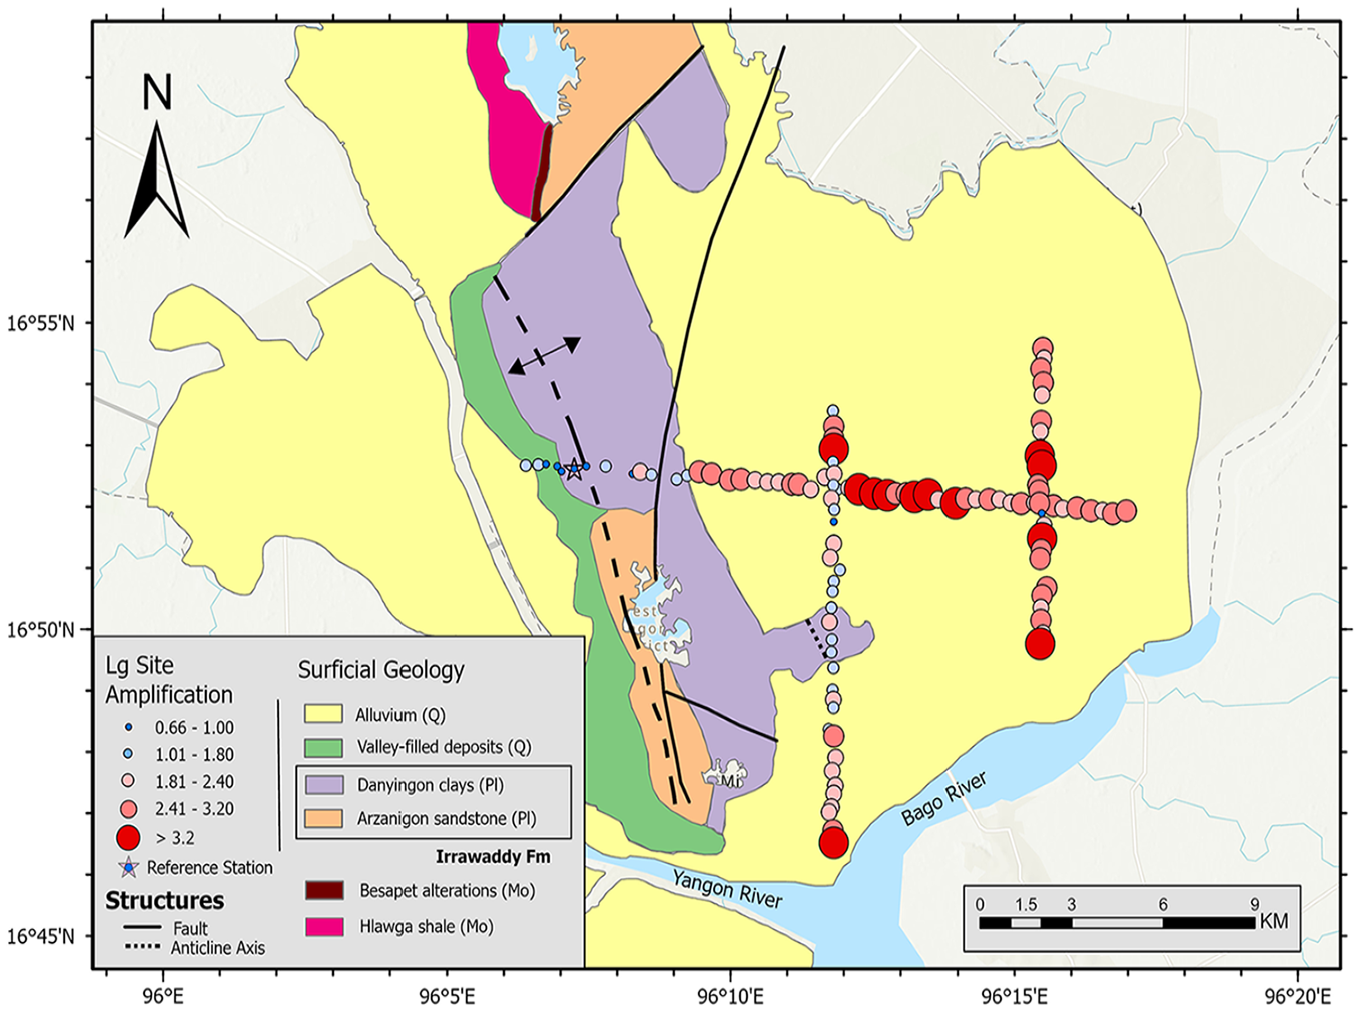
Lg site amplification at 1.0 Hz with surficial geology of Yangon (modified from Aung, 2011).
Conclusion
We have estimated site amplification in Yangon, Myanmar, using a dense nodal array at short-length scales relevant to engineering applications, particularly in metropolitan areas with high population density and critical infrastructure. This study uses a dense array of 110 nodal seismometers installed in the city of Yangon for approximately 1 month. We demonstrate that in seismically active areas, such nodal arrays with interstation spacing on the order of a few hundred meters can reliably estimate site amplification variations at the scale of city blocks using regional and local earthquakes. To assess the accuracy and robustness of the estimated amplification, we compared our results with multiple independent data sets, including surface geology, HVSR, and Vs30. We observed correlations between site response and near-surface geology, such as the amplification above the unconsolidated alluvial deposits and de-amplification above older, consolidated sediments. Variations in site amplification over short distances (up to a factor of 4 within a few hundred meters) suggest that local site response is sensitive to the surficial geology and small-scale heterogeneity beneath the stations. Distinct fine-scale amplification patterns highlight high-risk areas with greater ground amplification potential. One drawback of this method is that in regions with low seismicity, obtaining sufficient high-quality recordings to compute robust site terms may be challenging. Nevertheless, using our new approach, dense urban nodal arrays, or, potentially, fiber optic cables can be effectively utilized to construct high-resolution site amplification models in seismically active regions. Since geological and geophysical models used in numerical simulations currently lack the resolution needed to predict ground motion at high frequencies, this approach can help bridge knowledge gaps in estimating site response, especially in regions with limited prior investigations.
Supplemental Material
sj-docx-1-eqs-10.1177_87552930251352843 – Supplemental material for Estimating site amplification variability in Yangon, Myanmar, from a dense nodal seismic array
Supplemental material, sj-docx-1-eqs-10.1177_87552930251352843 for Estimating site amplification variability in Yangon, Myanmar, from a dense nodal seismic array by Md Mohimanul Islam, Patricia Persaud, Myo Thant, Khin Win and Eric Sandvol in Earthquake Spectra
Footnotes
Acknowledgements
The authors thank the Yangon residents who hosted the nodal seismic stations, as well as the students, professors, and lecturers involved in the node installation and pick-up teams, including Myo Thant, Zaw Lin Kyaw, Tin Myint Oo, Zin Myo Win, Pyae Phyo Lwin, Aye Chit Min, Thiha Thiha, Thet Naing Oo, Thinzar Yadanar, Min Khant, and Phyo Paing Than, along with other volunteers in Yangon for their contributions to the project. The authors also thank three anonymous reviewers and Editor-in-Chief Dr Jack Baker for their comments and suggestions, which greatly improved the quality of this manuscript.
Declaration of conflicting interests
The author(s) declared no potential conflicts of interest with respect to the research, authorship, and/or publication of this article.
Funding
The author(s) disclosed receipt of the following financial support for the research, authorship, and/or publication of this article: This research was supported by the Department of Geology and Geophysics at Louisiana State University, the Department of Geosciences at the University of Arizona, and National Science Foundation (NSF) awards EAR-1714875 and EAR-1714651. The nodal seismic network deployment was supported by the Society of Exploration Geophysicists (SEG) Geoscientist Without Borders grant program. The authors thank the EarthScope Seismological Facility for the Advancement of Geoscience Data Management Center (SAGE-DMC) for providing some of the seismic instruments, assisting with logistics, and hosting the seismic data sets. The facilities of the EarthScope Consortium are supported by the National Science Foundation’s Seismological Facilities for the Advancement of Geoscience (SAGE) Award under Cooperative Support Agreement EAR-1851048.
Data and resources statement
The MUSE network data are hosted by the EarthScope Seismological Facility for the Advancement of Geoscience Data Management Center (SAGE-DMC) (Persaud, 2020). The data set is currently restricted and will be publicly available in mid-2025. We have uploaded the detailed site response and HVSR results to GitHub, accessible at ![]() .
.
Supplemental material
Supplemental material for this article is available online.
References
Supplementary Material
Please find the following supplemental material available below.
For Open Access articles published under a Creative Commons License, all supplemental material carries the same license as the article it is associated with.
For non-Open Access articles published, all supplemental material carries a non-exclusive license, and permission requests for re-use of supplemental material or any part of supplemental material shall be sent directly to the copyright owner as specified in the copyright notice associated with the article.