
Abstract
This is a visual representation of the abstract.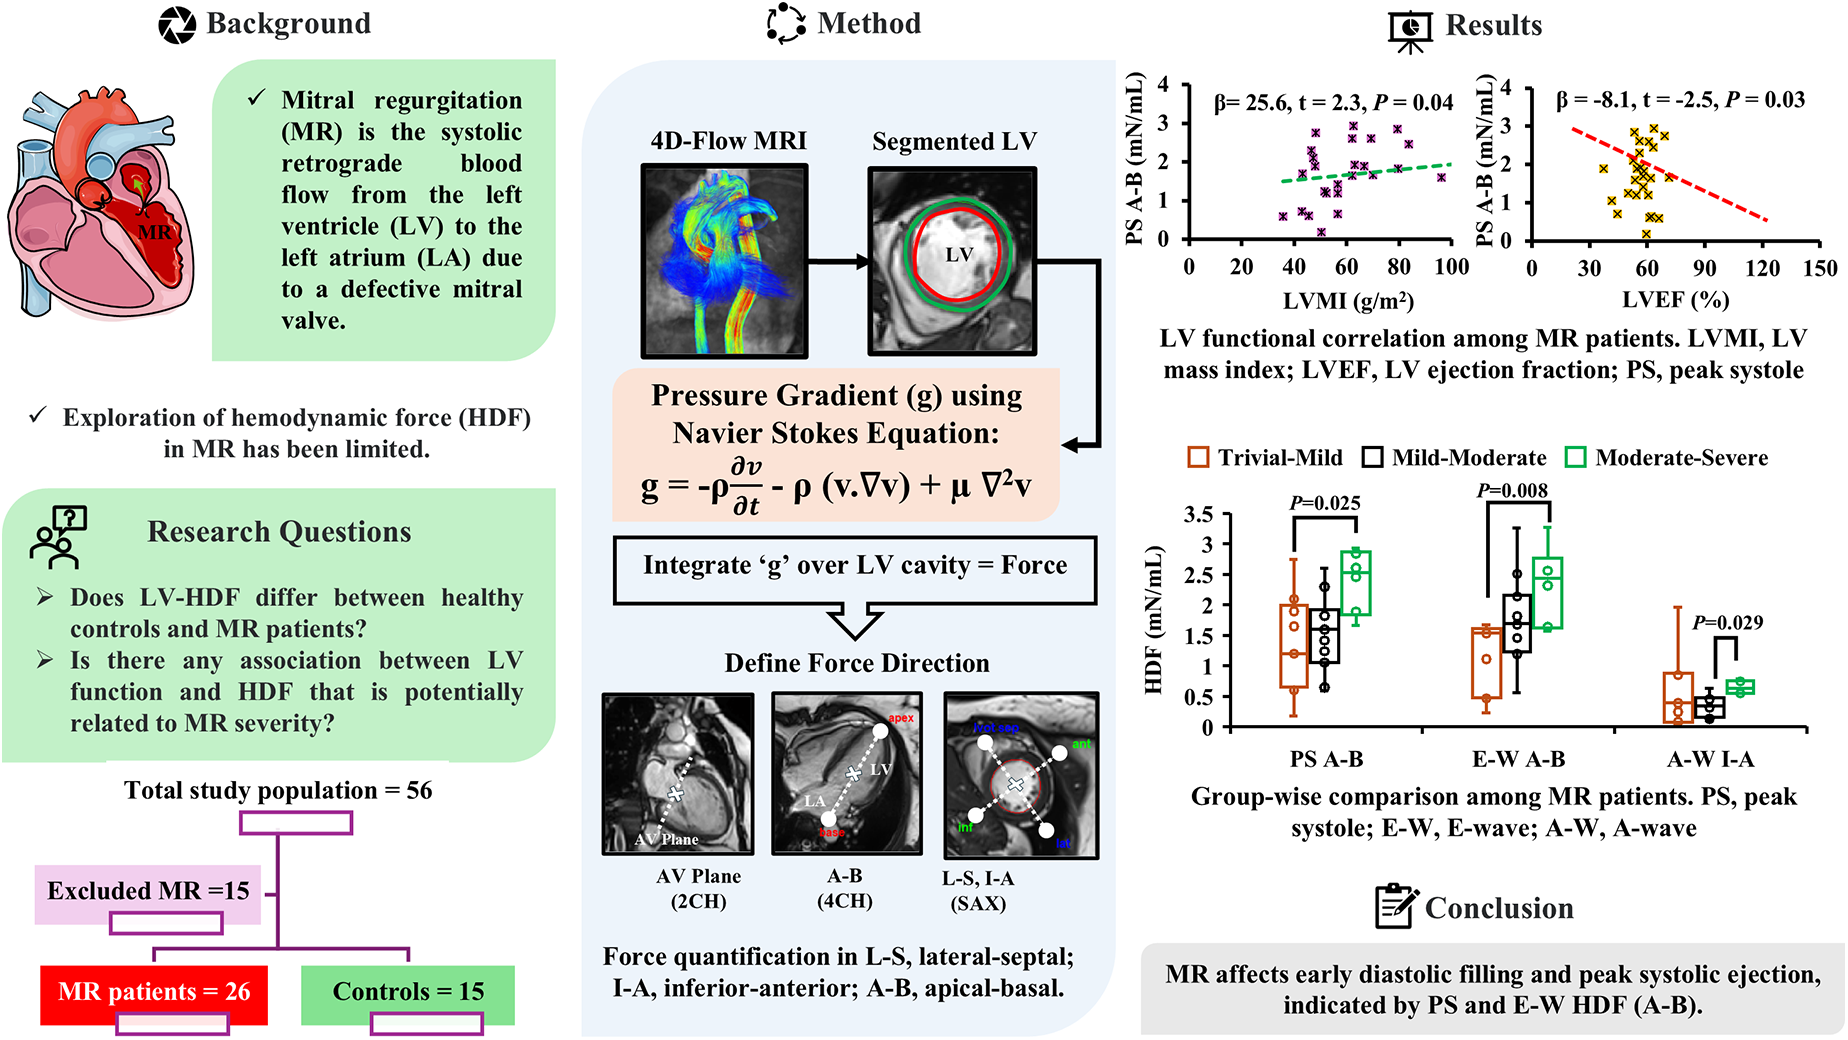
Early Detection: HDF, especially peak-systolic HDF in the apical-basal direction, can reveal early LV dysfunction in MR even when ejection fraction appears preserved. Impact on LV Dynamics: MR severity alters both systolic ejection and diastolic filling, as indicated by distinct changes in HDF. Improved Risk Stratification: Using 4D-flow MRI for HDF analysis provides additional insights that can enhance risk assessment and guide personalized treatment in MR patients.
Background
Mitral regurgitation (MR) is one of the common valvular heart diseases (VHDs) in developed countries, with prevalence increasing with age. Reportedly, 2 million people in the United States are affected by MR. From an etiology perspective, MR can be either organic, mostly degenerative in Western countries, or functional, caused by left ventricular (LV) remodeling in cases of ischemic or idiopathic dilated cardiomyopathy. Patients with moderate or severe MR are at an increased risk of death, recurrent hospitalization for heart failure (HF), and reduced estimated median survival, emphasizing the need for timely detection and intervention.1–3 Conventional metrics such as LV ejection fraction (LVEF) and LV mass (LVM) are commonly employed to evaluate LV function in MR. However, ejection fraction (EF) is influenced by loading conditions and often fails to detect early or subtle dysfunction, especially in the context of MR-induced volume overload. 4 Likewise, LVM is known to be associated with MR severity but does not capture dynamic aspects of LV mechanics.5,6 These limitations underscore the need for more sensitive and physiologically relevant biomarkers.
Medically, “hemodynamics” usually refers to the fundamental measurements of cardiovascular function, such as arterial pressure or cardiac output. 7 Hemodynamic force (HDF), defined as the net force exchanged between intracardiac blood and the surrounding myocardium. It is derived from intraventricular pressure gradients integrated over the LV cavity and normalized to LV volume. Hemodynamic force reflects fundamental biomechanical properties of cardiac filling and ejection, offering a unique window into ventricular mechanics that traditional parameters may overlook. 8 Early attempts to measure HDF relied on echocardiography and invasive heart catheterization, albeit with limitations in accuracy and invasiveness.9,10 The 4-dimensional flow magnetic resonance imaging (4D-flow MRI) is a technique that allows 3D and time-relative assessment of flow across all 4 valves within one simple, free-breathing acquisition. 11 The advent of 4D-flow MRI has enabled noninvasive and highly accurate measurement of intraventricular HDF, making it a widely accepted method for HDF evaluation. 9
Recent studies have highlighted the utility of HDF as a biomarker in a range of cardiovascular conditions, including HF, repaired Tetralogy of Fallot (rTOF), and cardiomyopathy.12–14 Pedrizzetti et al pioneered the HDF evaluation in HF patients with dyssynchronous LV, providing insights into cardiac resynchronization therapy (CRT) response. 8 Eriksson et al further demonstrated that HDF distribution is significantly perturbed in myopathic ventricles, indicating its diagnostic potential in early-stage pathology. 15 Despite its clinical relevance, the application of directional HDF in MR remains insufficiently explored. Our prior work demonstrated that root mean square (RMS) HDF could stratify LV dysfunction in MR patients with preserved EF. 16 Building upon these findings, the present study leverages 4D-flow MRI to investigate directional HDF components at key cardiac phases, including peak systole, peak diastole, E-wave (E-W), and A-wave (A-W), and examines their relationship with MR severity and conventional MRI-derived functional indices. Although the control cohort was demographically similar, it included 4 newly and independently acquired cases to ensure appropriately matched conditions for HDF evaluation. We hypothesize that phase-specific HDF metrics serve as sensitive surrogates of early LV dysfunction and may offer improved characterization of MR severity compared to traditional markers.
Materials and Methods
Study Design and Population
This is a retrospective cross-sectional study. The data were acquired at a single point in time without longitudinal follow-up. The study included fifteen healthy controls, aged between 19 and 61 years, without a history of cardiac disease. Among the 41 MR patients initially considered, 12 were excluded due to missing demographic information, and 3 were excluded due to loading issues in the “Segment” software. Ultimately, the study included 26 patients (n = 6, functional MR, and n = 20, primary MR) aged between 33 and 75 years. Patients with concomitant aortic valve disease were excluded from the study, ensuring that the observed HDF alterations are primarily attributed to MR. Mitral regurgitation patients predominantly had specific etiologies: Secondary MR: ischemic cardiomyopathy or atrial MR; Primary MR: mitral valve prolapse. All participants underwent cardiac 4D-flow MRI for evaluation, and MR patients were scanned before any surgical intervention while being managed medically at the time of imaging. Mitral regurgitation severity was stratified as follows: trivial-mild, mild-moderate, and moderate-severe, following cardiac magnetic resonance imaging guidelines set by the American College of Cardiology and American Heart Association (ACC and AHA) (see section “Severity classification of MR” for further details). 17
Cardiac Magnetic Resonance Imaging Protocol
All participants underwent a consistent standardized imaging protocol using 3 T/MRI scanners (Skyra, Prisma, Siemens) with a 32-channel body coil. Multiplanar segmented electrocardiogram (ECG) gated, time-resolved balanced steady-state free precession cine imaging was conducted in 4-chamber, 3-chamber, 2-chamber, and short-axis views to assess the LV function. The imaging covered the entire heart at end-expiration. In addition, for volumetric assessment, a 3D magnetic resonance angiography of the entire heart was performed with the administration of 0.2 mmol/kg gadolinium contrast (Gadovist®, Bayer Inc). A comprehensive intracardiac 3D in-vivo volumetric blood flow assessment was conducted using 4D-flow MRI, 5 to 10 min after contrast administration. The 4D-flow MRI scan was performed using a free-breathing diaphragmatic navigator gating for respiratory motion compensation, along with retrospective ECG-gated techniques. The parameters set were as follows: flip angle (FA) of 15°, velocity encoding range in all directions of 150 to 200 cm/s, spatial resolution (row × column × slice) = 2.0–3.6 × 2.0–3.0 × 2.5–3.5 mm3, temporal resolution = 25 to 35 ms, field of view with sagittal slab = [240–350] × [320–400] mm2, 30 phases (time frame), bandwidth = 455 to 495 Hz/Pixel, echo time = 2.01 to 2.35 ms, pulse repetition time = 4.53 to 5.07 ms, acceleration scheme = generalized autocalibrating partially parallel acquisition, and acceleration factor (R) = 4. The overall scan time varied between 8 and 12 min, depending on the physiological factors, defined scan parameters, and respiratory gating efficiency.
Severity Classification of MR
This study was based solely on MRI data with volumetric quantification of MR severity. Detailed echocardiographic assessments, including MR jet morphology, were not available for this study. The primary quantitative marker for the evaluation was regurgitation fraction (RF, %), and the corresponding cutoff ranges are as follows: mild: ≤ 15%, moderate: 16% to 25%, moderate-severe: 26% to 48%, and severe: > 48%. The RF (%) was calculated by using the formula: RF = [(MRV/LVSV) × 100%]. The mitral regurgitant volume (MRV) was calculated by subtracting aortic forward flow volume from LV stroke volume (LVSV), where LVSV = LV end-diastolic volume (EDV) – LV end-systolic volume (ESV). 18 For calculating aortic forward flow, a through-plane image was placed at the sinotubular junction in the end-diastole using 2D phase-contrast, velocity-encoded imaging. 19 Mitral regurgitant volume ranges are defined as per the AHA/ACC treatment guidelines: mild < 30 mL, moderate 30 to 59 mL, and severe ≥ 60 mL. 17 The EF (%) is a powerful parameter in detecting VHD as well as MR, and the cutoff range is as follows: normal range (52%-72% for male and 54%-74% for female), mildly abnormal (41%-51% for male, 41%-53% for female), moderately abnormal (30%-40%), and severely abnormal (<30%). 20 The EF (%) was calculated from EDV and ESV estimates, using the following formula: EF = (EDV−ESV)/EDV. 18
Preprocessing and HDF Analysis
The 4D-flow MRI data analysis was performed using in-house software developed in MATLAB (2022b). An automated preprocessing procedure was applied to each scan to compensate for sources of errors such as phase offset errors (Maxwell terms, Eddy currents, and gradient field nonlinearity), noise, and velocity aliasing using our in-house MATLAB tool. 21 The spatial alignment of cine and 4D-flow images was assessed visually and manually and adjusted when necessary.
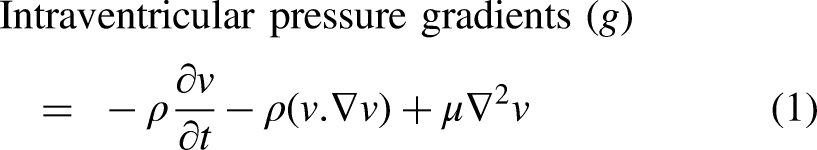
After the preprocessing, the HDF analysis was performed using the freely accessible “Segment” software, version 2.2 R6410 (Medviso). The software supports the analysis of 4D-flow MRI data, provided that both cine and 4D-flow datasets are successfully loaded into it. Figure 1 presents an overview of the HDF analysis workflow. The HDF was quantified using a validated method previously described in detail by Töger et al.9,22 Intraventricular pressure gradients were derived from 4D-flow data using the Navier-Stokes equations (equation (1)) and integrated over the entire LV cavity (refer to Figure 1) to calculate the LV-HDF. Where v is the velocity (m/s), ρ is the density (1060 kg/m3), and µ is blood viscosity (0.004 Ns/m2)
22
:
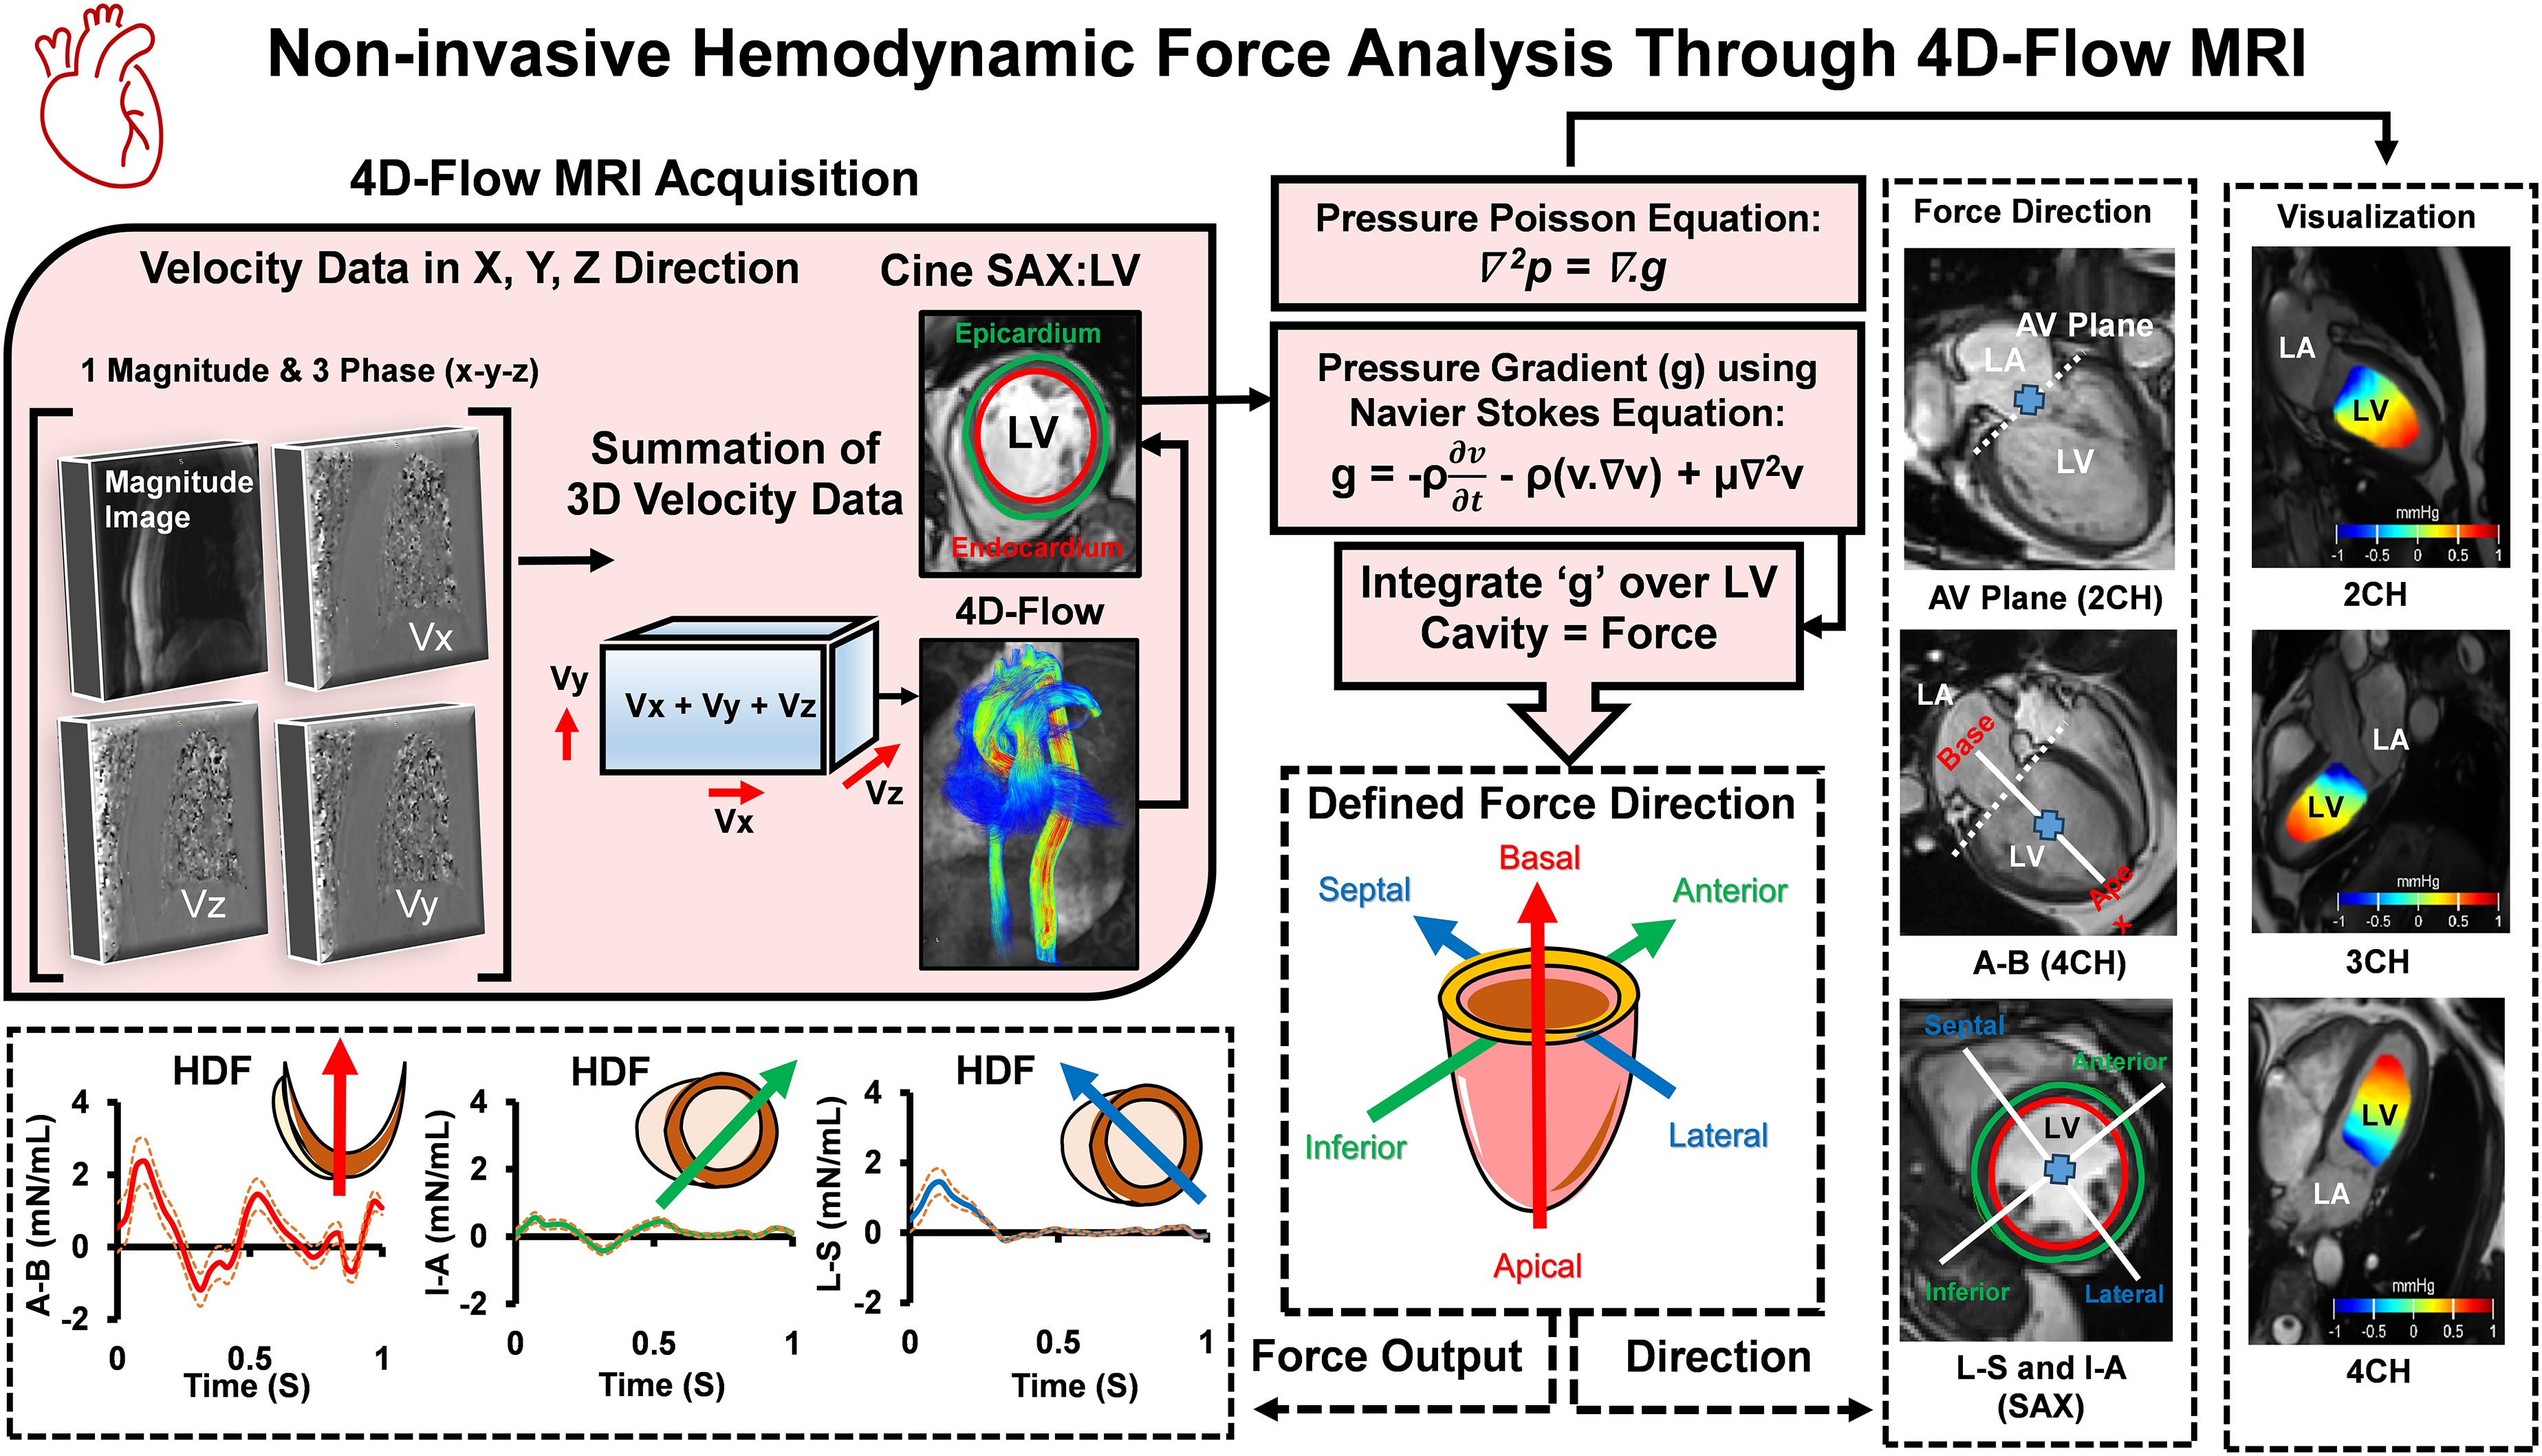
Method Overview for HDF Analysis. The 4D-Flow MRI Image Acquisition was Done Using a 3 T/MRI Scanner. The SAX Left Ventricular Segmentation was Done Automatically Using the “Segment” Software. Then, the Pressure Gradients (g) Were Calculated by the Navier-Stokes Equation and Integrated Over the LV Cavity in 3 Directions (Lateral-Septal, L-S; inferior-Anterior, I-A; Apical-Basal, A-B; Manually Placed) to Calculate the HDF. MRI, Magnetic Resonance Imaging; HDF, Hemodynamic Force; SAX, Short Axis; 3D, 3-Dimensional; 4D, 4-Dimensional; LV, Left Ventricle; LA, Left Atrium; CH, Chamber; AV, Atrioventricular; 4D-Flow MRI, 4-Dimensional-Flow Magnetic Resonance Imaging. The Orange Dotted Line Denotes the Positive-Negative Standard Deviation of Average Forces.
Left ventricular segmentation was performed using an automatic algorithm available in the “Segment” software package. Cine short-axis images were utilized, and segmentation was computed across the entire cardiac cycle using a deformable model and expectation-maximization method. Minor manual corrections were applied as needed, predominantly in basal slices. The LV segmentation delineates the endocardial boundary while excluding papillary muscles and trabeculae. Additionally, the epicardial boundary was manually traced at end-diastole and end-systole to ensure consistency of LVM as a quality check.
Hemodynamic force was calculated from pressure gradients (equation (1)) along with 3 axes, using a spatial reference system originating at the atrioventricular (AV) plane. Spatial and temporal derivatives for the pressure gradient calculation were computed using centered finite differences on the 4D-flow MRI grid, with one-sided differences applied at the boundaries to maintain Neumann boundary conditions. The orientation of the heart was defined along with 3 orthogonal directions. First, the apical-basal (A-B) axis was established perpendicular to the AV plane (determined from long-axis images). Second, the lateral-septal (L-S) axis was perpendicular to the A-B axis and aligned with the LV outflow tract (parallel to the 3-chamber view). Finally, the inferior-anterior (I-A) axis was determined as orthogonal to the A-B and L-S axes. All directions were manually defined. The basal location was defined as the slice showing the full ventricle with an identifiable AV plane, and the apical location was defined as the most distal slice with a visible ventricular cavity. Finally, a standardized time axis was created to compare the heart displacement function among subjects with different heart rates. This was achieved by linearly resampling the force curves for systole and diastole separately, which has been described previously.
9
Systole was defined from the ECG R-wave until flow in the aortic root ceased and transmitral flow commenced at the AV plane, with diastole defined as the period thereafter. In this study, we have considered the peak systolic (PS), peak diastolic (PD), E-W, and A-W HDF. Systolic or diastolic peak force was identified as the maximum absolute force value on the HDF curve during their respective phase. E-wave and A-wave forces were defined as the maximum absolute forces during the early rapid filling (E-wave) and atrial contraction (A-wave) phases, respectively. The E-wave phase was identified from the onset of rapid diastolic filling until its peak, and the A-wave phase was defined as the period of atrial contraction before ventricular systole (reflecting the relaxation state of the LV). The pressure field was calculated for visualization purposes by solving the Pressure Poisson Equation (PPE) using a previously published multigrid solver (antigradient2.c, available at https://github.com/GunnarFarneback/spatial_domain_toolbox). The computation began on a coarse grid, with the solution progressively refined until reaching the original MRI velocity data. The PPE, derived from the Navier-Stokes equations (equation (1)) for incompressible flow (equation (2)), was used to compute the distribution of pressure gradients based on the known velocity field:

where ∇ denotes the divergence operator and v is the velocity field. Then the PPE was derived by taking the divergence of the momentum equation, leading to simplified equation (2). Equation (3) establishes a relationship between the Laplacian of the pressure (p) and the velocity field (v), enabling the computation of the pressure gradient distribution.
23
In this work, the reported HDF is normalized to LV volume:

Statistical Design
All statistical analyses were performed using IBM SPSS Statistics for Windows, version 29 (IBM Corp). Data normality was assessed using the Shapiro-Wilk test. For normally distributed data, an independent sample t test was used to evaluate significant mean differences between controls and MR patients. The one-way ANOVA was conducted to compare differences among the 3 MR severity levels, followed by Bonferroni post hoc tests for pairwise comparisons. For non-normally distributed data, the Mann-Whitney U test was used to assess differences between controls and MR patients, and the Kruskal-Wallis test was applied to evaluate differences across severity levels, with nonparametric pairwise comparisons performed as needed. Correlation analyses were conducted using Spearman rank-order correlation coefficient (ρ) for non-normally distributed data and Pearson correlation coefficient (r) for normally distributed data to investigate the relationship between HDF and LV function in MR patients. For the interpretation of coefficient values generated by correlations, a standard convention was used as follows: very strong (≥0.7), strong (0.4-0.69), moderate (0.3-0.39), weak (0.2-0.29), and no/or negligible relationship (0.01-0.19), applicable to both positive and negative correlations. 24 Linear regression analysis was employed to examine the relationship between LV function and HDF in MR patients. An ordinal regression model assessed the predictive value of HDF for determining MR severity. All assumptions, including independence of observations, appropriate sample sizes, and variable types, were verified before conducting the nonparametric tests. Statistical significance was set at a P-value of less than .05 (2 tailed). We performed detailed power and sample size calculations for each statistical test used in the study. For instance, the independent t test comparing controls and MR patients (assuming an effect size of 0.8, α = 0.05, and 80% power) indicated that a minimum of 25 participants per group would be required. In addition, the one-way ANOVA conducted among 3 MR severity groups, assuming Cohen f ∼ 0.8, suggested that 8 participants per group would suffice. 25 However, our available sample size for healthy controls and moderate-severe MR did not meet this ideal threshold. We recommend that future studies incorporate larger cohorts to improve statistical power and the generalizability of the findings.
Results
Characteristics of the Study Population
Table 1 presents the baseline characteristics of the study population, comparing healthy controls (n = 15, men = 8, 53%) and MR patients (n = 26, men = 14, 54%). Additionally, we have provided subgroup analysis in Supplemental materials (Appendix Table T1) regarding demographic characteristics across MR severity groups.
Baseline Characteristics and Cardiac Function of the Study Population.a
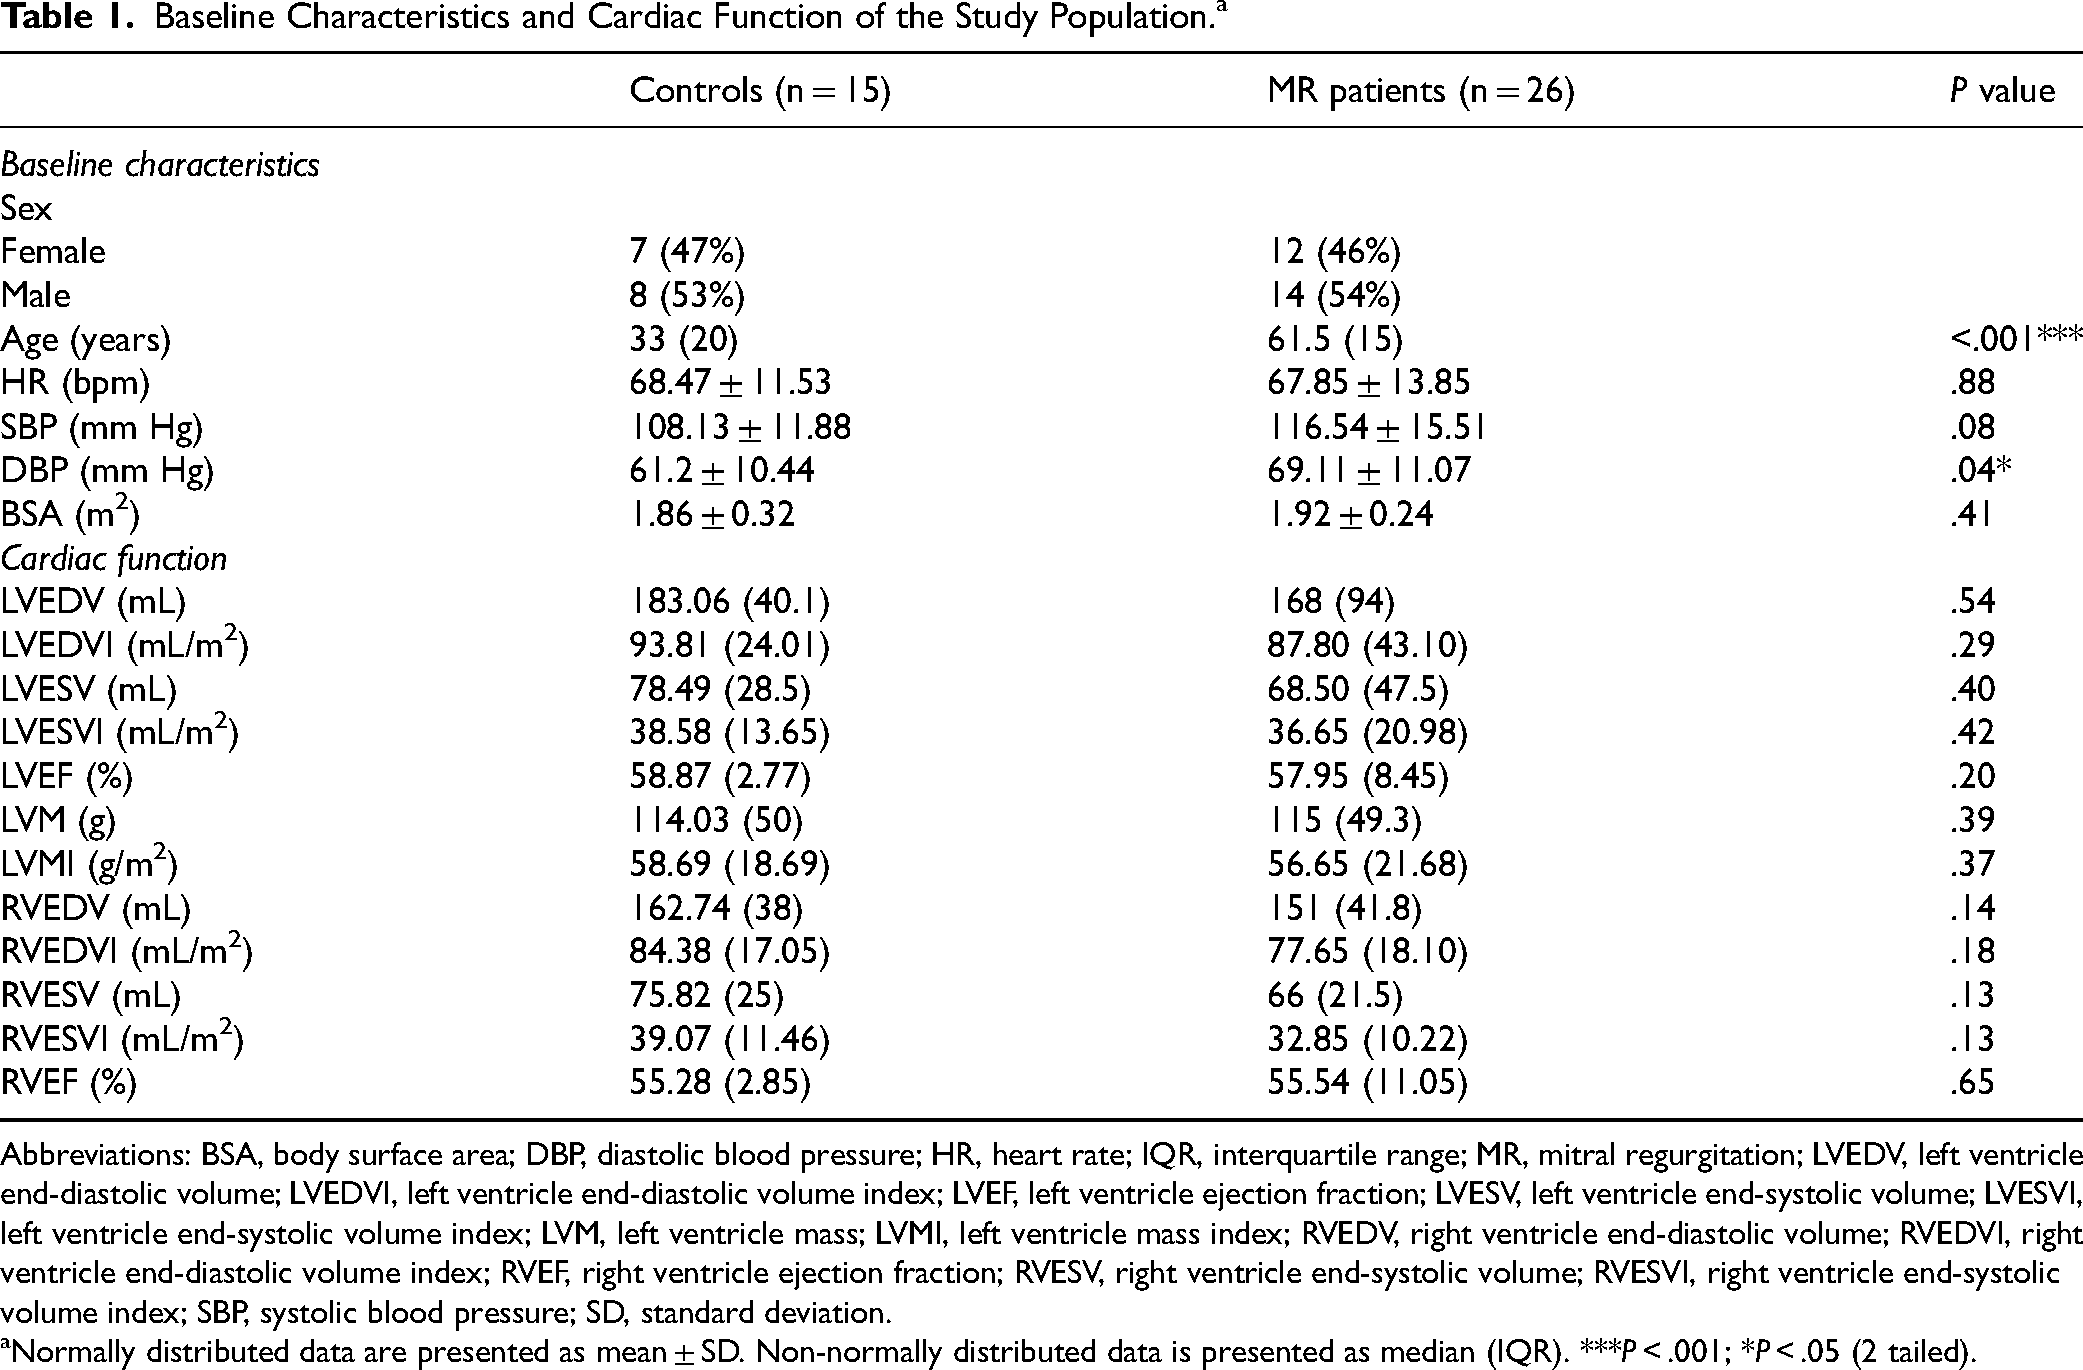
Abbreviations: BSA, body surface area; DBP, diastolic blood pressure; HR, heart rate; IQR, interquartile range; MR, mitral regurgitation; LVEDV, left ventricle end-diastolic volume; LVEDVI, left ventricle end-diastolic volume index; LVEF, left ventricle ejection fraction; LVESV, left ventricle end-systolic volume; LVESVI, left ventricle end-systolic volume index; LVM, left ventricle mass; LVMI, left ventricle mass index; RVEDV, right ventricle end-diastolic volume; RVEDVI, right ventricle end-diastolic volume index; RVEF, right ventricle ejection fraction; RVESV, right ventricle end-systolic volume; RVESVI, right ventricle end-systolic volume index; SBP, systolic blood pressure; SD, standard deviation.
Normally distributed data are presented as mean ± SD. Non-normally distributed data is presented as median (IQR). ***P < .001; *P < .05 (2 tailed).
The Pattern of Intracardiac LV-HDF Between Controls and MR Patients
Table 2 demonstrates the differences in HDF between controls and patients with MR. Figure 2A visually illustrates the mean difference, while Figure 2B shows the distribution of average HDF in one cardiac cycle among all controls and MR patients. The changes in the trend correspond across 4 distinct phases. Figure 2C displays the HDF in a 2-chamber view for a 65-year-old male patient with trivial-to-mild MR.
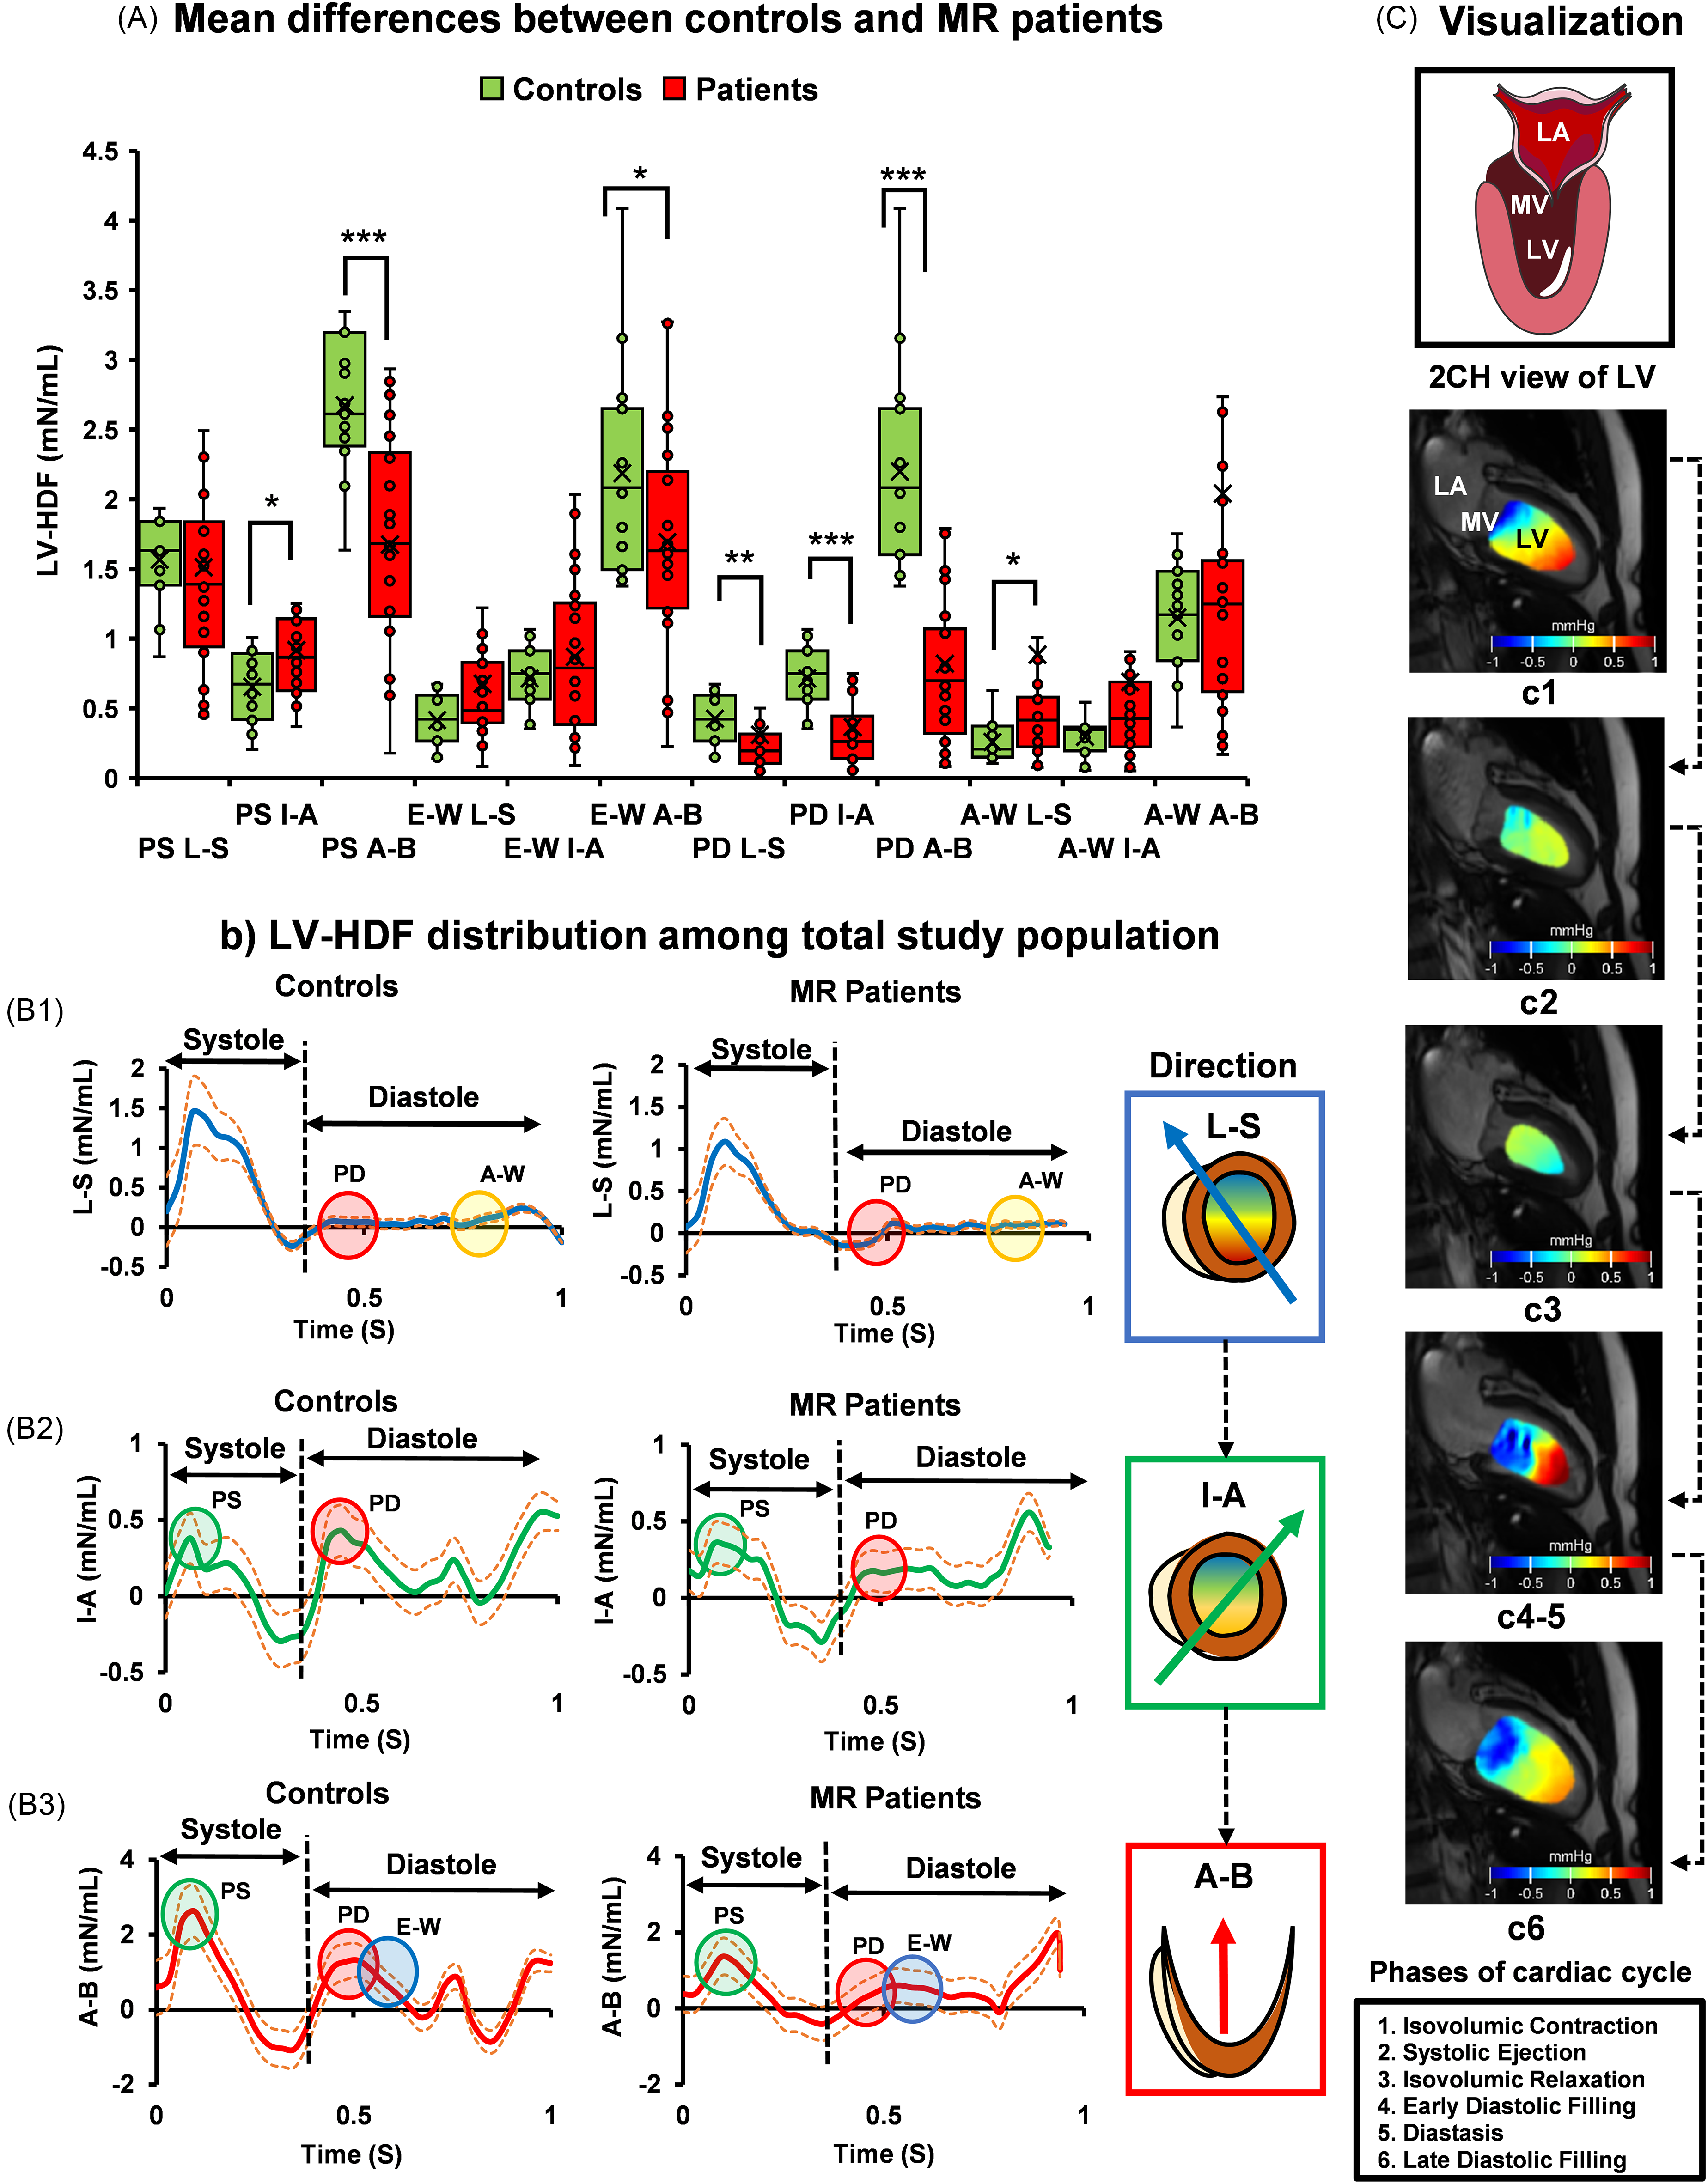
The Differences in Hemodynamic Forces Between Controls and MR Patients. Panel (A) Shows the Mean Differences Between Controls and MR Patients. Panel (B) Shows the Average HDF Distribution Over a Cardiac Cycle. the Indicator Circles Demonstrate the Differences That Emerged at the Specific Cardiac Phases. Panel (C) Illustrates the Pressure Gradients in the LV for One Cardiac Cycle in a 65-Year-old Male Patient with Trivial-Mild MR. The Heatmap Demonstrates How the Pressure Gradient Changes in Different Phases of the Cardiac Cycle (Denoted by c1-c6). ***P < .001; **P < .01; *P < .05. All the Mean and Median Values are Included in Table 2. LV, Left Ventricle; MR, Mitral Regurgitation; LA, Left Atrium; MV, Mitral Valve; HDF, Hemodynamic Force; PS, Peak Systole; L-S, Lateral-Septal; I-A, Inferior-Anterior; A-B, Apex-Base; E-W, E-wave; PD, Peak Diastole; A-W, A-wave. Circles: Green = Early Systole (PS); Red = Diastole (PD); Blue = Early Diastole (E-W); Yellow = End-Diastole (A-W). Lines: Blue Line = Lateral-Septal; Green Line = Inferior-Anterior; Red Line = Apex-Base; Orange Dotted Line = Positive-Negative Standard Deviation. Box Plots Display Median and Interquartile Range; Means (×) are Overlaid.
Differences in HDF Between Controls and MR Patients.a
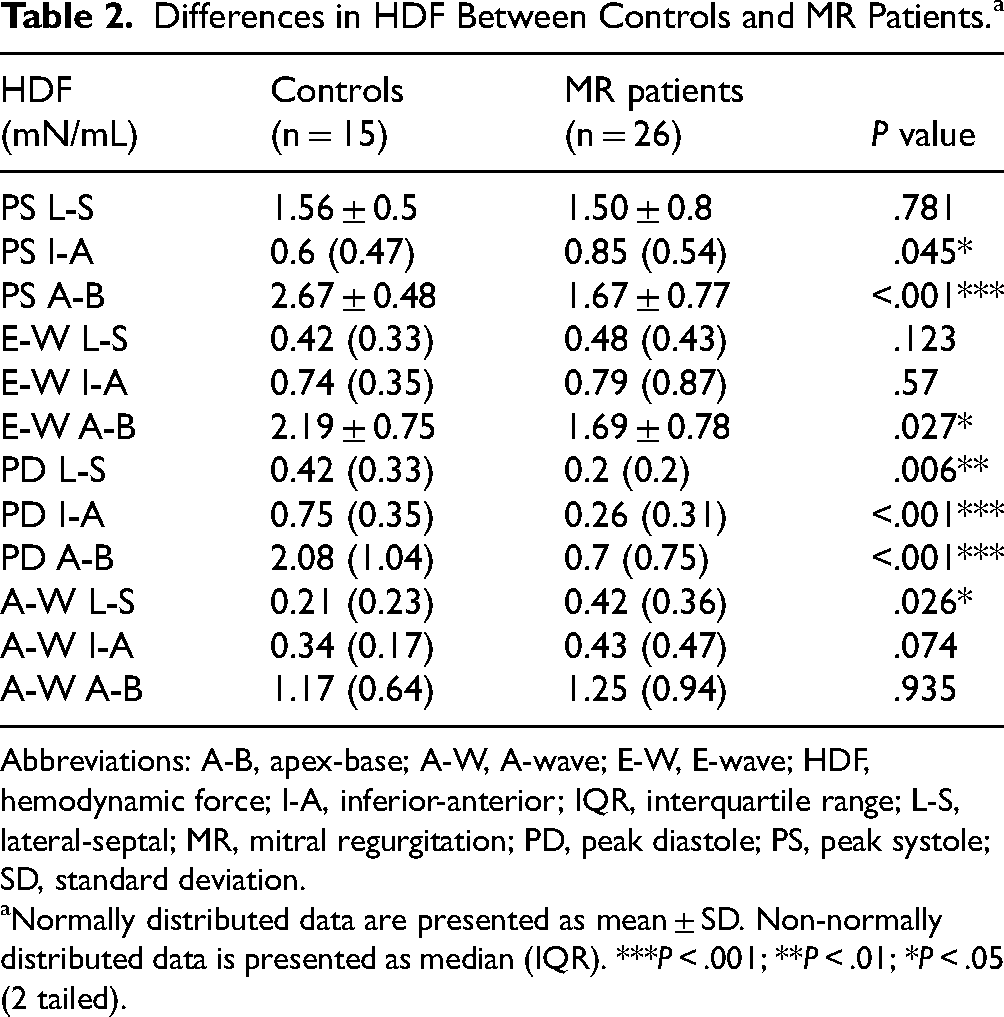
Abbreviations: A-B, apex-base; A-W, A-wave; E-W, E-wave; HDF, hemodynamic force; I-A, inferior-anterior; IQR, interquartile range; L-S, lateral-septal; MR, mitral regurgitation; PD, peak diastole; PS, peak systole; SD, standard deviation.
Normally distributed data are presented as mean ± SD. Non-normally distributed data is presented as median (IQR). ***P < .001; **P < .01; *P < .05 (2 tailed).
The pattern of intracardiac LV-HDF and LV function among MR severity
Table 3 shows the differences in intracardiac HDF, LV function, and MR indices (MRV and RF) among MR patients with diverse severity. The MR group (n = 26) was categorized into 3 severity levels as follows: trivial-mild (n = 9), mild-moderate (n = 11), and moderate-severe (n = 6). The pairwise comparison demonstrated a 43.33% and 50.64% increment in PS A-B, E-W, A-B among moderate-severe MR compared to trivial-mild MR (P = .025, .008, respectively). Conversely, A-W I-A showed a 49.25% increase in moderate-severe MR compared to mild-moderate MR (P = .029). Appendix Figure A1A and B demonstrates the differences in HDF between MR severities. The post hoc tests revealed differences between the trivial-mild and mild-moderate MR for LVEDV index (LVEDVI), LVEDV (Appendix Figure A1C, P = .024, .029, respectively), and LVM index (LVMI), LVM (Appendix Figure A1D, P = .003, .007, respectively). The test also revealed differences between the trivial-mild and moderate-severe groups for LVEDVI and LVEDV (Appendix Figure A1C, P = .012, .009, respectively). Additionally, Figure 3 demonstrates the pairwise differences in RF (%, 3a) and MRV (mL, 3b) among MR severities.
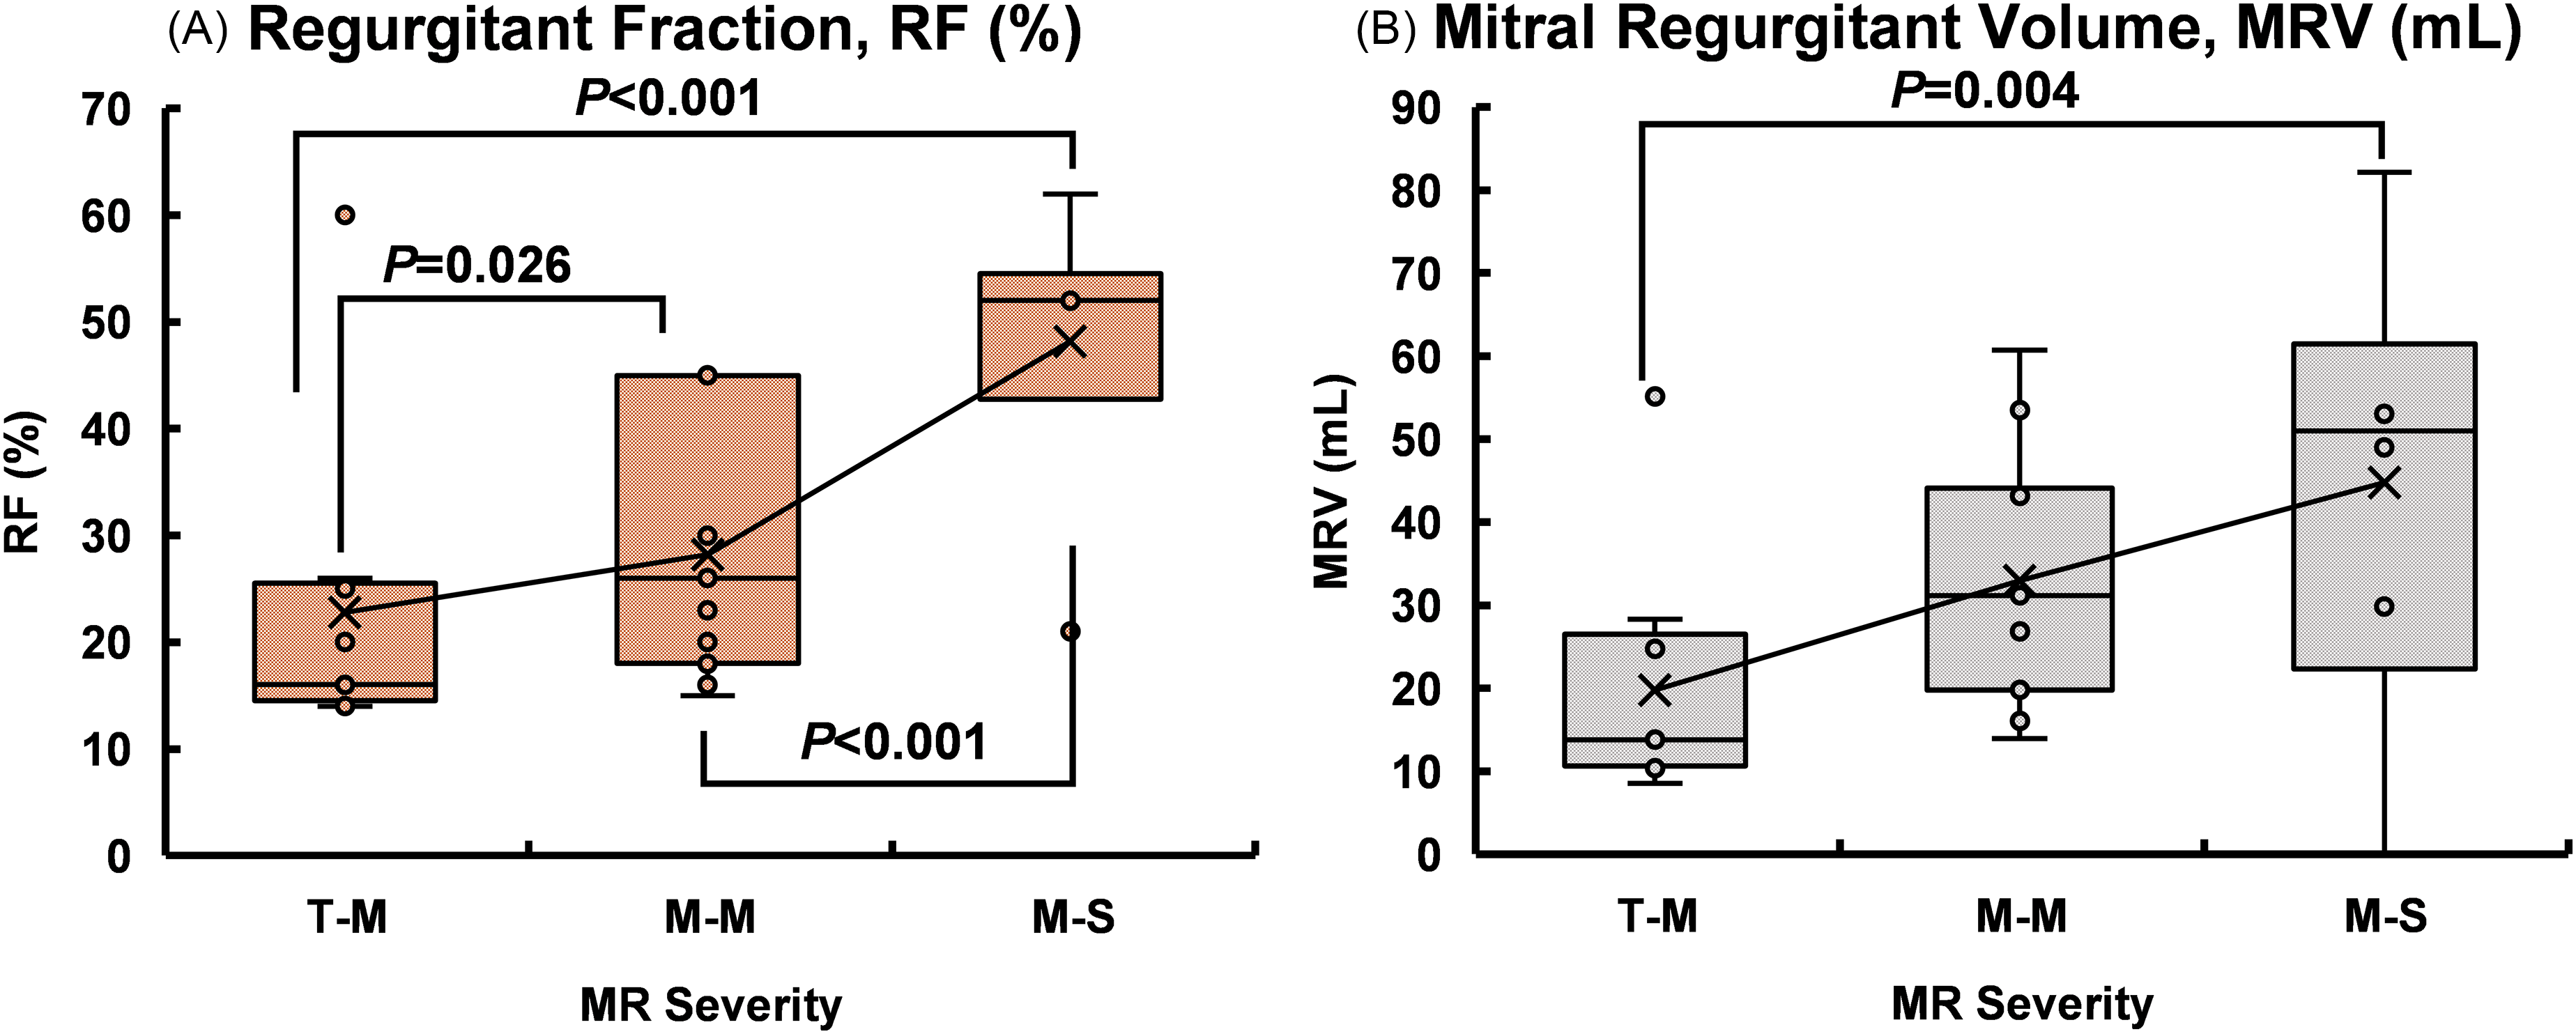
The Differences in Regurgitation Fraction (RF, %) and Mitral Regurgitant Volume (MRV, mL) among MR Severities. MR Indicates Mitral Regurgitation; T-M, Trivial-Mild; M-M, Mild-Moderate; M-S, Moderate-Severe. P < .05 was Considered Statistically Significant. Trivial-Mild, n = 9; Mild-Moderate, n = 11, Moderate-Severe, n = 6. Box Plots Display Median and Interquartile Range; Means (×) are Overlaid. MRV, Mitral Regurgitant Volume.
Differences in HDF and LV Function among MR Severity Levels.a
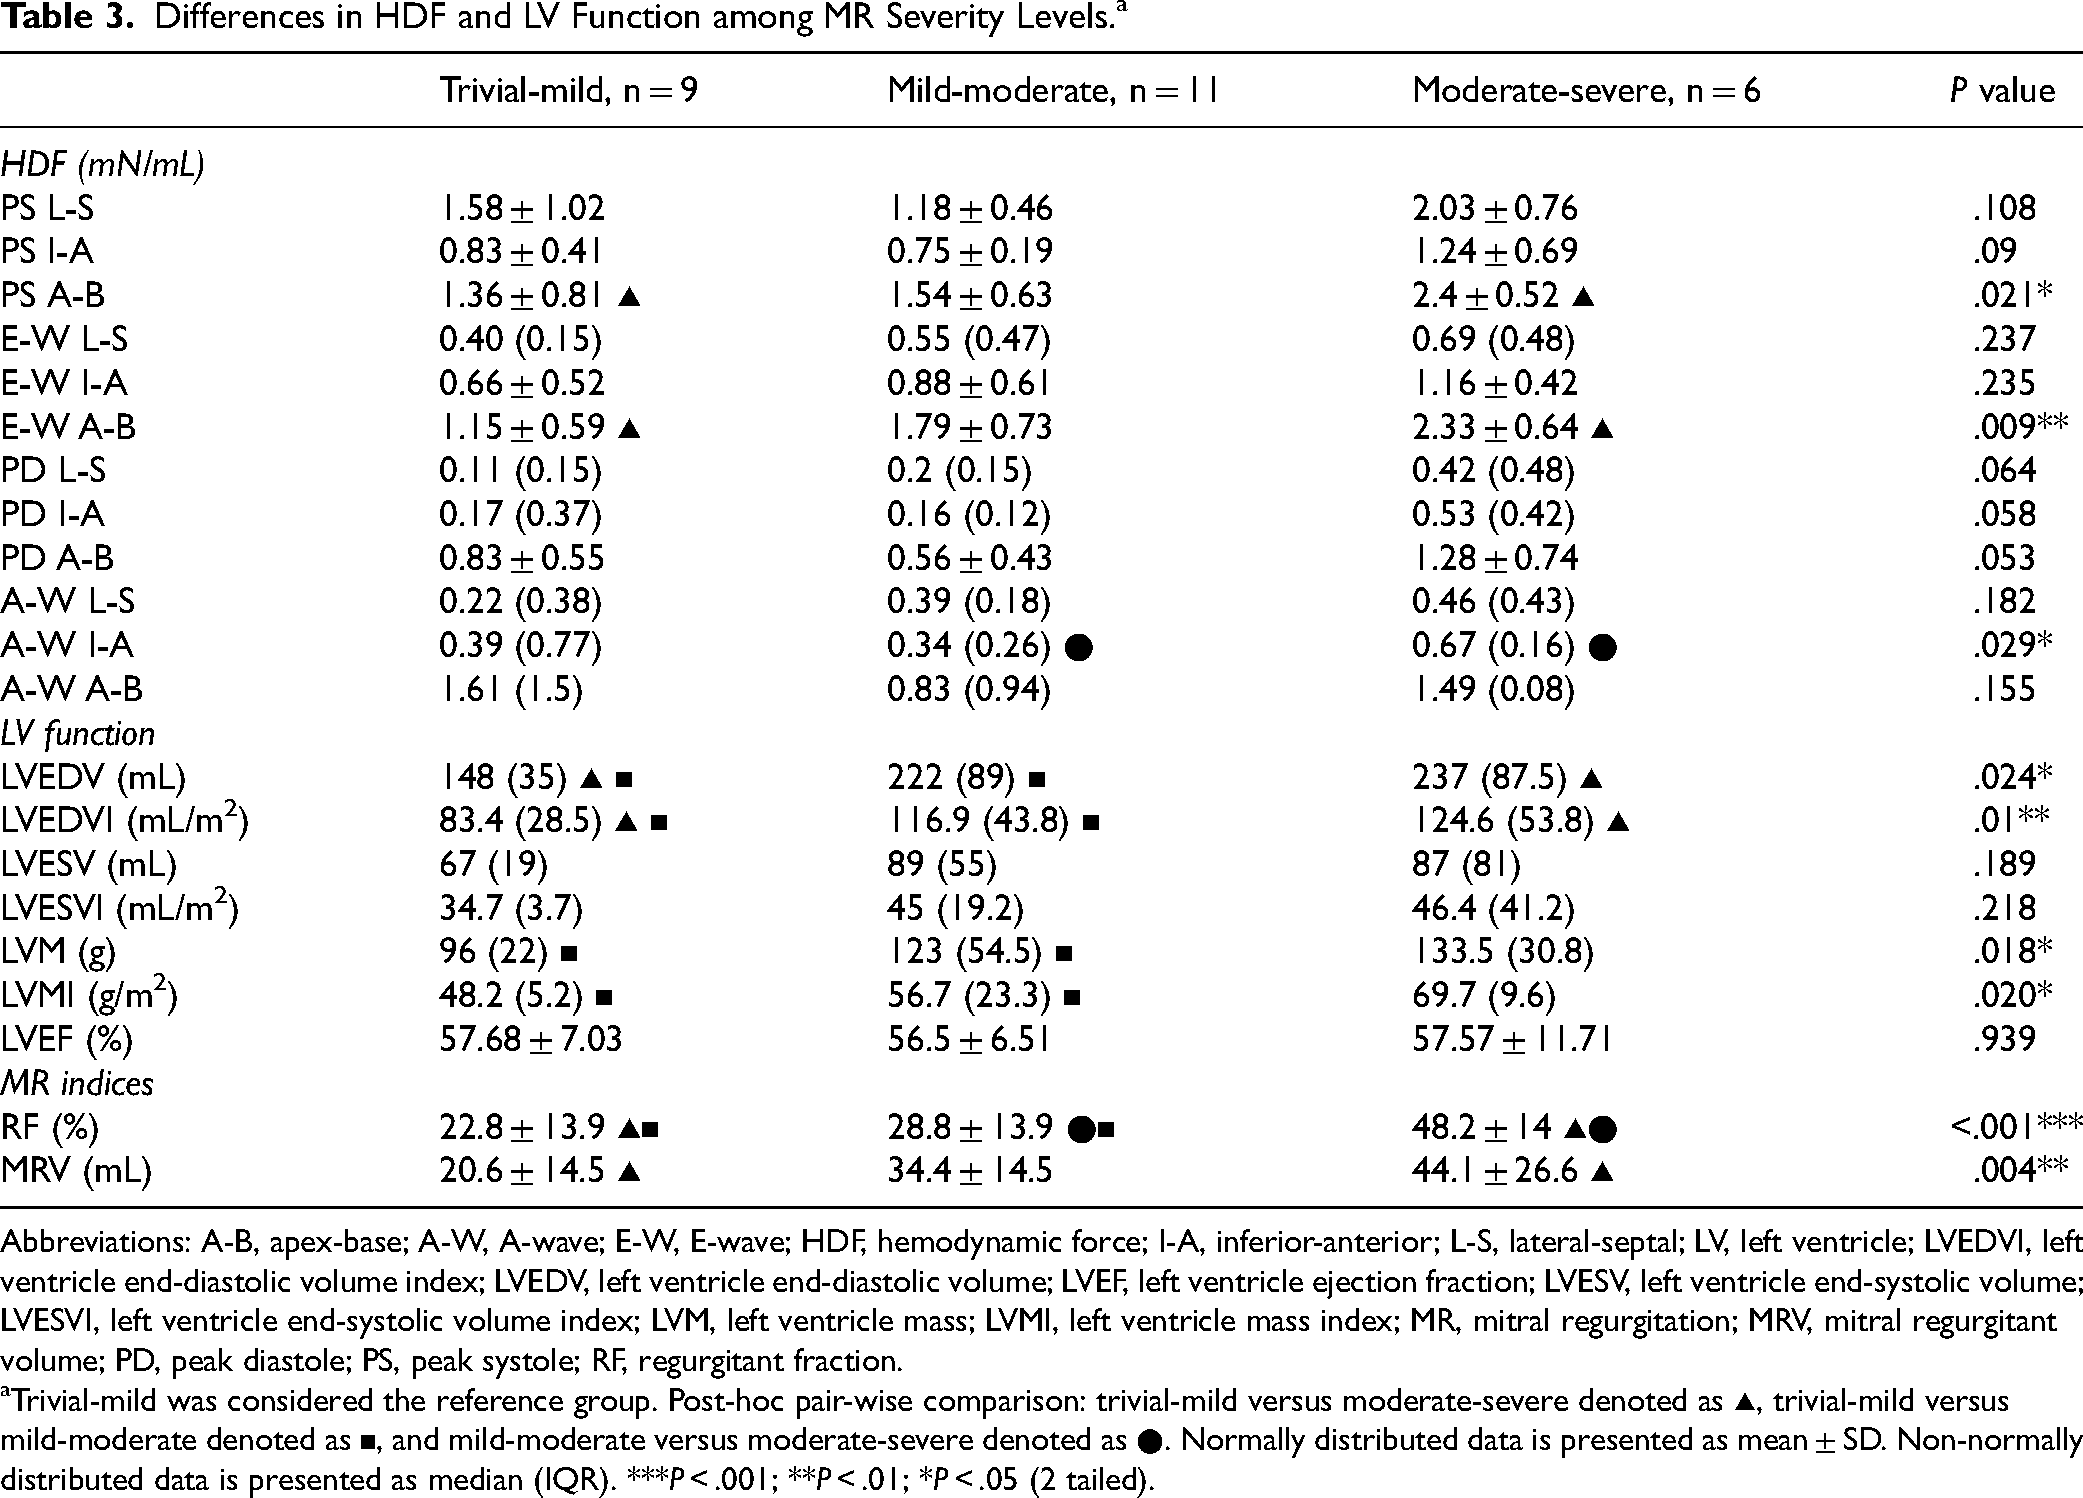
Abbreviations: A-B, apex-base; A-W, A-wave; E-W, E-wave; HDF, hemodynamic force; I-A, inferior-anterior; L-S, lateral-septal; LV, left ventricle; LVEDVI, left ventricle end-diastolic volume index; LVEDV, left ventricle end-diastolic volume; LVEF, left ventricle ejection fraction; LVESV, left ventricle end-systolic volume; LVESVI, left ventricle end-systolic volume index; LVM, left ventricle mass; LVMI, left ventricle mass index; MR, mitral regurgitation; MRV, mitral regurgitant volume; PD, peak diastole; PS, peak systole; RF, regurgitant fraction.
Trivial-mild was considered the reference group. Post-hoc pair-wise comparison: trivial-mild versus moderate-severe denoted as ▴, trivial-mild versus mild-moderate denoted as ▪, and mild-moderate versus moderate-severe denoted as ●. Normally distributed data is presented as mean ± SD. Non-normally distributed data is presented as median (IQR). ***P < .001; **P < .01; *P < .05 (2 tailed).
Influence of MR on LV-HDF and LV-Function
Table 4 illustrates Spearman rank-order correlation coefficient between (1) HDF and MR severity, and (2) LV function and MR severity. Appendix Figure A2 visually represents the significant results. A positive correlation emerged between the MR severity levels and 4 HDF parameters: PS A-B, E-W I-A, E-W A-B, and PD L-S, and the following LV function: LVEDVI, LVMI, LVEDV, and LVM. Notably, both PS A-B and E-W A-B exhibited differences between controls and MR patients and across MR severity levels (see Tables 2 and 3). In contrast, PD L-S differed only between controls and MR patients (see Table 2). Additionally, LV function (LVEDV, LVEDVI, LVM, LVMI) showed variations across MR severity levels (see Table 3). A full study was conducted to understand the in-depth relationship between HDF and LV function among MR patients. Significant findings emerged from the regression analysis, elucidating the relationship between HDF (PS A-B) and LV function. The negative coefficient indicates that an increase in PS A-B corresponds to a decrease in LVEF (P = .03). On the other hand, a notable positive association was found between LVMI and PS A-B (P = .04). This finding suggests that an increased PS A-B is associated with elevated mass and diminished EF. To account for the age differences, a multivariate linear regression analysis adjusting for age was conducted among MR patients. The association between PS A-B and LV function (LVEF, LVMI) remained statistically significant (R2 = −0.79, F = 6.25, P = .038; R2 = 0.71, F = 7.30, P = .025, respectively) after age adjustment. Figure 4 illustrates the linear association between PS A-B and LV function (EF, LVMI) among MR patients. A visual illustration of the complete study is available in Appendix Figures A3 and A4. The full result is provided in the Appendix Table T2. Additionally, we investigated the correlation between HDF and continuous MR indices such as RF and MRV. The PS L-S, PS I-A, PD I-A, and PD A-B showed a negative correlation with MRV (r = −0.42, P = .035; r = −0.42, P = .034; ρ = −0.47, P = .015; r = −0.44, P = .023). Figure 5 illustrates the statistically significant result from the correlation analysis. Further, we analyzed the correlation among MR severities, and the full study is provided in Appendix Table T3.
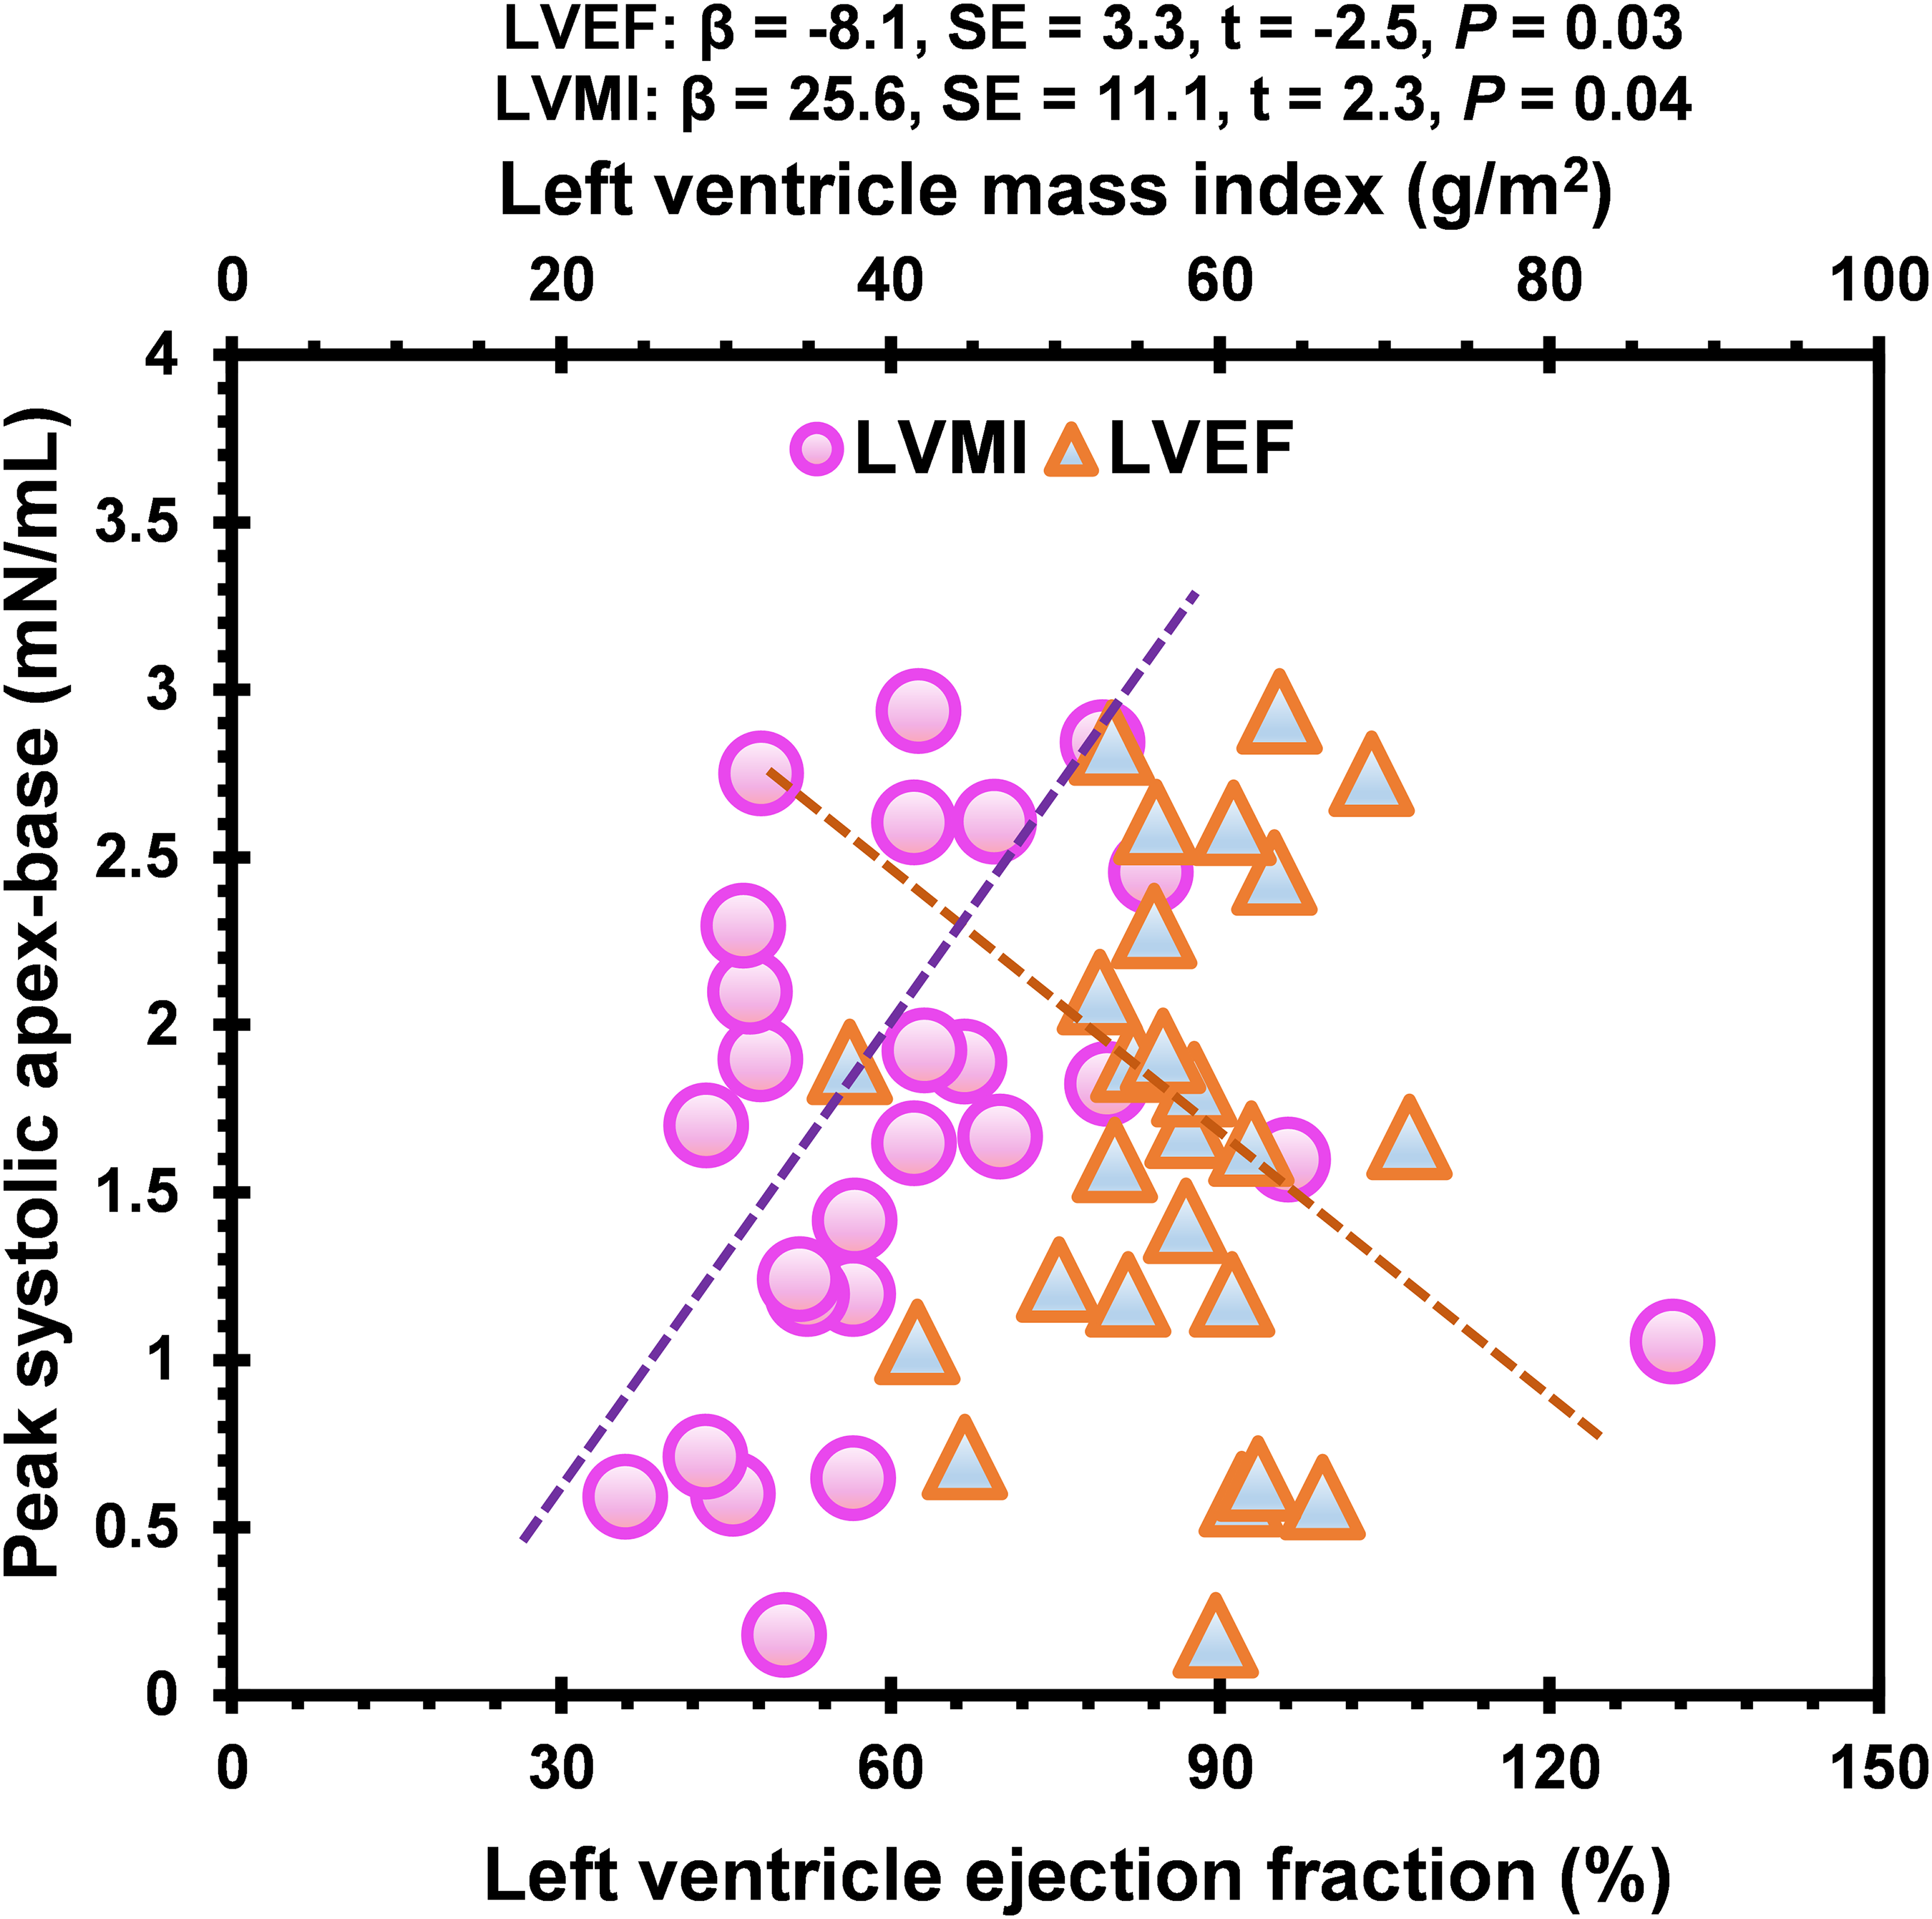
The Scatter Plot Illustrates the Linear Regression Between PS A-B HDF and LVMI, and LVEF among MR Patients. LVMI was Positively Associated, While LVEF Demonstrated a Negative Linear Relation with PS A-B. P < 0.05 was Considered Statistically Significant. PS A-B, Peak Systolic Apex-Base (mN/mL); LVEF, Left Ventricle Ejection Fraction (%); HDF, Hemodynamic Force; LVMI, Left Ventricle Mass index (g/m2); MR, Mitral Regurgitation; β, Beta Coefficient; SE, Standard Error; t, t value; HDF, Hemodynamic force. The Full Study is Demonstrated in Appendix Figures 3–4.
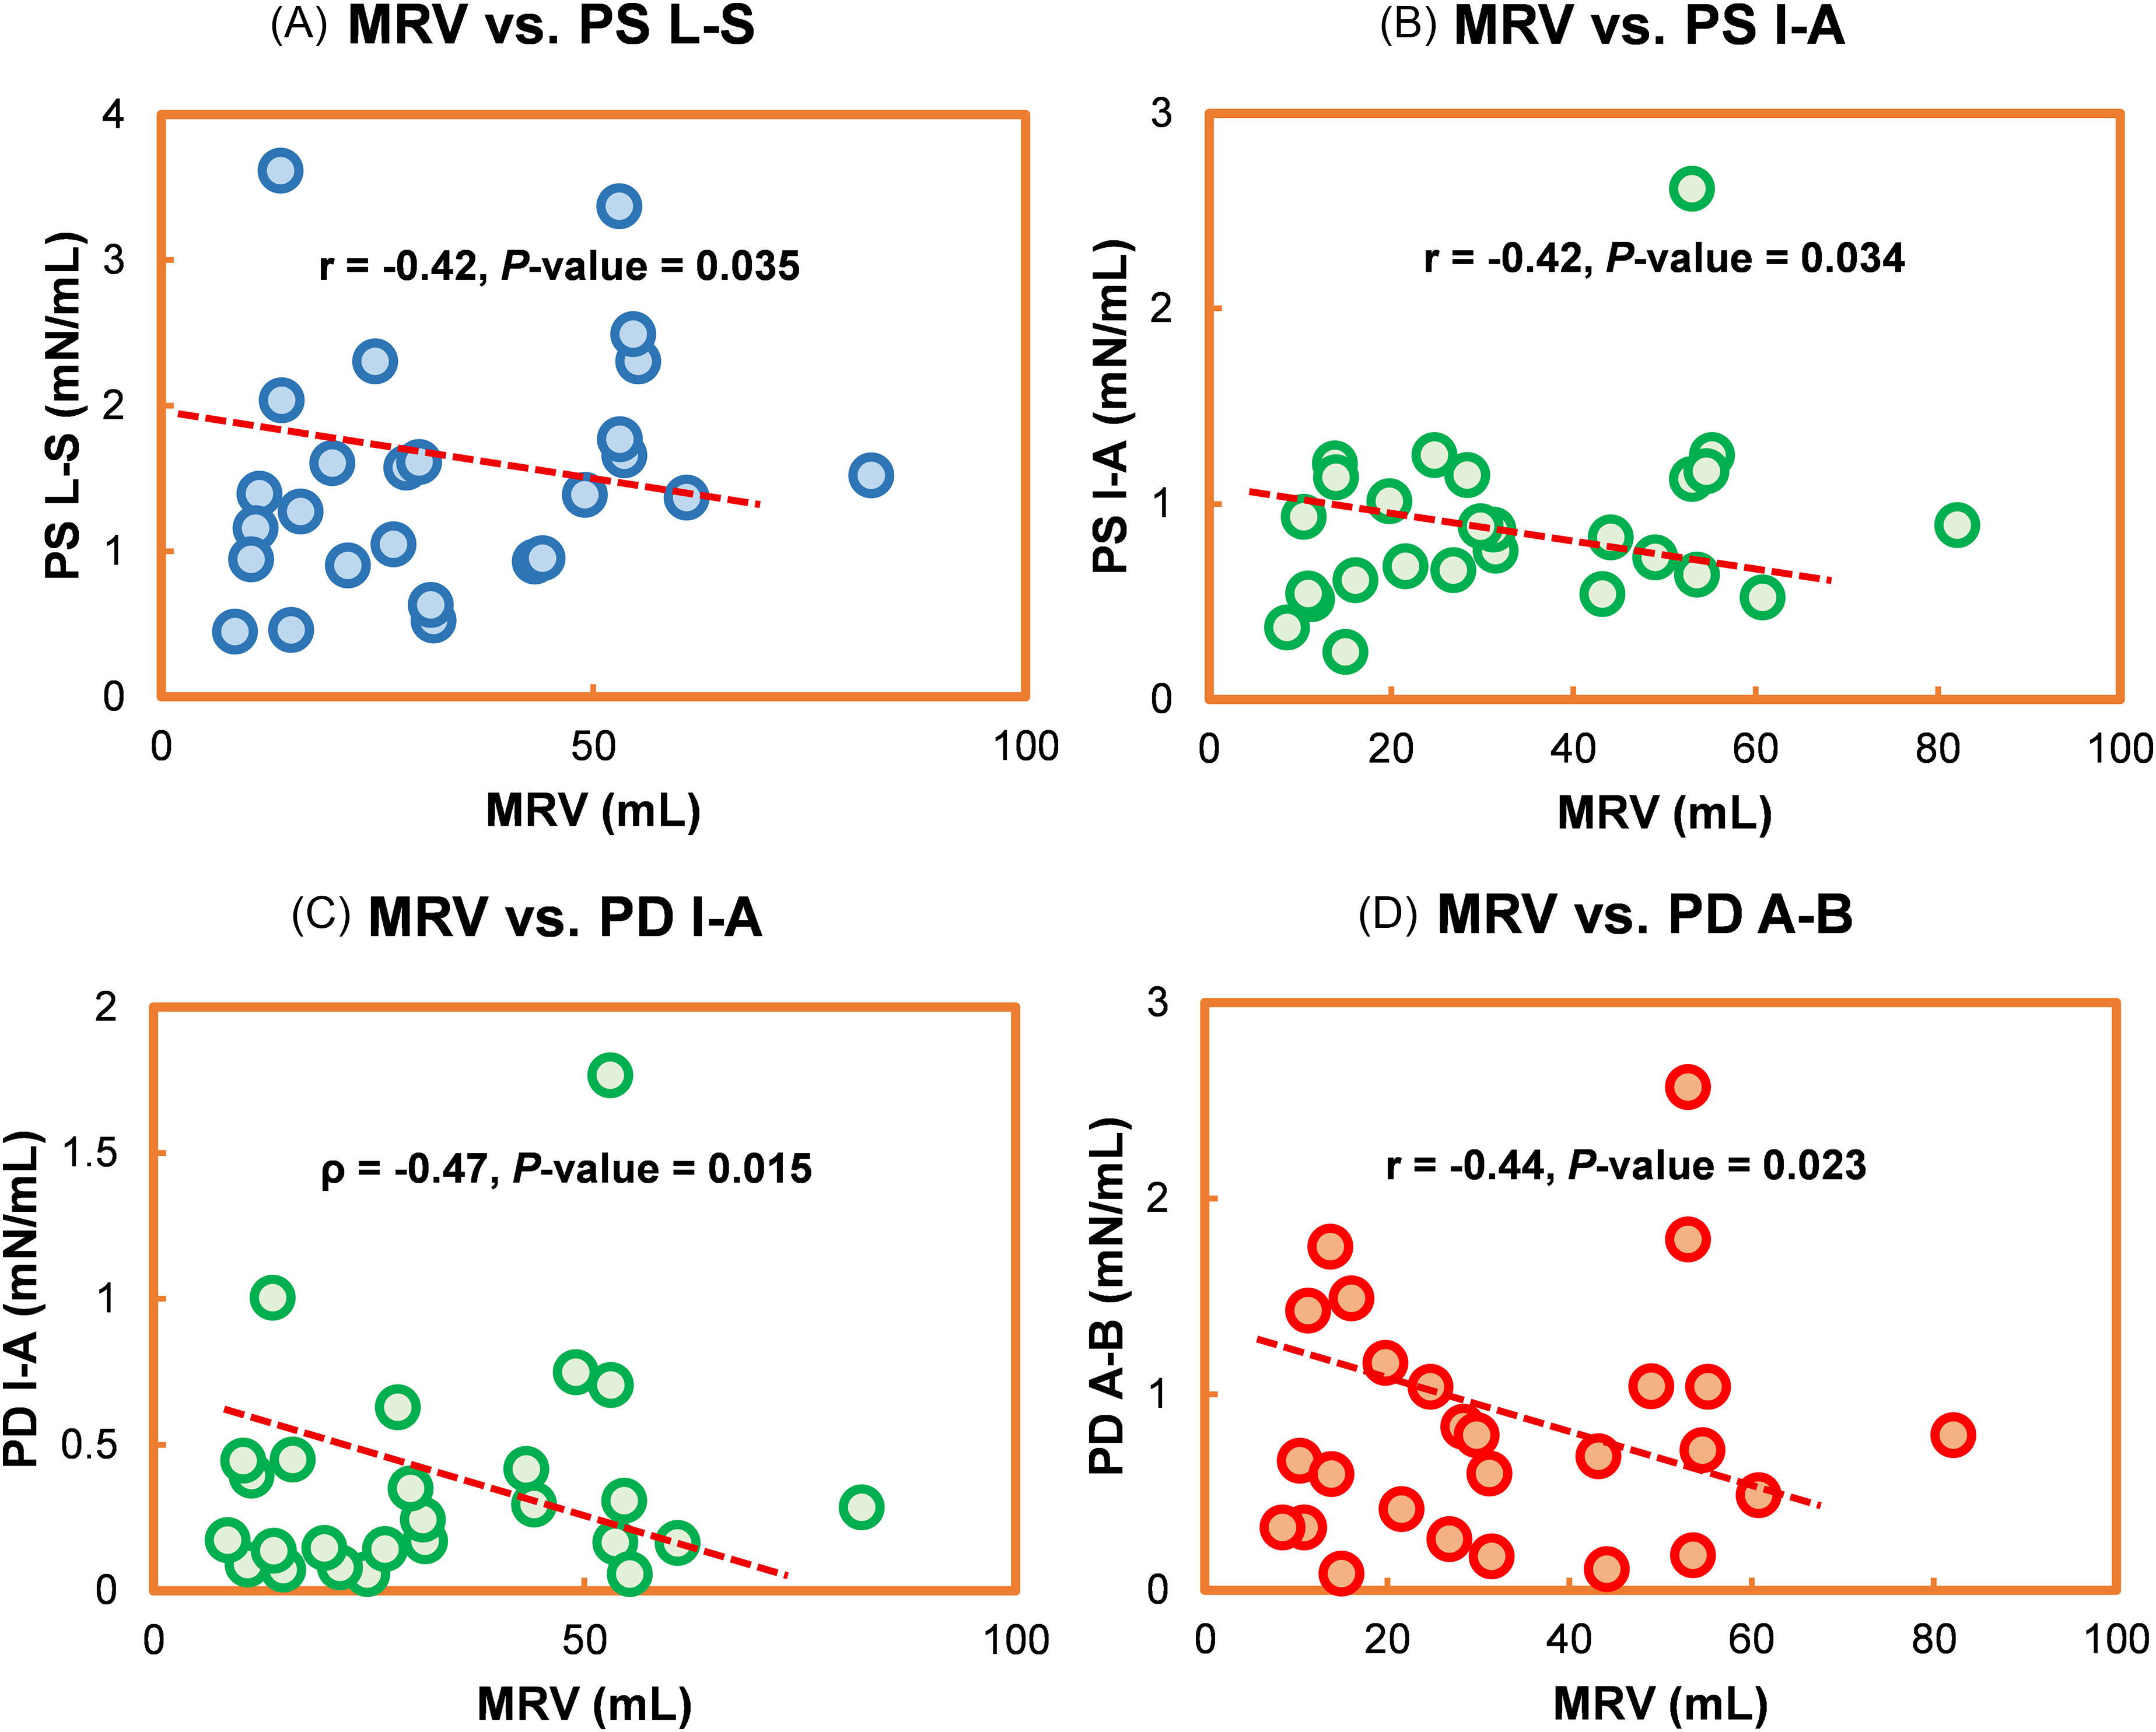
The Correlation Between MRV and HDF among MR Patients (n = 26). PS L-S, PS I-A, PD I-A, and PD A-B Demonstrated a Negative Correlation with MRV. P < .05 was Considered Statistically Significant. HDF, Hemodynamic Force; PS, Peak Systole; PD, Peak Diastole; L-S, Lateral-Septal; I-A, Inferior-Anterior; A-B, Apex-Base; MRV, Mitral Regurgitant Volume; MR, Mitral Regurgitation.
Correlation of LV Function and HDF with MR Severity.
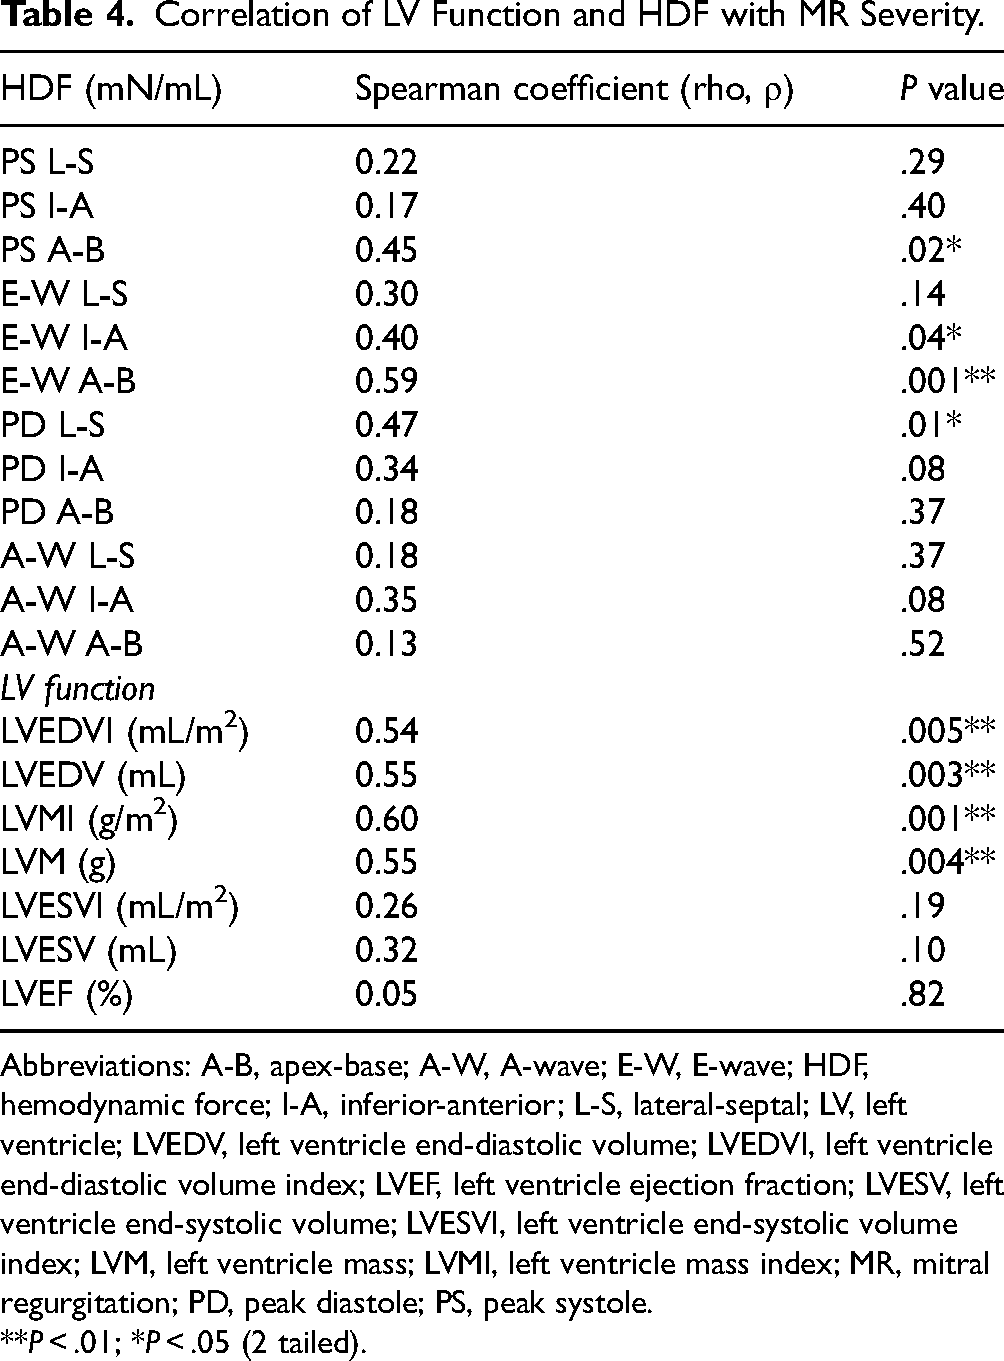
Abbreviations: A-B, apex-base; A-W, A-wave; E-W, E-wave; HDF, hemodynamic force; I-A, inferior-anterior; L-S, lateral-septal; LV, left ventricle; LVEDV, left ventricle end-diastolic volume; LVEDVI, left ventricle end-diastolic volume index; LVEF, left ventricle ejection fraction; LVESV, left ventricle end-systolic volume; LVESVI, left ventricle end-systolic volume index; LVM, left ventricle mass; LVMI, left ventricle mass index; MR, mitral regurgitation; PD, peak diastole; PS, peak systole.
**P < .01; *P < .05 (2 tailed).
Ordinal Regression Model
The ordinal regression model with a logit link function was employed to predict MR severity levels using PS, E-W, PD, and A-W HDF. Figure 6 visually demonstrates the outcome of all models, including significant predictors. Appendix Table T4 shows the overall study results. The ordinal regression models with PS and E-W HDF showed promise for predicting MR severity, particularly through the apical-basal direction. In contrast, the PD model warrants further exploration of diastolic parameters, and the A-W model has limited clinical relevance. The supplementary file contains a detailed explanation of the full ordinal regression model.
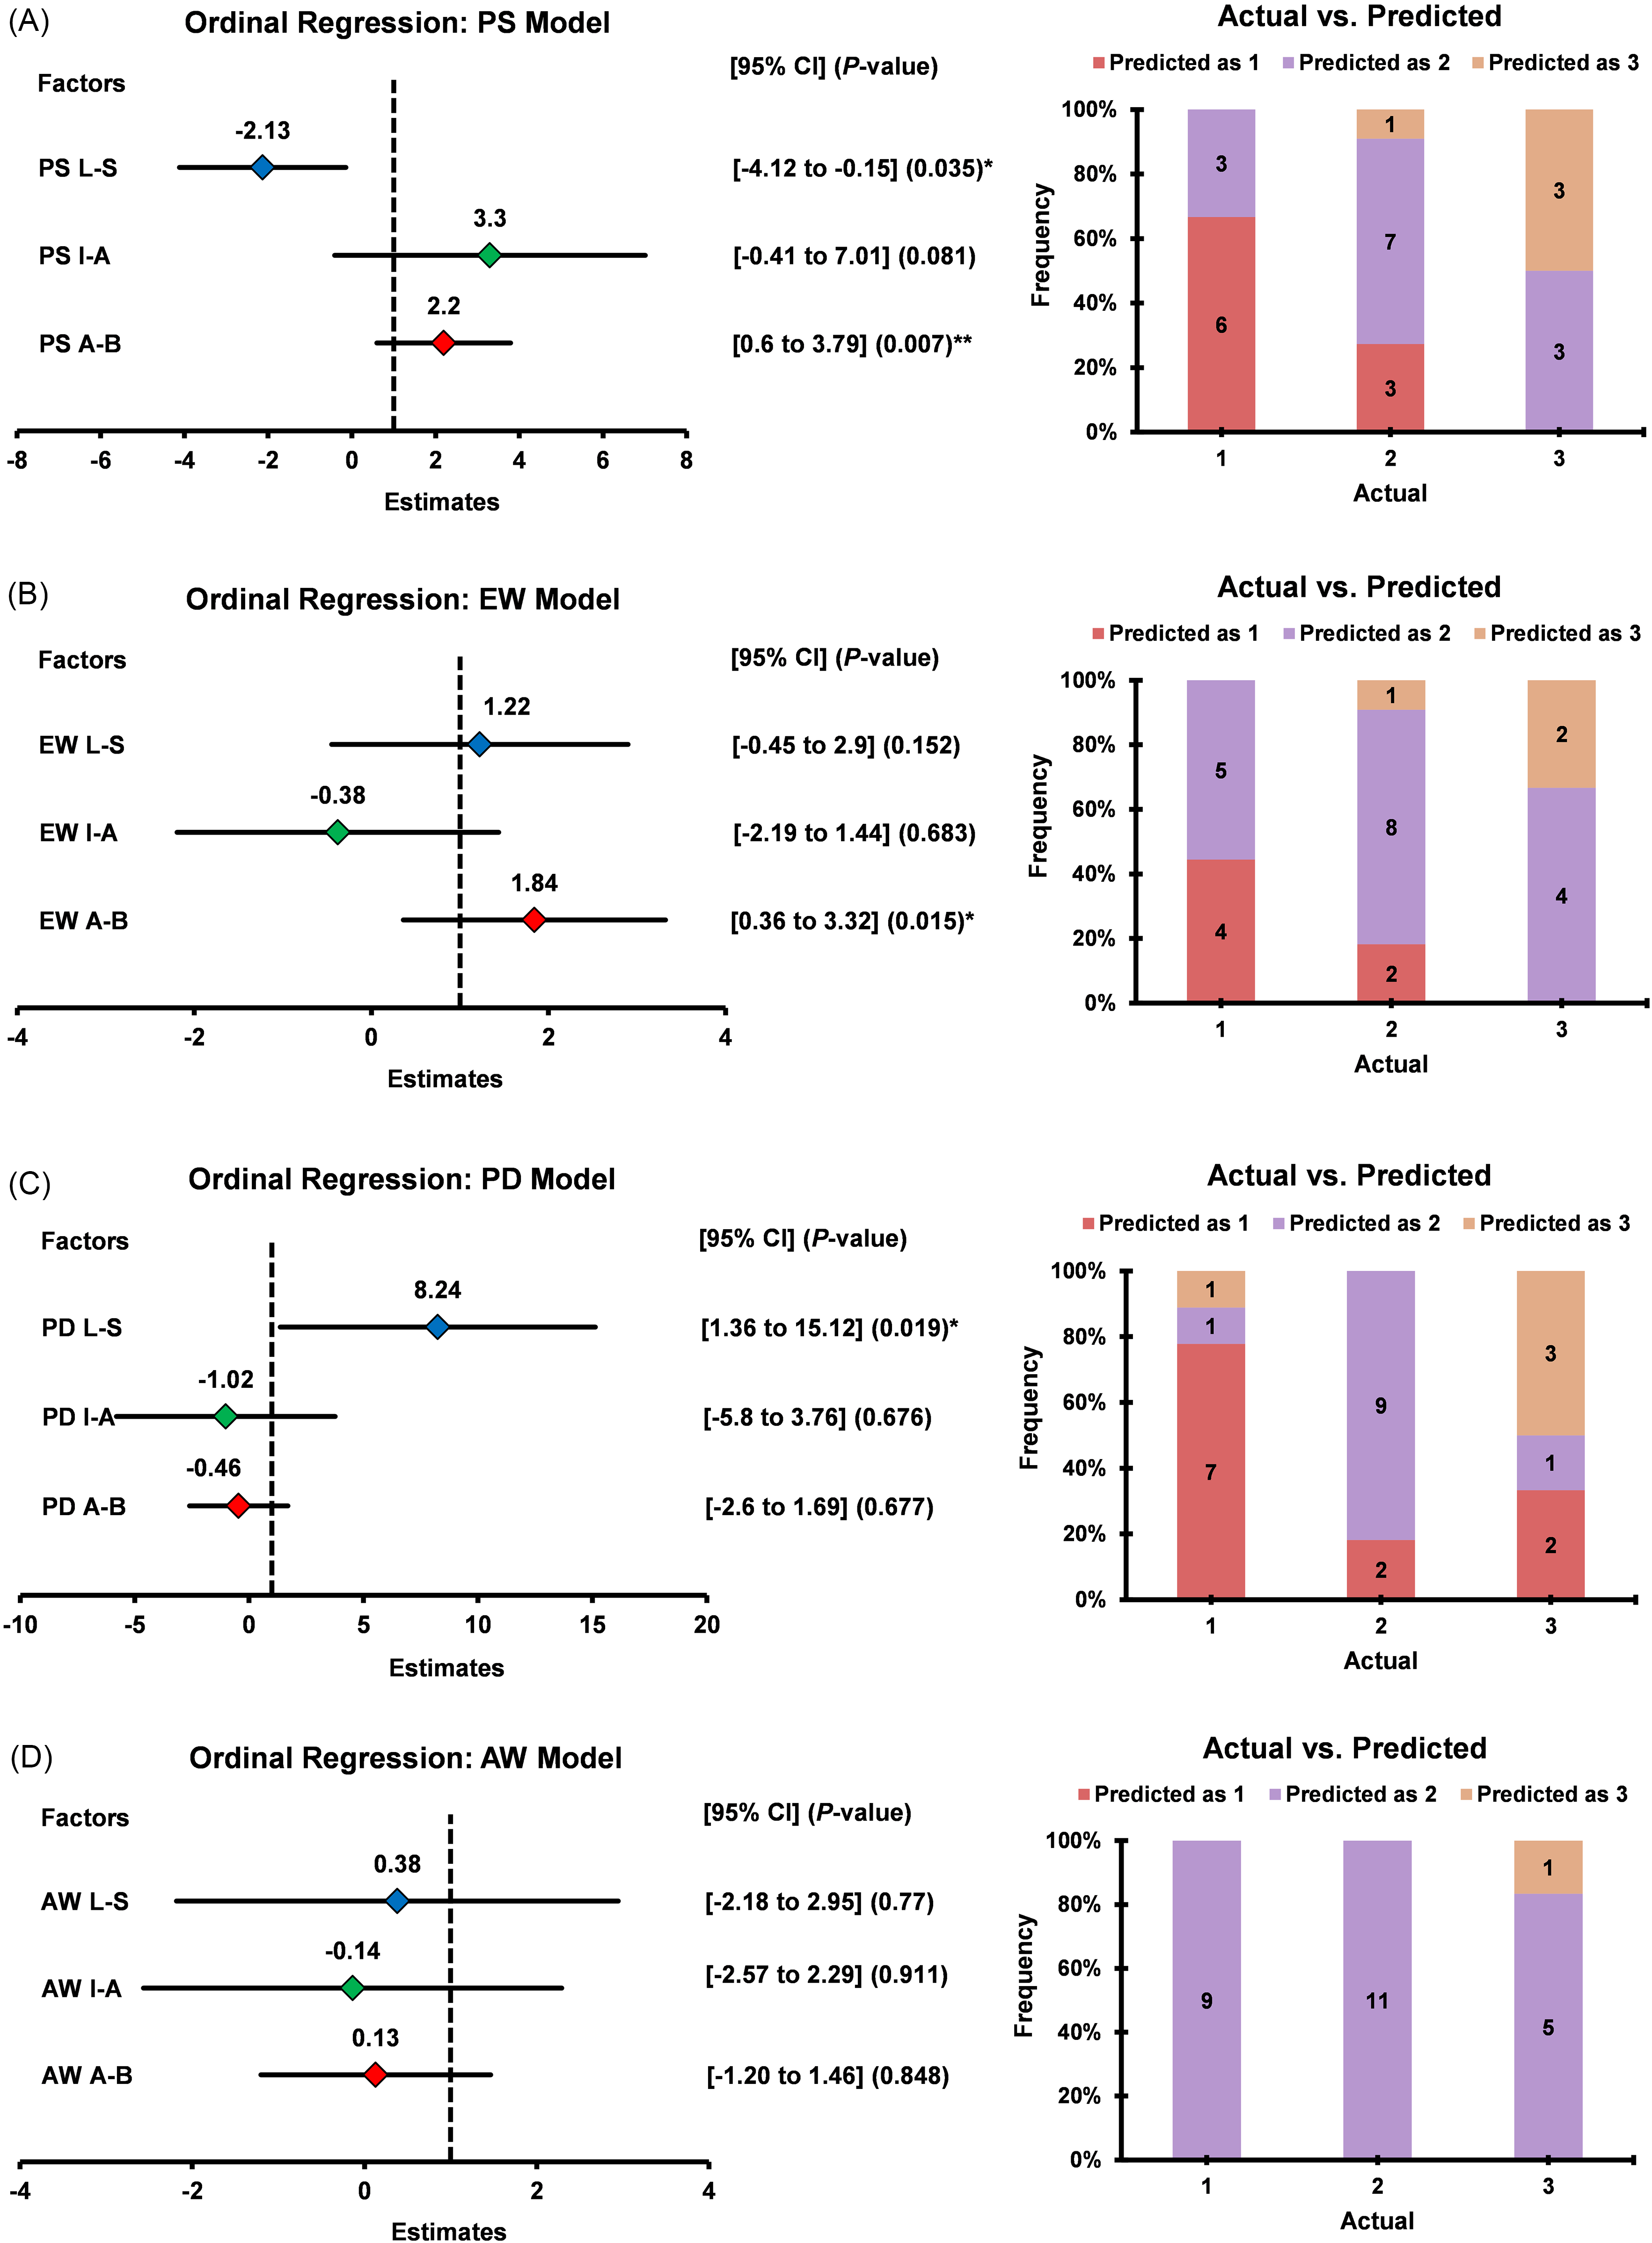
The Forest Plot and the Cluster Bar Chart Demonstrate the Predictive Ability of HDF in Identifying the MR Insufficiency Grading. The Left Panel Shows the Estimates of Each HDF Parameter Contributing to the Ordinal Regression Models, and the Right Panel Shows the Actual Versus Predicted Frequency of MR Severity Levels. 1, Trivial-Mild (n = 9); 2, Mild-Moderate (n = 11); 3, Moderate-Severe (n = 6). From the Regression Model, We Found That PS and E-W in the A-B Direction are Potential Hemodynamic Biomarkers of MR Progression. P < .05 was Considered Statistically Significant. HDF, Hemodynamic Force (mN/mL); MR, Mitral Regurgitation; PS, Peak Systole; E-W, E-Wave; PD, Peak Diastole; A-W, A-Wave; L-S, Lateral-Septal; I-A, inferior-Anterior; A-B, Apex-Base.
Association Between HDF and Age Among MR Severities
PS A-B demonstrated a positive and E-W L-S demonstrated a negative correlation with age in moderate-severe MR (r = 0.88, ρ = −0.89; P = .022, .019, respectively); E-W I-A showed a negative correlation in mild-moderate MR (r = −0.71, P = .014). Left ventricular MI (ρ = 0.65, P = .032) demonstrated a positive correlation with age in patients with mild-moderate MR. Additionally, E-W I-A was negatively correlated with LVMI in mild-moderate MR (r = −0.65, P = .029). All the correlation coefficients are reported in Table 5. Figure 7 visually illustrates the significant result. The complete study is reported in Appendix Figure A5 for HDF and Appendix Figure A6 for LV function.
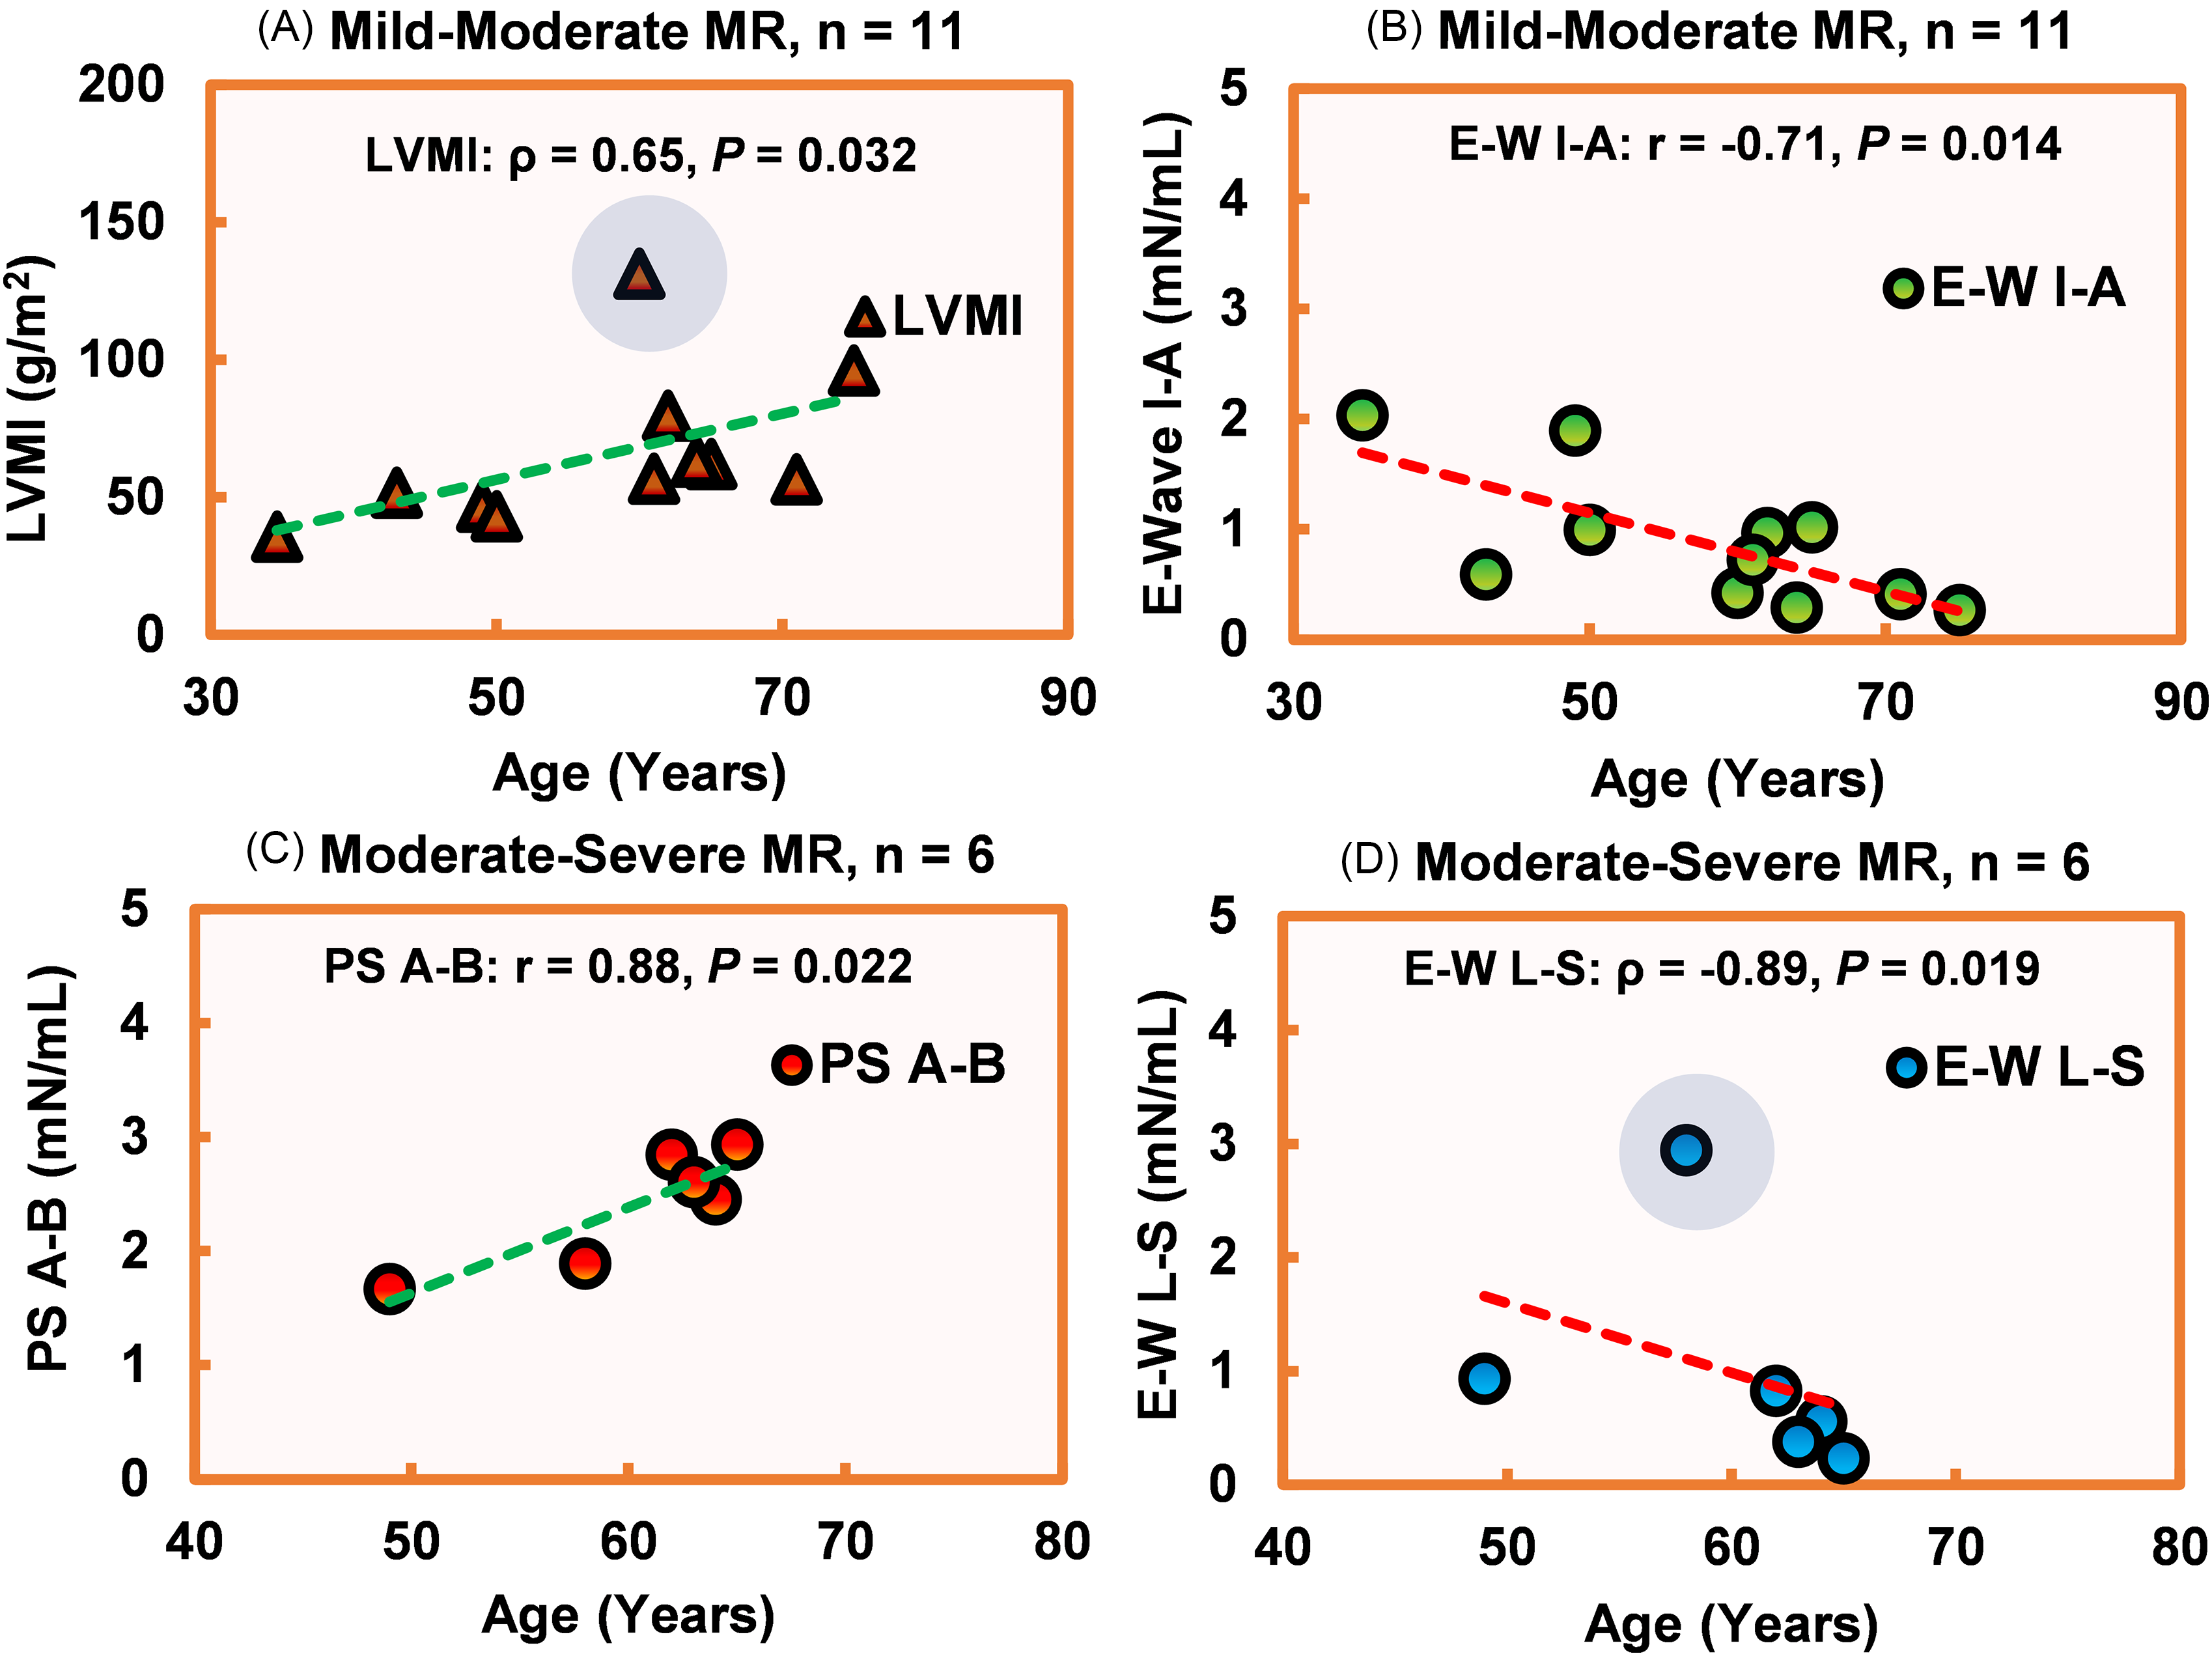
The Scatter Plots Illustrate the Correlation Between Age and (A) LVMI in Mild-Moderate MR; (B) E-W I-A in Mild-Moderate MR; (C) PS A-B in Moderate-Severe MR; (D) E-W L-S in Moderate-Severe MR. Among the Variables, E-Wave HDF Demonstrated a Negative Correlation with Age. In Contrast, LVMI and PS A-B Demonstrated a Positive Association with Age. The Blue-Shaded Circle Indicates the Outlier. Pearson Correlation Coefficient is Indicated by “r” (Used for Normally Distributed Data), and Spearman Rank-Order Correlation Coefficient (rho) is Shown as “ρ” (Used for Non-Normally Distributed Data). Positive Linear Correlation is Denoted as a Green Dashed Line and Negative Linear Correlation as a Red Dashed Line. P < .05 was Considered Statistically Significant. The Full Study Can be Found in Appendix Figures 5–6. MR, Mitral Regurgitation; LV, Left Ventricle; HDF, Hemodynamic Force (mN/mL); PS A-B, Peak Systolic Apex-Base; E-W I-A, E-Wave inferior-Anterior; E-W L-S, E-Wave Lateral-Septal; LVM, Left Ventricle Mass (g); LVMI, Left Ventricle Mass Index (g/m2).
Correlation Between HDF and age among MR Severities.a
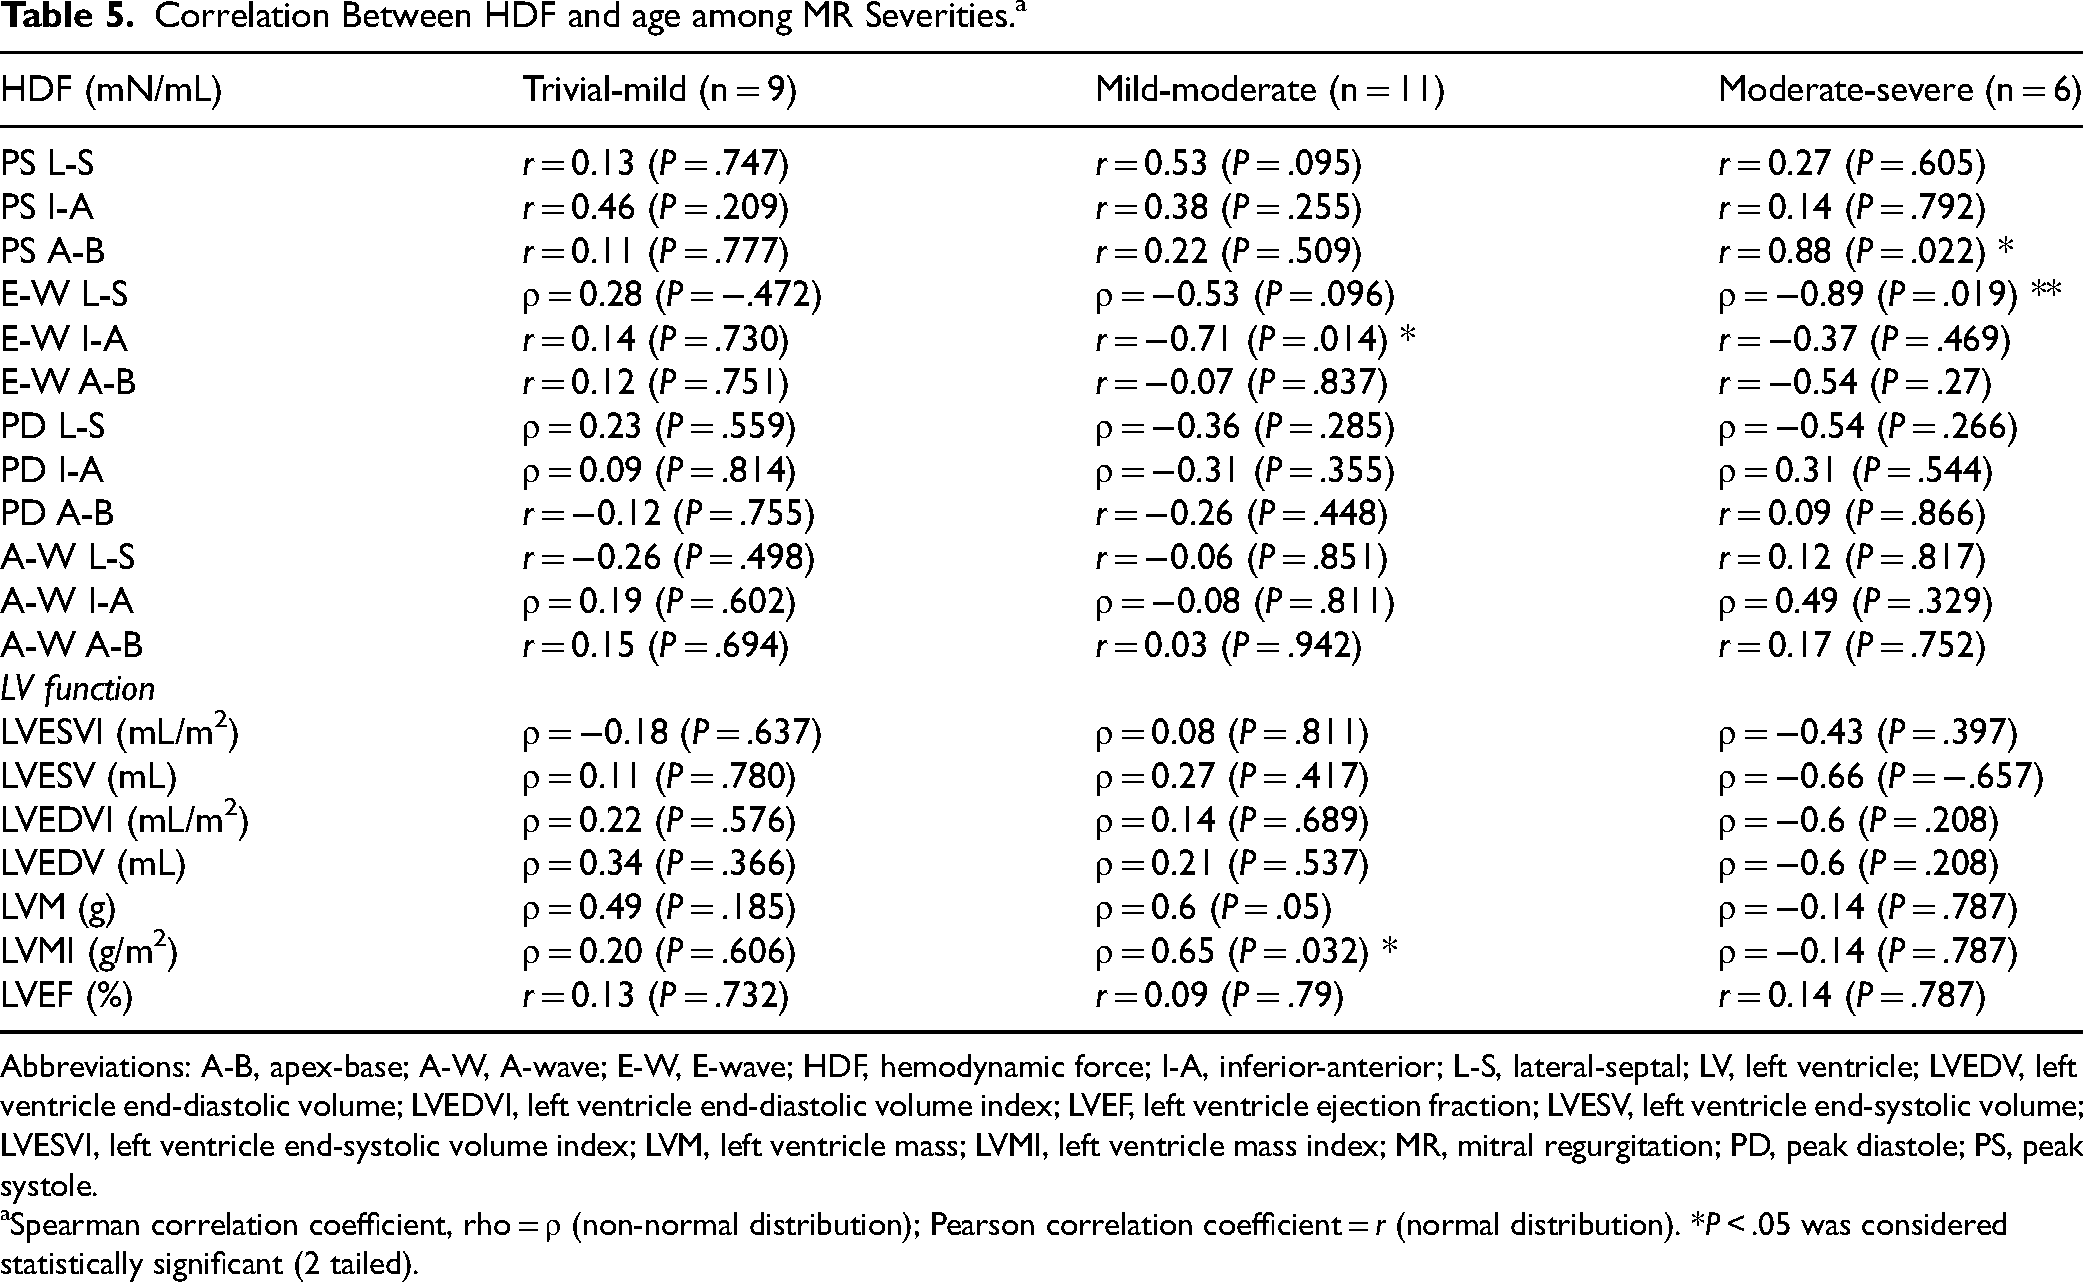
Abbreviations: A-B, apex-base; A-W, A-wave; E-W, E-wave; HDF, hemodynamic force; I-A, inferior-anterior; L-S, lateral-septal; LV, left ventricle; LVEDV, left ventricle end-diastolic volume; LVEDVI, left ventricle end-diastolic volume index; LVEF, left ventricle ejection fraction; LVESV, left ventricle end-systolic volume; LVESVI, left ventricle end-systolic volume index; LVM, left ventricle mass; LVMI, left ventricle mass index; MR, mitral regurgitation; PD, peak diastole; PS, peak systole.
Spearman correlation coefficient, rho = ρ (non-normal distribution); Pearson correlation coefficient = r (normal distribution). *P < .05 was considered statistically significant (2 tailed).
Discussion
Our main findings from this study are: (1) The peak-systolic HDF in the apical-basal direction exhibited a positive association with LVM and age; a negative association with LVEF among MR patients; (2) MR impacts both the LV systolic and diastolic function (indicated by peak-systolic and E-W force in the apical-basal direction); (3) In patients with mild-moderate MR, the E-W force in the inferior-anterior direction demonstrated a negative correlation with both age and LVM, whereas LVM exhibited a positive correlation with age. Similarly, the peak-systolic force in the apical-basal direction increases with age in patients with moderate-severe MR.
A very recent study by Arvidsson et al showed that HDF fails to discriminate between healthy controls and patients with HF and preserved EF (HFpEF). 26 Conversely, a similar study was done by Backhaus et al on HFpEF, and they demonstrated HDF alteration between controls and patients. They indicated the association of HDF with cardiac events. 27 Another study by Loke et al demonstrated HDF calculation through 4D-flow MRI and cine images in the right ventricle. They analyzed controls and rTOF patients and found significant differences in diastolic HDF. 13 All the previous studies focused on the differentiation between controls without cardiac diseases and patients with various cardiac diseases, but all the studies lacked and did not address the impact of MR on HDF and the relationship between HDF and standard MR severity metrics. A recent study by Eriksson et al showed an association between the degree of dyssynchrony and the RMS ratio (ratio between transverse and longitudinal forces) measured using 4D-flow MRI in patients with HF. 28 Another recent study by Pola et al also demonstrated the transverse/ longitudinal ratio of RMS force as a potential biomarker for identifying patients with HF. 29 The ratio was calculated through the RMS values in the longitudinal (apical-basal) and transverse directions (inferior-anterior and lateral-septal). Our study focused on the systolic contraction and diastolic filling phases and did not explore the RMS force or ratio (transverse/longitudinal). A separate study was considered to explore the impact of the RMS force on patients with MR. Though the ratio differed between the controls and MR patients, the systolic RMS apical-basal and diastolic RMS lateral-septal emerged as significant predictors in MR progression. 16 To the best of our knowledge, the present study is the first and only study that focuses on the impact of MR progression (trivial-to-severe) and reports on the association with systolic-diastolic HDF. Furthermore, our study revealed a significant difference in HDF parameters between controls and MR patients, as well as among MR severity. Backhaus et al demonstrated that HDF is impaired in patients with HF despite preserved EF, highlighting that EF does not fully capture functional abnormalities in this population. In contrast, an extensive review by Vallelonga et al reported that HDF is generally proportional to EF across a broader spectrum of HF patients, particularly in those with reduced EF.27,30 It is established that systolic ejection is significantly reduced in patients with severe MR 31 and is sensitive to changes in LV hemodynamic loading conditions. A decrease in the myocardial contractile state or an increase in LV afterload may cause a decrease in the EF. Regardless of the mechanism, a depressed EF can be an indication for surgical correction of M. 2 Both the American and European guidelines indicated that asymptomatic patients should be considered for mitral valve surgery before the EF falls to less than 60%, particularly when the anatomy is suitable for mitral valve repair. Guidelines also recommend that once EF falls below 30%, the risks of mitral valve surgery may outweigh its benefits. There are limited data to support implementing a certain cutoff range for EF in evaluating MR. Still, interventions and clinical outcomes rely heavily on the severity of MR. 31 While EF is a widely used metric for assessing LV function, it provides limited insight into how the LV perceives and responds to the hemodynamic burden imposed by MR. It is also important to note that, in the compensated phase of MR, increased preload with reduced or normal afterload and maintained intrinsic contractility attempts to preserve EF. 32 Hemodynamic force may play a role as an additional marker to reflect on the systolic dysfunction via hemodynamic changes due to MR. We found a negative correlation between EF and peak-systolic apical-basal HDF in patients with severe MR. When EF goes down, the LV pushes more from the apex to the base during systole as a response to the volume overload. Furthermore, our findings reveal distinct variations in HDF across the spectrum of MR severity, with a progressive increase in peak-systolic apical-basal HDF observed in cases of severe MR (Figure A1A). Our study adds value by leveraging HDF to characterize the LV's dynamic response to MR, offering a novel perspective on the interplay between MR severity and LV adaptation. This approach addresses a critical gap, as previous studies have not explored how HDF reflects the functional and mechanical impact of MR on the LV.
Previous studies have highlighted LVMI as a critical marker of severe MR. Uretsky et al and Gjini et al reported a positive linear correlation between LVMI and MRV, indicating that as the MR severity intensifies, LVMI increases proportionally.5,6 Our findings revealed a strong positive correlation between peak-systolic apical-basal HDF and LVMI, indicating a linear increase in both parameters among MR patients. Furthermore, we observed a negative association between LVMI and E-W inferior-anterior HDF in cases with mild-moderate MR. These results align with previous studies demonstrating that elevated LVM and reduced LV systolic function are linked to various cardiovascular conditions, including HF, VHD, and stroke.5,33–35 These observations underscore the importance of LVMI as a key marker for assessing MR severity and suggest its potential role in indicating LV remodeling. 36 The evaluation of MR demands a multiparametric approach, and our study highlights the utility of HDF as an additional marker, revealing its strong association with LVM.
Prior studies demonstrated functional correlation with various cardiac disease states but lacked data on MR-based HDF analysis. Our study filled this knowledge gap and focused on the impact of different MR severities on HDF. Our study revealed an association between MR severity and HDF, and LV function (LVEDVI, LVEDV, LVMI, and LVM). Among these parameters, peak-systolic apical-basal and E-W apical-basal HDF showed notable differences among MR severities (intergroup comparison, P < .05). We extended our study to predict MR severity levels by using the set of HDF parameters and found peak-systole apical-basal and E-W apical-basal HDF as a confounder of MR severity stratification. This led us to the conclusion that HDF can be used as an additional metric to evaluate the impact of MR severity. Additionally, Garg et al proposed a lower cutoff of severity based on prognosis (Primary MR: Mild: RF < 20%, Moderate: RF = 20%-39%, Severe: RF = 40%-50%, Very severe: > 50%; Secondary MR: Mild: MRV < 30 mL, Moderate: MRV: 30-60 mL, Severe: MRV > 60 mL). 19 Future studies should adopt a lower cutoff to better identify severe MR cases, thereby increasing the sample size for this subgroup.
Previous studies demonstrated that the prevalence of MR is significantly associated with older populations.37,38 A study by Cheng et al showed that biological aging likely contributes to alterations in the LV chamber by increased concentricity and reduced EDV. They reported that these structural changes were linked to a higher risk of adverse cardiovascular outcomes in older individuals than in younger individuals. 39 A review article by Laenens et al showed that HDF is a novel approach to identifying the LV pressure gradients, and the pattern might alter in myocardial infarction and nonischemic cardiomyopathy. They have used echocardiography as the imaging modality. 40 Another review article by Vallelonga et al described HDF for various cardiac conditions, such as HF, idiopathic dilated cardiomyopathy, CRT, and competitive athletes (healthy). They concluded that HDF analysis could offer invaluable insights into myocardial dysfunction. 30 Another study by Eriksson et al showed a similar result for dilated cardiomyopathy and concluded that HDF altered significantly between healthy controls and patients. 15 None of the previous studies on cardiac conditions demonstrated an association of HDF with age. Our study focused on this gap and demonstrated an association with age among different MR severities. We found that age was negatively correlated with E-W inferior-anterior HDF (mild-moderate MR) and E-W lateral-septal HDF (moderate-severe MR) and positively correlated with peak-systole apical-basal HDF (moderate-severe MR). Among the LV functions, only LVM and LVMI showed a positive association with age in mild-moderate MR. Previous echocardiographic studies revealed that E-W velocity is highly associated with MR severity and a key marker for evaluating LV diastolic function. E-wave is denoted as rapid ventricular filling during early diastole. Higher E-W velocity is dependent on several factors such as abnormal relaxation and high LV filling pressures. 41 Our study demonstrated a similar result where the force at the E-W time point in the apical-basal direction was elevated as the MR severity worsened. Previous studies have demonstrated that age is strongly associated with diastolic function. Mitral inflow velocity profile changes with progressively decreased E-W velocity and also associated with age. 42 Similarly, our study discovered a link between HDF (E-W and peak-systole) and age in MR cases. It is important to note that our study included patients with secondary MR predominantly attributed to specific underlying etiologies: ischemic cardiomyopathy or atrial MR. The diverse etiology, including factors such as coronary artery disease, regional systolic dysfunction, and LA dilatation, may influence the observed HDF profiles. Notably, regional myocardial impairment appears to contribute to variations in HDF. Future investigations should consider stratifying patients according to MR etiology to further elucidate these relationships. Moreover, this study did not include echo-derived MR jet morphology data. Therefore, while differential effects of MR jet direction on LV dynamics (eccentric vs central jets) have been proposed in prior literature, our analysis could not address these potential differences (due to unavailable echocardiographic data). Future investigations integrating both MRI and echocardiographic data are warranted to explore these aspects further. Our pilot study has limited statistical power, particularly in the moderate-severe MR group. Findings should be interpreted as hypothesis-generating.
This study underscores the complex interplay between LV function and HDF across MR severity, which is crucial for understanding the pathophysiology and clinical implications of MR. Mitral regurgitation has an impact on HDF, which can identify dysfunctional LV and can potentially assist in MR risk stratification, leading to more precise and personalized management of patients with MR.
Limitations and Future Directions
Our study has several limitations that warrant consideration. First, the cohort size was relatively small, which may limit the generalizability of our findings, and future studies should consider using a larger cohort. Second, while LV segmentation was automated, the placement of force axes (lateral-septal, inferior-anterior, and apical-basal) was performed manually for each case, introducing potential precision errors. Incorporating an automated axes detection system could address this issue, utilizing reference points such as the atrioventricular plane, targeting the mitral valve, and determining the axes through perpendicular rotations from these planes. It is also important to note that the HDFs method is based on the Navier-Stokes equations for Newtonian, laminar flow without turbulence modeling. This means that turbulent flows, such as in severe mitral stenosis or aortic regurgitation with jet formation, may need special turbulence measurement methods to give accurate results, 9 and future studies should take this into account. Although ensuring reproducibility is essential in imaging studies, our pilot investigation did not include a formal interobserver variability analysis for HDF measurements. We warrant to incorporate rigorous reproducibility testing in future studies to validate the reliability of HDF measurements across different observers and imaging sessions. The age difference between the control group and the MR group was significant. For future studies, it is recommended to use age-matched groups to improve the reliability of outcomes. Additionally, as this was a pilot study, we did not differentiate between the types of MR (primary or secondary). Instead, we focused solely on the severity levels of MR, including a limited number of cases in each severity category, particularly for severe MR. Before clinical adoption, further validation through large-scale studies with specific types of MR is essential to assess the feasibility and effectiveness of HDF as a reliable marker in MR evaluation. Although not directly assessed in the present work, the potential impact of myocardial fibrosis evaluated using late gadolinium enhancement on HDF remains an important consideration. Future research should investigate the relationship between myocardial fibrosis and alterations in HDF, as this could provide valuable insights into the structural and functional changes occurring in the myocardium of patients with MR. It is vital to note that, among the secondary MR cases (n = 6), 4 cases had atrial fibrillation. The irregular heart rhythm caused by atrial fibrillation may impact the accuracy of flow measurements and image quality, and this factor is considered a limitation of the current study. Although we did not routinely acquire advanced LV strain or diastolic function metrics (eg, E/A ratio) in this cohort, future studies should incorporate these measurements to better characterize LV mechanics and their relationship with HDF parameters.
Conclusion
MR affects early diastolic filling and PS ejection, indicated by PS and E-W HDF in the apical-basal direction, offering insights into dynamic flow patterns and LV remodeling. Hemodynamic force analysis could enhance risk stratification and guide therapeutic decisions, complementing traditional diagnostic methods for improved MR management.
Supplemental Material
sj-docx-1-hvs-10.1177_30494826251395620 - Supplemental material for Characterization of Left Ventricular Hemodynamic Forces in Mitral Regurgitation Using 4-Dimensional-Flow Magnetic Resonance Imaging
Supplemental material, sj-docx-1-hvs-10.1177_30494826251395620 for Characterization of Left Ventricular Hemodynamic Forces in Mitral Regurgitation Using 4-Dimensional-Flow Magnetic Resonance Imaging by Monisha Ghosh Srabanti, Ali Fatehi Hassanabad, Lyes Kadem and Julio Garcia in Journal of the Heart Valve Society
Supplemental Material
sj-docx-2-hvs-10.1177_30494826251395620 - Supplemental material for Characterization of Left Ventricular Hemodynamic Forces in Mitral Regurgitation Using 4-Dimensional-Flow Magnetic Resonance Imaging
Supplemental material, sj-docx-2-hvs-10.1177_30494826251395620 for Characterization of Left Ventricular Hemodynamic Forces in Mitral Regurgitation Using 4-Dimensional-Flow Magnetic Resonance Imaging by Monisha Ghosh Srabanti, Ali Fatehi Hassanabad, Lyes Kadem and Julio Garcia in Journal of the Heart Valve Society
Supplemental Material
sj-docx-3-hvs-10.1177_30494826251395620 - Supplemental material for Characterization of Left Ventricular Hemodynamic Forces in Mitral Regurgitation Using 4-Dimensional-Flow Magnetic Resonance Imaging
Supplemental material, sj-docx-3-hvs-10.1177_30494826251395620 for Characterization of Left Ventricular Hemodynamic Forces in Mitral Regurgitation Using 4-Dimensional-Flow Magnetic Resonance Imaging by Monisha Ghosh Srabanti, Ali Fatehi Hassanabad, Lyes Kadem and Julio Garcia in Journal of the Heart Valve Society
Supplemental Material
sj-docx-4-hvs-10.1177_30494826251395620 - Supplemental material for Characterization of Left Ventricular Hemodynamic Forces in Mitral Regurgitation Using 4-Dimensional-Flow Magnetic Resonance Imaging
Supplemental material, sj-docx-4-hvs-10.1177_30494826251395620 for Characterization of Left Ventricular Hemodynamic Forces in Mitral Regurgitation Using 4-Dimensional-Flow Magnetic Resonance Imaging by Monisha Ghosh Srabanti, Ali Fatehi Hassanabad, Lyes Kadem and Julio Garcia in Journal of the Heart Valve Society
Supplemental Material
sj-docx-5-hvs-10.1177_30494826251395620 - Supplemental material for Characterization of Left Ventricular Hemodynamic Forces in Mitral Regurgitation Using 4-Dimensional-Flow Magnetic Resonance Imaging
Supplemental material, sj-docx-5-hvs-10.1177_30494826251395620 for Characterization of Left Ventricular Hemodynamic Forces in Mitral Regurgitation Using 4-Dimensional-Flow Magnetic Resonance Imaging by Monisha Ghosh Srabanti, Ali Fatehi Hassanabad, Lyes Kadem and Julio Garcia in Journal of the Heart Valve Society
Supplemental Material
sj-docx-6-hvs-10.1177_30494826251395620 - Supplemental material for Characterization of Left Ventricular Hemodynamic Forces in Mitral Regurgitation Using 4-Dimensional-Flow Magnetic Resonance Imaging
Supplemental material, sj-docx-6-hvs-10.1177_30494826251395620 for Characterization of Left Ventricular Hemodynamic Forces in Mitral Regurgitation Using 4-Dimensional-Flow Magnetic Resonance Imaging by Monisha Ghosh Srabanti, Ali Fatehi Hassanabad, Lyes Kadem and Julio Garcia in Journal of the Heart Valve Society
Supplemental Material
sj-tif-7-hvs-10.1177_30494826251395620 - Supplemental material for Characterization of Left Ventricular Hemodynamic Forces in Mitral Regurgitation Using 4-Dimensional-Flow Magnetic Resonance Imaging
Supplemental material, sj-tif-7-hvs-10.1177_30494826251395620 for Characterization of Left Ventricular Hemodynamic Forces in Mitral Regurgitation Using 4-Dimensional-Flow Magnetic Resonance Imaging by Monisha Ghosh Srabanti, Ali Fatehi Hassanabad, Lyes Kadem and Julio Garcia in Journal of the Heart Valve Society
Supplemental Material
sj-tif-8-hvs-10.1177_30494826251395620 - Supplemental material for Characterization of Left Ventricular Hemodynamic Forces in Mitral Regurgitation Using 4-Dimensional-Flow Magnetic Resonance Imaging
Supplemental material, sj-tif-8-hvs-10.1177_30494826251395620 for Characterization of Left Ventricular Hemodynamic Forces in Mitral Regurgitation Using 4-Dimensional-Flow Magnetic Resonance Imaging by Monisha Ghosh Srabanti, Ali Fatehi Hassanabad, Lyes Kadem and Julio Garcia in Journal of the Heart Valve Society
Supplemental Material
sj-tif-9-hvs-10.1177_30494826251395620 - Supplemental material for Characterization of Left Ventricular Hemodynamic Forces in Mitral Regurgitation Using 4-Dimensional-Flow Magnetic Resonance Imaging
Supplemental material, sj-tif-9-hvs-10.1177_30494826251395620 for Characterization of Left Ventricular Hemodynamic Forces in Mitral Regurgitation Using 4-Dimensional-Flow Magnetic Resonance Imaging by Monisha Ghosh Srabanti, Ali Fatehi Hassanabad, Lyes Kadem and Julio Garcia in Journal of the Heart Valve Society
Supplemental Material
sj-tif-10-hvs-10.1177_30494826251395620 - Supplemental material for Characterization of Left Ventricular Hemodynamic Forces in Mitral Regurgitation Using 4-Dimensional-Flow Magnetic Resonance Imaging
Supplemental material, sj-tif-10-hvs-10.1177_30494826251395620 for Characterization of Left Ventricular Hemodynamic Forces in Mitral Regurgitation Using 4-Dimensional-Flow Magnetic Resonance Imaging by Monisha Ghosh Srabanti, Ali Fatehi Hassanabad, Lyes Kadem and Julio Garcia in Journal of the Heart Valve Society
Supplemental Material
sj-tif-11-hvs-10.1177_30494826251395620 - Supplemental material for Characterization of Left Ventricular Hemodynamic Forces in Mitral Regurgitation Using 4-Dimensional-Flow Magnetic Resonance Imaging
Supplemental material, sj-tif-11-hvs-10.1177_30494826251395620 for Characterization of Left Ventricular Hemodynamic Forces in Mitral Regurgitation Using 4-Dimensional-Flow Magnetic Resonance Imaging by Monisha Ghosh Srabanti, Ali Fatehi Hassanabad, Lyes Kadem and Julio Garcia in Journal of the Heart Valve Society
Supplemental Material
sj-tif-12-hvs-10.1177_30494826251395620 - Supplemental material for Characterization of Left Ventricular Hemodynamic Forces in Mitral Regurgitation Using 4-Dimensional-Flow Magnetic Resonance Imaging
Supplemental material, sj-tif-12-hvs-10.1177_30494826251395620 for Characterization of Left Ventricular Hemodynamic Forces in Mitral Regurgitation Using 4-Dimensional-Flow Magnetic Resonance Imaging by Monisha Ghosh Srabanti, Ali Fatehi Hassanabad, Lyes Kadem and Julio Garcia in Journal of the Heart Valve Society
Supplemental Material
sj-docx-13-hvs-10.1177_30494826251395620 - Supplemental material for Characterization of Left Ventricular Hemodynamic Forces in Mitral Regurgitation Using 4-Dimensional-Flow Magnetic Resonance Imaging
Supplemental material, sj-docx-13-hvs-10.1177_30494826251395620 for Characterization of Left Ventricular Hemodynamic Forces in Mitral Regurgitation Using 4-Dimensional-Flow Magnetic Resonance Imaging by Monisha Ghosh Srabanti, Ali Fatehi Hassanabad, Lyes Kadem and Julio Garcia in Journal of the Heart Valve Society
Footnotes
Acknowledgments
The authors thank all investigators, clinical staff, and patient participants of the Cardiovascular Imaging Registry of Calgary (CIROC) for their valuable contributions. The authors thank Dr Einar Heiberg and Dr Johannes Töger for sharing their tool for calculating HDF.
Ethics and Registry
Patient data were obtained from the Cardiovascular Imaging Registry of Calgary (CIROC, NCT04367220), a clinical outcomes registry managed by the Libin Cardiovascular Institute, which routinely includes patients referred to cardiac imaging services across Southern Alberta. All imaging studies were conducted using commercial software (cardioDITM, Cohesic Inc., Calgary). Patients enrolled in CIROC between March 2019 and August 2022 were included in this study. Ethical approval was granted by the Conjoint Health Research Ethics Board at the University of Calgary (REB#13-0902), and all participants provided written informed consent. The research adhered to the principles outlined in the Declaration of Helsinki.
Author Contributions
Funding
The author(s) disclosed receipt of the following financial support for the research, authorship, and/or publication of this article: This work was supported by the The University of Calgary, Department of Biomedical Engineering, Graduate Program, and Libin Cardiovascular Institute, The University of Calgary; J.G. start-up funding, Calgary Health Foundation., NSERC Alliance – Alberta Innovates Advance Program, Natural Science and Engineering Research Council of Canada, (grant number Anne M. Gillis Award for Cardiovascular Research, 11022618 and 11021988, 232403115, RGPIN-2020-04549 and DGECR-2020-00204).
Declaration of Conflicting Interests
The author(s) declared no potential conflicts of interest with respect to the research, authorship, and/or publication of this article.
Data Availability
The data that support the findings of this study are available from the corresponding author upon reasonable request.
Supplemental Material
Supplemental material for this article is available online.
References
Supplementary Material
Please find the following supplemental material available below.
For Open Access articles published under a Creative Commons License, all supplemental material carries the same license as the article it is associated with.
For non-Open Access articles published, all supplemental material carries a non-exclusive license, and permission requests for re-use of supplemental material or any part of supplemental material shall be sent directly to the copyright owner as specified in the copyright notice associated with the article.