
Abstract
Background:
Technology-enabled diabetes self-management solutions may positively affect clinical outcomes in people with diabetes (PWD). This real-world study demonstrates improvement of glycemic metrics in individuals using a diabetes app with a family of Bluetooth® connected blood glucose (BG) meters.
Methods:
Aggregated anonymized BG readings extracted from the app server were analyzed from 3790 PWD divided into two groups based on when they started using the app and meter: PWD who started using the meter, installed the app, and synchronized on the same day (Group 1), and PWD who had used the meter for ≥14 days before they installed the app and performed syncing (Group 2). For Group 1, data from the first 14-days using meter and app (baseline) were compared with 14-days prior to 90- and 180-days using paired, within-subject differences. For Group 2, we additionally used data from the 14 days prior to app installation as pre-baseline.
Results:
In Group 1, people with type 1 diabetes (T1D) and type 2 diabetes (T2D) reduced mean BG by −7.8 and −18.3 mg/dL, respectively, improving readings in range (RIR) by +3.4 (68.6%–72.0%) and +10.6 percentage points (80.8%–91.4%), respectively, from baseline to 180 days. In Group 2, people with T1D and T2D reduced mean BG by −13.5 and −13.3 mg/dL, respectively, from pre-baseline to baseline and by −11.6 and −22.9 mg/dL from pre-baseline to 180 days. RIR improved by +5.1 (58.3%–63.4%) and +12.4 percentage points (73.9%–86.4%) in people with T1D and T2D, respectively, from pre-baseline to 180 days, with people with T1D showing the most pronounced improvement in the first 2 weeks of app usage (+7.4 percentage points, 58.3%–65.6%). All glycemic changes were statistically significant (P < 0.01).
Conclusion:
Real-world data demonstrated improvements in glycemic metrics among 3790 PWDs using a mobile app with a connected glucose meter.
Keywords
Introduction
Blood glucose monitoring (BGM) plays a crucial role in diabetes management, with structured monitoring approaches demonstrating significant clinical benefits. A comprehensive analysis of randomized controlled trials (RCTs) found that BGM reduced hemoglobin A1c (A1c) by −0.3% compared with usual care, with structured BGM providing an additional −0.2% improvement. 1 The value of structured BGM and acting upon glucose data trends was further demonstrated in studies comparing different monitoring approaches, where structured monitoring led to additional A1c reductions of up to −0.32%. 2
Traditionally, the clinical community has relied on evidence from RCTs as the gold standard to determine the value of new technologies. However, RCTs tend to provide data from selected populations and may not reflect a technology’s performance in broader, more diverse patient groups. Real-world evidence has emerged as a powerful approach to evaluate new technologies across diverse patient populations, complementing the findings from RCTs.
Digital diabetes management tools have shown promising results in improving glycemic outcomes. 3 The integration of Bluetooth® connected blood glucose (BG) meters with mobile applications provides people with diabetes (PWD) enhanced insights into their glucose patterns and facilitates more informed decision-making. Previous studies have demonstrated that connected BG meters integrated with diabetes apps can improve treatment adherence in people with type 1 diabetes (T1D). 4
The frequency of readings from continuous glucose monitoring (CGM) systems has allowed PWD to track time in range (TIR). While BGM provides less frequent readings than CGM, a corresponding metric called “readings in range” (RIR) can be applied, with studies showing a significant correlation between A1c and RIR. 5 Each 10% change in RIR was associated with a change in A1c of 0.4% in PWD performing sufficient daily checks.
A variety of digital systems are available to support PWD and these systems have observed improved diabetes outcomes. For instance, highly engaged users with T2D in Poland who used the mySugr® app for 4 months lowered “estimated” A1c by −0.26%. 6 Furthermore, real-world data from users of the One Drop mobile diabetes app, living with T2D, self-reported that they experienced A1c improvements after a median app usage period of 4 months. 7
In Russia, clinical trials previously demonstrated improvement in various glycemic outcomes for different populations of PWD using the Reveal app in combination with connected BG meters. Compared with traditional approaches, the implementation of the Reveal app use with a connected meter in people with T1D with out-of-range glycemic management resulted in a lowering of A1c by 0.3%–0.5% and improvement of RIR by +5.3 percentage points.8–9 Those studies included relatively small groups of predominantly younger patients with T1D, limiting generalization of the obtained evidence and warranting studies in larger populations with different diabetes types, ages, and therapeutic modalities.
Based on these observations, our current study aims to evaluate the real-world effectiveness of the Reveal mobile application used in combination with OneTouch Select Plus Flex® (Flex) or OneTouch Verio Reflect® (Reflect) BG meters in improving glycemic management in people with T1D and type 2 diabetes (T2D) in Russia. This analysis extends previous research by examining the impact of these digital diabetes management tools in a Russian real-world setting, providing valuable insights into their effectiveness in a diverse population.
Methods
The Flex meter features a ColorSure® Range Indicator that points at blue if the meter reading is below range, at green if the reading is in range, and at red if the reading is above range. The Reflect meter has more advanced functionality that includes a dynamic color range indicator, which can also indicate when a reading in range is near below or near above range, and a Blood Sugar Mentor® feature that provides onscreen, real-time guidance messages to the user. Bluetooth® technology allows PWD to sync these meters to the Reveal mobile app (Fig. 1). PWD can agree to share mobile app data (BG readings) with their health care professionals (HCPs) who have the professional (web) version of Reveal. The mobile app offers PWD colorful trends and easy tracking of glucose readings, the ability to annotate readings with food, activity or insulin dosing information, detection of low and high BG patterns, and provides 14-, 30- and 90-day summary reports that may also be helpful during consultations with their HCPs.

Blood glucose meter connectivity to diabetes app enabling data collection.
The current study is based upon a common methodology and analysis approach that we have previously used to publish real-world data from our so called “OneTouch data lake.”10–12 Our global data lake increases significantly over time as new patients upload glucose data from our products. The methodology, ethics approach, and statistical analysis are similar across our series of prior real-world publications; however, the specific criteria we apply to retrieve each individual dataset is unique each time. In the current analysis, we have specifically focused on outcomes in people in Russia who have their own health care system and care practices that will strongly influence the patient data uploaded to our ecosystem.
The Reveal app available in Russia is a clone (copy) of the global Reveal app, developed in accordance with local legislation, encompassing only Russian Reveal app data; medical data are stored separately from personally identifiable information to protect patient privacy.
For this retrospective analysis, we used de-identified aggregated BG data from the app server with medical data that did not store personal data. MS SQL identified meters (Flex or Reflect) from which a certain number of readings were transferred. The meter data were assigned a unique alphanumeric identification that did not allow identification of the subject. PWDs who downloaded the app were informed about the processing of personal data in accordance with the privacy policy, and during app registration, they provided their explicit consent for this processing, which permits use of de-identified aggregated data to perform analysis and provide medical insights on managing certain groups of PWDs. The Declaration of Helsinki does not require that researchers gain ethics approval for the retrospective analysis of de-identified, aggregated patient data, so additional ethics committee approval and informed consent were not required.
For this analysis, aggregated, anonymized BG readings were fetched from the server from meters for which there were at least 90 and 180 BG readings over the first 90 and 180 days, respectively, after app registration. If the same meter was synced with more than 1 account in the app, then none of the readings from that meter were included in the dataset. This analysis included BG readings for users who registered between June 2020 and August 2024.
Data extracted were divided into two groups based on whether the subjects started using the app and the BG meter simultaneously or not. In this real-world study design, subjects were not randomized. Group 1 comprised subjects who began using their new meter, registered the app, and synced the meter to the app, all on the same day. For this group, glycemic metrics were analyzed at baseline (first 14 days of app usage) and at 90 and 180 days (last 14 days prior to the 90- and 180-day timepoints, respectively).
Group 2 comprised subjects who used their meter for at least 14 days before registering the app and syncing the app with the meter. The Flex meter stores 500 readings, while the Reflect meter stores 750 readings; at the time of the first sync, all stored readings are transferred from the meter to the app. For Group 2, glycemic metrics were analyzed for the pre-baseline (14 days before app usage), baseline (the first 14 days of app usage), and at 90 and 180 days (the last 14 days prior to the 90- and 180-day timepoints, respectively).
Statistical analysis
All analyses were performed separately for each diabetes type. The following glycemic indicators were used for grouping all BG readings: low (<70 mg/dL), in range (70–180 mg/dL), and high (>180 mg/dL). The number of days from when a subject first started using the app was determined and time windows were created for pre-baseline (the 14 days immediately prior to the first app usage), baseline (first 14 days of app usage), and 90 and 180 days (last 14 days prior to the 90- and 180-day timepoints, respectively).
For inclusion in our datasets, subjects were required to have at least 90 readings within the 90-day timeframe or at least 180 readings within the 180-day timeframe to ensure regular BGM was performed. The final analysis included data obtained from subjects for whom at least 7 BG readings were available over the 14-day time windows for pre-baseline (Group 2), and baseline, 90-, and 180-day timepoints (Groups 1 and 2).
Quantitative data are presented as mean values. Pairwise comparisons were made between starting and ending means for each subject. The mean BG and percentage of readings within each of the glycemic indicator categories were calculated for each subject for pre-baseline (Group 2 only), baseline, 90-, and 180-day time windows, and the within-subject changes from pre-baseline or baseline determined. All statistical comparisons between pre-baseline, baseline, 90, and 180 days were performed by paired-sample t-tests using Statistica 8.0 (StatSoft, USA), MS Excel 2010 (Microsoft, USA).
Results
The initial depersonalized dataset included 5454 and 5559 people with T1D and T2D, respectively, and the final analysis included the 1360 and 2430 people with T1D and T2D, respectively, who had the required amount of BG data for both the first 14 days using the app with the meter (baseline) and the 14 days before the 90-day and, optionally, the 180-day timepoints. We report changes at both 90 and 180 days given that the outcomes over a longer timeframe are more clinically relevant to HCPs by demonstrating durability of effect.
Overall changes in glycemic outcomes at 90 and 180 days
Group 1
Hyperglycemic readings reduced by −4.8 (29.0%–24.2%) and −10.2 percentage points (18.7%–8.5%) in people with T1D and T2D, respectively, mirroring the positive changes in RIR at 90 days. Hypoglycemic readings remained essentially unchanged, increasing by +0.2 percentage points (5.3%–5.5%) in people with T1D; the proportion of hypoglycemic readings for people with T2D was far lower (0.5%) and stayed unchanged. Baseline monitoring frequency was higher for people with T1D than T2D (4.6 vs. 2.7 checks per day), and both groups reduced their monitoring frequency by −1.4 and −1.1 checks per day, respectively, at 90 days (Fig. 2A–B). All glycemic changes (other than hypoglycemic readings) and changes in monitoring frequency, were statistically significant at the P < 0.01 level.

Summary of aggregated glycemic data at 90 and 180 days in people with diabetes (PWD) who started using a Bluetooth®-connected blood glucose meter simultaneously with registering and syncing with a diabetes app (Group 1).
Further analysis of the 90-day dataset found that 42.1% (324 of 770) of people with T1D improved RIR by >5 percentage points and 31.7% (244 of 770) improved by >10 percentage points. Similarly, 42.2% (701 of 1661) of people with T2D improved RIR by >5 percentage points and 31.8% (529 of 1661) by >10 percentage points at 90 days.
Analysis of the 180-day dataset found 40.4% (99 of 245) of people with T1D improved RIR by >5 percentage points and 27.3% (67 of 245) improved by >10 percentage points. Similarly, 44.1% (265 of 601) of people with T2D improved RIR by >5 percentage points and 34.6% (208 of 601) by >10 percentage points at 180 days.
Group 1: Changes in glycemic outcomes in people with T2D initially not at goal at 90 and 180 days
An additional analysis of glycemic outcomes in the subgroup (n = 520) of people with T2D with mean BG >155 mg/dL at baseline showed a reduction in mean BG by −45.9 mg/dL at 90 days and maintenance of the effect at the end of another 90 days (n = 195), resulting in −48.6 mg/dL total reduction at 180 days. RIR improved significantly by +29.7 percentage points (49.5%–79.2%) at 90 days and a similar outcome was seen in the group with 180 days of data. The proportion of hypoglycemic readings was extremely low and remained essentially unchanged.
Monitoring frequency in the subgroup with 180 days of data was slightly higher than in the overall group of people with T2D at baseline at 2.9 checks per day. At 180 days, it decreased to 2.0 checks per day but was still higher than in the overall group (Fig. 3).

Summary of aggregated glycemic data at 90 and 180 days in people with type 2 diabetes (T2D) who started using a Bluetooth®-connected blood glucose meter simultaneously with registering and syncing with a diabetes app (Group 1) with mean blood glucose (BG) >155 mg/dL at baseline.
Overall changes in glycemic outcomes at 90 and 180 days
Group 2
RIR improved by +5.6 (59.9%–65.5%) and +6.2 percentage points (75.1%–81.4%) in people with T1D and T2D, respectively, from pre-baseline to baseline, and improved by an additional +1.6 (65.5%–67.1%) and +5.1 percentage points (81.4%–86.5%) in people with T1D and T2D, respectively, at 90 days.
In people with T1D and T2D, hyperglycemic readings reduced by −6.0 (35.1%–29.1%) and −6.1 percentage points (24.3%–18.2%), respectively, from pre-baseline to baseline, and by an additional −1.7 (29.1%–27.4%) and −5.4 percentage points (18.2%–12.8%), respectively, from baseline to 90 days, mirroring the positive changes in RIR at 90 days. Hypoglycemic readings remained essentially unchanged, with a slight increase in both groups.
Pre-baseline monitoring frequency was higher for people with T1D than T2D (3.7 vs. 1.9 checks per day), and both groups increased their monitoring frequency by 1.8 and 0.9 checks per day from pre-baseline to baseline, during their first 14 days of experiencing the app for the first time. The monitoring frequency then reduced by 2.0 and 1.1 checks per day at the end of the 90-day period, returning to slightly below the pre-baseline rates (Fig. 4A–B). All glycemic changes (other than hypoglycemic readings) were statistically significant at the P < 0.01 level.

Summary of aggregated glycemic data at 90 and 180 days in PWD with experience using their blood glucose meter prior to registering and syncing with a diabetes app (Group 2).
Further analysis of the 90-day dataset found 36.1% (213 of 590) of people with T1D improved RIR by >5 percentage points and 23.9% (141 of 590) improved by >10 percentage points. Similarly, 33.0% (254 of 769) of people with T2D improved RIR by >5 percentage points and 23.3% (179 of 769) by >10 percentage points at 90 days.
In people with T1D, mean BG reduced by −13.5 mg/dL from pre-baseline to baseline, continued to decline by −6.9 mg/dL at 90 days, but increased at the end of the next 90 days by 8.7 mg/dL so that the change was nonsignificant from baseline to 180 days, although the improvement from pre-baseline was maintained at 180 days.
In people with T2D, mean BG reduced by −13.3 mg/dL from pre-baseline to baseline, continued to decline by a further −11.4 mg/dL at 90 days, and maintained this improvement at the end of 180 days.
RIR improved by +5.1 (58.3%–63.4%) and +12.4 percentage points (73.9%–86.4%) in people with T1D and T2D, respectively, from pre-baseline to 180 days. For people with T1D, the most pronounced increase in RIR occurred during the first 2 weeks of experiencing the app for the first time (+7.4 percentage points, 58.3%–65.6%). In contrast, people with T2D showed stepwise improvements to 90 days and then a plateau (+6.8 percentage points, 73.9%–80.7% pre-baseline to baseline; +6.6 percentage points, 80.7%–87.3% baseline to 90 days, and −1.0 percentage points, 87.3%–86.4% 90 to 180 days). RIR changes corresponded to a reduction in hyperglycemic readings.
Hypoglycemic readings increased by +0.6 percentage points (5.0%–5.6%) at 180 days versus pre-baseline in people with T1D. The proportion of hypoglycemic readings in people with T2D was far lower and remained essentially unchanged from pre-baseline to 180 days, increasing nonsignificantly by +0.3 percentage points (from 0.3%–0.6%).
Changes in monitoring frequency showed the same trends as over the first 90 days, with an initial increase during the first 14 days of experiencing the app, then declining to slightly below pre-baseline in people with T1D and T2D (Fig. 4A–B).
Further analysis of the 180-day dataset found that 28.2% (50 of 177) of people with T1D improved RIR by >5 percentage points and 19.8% (35 of 177) improved by >10 percentage points. Similarly, 35.2% (94 of 289) of people with T2D improved RIR by >5 percentage points and 22.1% (64 of 289) by >10 percentage points at 180 days.
Group 2: Changes in glycemic outcomes in people with T2D initially not at goal at 90 and 180 days
In the subgroup (n = 281) of people with T2D with mean BG >155 mg/dL at pre-baseline, mean BG reduced by −52.1 mg/dL from pre-baseline to 90 days. Moreover, this decline was progressive: during the first 2 weeks of experiencing the app, the decline in mean BG amounted to −29.3 mg/dL and at the end of 90 days, a further −22.7 mg/dL improvement was added. Among people with T2D in this subgroup who also had data at 180 days (n = 109), mean BG reduced by −55.8 mg/dL from pre-baseline to the 180-day timepoint.
RIR improved by +31.4 percentage points (39.9%–71.3%) from pre-baseline to 90 days and a similar outcome was seen in the group with data at 180 days. The proportion of hypoglycemic readings was low and remained virtually unchanged.
Monitoring frequency in the subgroup with 180 days of data during their 14-day baseline period, while experiencing the app for the first time, was slightly higher than in the overall group of people with T2D, at 3.0 checks per day. It decreased, but remained slightly above pre-baseline levels by 0.4 checks per day, at 180 days (Fig. 5).
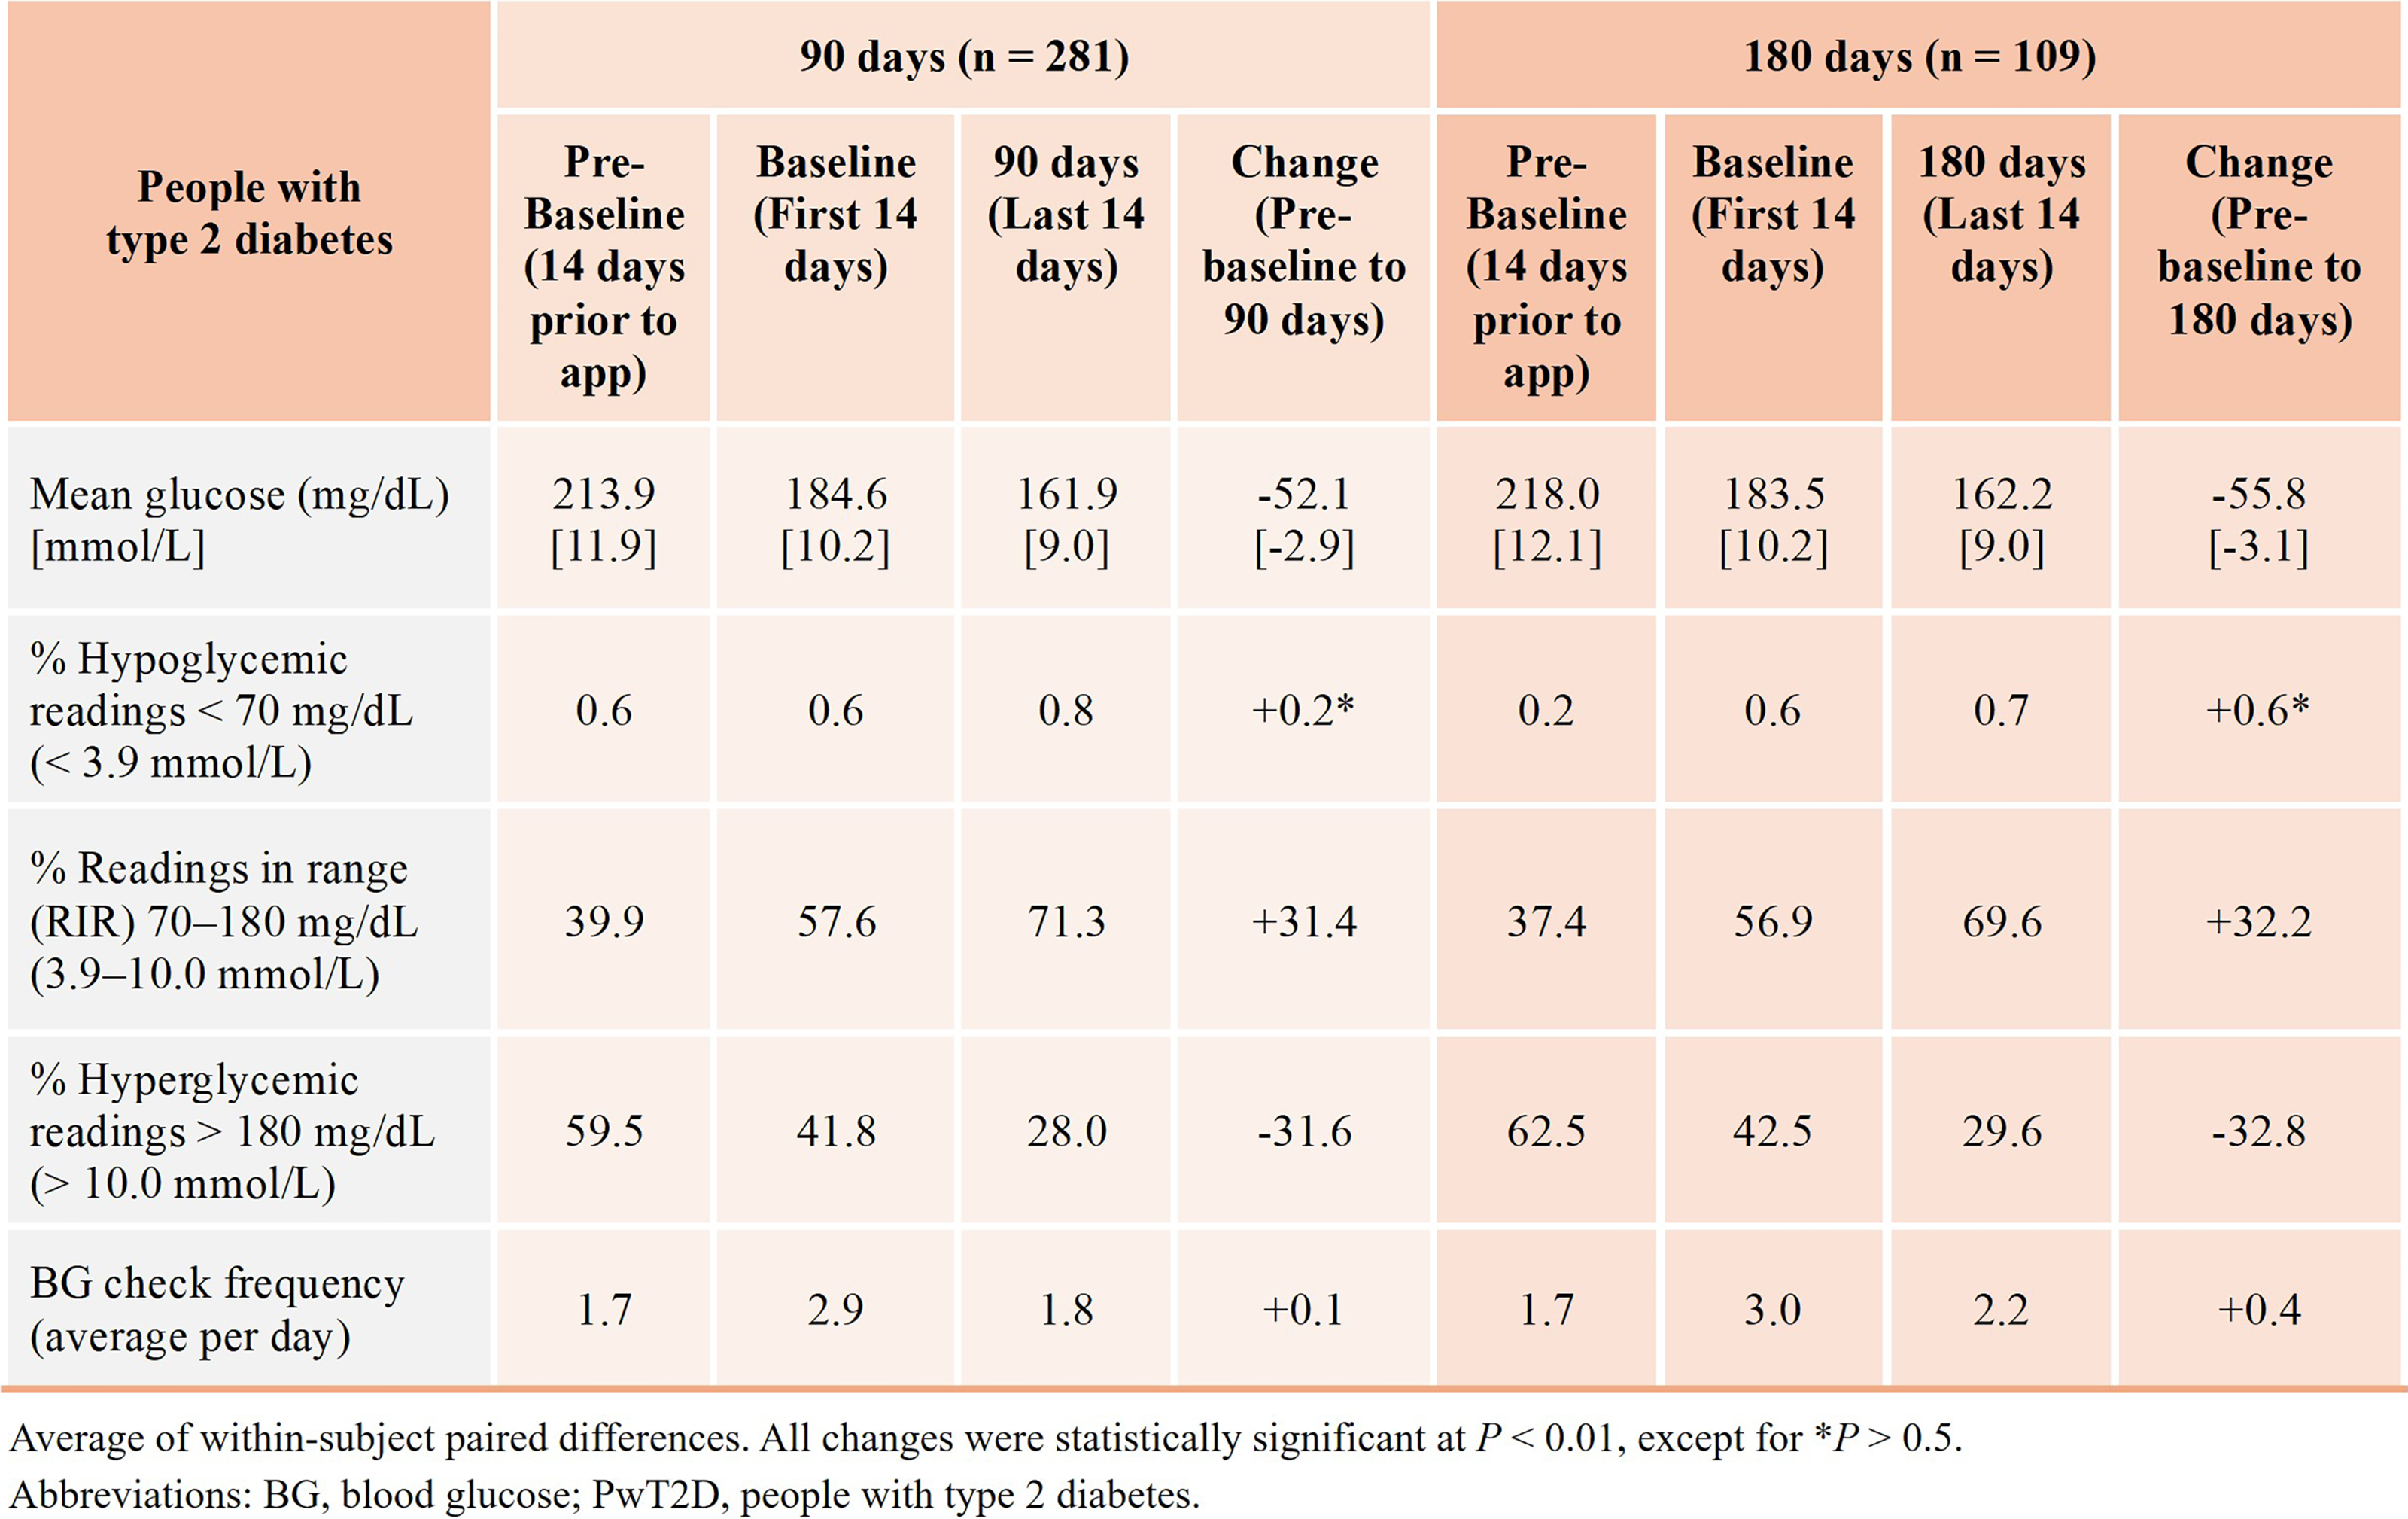
Summary of aggregated glycemic data at 90 and 180 days in people with T2D with experience using their glucose meter prior to registering and syncing with a diabetes app (Group 2) and mean BG >155 mg/dL at pre-baseline.
Discussion
This analysis of BG data received from 3790 PWD is among the first in Russia in a combined BG meter and mobile diabetes app dataset. The dataset was fetched from a localized version of a popular mobile diabetes app that is widely available, for which similar analyses have been previously conducted. However, the current analysis differs in that it includes glycemic data not only from users new to the meter and the app, but also from users with experience using their meter with a color range indicator prior to registering in the app and syncing with the meter.
Modern blood glucose monitroing (BGM) and CGM devices rely on color displays and color ranges to help simplify numerical data for PWDs and HCPs. The color range indicators on the meters in this analysis utilize a blue-green-red indicator on the meter, and this color scheme is continued in the app. Color can act as a carrier of information that is perceived instantly and positively influences the intention of PWDs to act on glucose readings. A large study by Polonsky et al. 13 showed that 50% of people with T2D, both insulin-using and noninsulin-using, did not take any action for low or high out-of-range BG readings. At the same time, people with T1D and T2D were four times more likely to take action with respect to glucose readings when the readings were shown with color compared with when they were shown without color. 14
In the mobile app used in this study, glycemic data are displayed in a structured visual format, conveniently allowing PWDs to identify their main difficulties in achieving optimal diabetes management and make more informed diabetes management decisions. This premise is substantiated by a recent study showing that youth with T1D who systematically used the Ambulatory Glucose Profile Report: CGM showed improved metabolic management due to more informed decisions on insulin therapy and lifestyle choices based on pattern analysis. 15 Therefore, we can reasonably conclude that PWDs in our real-world study who started using the app with connected meters took more notice and potentially took more actions than they did with their previous meter not connected with the Reveal diabetes app. Interactions with the app and meters leading to better decision-making by PWDs may have contributed to the improved proportion of RIR and fewer hyperglycemic readings that were observed.
The term “readings in range” denotes meter readings from 70 to 180 mg/dL and was established as the preferred terminology that reflects episodic, capillary glucose readings with BGM versus the near-continuous measurement of interstitial glucose every 1 to 5 min with CGM that yields a time in range (TIR) metric. 16
There is considerable focus in the literature on maintaining glucoses in range, whether that is TIR by virtue of CGM or RIR when PWDs use BGM. For example, key studies utilizing CGM data reveal that estimated A1c levels derived from TIR or time spent >180 mg/dL are as precise and reliable as those based on mean glucose. A 5 percentage point increase in TIR or a 5 percentage point decrease in time >180 mg/dL would equate to a clinically meaningful improvement in A1c of ≥0.4%. 4 An earlier study also showed that a 5.3 percentage point increase in RIR was accompanied by an A1c decrease of 0.3%–0.5% in people with T1D. 7 Results from another study in people with T2D who used digital therapeutic apps showed RIR improvement by 8.5 percentage points and A1c reduction by 0.77%. 17
Our current real-world data analysis shows evidence for improved glycemic management, specifically changes in mean BG and RIR accounted for by reductions in hyperglycemic readings, in people with T1D and T2D who started using specific Bluetooth® connected glucose meters with the Reveal diabetes management app. We saw clinically meaningful improvements in RIR that were sustained during 6 months of real-world use in PWDs. In fact, up to 27.3% and 34.6% of people with T1D and T2D, respectively, improved RIR by at least 10 percentage points over the study period, which is a significant achievement based on this relatively simple addition to their current diabetes management plan.
Our study was based on two strategies for grouping subjects in the dataset. For Group 1, we examined changes in glycemic outcomes in the cohort of “new” users of the connected meter and diabetes app and established that there were significant improvements in mean BG and RIR at 90 days, with these improvements being sustained at the end of 180 days. However, in people with T2D, the changes in mean BG and RIR were significantly more pronounced compared with people with T1D at 180 days (−18.3 mg/dL vs. −7.8 mg/dL and +10.6 vs. +3.4 percentage points, respectively). A potential explanation could be if there initially was a lower level of knowledge resulting in a less advanced ability to analyze glycemic data, and self-manage among people with T2D, in whom use of the diabetes app and connected meters helped overcome these difficulties. The improvements in mean BG and RIR were accompanied by a corresponding decrease in hyperglycemic readings without a statistically significant change in the percent of hypoglycemic readings.
We found that the app and meters provided the greatest value to those PWDs with initially high, out-of-range mean BGs. Specifically, we identified a subgroup of people with T2D with mean BG >155 mg/dL at baseline, comprising approximately one-third of the total number of people with T2D. Within just 90 days, a pronounced reduction in mean BG of −45.9 mg/dL was observed, reaching a level of 153.0 mg/dL, with this effect persisting and even slightly intensifying in those who had 180 days of data. RIR increased correspondingly by approximately 30 percentage points, reaching 81.1% at 180 days. While we currently lack sufficient data to evaluate changes in glycemic parameters at 365 days, these current results clearly demonstrate the utility of relatively simple technologies (a specific app and connected BG meters) in supporting diabetes management.
One more main finding is that in the overall groups of people with T2D, clinically meaningful improvements in RIR were not associated with an increase in BG check frequency. In fact, monitoring frequency was significantly higher during the first 14 days that PWDs experienced the app compared with the last 14 days before 90 and 180 days, suggesting that there is an initial discovery period for PWDs after exposure to the new features and insights from the app and meter.
This finding for Group 1 led us to analyze the glycemic outcomes in PWDs who had prior experience with their meters with a color range indicator but no experience with the Reveal app (Group 2). We observed that more than half of the improvements in glycemic parameters occurred within the first 2 weeks of using the Reveal app. In people with T2D, these improvements progressed gradually (both in the overall group and in the subgroup of people with T2D with initially high mean BG). For example, in people with T2D, mean BG reduced by −11.6 mg/dL from pre-baseline to baseline and by −9.4 mg/dL from baseline to 90 days. In contrast, for people with T1D, the maximum change occurred specifically during the first 14-day initial period of experiencing the app. One possible explanation for this fact may be the widespread routine use of CGM systems by people with T1D in Russia, with meters and the corresponding mobile apps being used only as a supplementary monitoring method, for which the initial intense interest diminishes with continued use.
Another important observation was that as glycemic parameters improved, BGM frequency decreased, returning to the same or even slightly lower frequency than during the pre-baseline time period. This further confirms that improvements in mean BG and RIR were not dependent upon a continued increase in BG check frequency. We would like to think this means that PWDs’ understanding of self-monitoring evolved with ongoing use of the app and meter, transforming into meaningful monitoring, where they check BGs with specific intents and, in accordance with the measurement results, take actions in the moment and plan future actions.
Our dataset combined BGM data from PWDs using two different meters: the basic Flex and the more advanced Reflect, with a variety of automated algorithms to display on-screen insights and trends in an engaging way. We conducted additional analyses to determine whether there were advantages in glycemic parameter changes depending upon which meter (Flex or Reflect) was used by PWDs; however, we did not identify any statistically significant differences (data not shown). This led us to conclude that the features of the Reveal mobile application likely made it the patients’ primary tool for data analysis and decision-making. The app displays the data visually in a structured format with not only the same features as available on the more advanced meter but with additional features, allowing PWDs who use this more powerful tool in conjunction with even a basic connected meter to manage their diabetes as effectively as people using the more advanced connected meter.
Study limitations
With real-world data, there are often limitations in terms of our knowledge of the subjects’ medical history, adherence to, and/or changes in diabetes medications during the study period or the clinical goals set by their HCPs. Subjects who download the app (particularly at the suggestion or in the presence of their HCP) may choose to share their app data over time, including summary reports via email or text, depending on their HCP’s preferences. Therefore, a proportion of our subjects may have felt observed or were monitored, which is a common and desirable feature of digital health products. Furthermore, we cannot verify the type of HCPs seen by the subjects, how they used the meter or app data to adjust therapy or how often, or if, therapy changes were made, and it is unclear if specific subjects were offered CGM during this timeframe while continuing to use BGM. While we acknowledge the inability to definitively attribute causality without a control group, the pre/post analysis within the same cohort provides valuable insights into real-world effectiveness. Longitudinal studies in larger samples are needed to confirm our results.
Conclusions
Real-world data demonstrate improvements in RIR, with proportionate and clinically meaningful reductions in hyperglycemic readings in 3790 PWDs who started using a mobile diabetes management app with a Bluetooth® connected BG meter. Using such an app may allow more informed decisions regarding therapy and lifestyle, highlighting the importance of these widely available glucose monitoring tools and the additional benefit of adding the digital app with its actionable insights for PWD that will address their needs across geographic boundaries.
Authors’ Contributions
D.N.L.: Wrote original draft, formal analysis; V.A.P.: Supervision and validation; G.R.G.: Conceptualization, supervision and validation; O.A.R.: Provided processed aggregated statistical medical data, statistical analyses; M.G. and E.H.: Contributed to the study design and reviewed and edited the article. All authors discussed the results and contributed to the final article.
Footnotes
Author Disclosure Statement
D.N.L., V.A.P., G.R.G., and O.A.R. have nothing to disclose; M.G. and E.H. are current employees of LifeScan.
Funding Information
The non-LifeScan authors received no specific funding for this work. Study design, review, and editing of the article were funded by LifeScan.
Ethical Statement
For this retrospective data analysis, we used de-identified aggregated BG data from the app server with medical data. Data were obtained from registered users of LifeScan’s OneTouch Reveal app. Users who download the app are informed about processing of personal data in accordance with its privacy policy, and they provided consent to use of de-identified aggregated data to perform analysis and provide medical insights on managing certain groups of PWD. Additional ethics committee approval and informed consent was not required.