
Abstract
Background:
The OneTouch Verio Flex® (OTVF) blood glucose (BG) meter features a ColorSure® Range Indicator. Diabetes management is enhanced by connecting the meter to the OneTouch Reveal® (OTR) mobile app. We sought to provide real-world evidence (RWE) that combining both devices improves glycemic control.
Methods:
Anonymized glucose and app analytics were extracted from a server from over 144 000 people with diabetes (PWDs). Data from their first 14 days using OTVF and OTR were compared with 14 days prior to 90- and 180-day timepoints using paired within-subject differences.
Results:
In people with type 1 diabetes (PwT1D) or people with type 2 diabetes (PwT2D), readings in-range (RIR) improved by +6.1 (54.5% to 60.6%) and +11.9 percentage points (68.2% to 80.1%), respectively, over 180 days, and hyperglycemia was reduced by −6.6 (40.5% to 33.9%) and −12.0 (30.3% to 18.3%). In total, 35% of PwT1D and 40% of PwT2D improved RIR by >10 percentage points. People with type 1 diabetes spending two to four sessions or 10 to 20 minutes per week on the app improved RIR by +5.1 and 7.0, respectively. People with type 2 diabetes spending two to four sessions or 10 to 20 minutes per week on the app improved RIR by +11.6 and 12.0, respectively. In PwT1D or PwT2D, mean BG reduced by −11.4 and −19.5 mg/dL, respectively, from baseline to 180 days, with no clinically meaningful changes in percentage of hypoglycemic readings. All glycemic changes were statistically significant (P < .0005 level).
Conclusion:
Real-world data from over 144 000 PWDs demonstrated improved percentage readings in-range and reduced hyperglycemia in PWDs using the OneTouch Verio Flex blood glucose meter and OneTouch Reveal app.
Keywords
Introduction
A comprehensive analysis of randomized controlled trials (RCTs) found that blood glucose monitoring (BGM) reduced hemoglobin A1c (A1c) by −0.3% compared with usual care, with a further A1c improvement of −0.2% in those performing structured BGM. 1 The value of structured BGM and the importance of acting upon trends and insights from glucose data were also shown in a RCT comparing PwT2D performing structured monitoring via seven-point profiles every two months compared with a routine testing group who performed BGM once on three separate days each week. The A1c decreased by an additional −0.32% in those performing structured monitoring, which the authors attributed in part to physicians changing diabetes medications more actively. 2 Improved treatment adherence using a connected BGM integrated to the OTR diabetes app has also been observed in PwT1D. 3 The introduction of continuous glucose monitoring (CGM) provided access to a wealth of data, although harnessing the opportunities created requires PWDs and their HCPs to interpret and act upon the available insights. This requirement for data interpretation to promote action applies equally to BGM technologies. In fact, one of the first CGM studies (REPLACE) comparing Freestyle Libre with Freestyle Lite (a relatively simple BGM without app connectivity) did not achieve the primary outcome of improved A1c with CGM compared with BGM, perhaps because PWDs in REPLACE may not have been adequately empowered or trained to act upon the CGM data between HCP visits. 4 In terms of leveraging technology, Bergenstal et al 5 found consistent use of glucose data, regardless of device (structured BGM vs CGM), led to similar improvements in time in-range and A1c over 16 weeks. The MOBILE study in PwT2D on basal insulin demonstrated that regular monitoring using a connected OTVF meter, which features a color range indicator (CRI), combined with additional insights from the OTR diabetes app, elicited a clinically meaningful A1c reduction of −0.6%, with the Dexcom G6 CGM lowering A1c by a further −0.4%. 6
The frequency of CGM readings (every one to five minutes) has allowed PWDs to track time in-ranges (TIR), and, despite a lower frequency of readings using episodic BGM, a corresponding metric can still be applied. Cutruzzolà et al 7 described this corresponding BGM metric as “points in-range” (PIR) and detected a significant correlation between A1c and PIR. In fact, each 10% change in PIR was associated with a change in A1c of 0.4% in PwT1D or PwT2D performing ≥3 or ≥2 checks per day, respectively. While PIR is a clear and valid descriptor, we recommend an alternative and potentially more readily understood term of “readings in-range” (RIR) to reinforce the fact these are episodic readings from a glucose meter. To substantiate RIR as an acceptable term, we conducted online market research in 129 HCPs wherein RIR was the top choice (data on file).
Our prior analysis of a real-world dataset from over 17 000 PWDs using a connected BGM with advanced on-meter insight, guidance, and encouragement features (OneTouch Verio Reflect®) in combination with the OTR app found a strong positive association between increasing OTR app engagement (in terms of more time spent on the app or more app sessions) and increasing RIR over three months. 8 This current analysis focuses on the real-world value of a simpler BGM in combination with the same diabetes app. Aside from understanding if we can achieve commensurate outcomes with a simpler BGM, this analysis extends duration of device exposure from three to six months and is based upon an eight-fold larger dataset of 144 000 PWDs.
Methods
The OTVF BGM features a CRI that points at blue if the BG reading is below range, at green if the reading is in-range, and at red if the reading is above range. Bluetooth® technology allows PWDs to sync OTVF to the OTR mobile app (Figure 1). People with diabetes can agree to share mobile app data in real time to HCPs who have the professional (web) version of OTR. The mobile app offers PWDs colorful trends and easy tracking of glucose readings, the ability to annotate readings with food, activity or insulin dosing information, and detection of low and high blood sugar patterns and provides a 14-day summary report that may also be helpful during consultations with their HCPs. Data automatically upload from the OTR app and are stored within a live Oracle Database hosted in Amazon RDS, encompassing OTR app data from 27 countries. Before data from Oracle are copied to a storage service called Amazon S3, personally identifiable information (PII) is removed. Data from Amazon S3 are queried using the Amazon Analytical Service, AWS Athena. Data from all countries are fetched by querying AWS Athena and loaded to an AWS Redshift cluster in the United States. PostgreSQL identified subjects who used both OTVF and OTR, and who had performed at least 180 readings over the first 180 days of using OTR. This analysis request automatically fetched meter BG readings for users who registered between January 2012 and August 2022. Subject data were assigned a unique alphanumeric identification (ID) in AWS Redshift and Athena. The usage of an ID is important in terms of user privacy and data protection. Athena also provided diabetes type and an association with the glucose data per subject ID. OneTouch Reveal app analytics (eg, time spent, number of sessions, and screens viewed in the OTR app) were also available in the servers and could be correlated with the BG data from individual subject IDs. The current analysis dataset is specific to users of the OTVF meter and OTR app and focused on the first 180 days after PWDs registered their app.
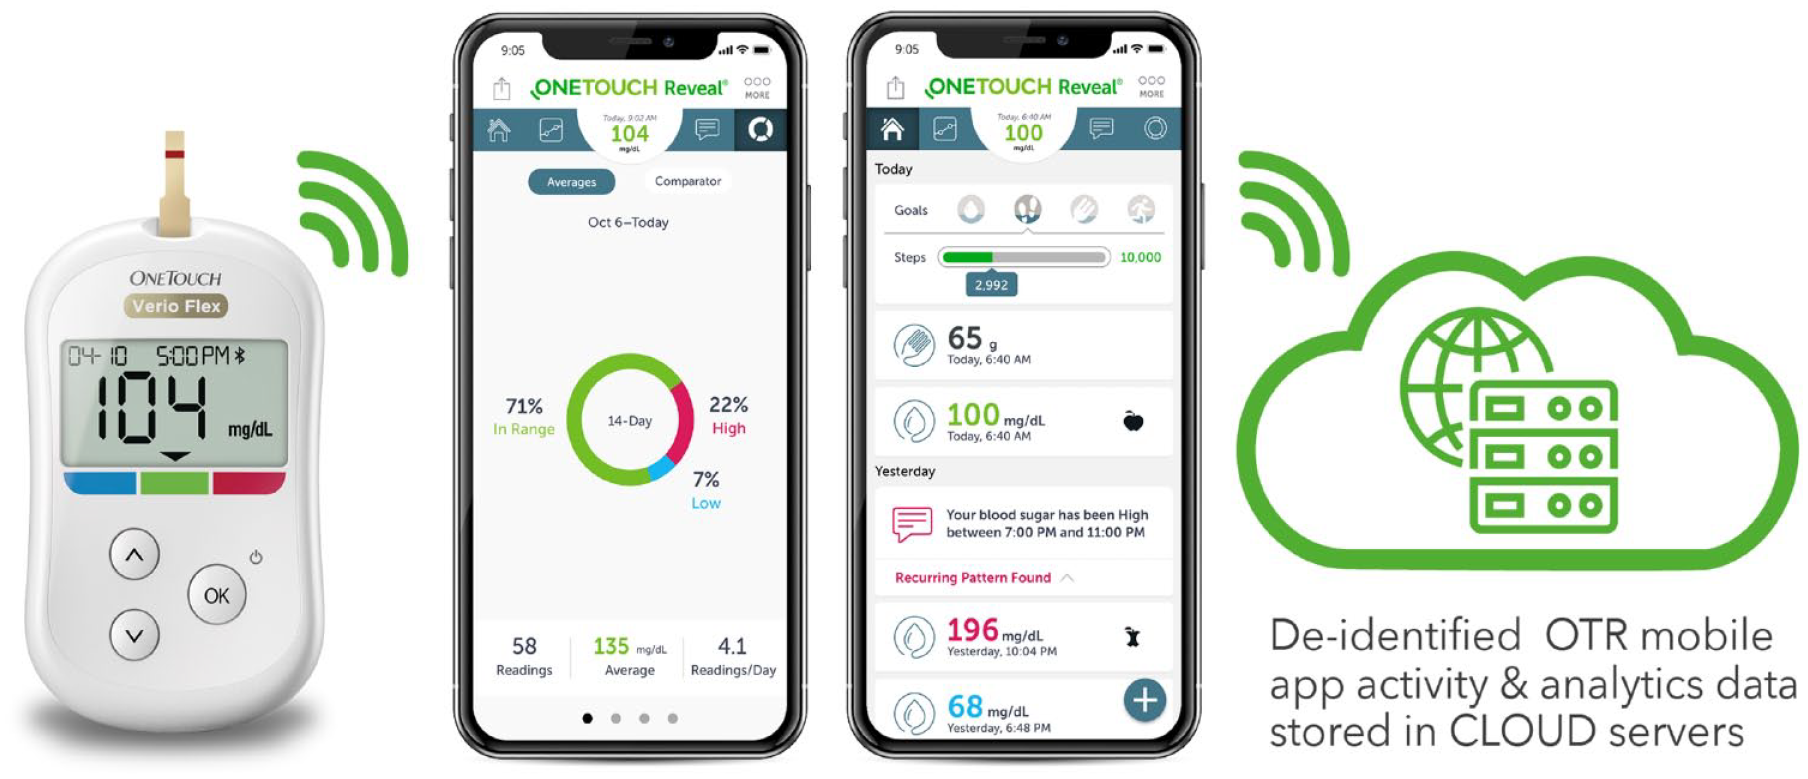
OTVF meter, OTR app, and Cloud data collection.
Statistical Analysis
All analyses were performed separately for each diabetes type. The following glycemic indicators were used for grouping all BG readings: low (<70mg/dL), in-range (70-180mg/dL), and high (>180mg/dL). The number of days from when a subject first started using the OTR app with the OTVF meter was determined and time windows created for baseline (first 14 days of app usage), 90 days, and 180 days (last 14 days prior to the 90- and 180-day timepoints). For inclusion in either dataset, subjects were required to have at least 90 readings within the 90-day timeframe or at least 180 readings within the 180-day timeframe to ensure that we sampled PWDs who were monitoring regularly. Subjects with data available within the respective 90- or 180-day windows were retained to enable pairwise comparisons between starting and ending values. For each subject, the mean BG and percentage of readings within each of the glycemic indicator categories were calculated for baseline, 90-, and 180-day time windows and the within-subject changes from baseline determined. For each subject, the number of app sessions and time spent on the app per week were categorized as follows: <1 session per week, 1 to 2, >2 to 4, >4 to 10, and >10 sessions per week; and <2 minutes per week, 2 to 5, >5 to 10, >10 to 20, >20 to 40, >40 to 60, and >60 minutes per week. All statistical comparisons between baseline, 90, and 180 days were performed by paired-sample t-tests using IBM SPSS Statistics 21 and Minitab 20.
Results
This analysis includes two separate datasets. The first dataset covers 24 386 PwT1D and 119 876 PwT2D using the OTVF meter with the OTR app over a 90-day timeframe, and the second dataset covers 16 591 PwT1D and 97 119 PwT2D over a 180-day timeframe using the same meter and app. This section focuses on changes over 180 days given that the outcomes of PWDs experiencing both devices over a longer timeframe will be more clinically relevant to healthcare professionals by demonstrating durability of effect.
Overall Changes in Glycemic Control Over 180 Days
In PwT1D or PwT2D, mean BG reduced by −11.4 and −19.5 mg/dL, respectively, comparing baseline to 180 days. Readings in-range improved significantly by +6.1 (54.5% to 60.6%) and +11.9 percentage points (68.2% to 80.1%) in PwT1D and PwT2D, respectively, over 180 days. Hyperglycemic readings were reduced by −6.6 (40.5% to 33.9%) and −12.0 percentage points (30.3% to 18.3%) in PwT1D and PwT2D, respectively, mirroring the positive changes in RIR over 180 days. Hypoglycemic readings increased marginally, but not clinically meaningfully, by +0.5 percentage points (5.0% to 5.5%) in PwT1D. The proportion of hypoglycemic readings in PwT2D was far lower and remained essentially unchanged in PwT2D during the study, increasing by only +0.1 percentage points (from 1.5% to 1.6%). Baseline monitoring frequency was higher for PwT1D than PwT2D (3.5 vs 2.2 checks per day). Both groups significantly reduced their monitoring frequency by 0.5 checks per day comparing baseline to 180 days. Similar glycemic changes and trends were observed in the 90-day dataset for PWDs (Table 1A-B). All glycemic changes, including changes in monitoring frequency, were statistically significant at the P < .0005 level. Further analysis of the 180-day dataset found 44.8% (7432 of 16 591) of PwT1D improved RIR by >5 percentage points and 34.9% (5791 of 24 386) improved by >10 percentage points. Similarly, 50.1% (48 588 of 97 119) of PwT2D improved RIR by >5 percentage points and 40.5% (39 293 of 97 119) by >10 percentage points over 180 days.
Summary of Aggregated Glycemic Data Over 90 and 180 Days.
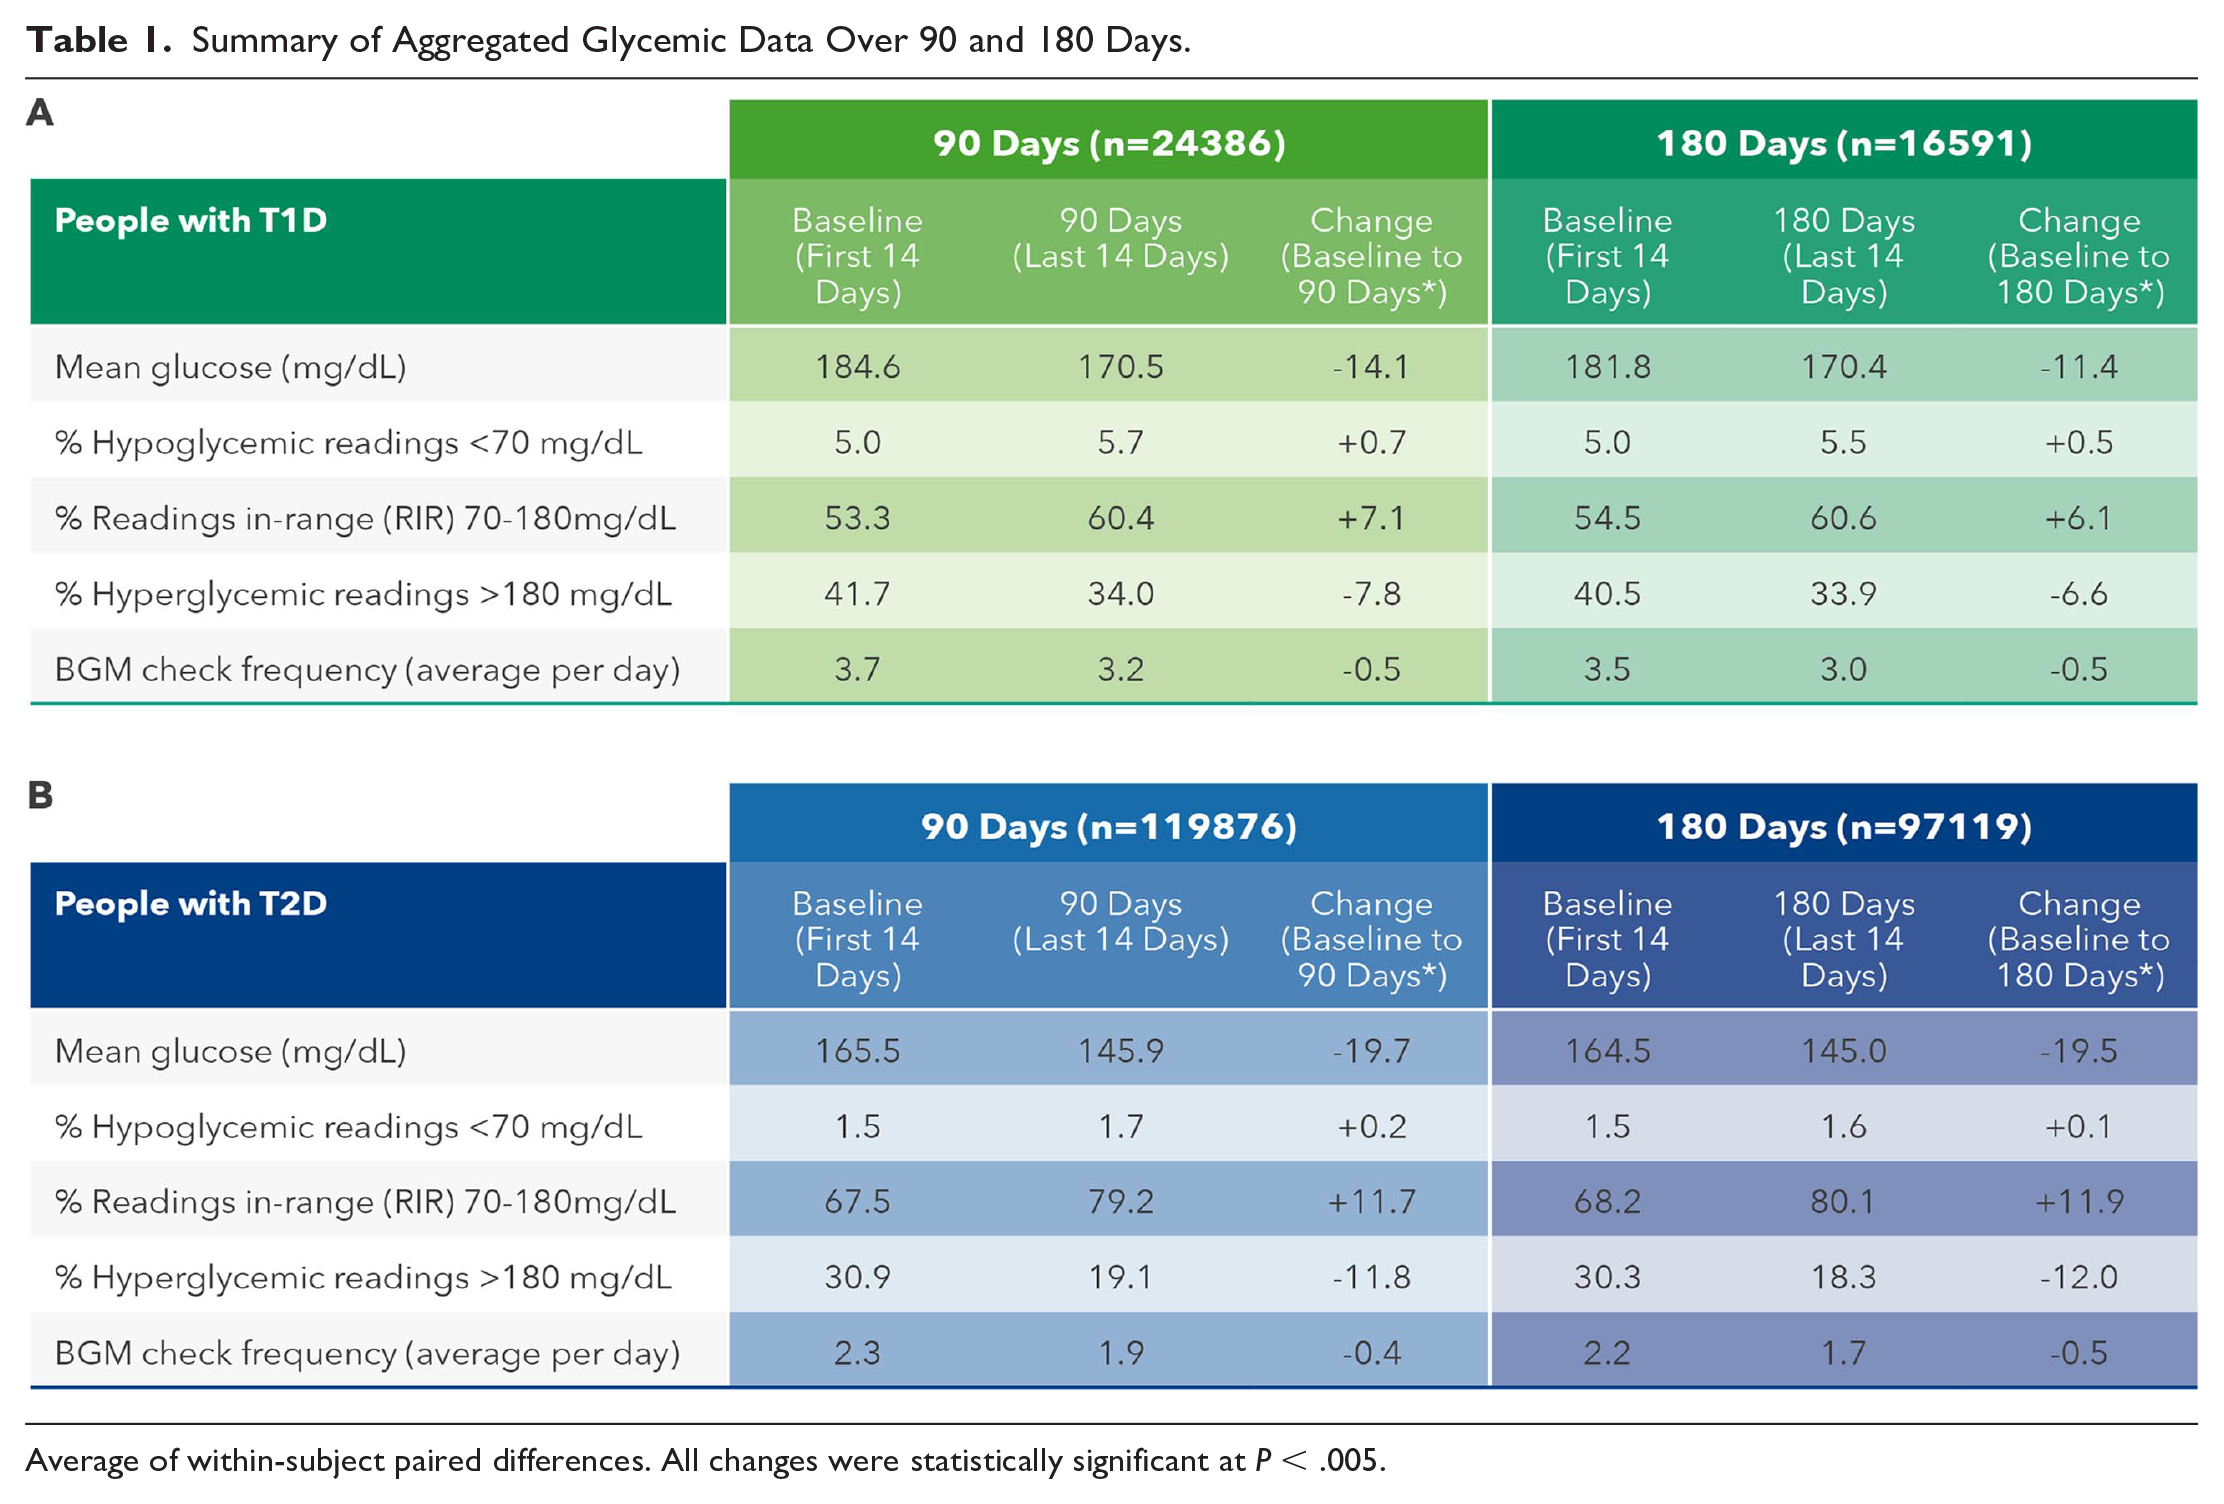
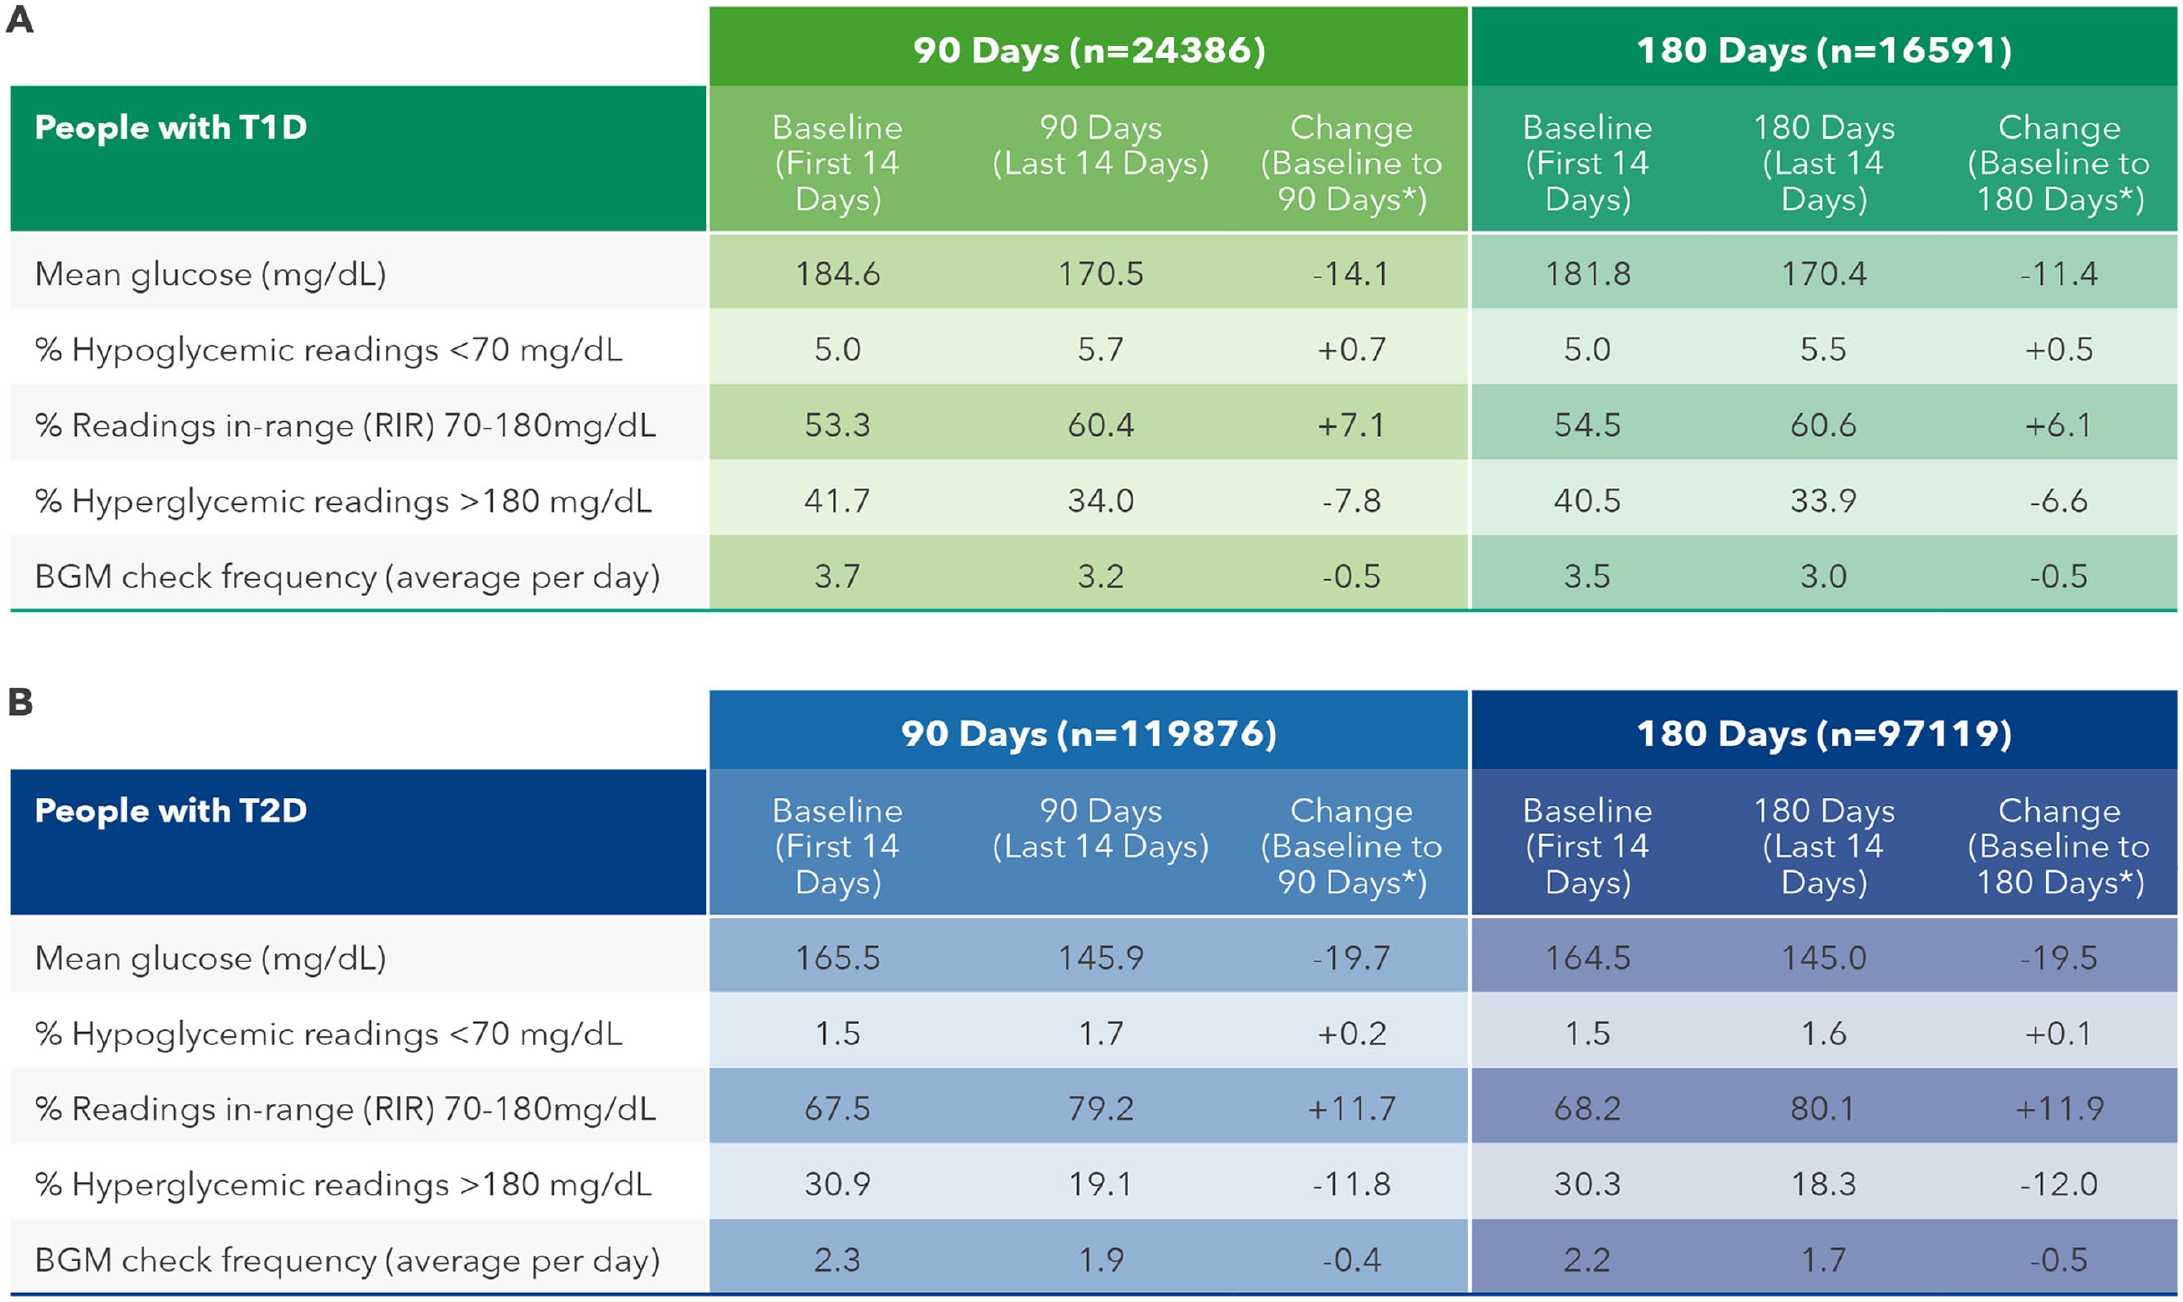
Average of within-subject paired differences. All changes were statistically significant at P < .005.
Effect of Number of OneTouch Reveal App Sessions on Glycemic Control
Significant reductions in mean BG were observed in PwT1D engaging in one or two app sessions per week (−7.4 mg/dL) over 180 days, with the highest reductions in mean BG seen in those engaging in four to 10 sessions (−17.0 mg/dL) and >10 sessions per week (−19.0 mg/dL). Clinically meaningful improvements in RIR were seen in PwT1D conducting at least two to four app sessions per week (+5.1 percentage points) and increased to +10.0 percentage points in those conducting >10 sessions per week. Improvements in RIR were mirrored by concomitant reductions in proportion of hyperglycemic readings in PwT1D, with clinically significant reductions in readings in hyperglycemic range observed in PwT1D engaging in at least two to four app sessions per week (-5.8 percentage points), increasing to −10.5 percentage points in those engaging in >10 sessions per week. (Table 2A). In our larger dataset of 97 119 PwT2D, we observed greater improvements in mean BG, RIR and proportion of readings in hyperglycemic range than those recorded in PwT1D. However, in contrast to PwT1D, PwT2D who performed less than one app session per week substantially improved mean glucose (−14.2 mg/dL) and RIR (+8.6 percentage points) and had meaningful reductions in hyperglycemic readings of −8.7 percentage points (Table 2B). It is notable that monitoring frequency was significantly higher in both PwT1D and PwT2D who engaged in the most app sessions per week compared with those performing the least sessions per week. Because monitoring frequency did not change from baseline to 180 days within each category of app sessions per week, monitoring frequency does not easily explain the improvements seen in glycemia measures.
Effect of Number of App Sessions on Glycemic Changes in PWDs.
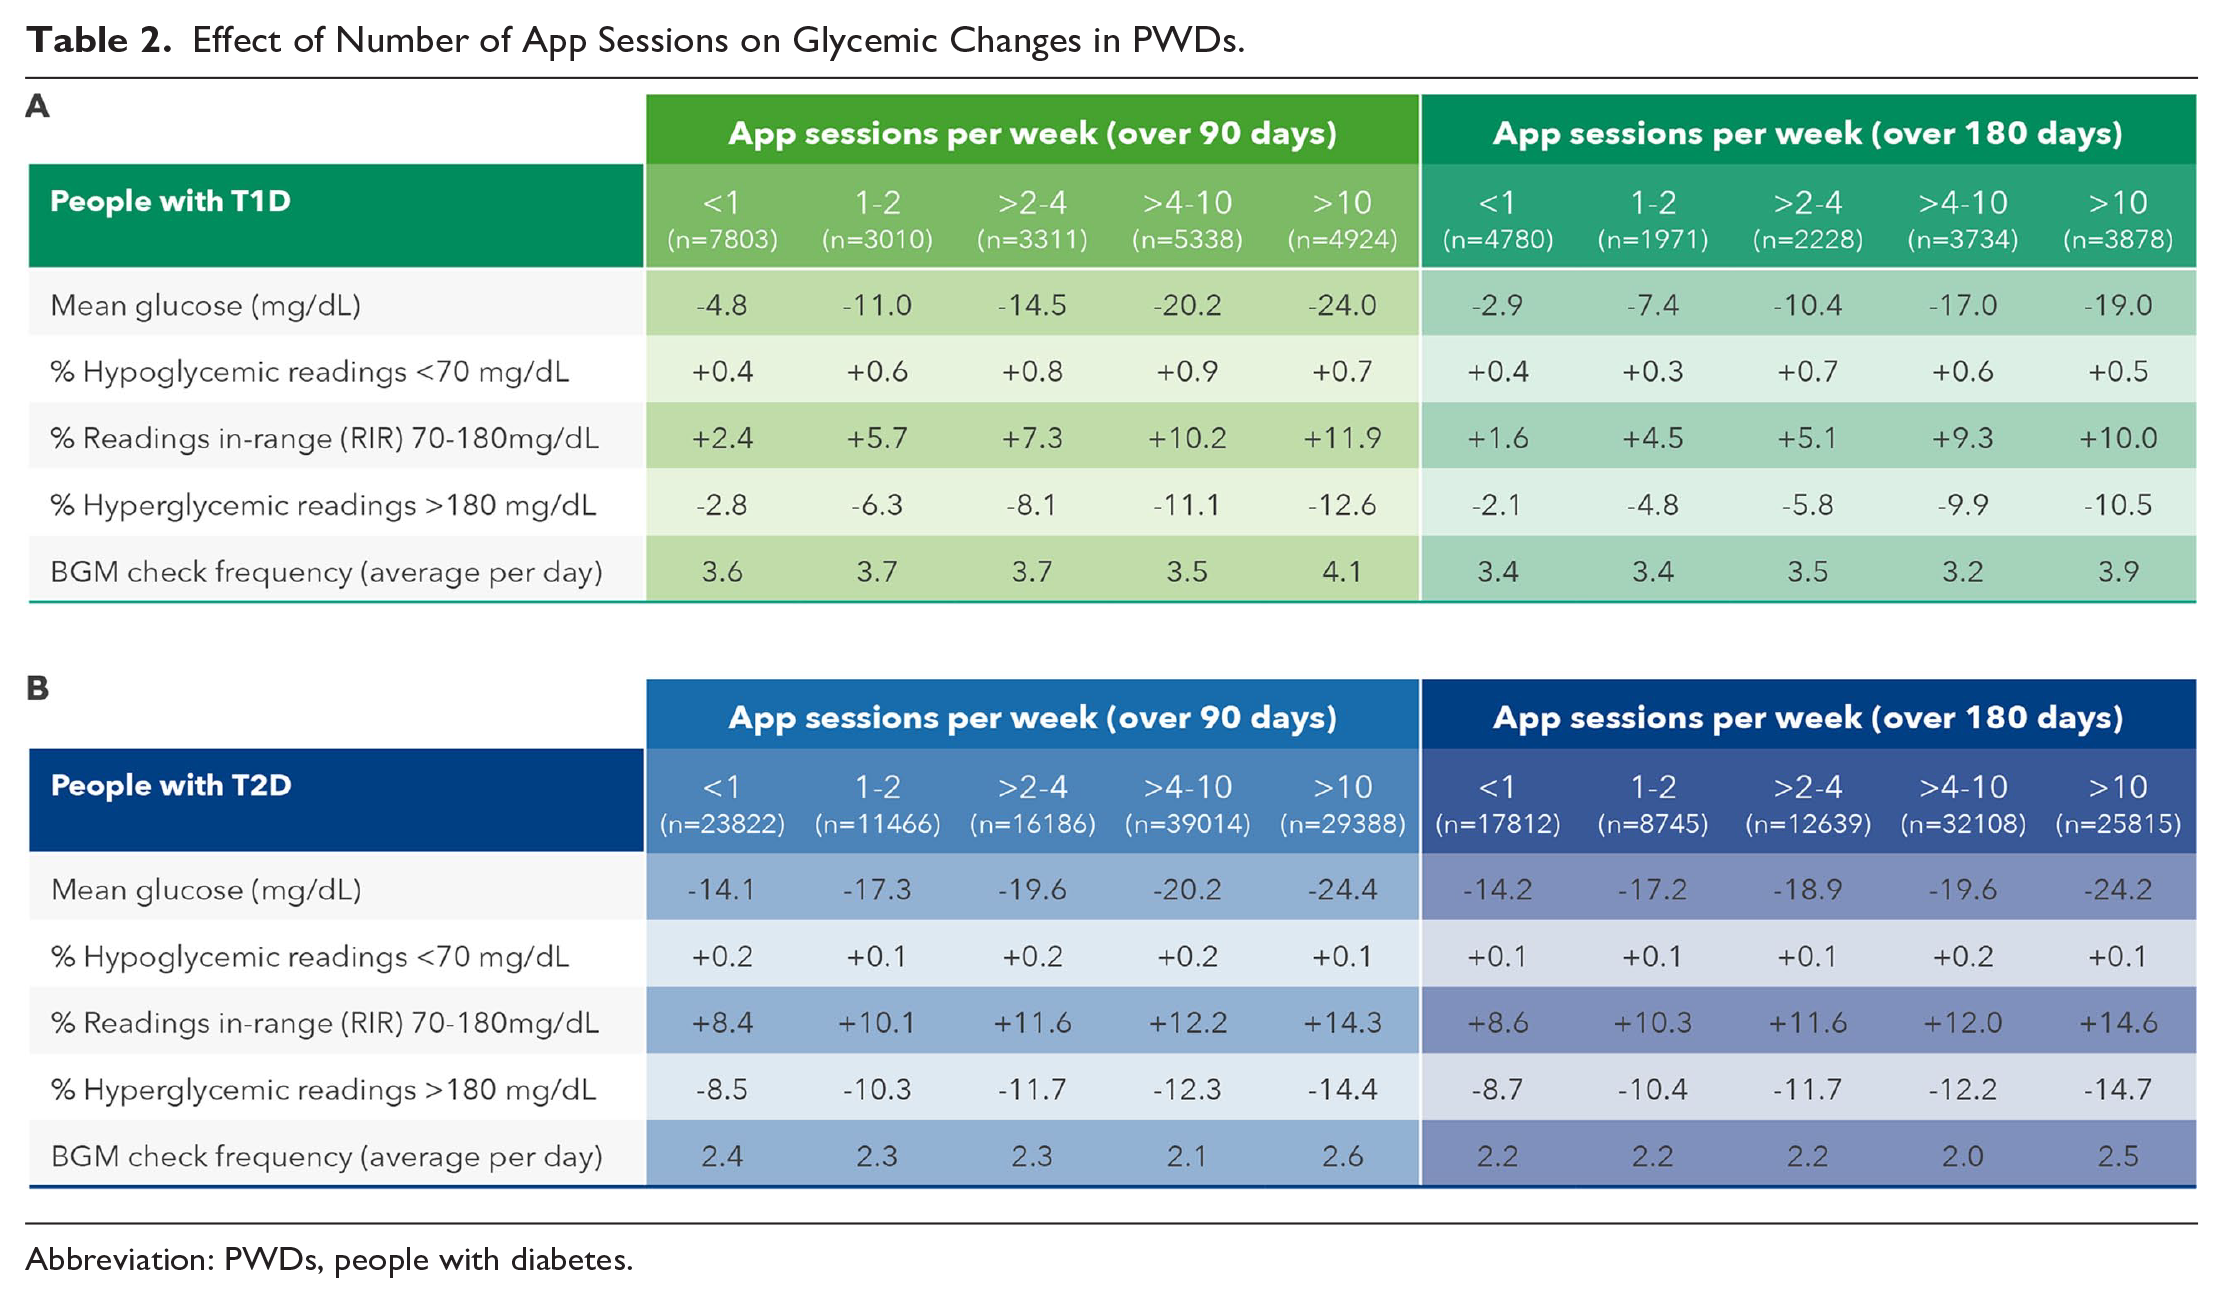
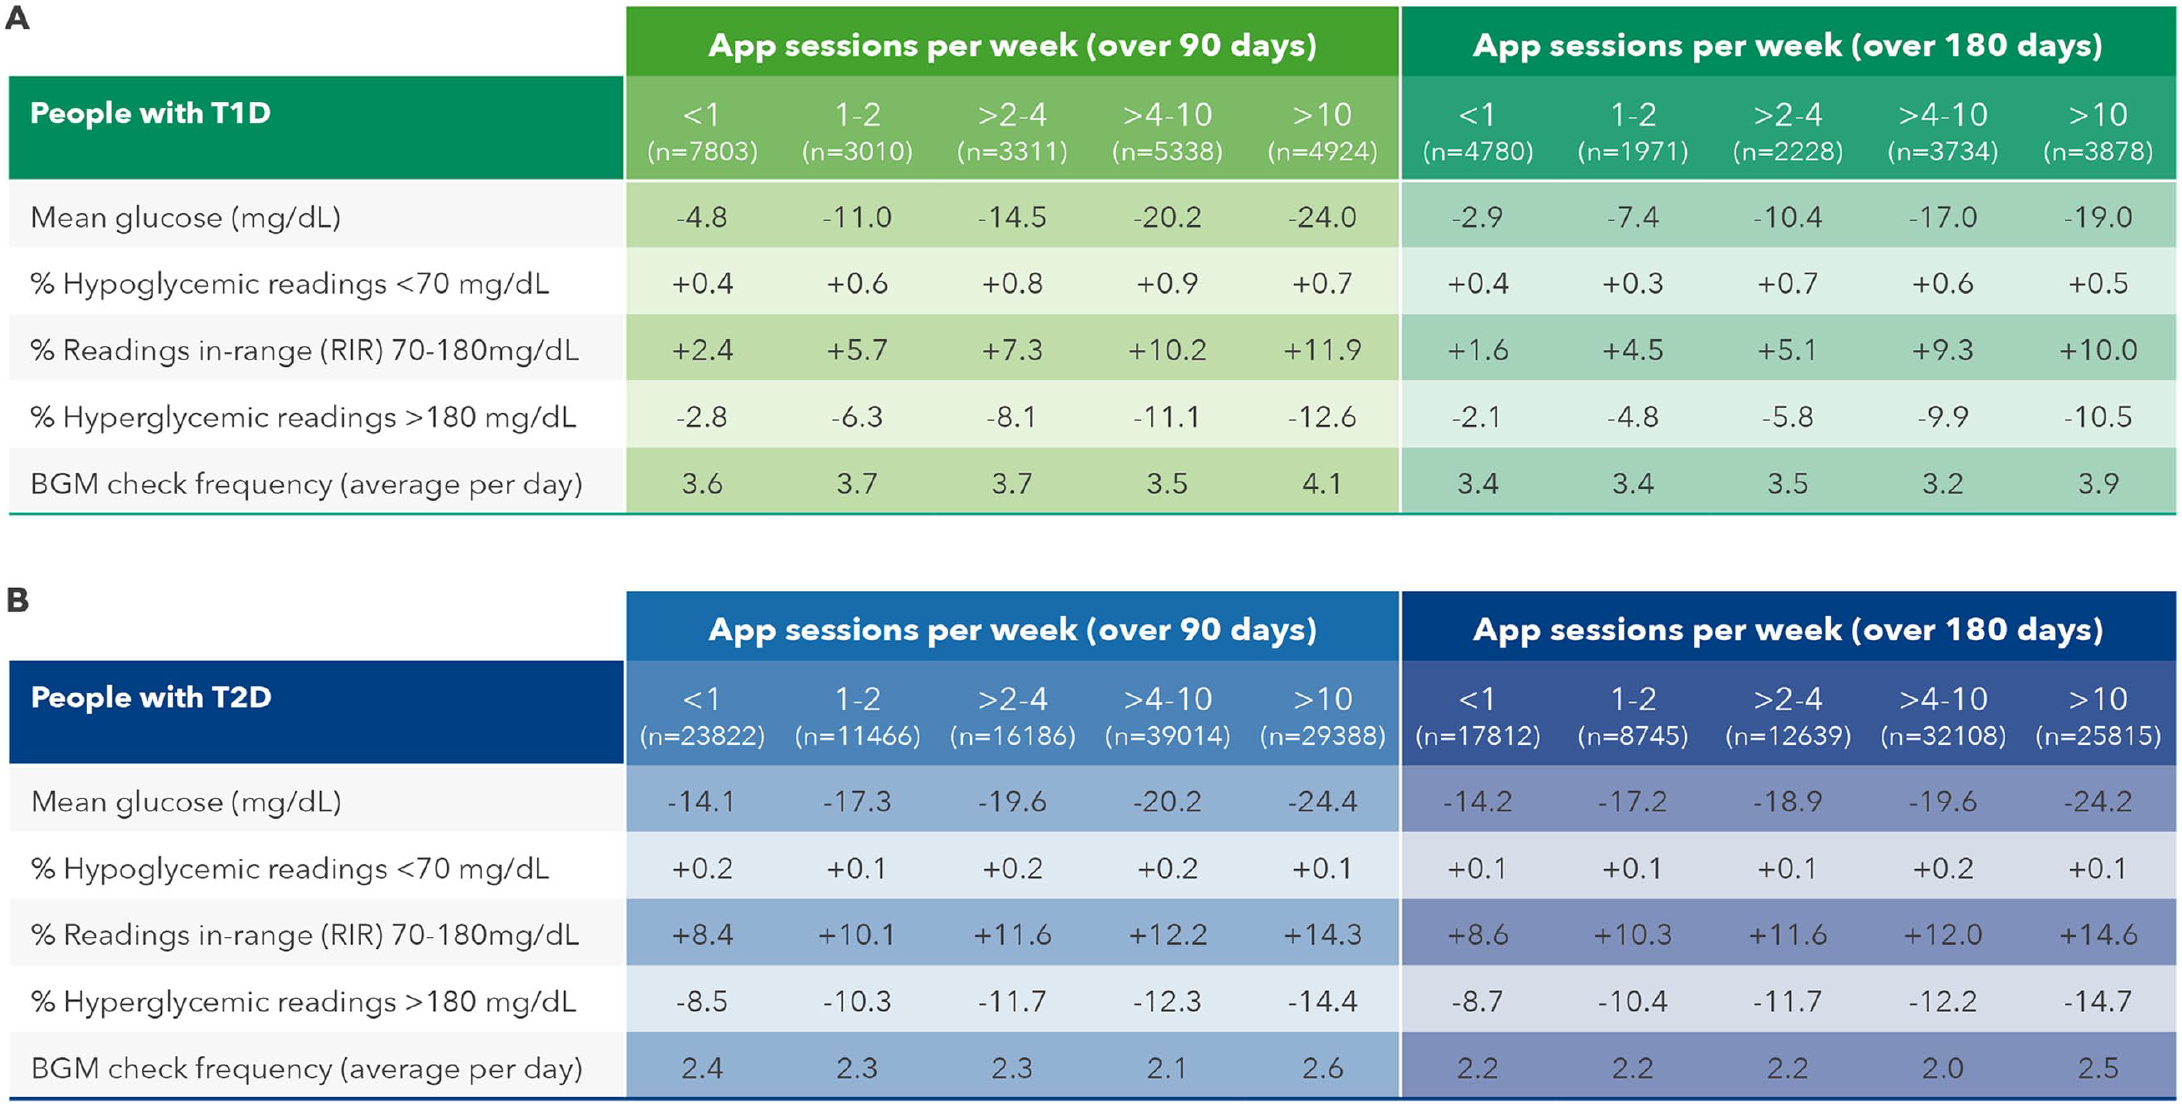
Abbreviation: PWDs, people with diabetes.
Effect of Time Spent Using the OneTouch Reveal App on Glycemic Control
Significant reductions in mean BG were observed in PwT1D spending five to 10 minutes per week on the OTR app (−10.7 mg/dL) over 180 days, with the highest reduction in those spending between 40 and 60 minutes per week (−17.5 mg/dL). Clinically meaningful improvements in RIR were seen in PwT1D spending over 10 to 20 minutes on the app (+7.0 percentage points), and this increased to +9.7 percentage points in those spending up to 60 minutes per week. Improvements in RIR were mirrored by similar reductions in proportion of hyperglycemic readings in PwT1D, with clinically significant reductions in hyperglycemic readings observed in those spending up to 20 minutes on the app (−7.7 percentage points), increasing to −10.0 percentage points in those engaging with the app for up to 60 minutes per week. (Table 3A). In the larger dataset of 97 119 PwT2D, there were greater improvements in mean BG, RIR and reductions in hyperglycemic readings than for PwT1D. People with type 2 diabetes who spent up to 10 minutes per week on the OTR app improved mean BG (−18.0 mg/dL) and RIR (+10.9 percentage points) and had concomitant reductions in hyperglycemic readings of −11.1 percentage points (Table 3B). In keeping with the data on app sessions per week, monitoring frequency was significantly higher in both PwT1D (4.5 vs 3.4 checks per week) and PwT2D (2.8 vs 2.3 checks per week) comparing those spending the most to the least time on the app per week. However, similar to what was seen with categories of sessions on the app per week, monitoring frequency remained largely unchanged within each category of time spent on the app from baseline to 180 days, again suggesting that monitoring frequency does not explain the glycemic improvements seen.
Effect of Time Spent on the App on Glycemic Changes in PWDs.
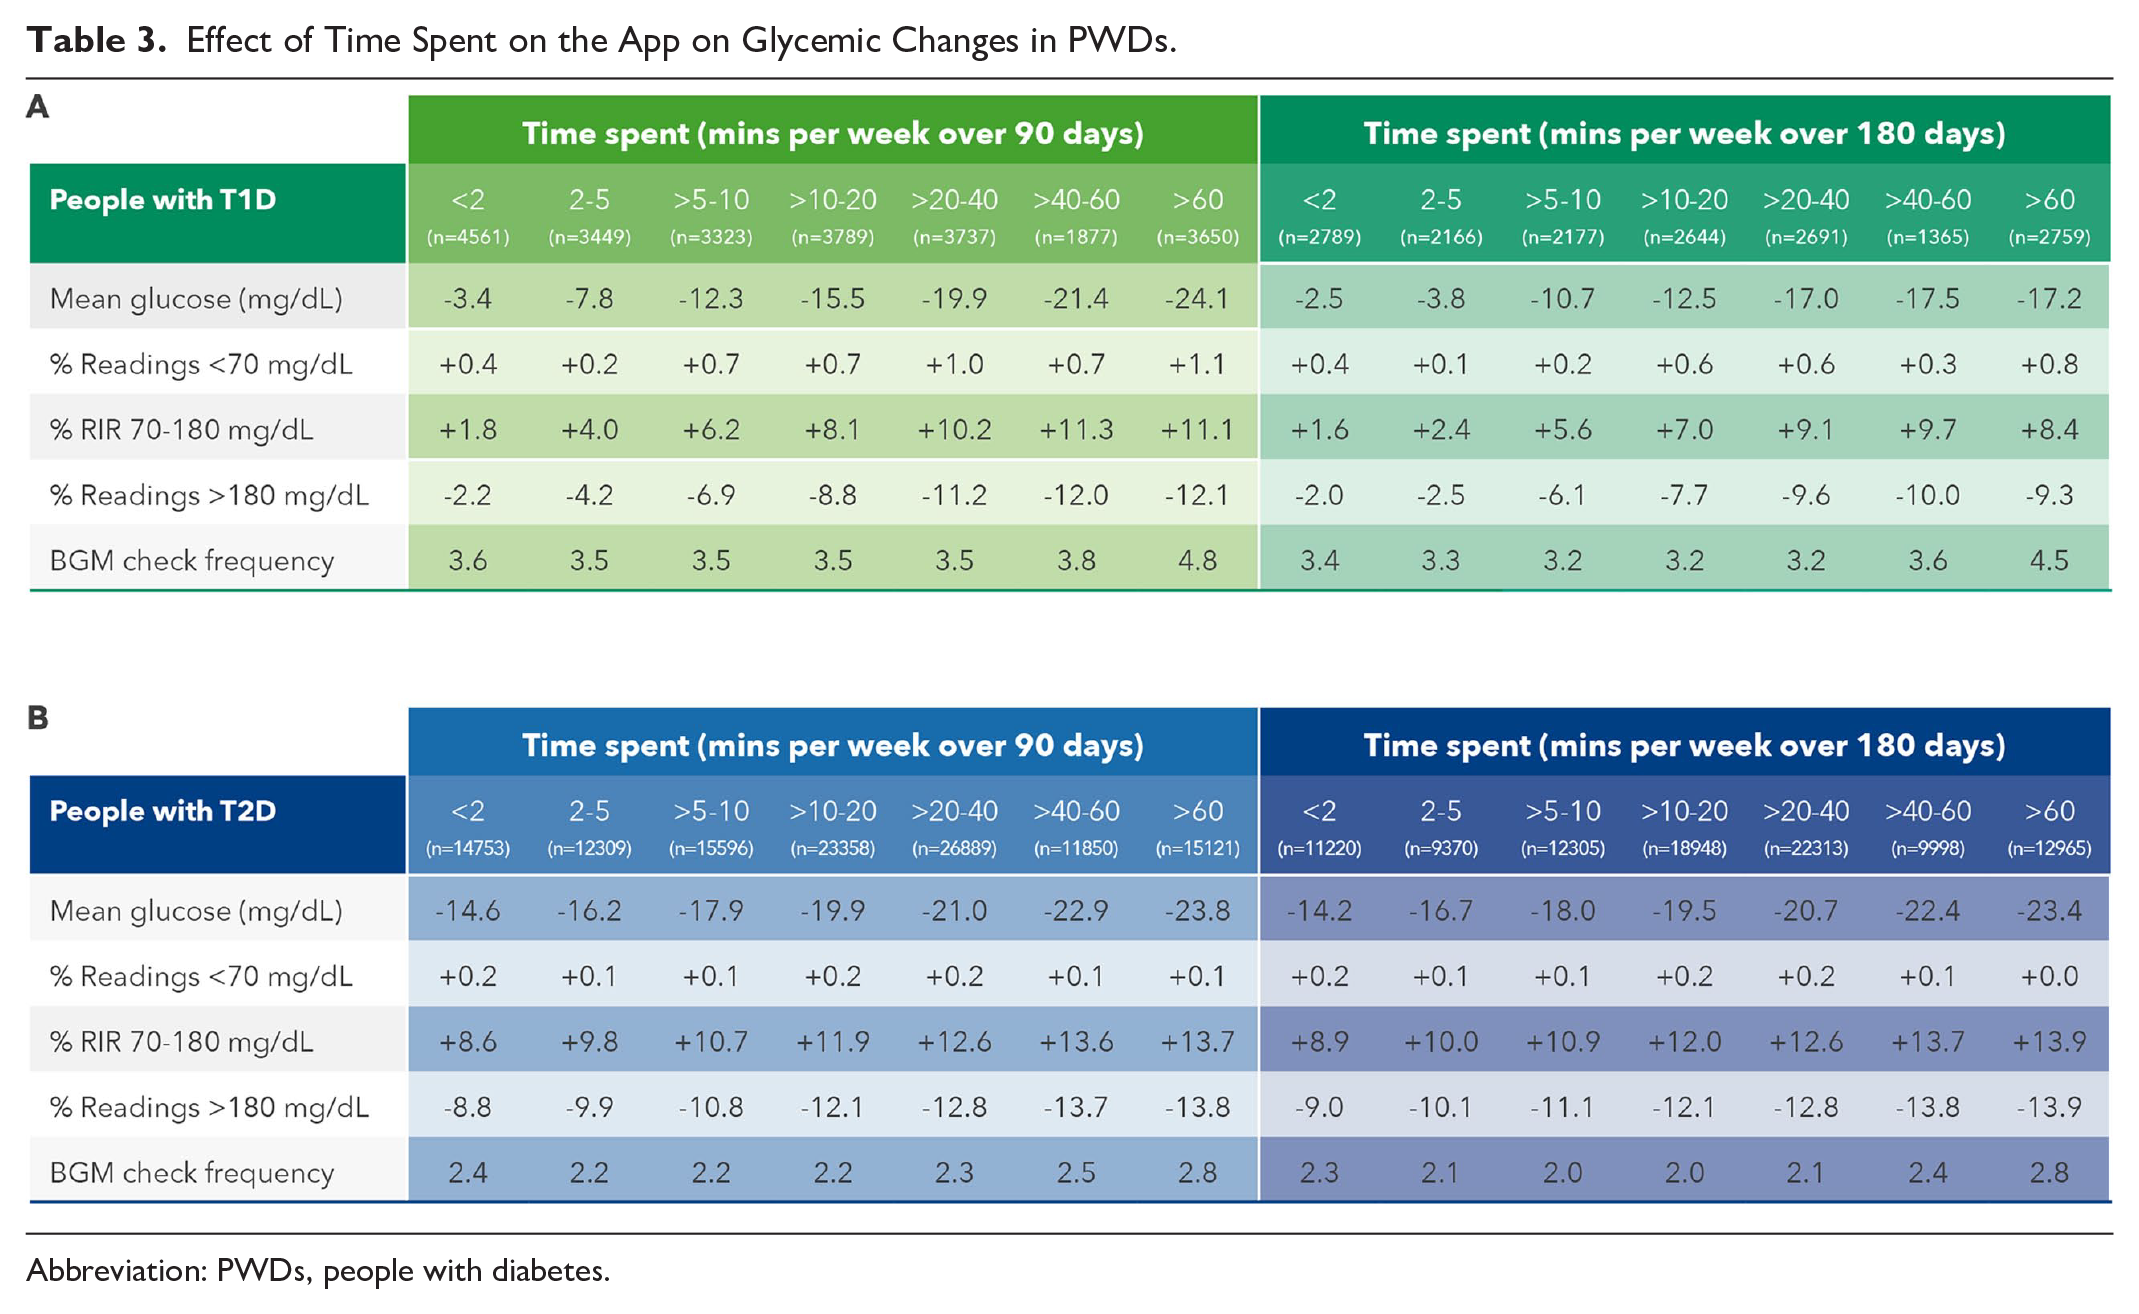
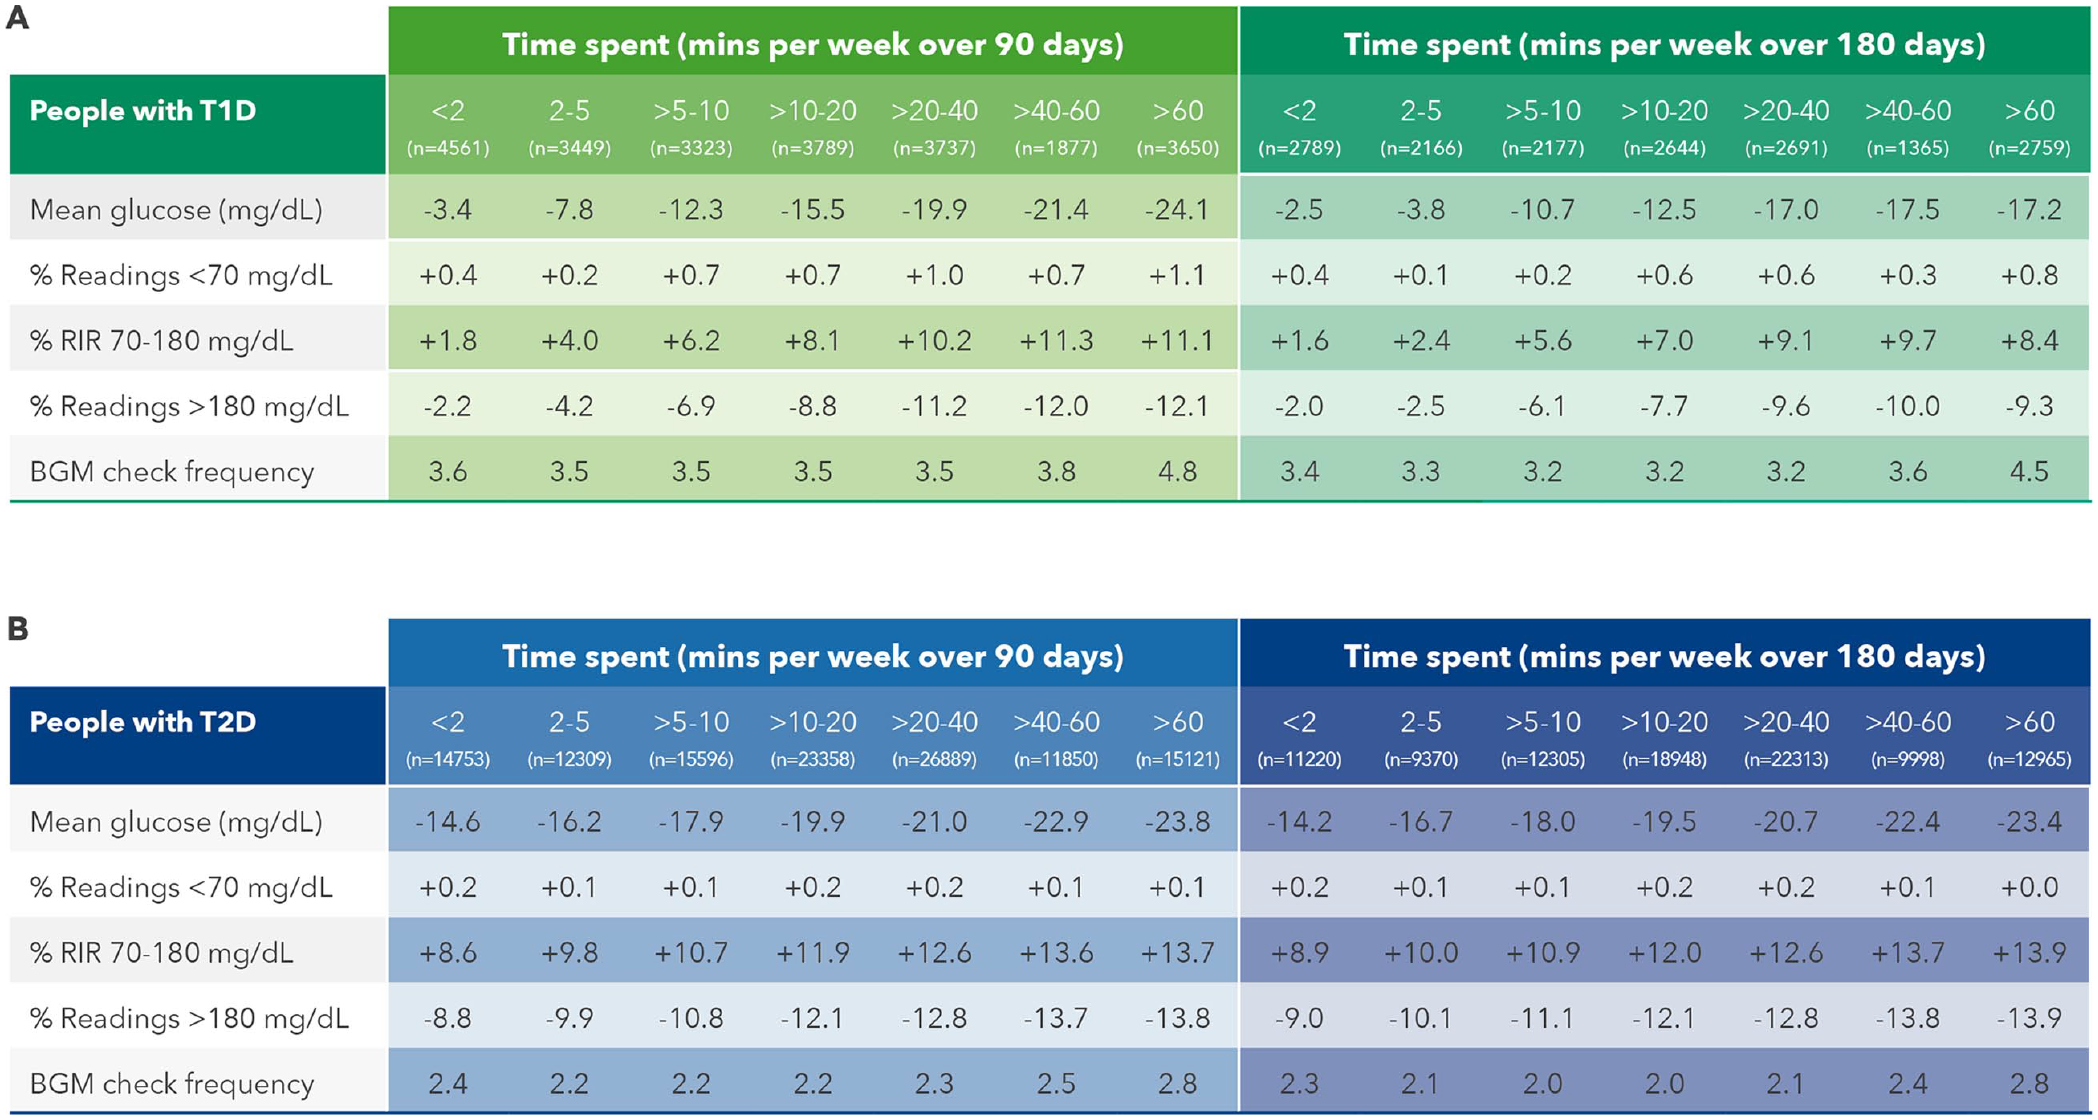
Abbreviation: PWDs, people with diabetes.
Observations on the Extent of Glycemic Changes and Monitoring Behavior in People With Diabetes
Aggregated data demonstrated that overall improvements in mean BG and RIR were significantly higher for PwT2D than for PwT1Ds (Table 1). In PwT1D, however, the improvement in both metrics surpassed those of PwT2D when comparing the most to the least engaged PWDs (Table 4). For instance, RIR changed by +8.4 percentage points in PwT1D compared with +6.0 percentage points in PwT2D comparing those performing most to least app sessions over 180 days. These observations are perhaps more evident graphically (Figures 2 and 3) where changes in RIR were plotted as a function of app engagement. Furthermore, although overall changes from baseline in monitoring frequency were fairly static, there were significant differences in monitoring frequency, comparing the most to the least app-engaged PWDs.
Effect of App Engagement Level on Glycemia and Monitoring Behavior in PWDs.
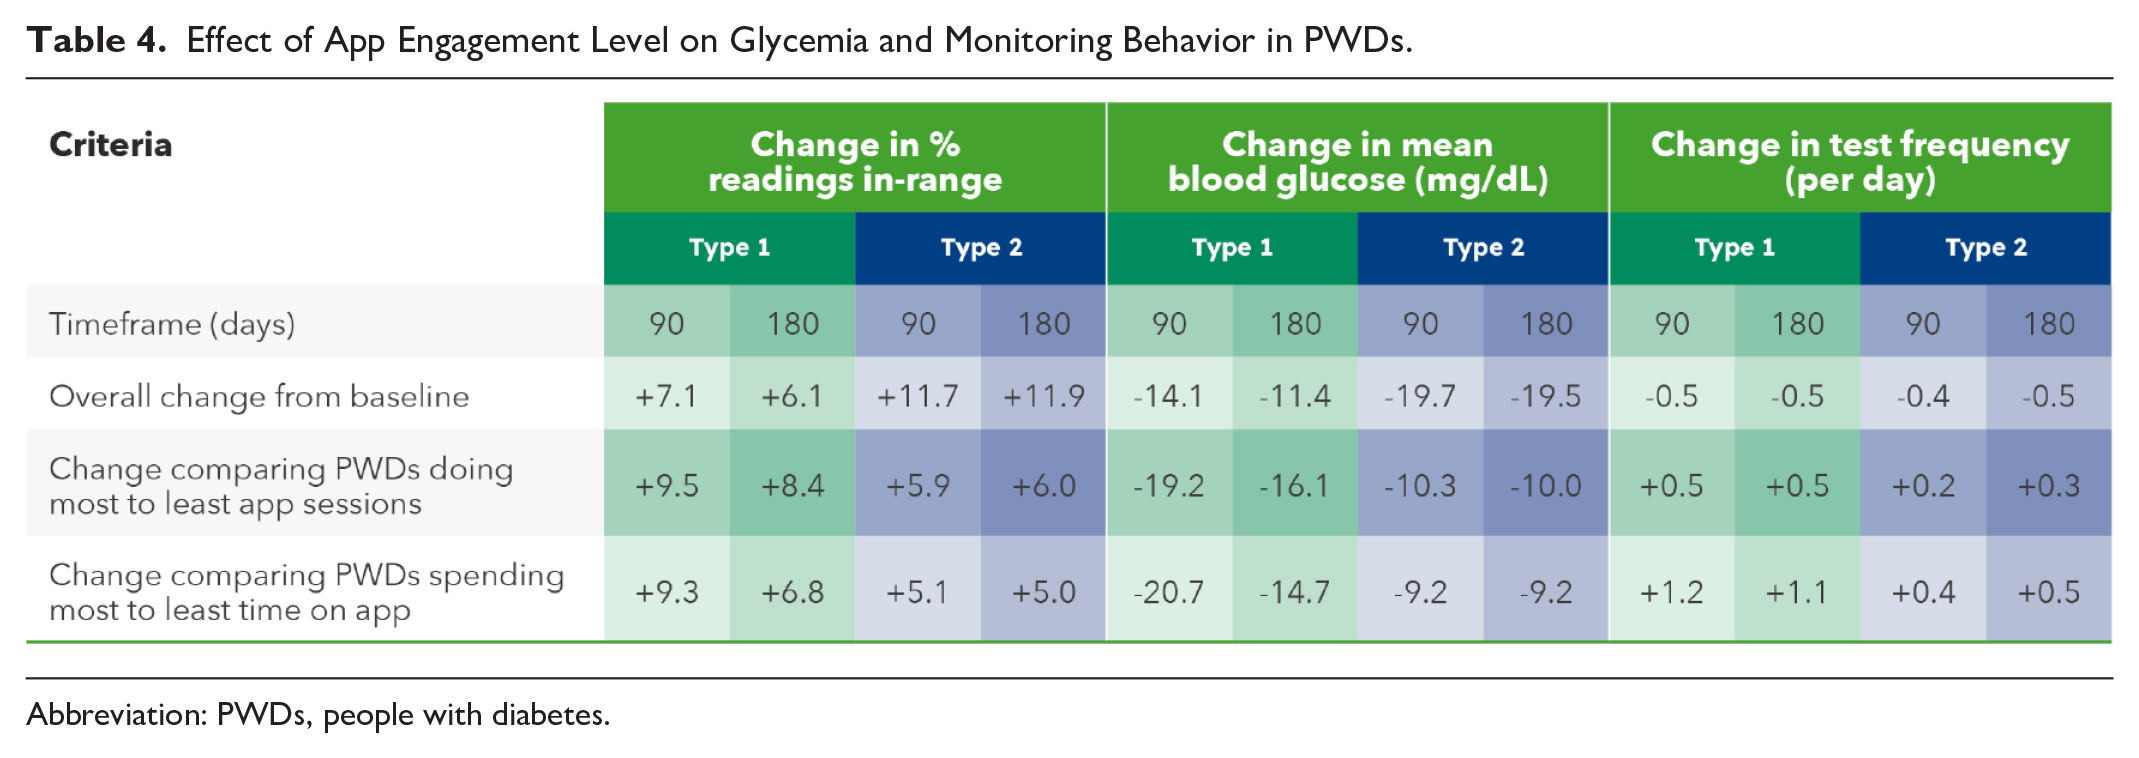
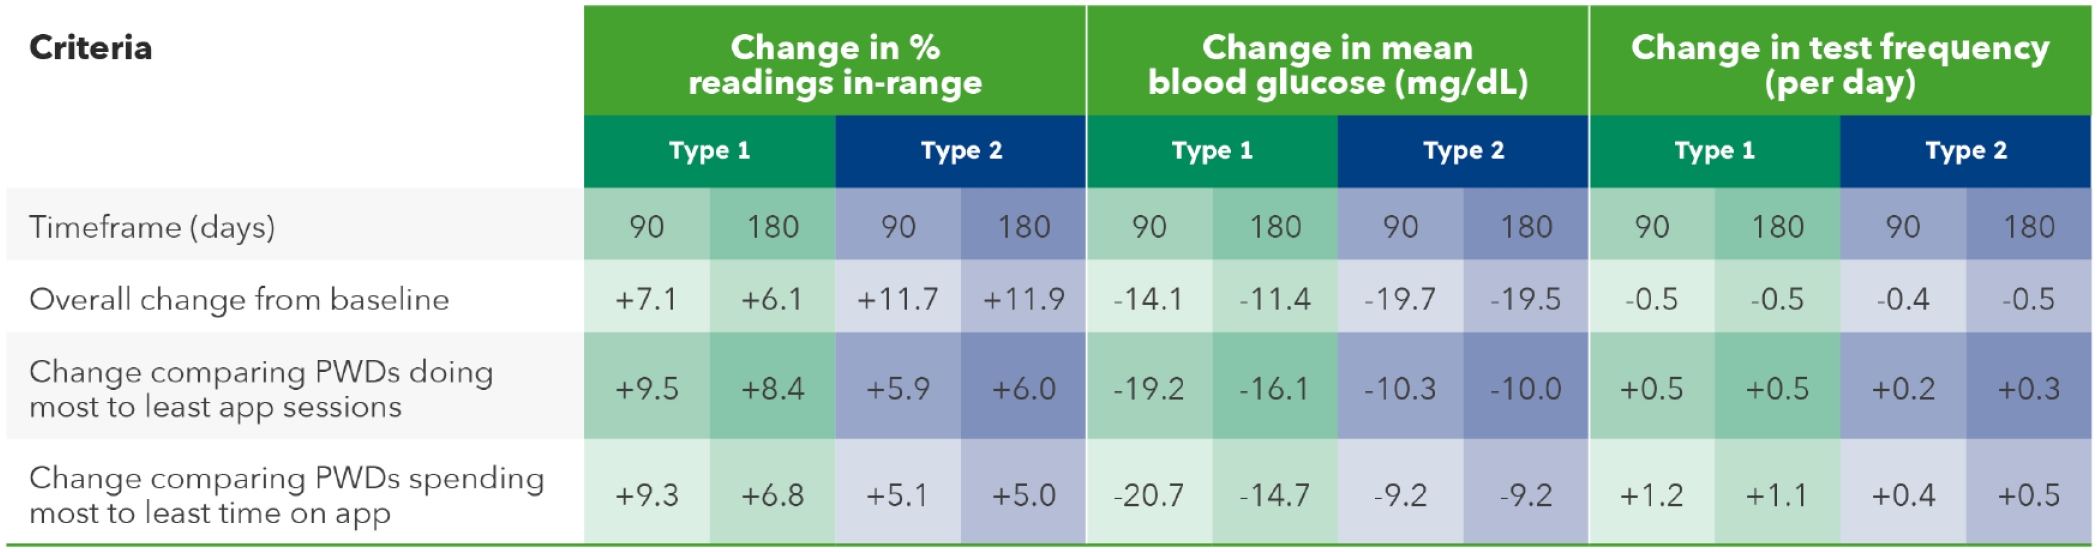
Abbreviation: PWDs, people with diabetes.
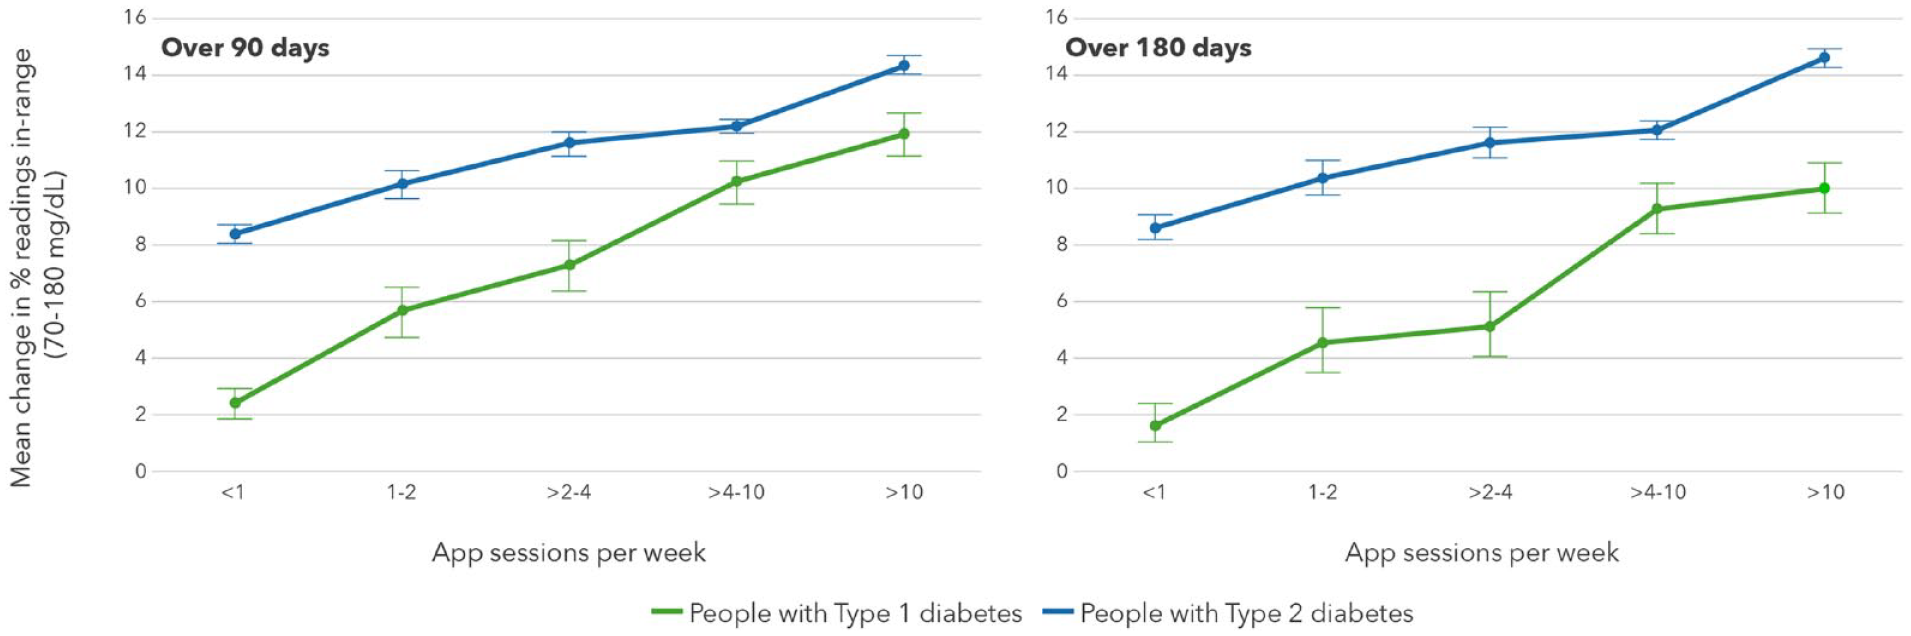
Effect of number of app sessions on RIR in PWDs.
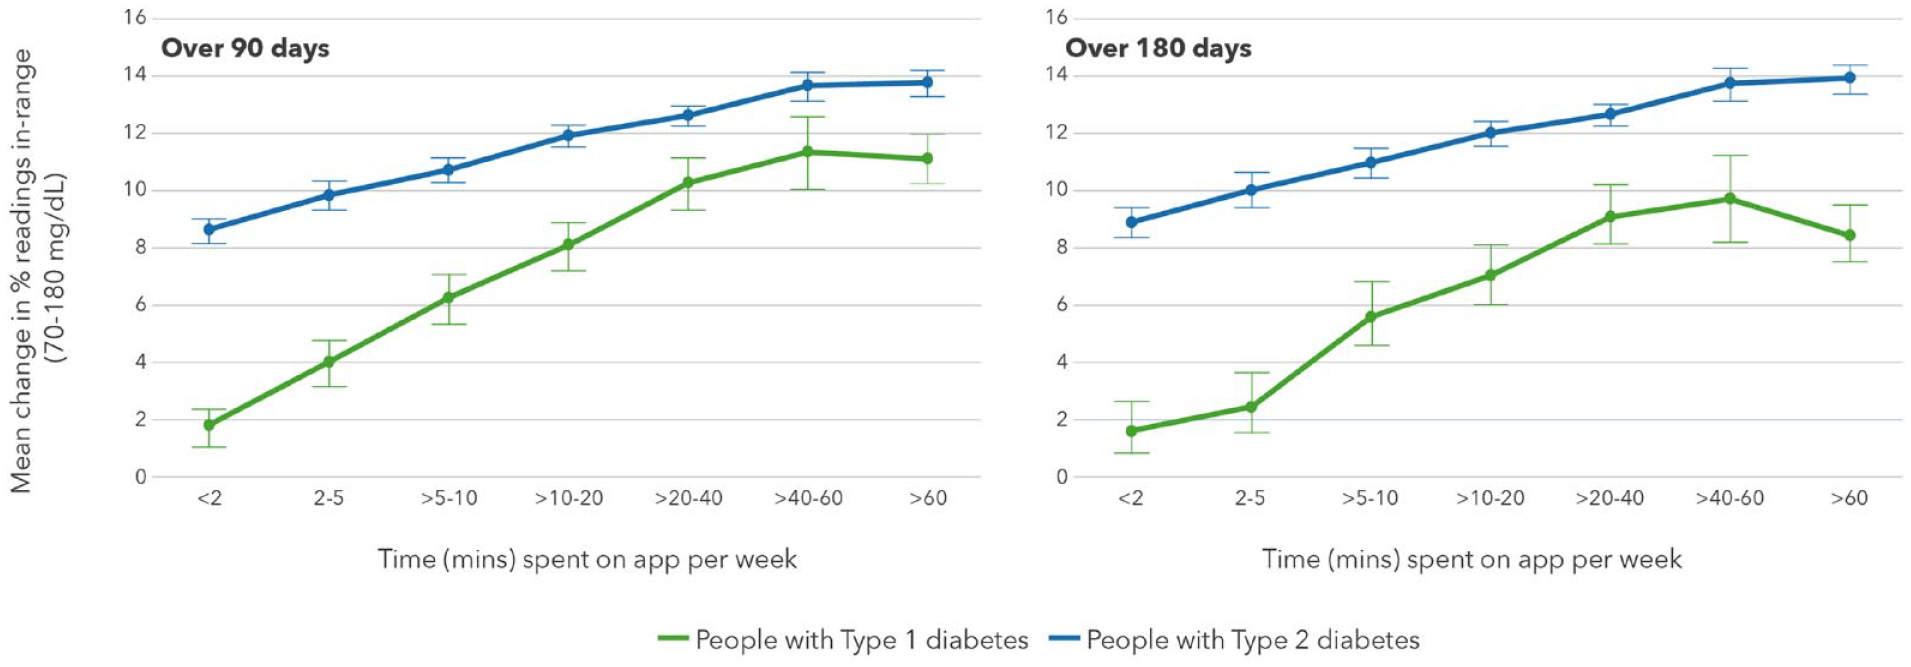
Effect of time spent in app sessions on RIR in PWDs.
Discussion
This analysis of over 144 000 PWDs is one of the largest combined BGM and mobile diabetes app datasets ever published. Our RWE provides a unique insight into the relationship between interactions with a digital app and prospective outcomes of PWDs who initiated use of a relatively simple Bluetooth®-connected BGM and a mobile diabetes app. There is considerable focus in the literature on maintaining glucoses in-range, whether that is time in-range by virtue of CGM or RIR when PWDs use BGM. We have demonstrated clinically meaningful improvements in RIR that were sustained during six months of home use in PwT1D and PwT2D. In fact, 35% of PwT1D and over 40% of PwT2D improved RIR by at least 10 percentage points over the study period, which is a significant achievement based on this relatively simple addition to their current treatment plan. In many respects, these improvements in glycemic metrics are not that surprising given that five previous studies9 -13 using this same glucose meter (with or without connection to the same mobile diabetes app) as in this real-world analysis have shown meaningful improvements in A1c in addition to recording positive patient feedback on the extra guidance the meter or app provided.
Many BGM and CGM devices rely on color displays and color ranges to help simplify numerical data for patients. The OTVF meter used in this analysis was independently endorsed by Torjman, 14 who commented that the authors had “elegantly demonstrated a 27% improvement from baseline in the subjects’ abilities to properly classify BG values into the appropriate ranges after exposure to the CRI” in an interactive in-clinic study with PWDs. 15 The CRI mentioned is a three-color range indicator (Figure 1) that is a permanent feature on the casing of the OTVF meter. This relatively simple color feature takes on further importance given that a large survey study by Polonsky et al 16 found that 50% of insulin- and non-insulin-using PwT2D took no action for low or high out-of-range glucose readings. We could reasonably speculate that PWDs who started using the OTVF meter with the OTR app took more notice and potentially took more actions than with their previous BGM. Arguably, better decision-making and interactions with the devices by PWDs may have contributed to improved RIR and fewer hyperglycemic readings.
The OTR app augments and complements the guidance of the OTVF meter, providing automatic low and high pattern detection, presenting retrospective data in an e-logbook and allowing PWDs to share a 14-day summary report (printed or by email) to their HCP. The pattern detection and messages displayed by the OTR app provide insights for the PWD into possible factors that could have affected their glucose readings, potentially allowing the PWD to better manage their diabetes. In a future analysis of our RWE data, we plan to elaborate on the impact of a direct digital connection between PWDs and HCPs, whereby HCPs who have registered to use the professional (web) version of OTR were able to view glucose data in real time from PWDs who had consented to share their data, enabling those HCPs to more efficiently perform telemedicine between scheduled consultations. The dialogue between PWDs and HCPs using OTVF and OTR app was explored by Kesavadev et al 17 who observed a reduction in A1c of 0.5% that was attributed by those PWDs to usage of these new devices leading to better adherence as a result of glycemic trends being more visible to PWDs and HCPs in real time. The PWDs also found the app helpful in titrating insulin. Our dataset allowed retrospective access to de-identified patient data, and therefore, we had no information from PWDs on their opinions or perceptions using our devices, but is it conceivable that similar experiences would be present in people within our dataset. In our dataset, the majority of PWDs have six to 12 months of time-stamped glucose data available, accumulating over time if the PWD continues to use the devices. During OTR app registration, PWDs self-report if they have type 1, type 2, or gestational diabetes and may also describe their current diabetes therapies (eg, insulin, non-insulin, or pump therapy). Furthermore, Google Analytics data pertaining to OTR usage (such as time spent on the app, the number and timing of app sessions, and the main app features accessed) are also available in our dataset.
We have previously reported 8 real-world data showing monitoring frequency reduced over time when comparing the first few weeks of starting an advanced BGM with the OTR app with after three months of home use. This current study with our simpler BGM confirms this phenomenon after six months of home use. It is plausible that the initial discovery period of using a new meter and app kickstarts a higher level of monitoring that diminishes over time. It seems likely then that the level of monitoring after three or six months more closely reflects routine monitoring frequency. It is worth noting that we did not have access to pre-study monitoring frequency data for our dataset of PWDs because their previous devices were not connected to our server; arguably, routine monitoring frequency could have been even lower with their previous devices. However, literature confirms it is challenging to influence (or increase) monitoring behavior, even when test strips are provided free of charge. For example, a study in Sweden (where test strips are free for PwT1D) found that fewer than 50% of PwT1D performed the recommended daily frequency of four checks per day. 18 With this backdrop, it was surprising that we detected clinically meaningful differences in monitoring frequency in PwT1Ds of more than one check per day on average, comparing the most to the least engaged PwT1D. Less substantial differences in monitoring frequency were found for PwT2D, but still amounted to 0.5 extra checks per day, comparing the most to least engaged. We theorize that insights from this extra monitoring could support better diabetes management and decision-making and may explain a proportion of the improved outcomes observed in the more engaged PWDs. Despite positive improvements in glucose RIR, hypoglycemic readings increased by less than one percentage point in PwT1D and were essentially unchanged in PwT2D. Our dataset does not contain information on the incidence of actual hypoglycemic episodes per se, and therefore, it is not possible to confirm whether such episodes also remained relatively unchanged. The OTVF meter displays and highlights when glucose readings are low (via the CRI), and this is reinforced by the OTR app, which identifies low glucose patterns.15,19 Such features are designed to provide insights to the PWD and help mitigate future hypoglycemic episodes. In fact, a retrospective analysis of our low pattern algorithm technology confirmed that low patterns were associated with a greater likelihood of severe hypoglycemic episodes within the next 24 hours. 20 Therefore, we would argue that these advanced features have the potential to raise awareness of and, therefore potentially reducing the risk for, hypoglycemia.
The OTR app augments the value of the Bluetooth®-connected OTVF meter by playing a key role in aggregating, interpreting, and presenting insights to PWDs and HCPs. In fact, the OTR app was selected as the top app using the mobile app rating scale (MARS) in a recent independent systematic review of 75 diabetes apps available in Canada 21 for PwT1D, PwT2D, or women with gestational diabetes, and a second independent systematic review voted the OTR app the highest quality and usability scores compared with 42 other mobile diabetes apps, including mySugr, Dario, and One Drop diabetes apps. 22 Our dataset of over 144 000 PWDs found a wide distribution of engagement with our app within the analysis timeframe. For the vast majority of people in our dataset, a relatively small investment of their time and effort interacting with the OTR app manifested in improved glycemic metrics.
Study Limitations
With RWE data, there are often limitations in terms of our knowledge of the subjects’ medical history, adherence to and/or changes in diabetes medications during the study period or the clinical goals set by their HCPs. Furthermore, we cannot verify the type of HCPs, how they used the meter or app data (or A1c) to adjust therapy or how often therapy changes were made, and it is unclear if specific subjects were offered CGM during this timeframe while continuing to use BGM.
Conclusion
Real-world data from over 144 000 PWDs demonstrated clinically significant improvements in readings in-range, with proportionate and clinically meaningful reductions in hyperglycemic readings in PWDs who started using a Bluetooth®-connected blood glucose meter with a mobile diabetes management app. Improvements in glycemic control were augmented by increasing engagement with the mobile diabetes management app, which provided personalized guidance, insight, and support.
Footnotes
Acknowledgements
Abbreviations
A1c, hemoglobin A1c; BG, blood glucose; BGM, blood glucose monitor; CRI, color range indicator; OTR, OneTouch Reveal®; OTVF, OneTouch Verio Flex®; PWD, people with diabetes; PwT1D, people with type 1 diabetes; PwT2D, people with type 2 diabetes; RIR, readings in-range; RWE, real-world evidence.
Author Contributions
MG and EH wrote the article. HC analyzed the data and reviewed the final article.
Declaration of Conflicting Interests
The author(s) declared the following potential conflicts of interest with respect to the research, authorship, and/or publication of this article: MG, HC, and EH are all current employees of LifeScan.
Funding
The author(s) disclosed receipt of the following financial support for the research, authorship, and/or publication of this article: Funding for the study and article was provided by LifeScan Inc, Malvern, PA 19355 USA.