
Abstract
Lowering glucose levels, while avoiding hypoglycaemia, can be challenging in insulin-treated patients with diabetes. We evaluated the role of ambulatory glucose profile in optimising glycaemic control in this population. Insulin-treated patients with type 1 and type 2 diabetes were recruited into a prospective, multicentre, 100-day study and randomised to control (n = 28) or intervention (n = 59) groups. The intervention group used ambulatory glucose profile, generated by continuous glucose monitoring, to assess daily glucose levels, whereas the controls relied on capillary glucose testing. Patients were reviewed at days 30 and 45 by the health care professional to adjust insulin therapy. Comparing first and last 2 weeks of the study, ambulatory glucose profile–monitored type 2 diabetes patients (n = 28) showed increased time in euglycaemia (mean ± standard deviation) by 1.4 ± 3.5 h/day (p = 0.0427) associated with reduction in HbA1c from 77 ± 15 to 67 ± 13 mmol/mol (p = 0.0002) without increased hypoglycaemia. Type 1 diabetes patients (n = 25) showed reduction in hypoglycaemia from 1.4 ± 1.7 to 0.8 ± 0.8 h/day (p = 0.0472) associated with a marginal HbA1c decrease from 75 ± 10 to 72 ± 8 mmol/mol (p = 0.0508). Largely similar findings were observed comparing intervention and control groups at end of study. In conclusion, ambulatory glucose profile helps glycaemic management in insulin-treated diabetes patients by increasing time spent in euglycaemia and decreasing HbA1c in type 2 diabetes patients, while reducing hypoglycaemia in type 1 diabetes patients.
Keywords
Introduction
It is estimated that globally there are 387 million people living with diabetes, and this number is predicted to increase to 592 million by 2035. 1 Good glycaemic control has been repeatedly shown to reduce microvascular complications.2–6 Improving blood glucose (BG) is also associated with reduction in macrovascular complications,2–5 although some short-term studies observed no effect,6,7 and one documented increased mortality with tight glycaemic control. 8 One caveat of all studies to date is the reliance on HbA1c for assessment of glycaemic control. This fails to take into account the effects of hypoglycaemia and fluctuation in BG levels, both of which are associated with adverse clinical outcome.9,10
Multiple daily injections (MDI) of insulin or continuous subcutaneous insulin infusion (CSII) are the gold standards for achieving optimal glycaemic control in patients with type 1 diabetes, and they are also increasingly being used in patients with type 2 diabetes. 11 However, these regimens require patients to perform frequent BG monitoring, usually through self-monitoring of blood glucose (SMBG) and less frequently by continuous glucose monitoring (CGM).
Devices for CGM were introduced to aid the self-management of glycaemic control, and have been shown to improve HbA1c in people with type 1 diabetes, with reduced risk of hypoglycaemia, although not all studies are in agreement.12–19 CGM use in patients with type 2 diabetes who are not on prandial insulin has shown improvement in glycaemic control manifesting as reduction in HbA1c.19,20 In addition to HbA1c, previous work demonstrated that CGM can reduce glucose variability compared with SMBG.21–24 However, studies analysing the effectiveness of CGM in improving glycaemia in MDI-treated patients with type 2 diabetes remain scarce, so CGM is not routinely used in this group of patients. Moreover, it is unclear at present whether the outcome in type 1 and type 2 diabetes patients is similar when identical CGM monitoring and management strategies are used.
The aim of this study was to investigate the role of a simple, yet structured, approach to improve glycaemic control in MDI-managed patients with type 1 or type 2 diabetes. The intervention combines CGM with reviewing and explaining ambulatory glucose profile (AGP) by the health care professional, followed by appropriate adjustment in insulin therapy.
Materials and methods
Study population
Patients were eligible for inclusion if they were aged 18 years or over with type 1 or type 2 diabetes. Inclusion criteria included treatment with MDI for >6 months prior to study enrolment, HbA1c between 7.5% and 12.0% (58 and 108 mmol/mol) obtained within 6 months of enrolment, and individuals who were judged by the investigators to be technically capable of using the FreeStyle Navigator (FSN; Abbott Diabetes Care Ltd, Witney, UK), a CGM device. Patients were excluded if they (1) had concomitant disease or any condition that could compromise patient safety (including unstable coronary heart disease, cystic fibrosis, serious psychiatric disorder or any uncontrolled chronic medical condition); (2) were pregnant or planning to become pregnant within the study duration; (3) were currently using/had previously used a CGM device within the last 6 months, or were using CSII or basal insulin only; (4) were participating in another study of a glucose-monitoring device/drug that could affect glucose measurements/management; (5) had a known allergy to medical-grade adhesives or (6) were judged by the investigators as unsuitable to participate due to any other cause/reason.
Study design
This was a UK multicentre (nine hospitals), randomised, two-arm, parallel-group study. Following consent, screening and enrolment, all patients took part in a baseline phase of 15 days, during which they self-managed their BG with the FSN metre built into the FSN receiver. During this baseline phase, patients wore a FSN transmitter to collect continuous glucose data. The receiver was in masked mode and glucose data were not visible to patients. In addition, patients were asked to log insulin, food, exercise, state of health and hypoglycaemic episodes while using the FSN. Following this 15-day masked period, patients who had CGM data for 50% of the 15-day masked period (or at least 1000 individual CGM readings) were randomised by permuted block randomisation with stratification by site and diabetes type in a 2:1 ratio into one of two groups (intervention or control), for the next 85 days. The randomisation sequence was computer-generated.
The intervention group used unmasked FSN with the low, high and projected alarms switched off (data loss and calibration alarms were still active). Patients were instructed to leave the alarms turned off for the duration of the study to avoid interference, and to better understand the effect of reviewing glucose profile on hyper- and hypoglycaemia. Patients in both groups were allowed to make changes to their insulin doses using their existing diabetes knowledge. Study-related adjustments to insulin doses were made on days 30 and 45 only in the presence of the health care practitioner (HCP) who reviewed the glucose data with the patient. Insulin adjustments followed rules of common clinical practice with glucose targets set according to the needs of each patient. Hypoglycaemic episodes were targeted as a priority through reducing insulin doses, re-educating on carbohydrate counting and addressing the effects of exercise. Fasting hyperglycaemia was tackled by increasing the dose of long-acting insulin, whereas adjustments were made to bolus insulin in cases of elevated postprandial glucose levels.
The control group managed their BG with standard SMBG (FreeStyle Freedom Lite; Abbott Diabetes Care Ltd, Witney, UK) and used another masked FSN for the final 15-day period of the study. However, unlike the intervention group, data were masked and therefore the HCP conducted a review in line with current standards of care and made appropriate recommendations.
HbA1c was measured on day 1 (start of the baseline period) and day 100 (end of study). Study participation commenced on 22 October 2012 and the last patient completed the study on 21 May 2013. The study was conducted in compliance with the protocol and International Conference on Harmonisation Guidelines/Good Clinical Practices/Declaration of Helsinki. ClinicalTrials.gov identifier: NCT01713348.
Outcome assessments
The primary outcome was the difference in time with glucose in range [3.9–10.0 mmol/L (70–180 mg/dL)] in the final 15 days (days 86–100) for the intervention group compared with baseline phase (analysed separately for patients with type 1 and type 2 diabetes).
The secondary outcomes included: (1) within-group analysis of hypoglycaemia, HbA1c, body weight and frequency of SMBG, comparing baseline with end of study, and (2) between-group exploratory analysis comparing the last 2 weeks of the study in relation to time spent in euglycaemia and hypoglycaemia, as well as difference in HbA1c and SMBG. All analyses were conducted separately for patients with type 1 or type 2 diabetes.
Patient-reported outcomes measures
All patients completed the Diabetes Treatment Satisfaction Questionnaire – Status (DTSQs) 25 prior to any other study activities on day 1 to assess the satisfaction with current treatment, and completed the Diabetes Treatment Satisfaction Questionnaire – Change (DTSQc) 25 prior to any other study activities on day 86 to compare their satisfaction with their current treatment to their previous treatment. In DTSQs, 0 = worst response, 6 = best response; in DTSQc, −3 = worst response, 3 = best response).
Safety assessments
Safety endpoints included adverse events related to device and study, and signs and symptoms related to FSN sensor insertion site (bleeding, bruising, erythema, induration, oedema, rash and pain).
Statistical analyses
The study was powered at 80% to detect a 1.7-h/day difference between baseline and the final phase in time spent within glucose range 3.9–10.0 mmol/L (70–80 mg/dL) with a 5% significance level, which resulted in a sample size of 24. Allowing for a drop-out rate of 20%, a minimum of 58 individuals are needed in the intervention arm equally divided between the type 1 and type 2 diabetes groups.
Missing data were not estimated in the statistical analysis. Glucose values outside the dynamic range [1.1 mmol/L (20 mg/dL) to 27.7 mmol/L (500 mg/dL)] were excluded, except when calculating glucose excursions.
Results for the between-group comparison were analysed by analysis of covariance on baseline measurement, allowing for the study site, separately for type 1 and type 2 diabetes, and are presented as the difference in least square mean in intervention from control values.
For sensor glucose results, a minimal of 72 h of sensor glucose results were required to undertake the analysis. Patients with less than 72 h of sensor glucose results recorded in days 15–100 were excluded from the analysis.
For safety analyses, the population included all patients screened and enrolled for whom at least one attempt was made to insert a FSN sensor, whether or not the sensor was inserted successfully.
Results
Study population
A total of 105 patients provided consent and were enrolled in the study. Patient disposition and characteristics are summarised in Figure 1 and Table 1, respectively. Two patients in the intervention group had their alarms enabled for more than 50% of sensor wear in the treatment phase and were excluded from the per-protocol analyses of glycaemic measures, but they were included in the intention-to-treat (ITT) analyses.
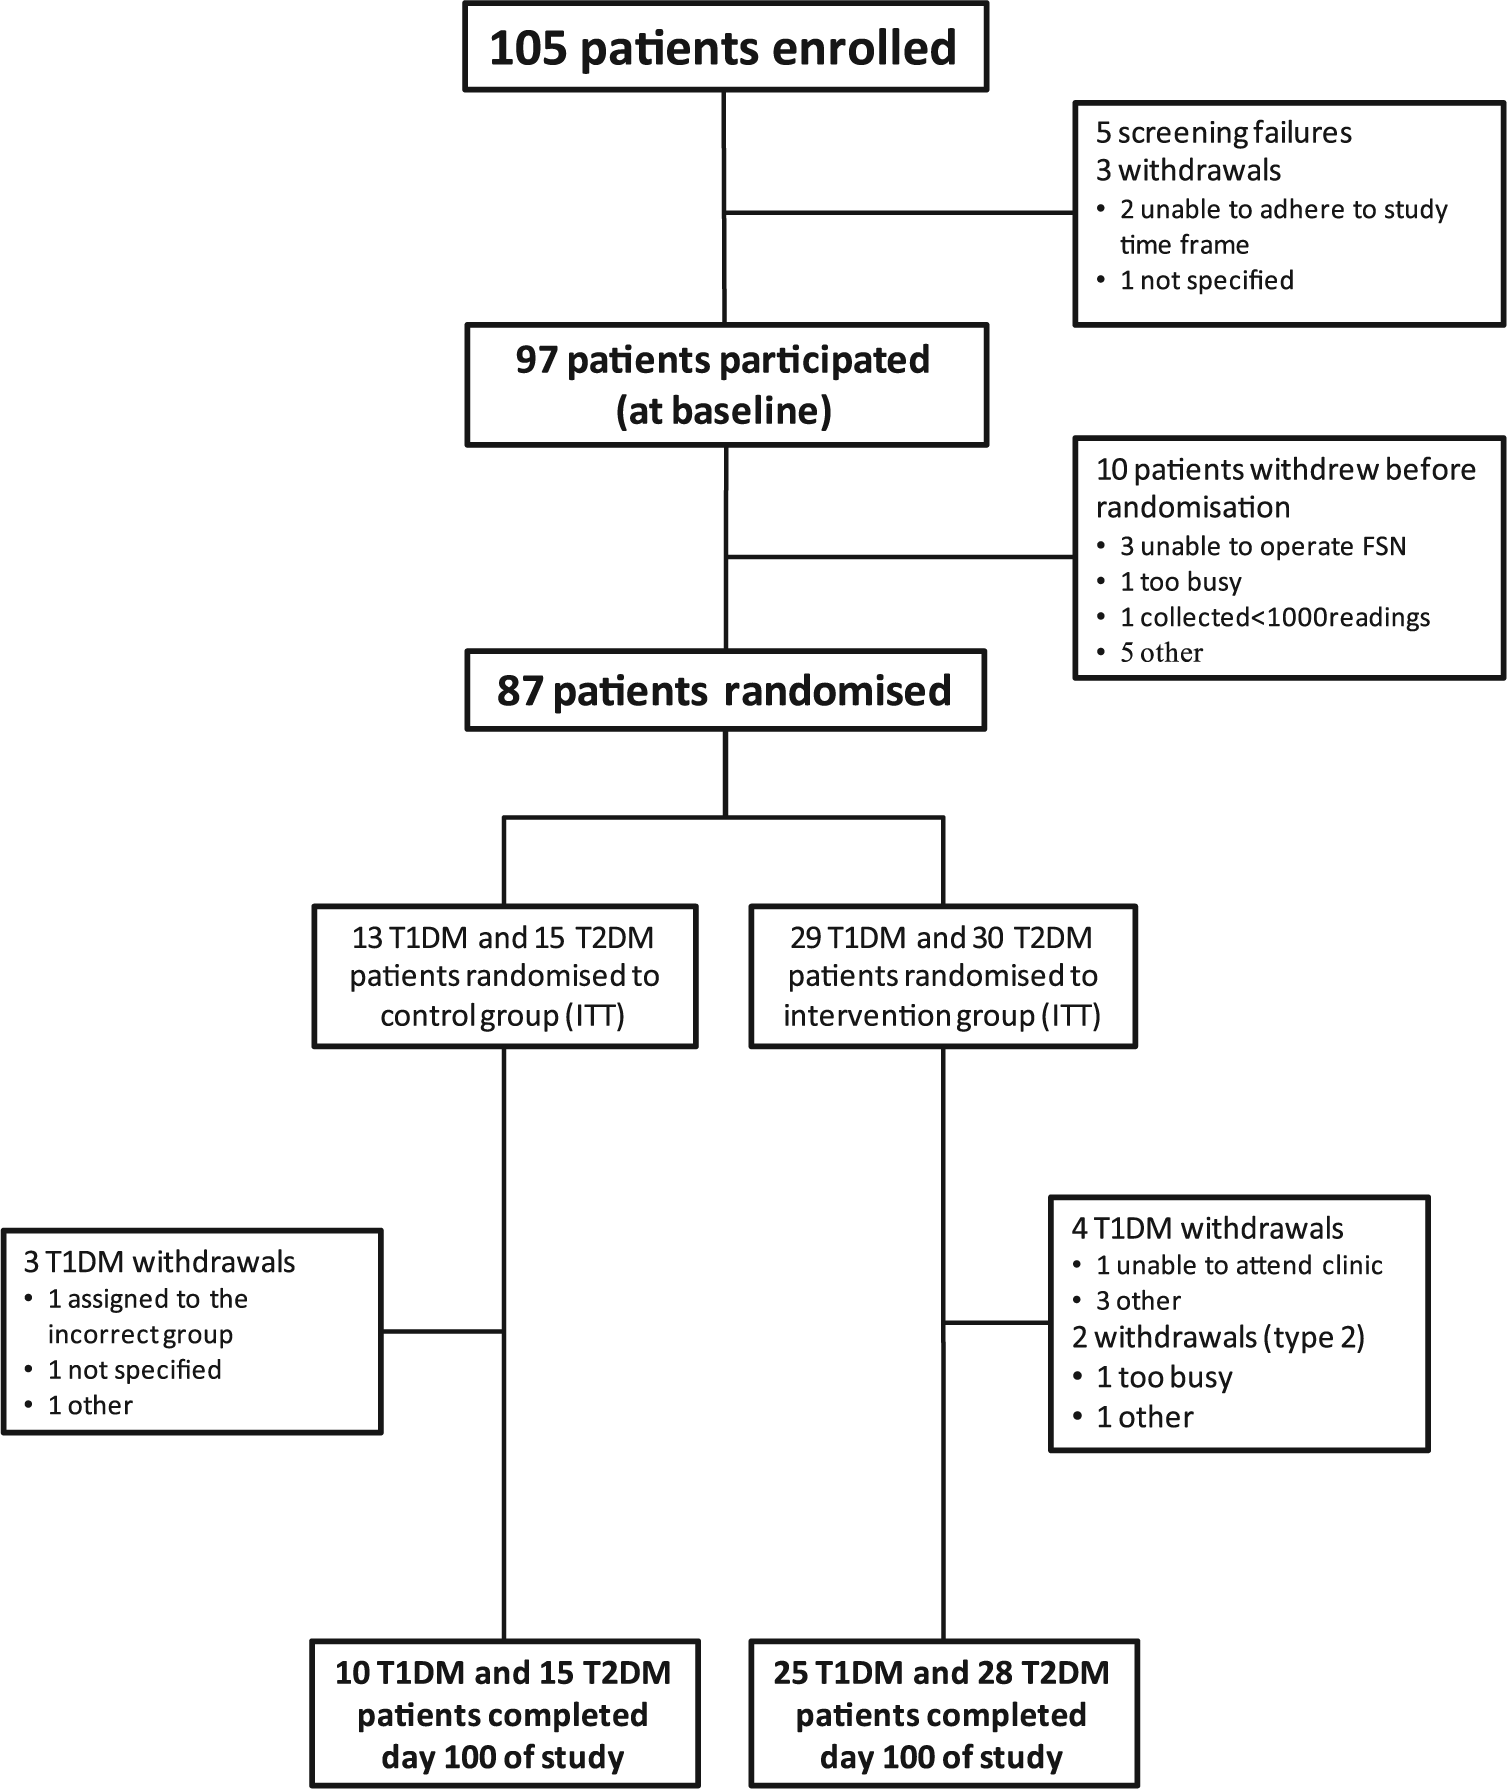
A summary of recruitment and disposition.
Baseline characteristics of both type 1 and type 2 diabetes patients. Severe hypoglycaemia is defined as an event requiring the assistance of a third party.
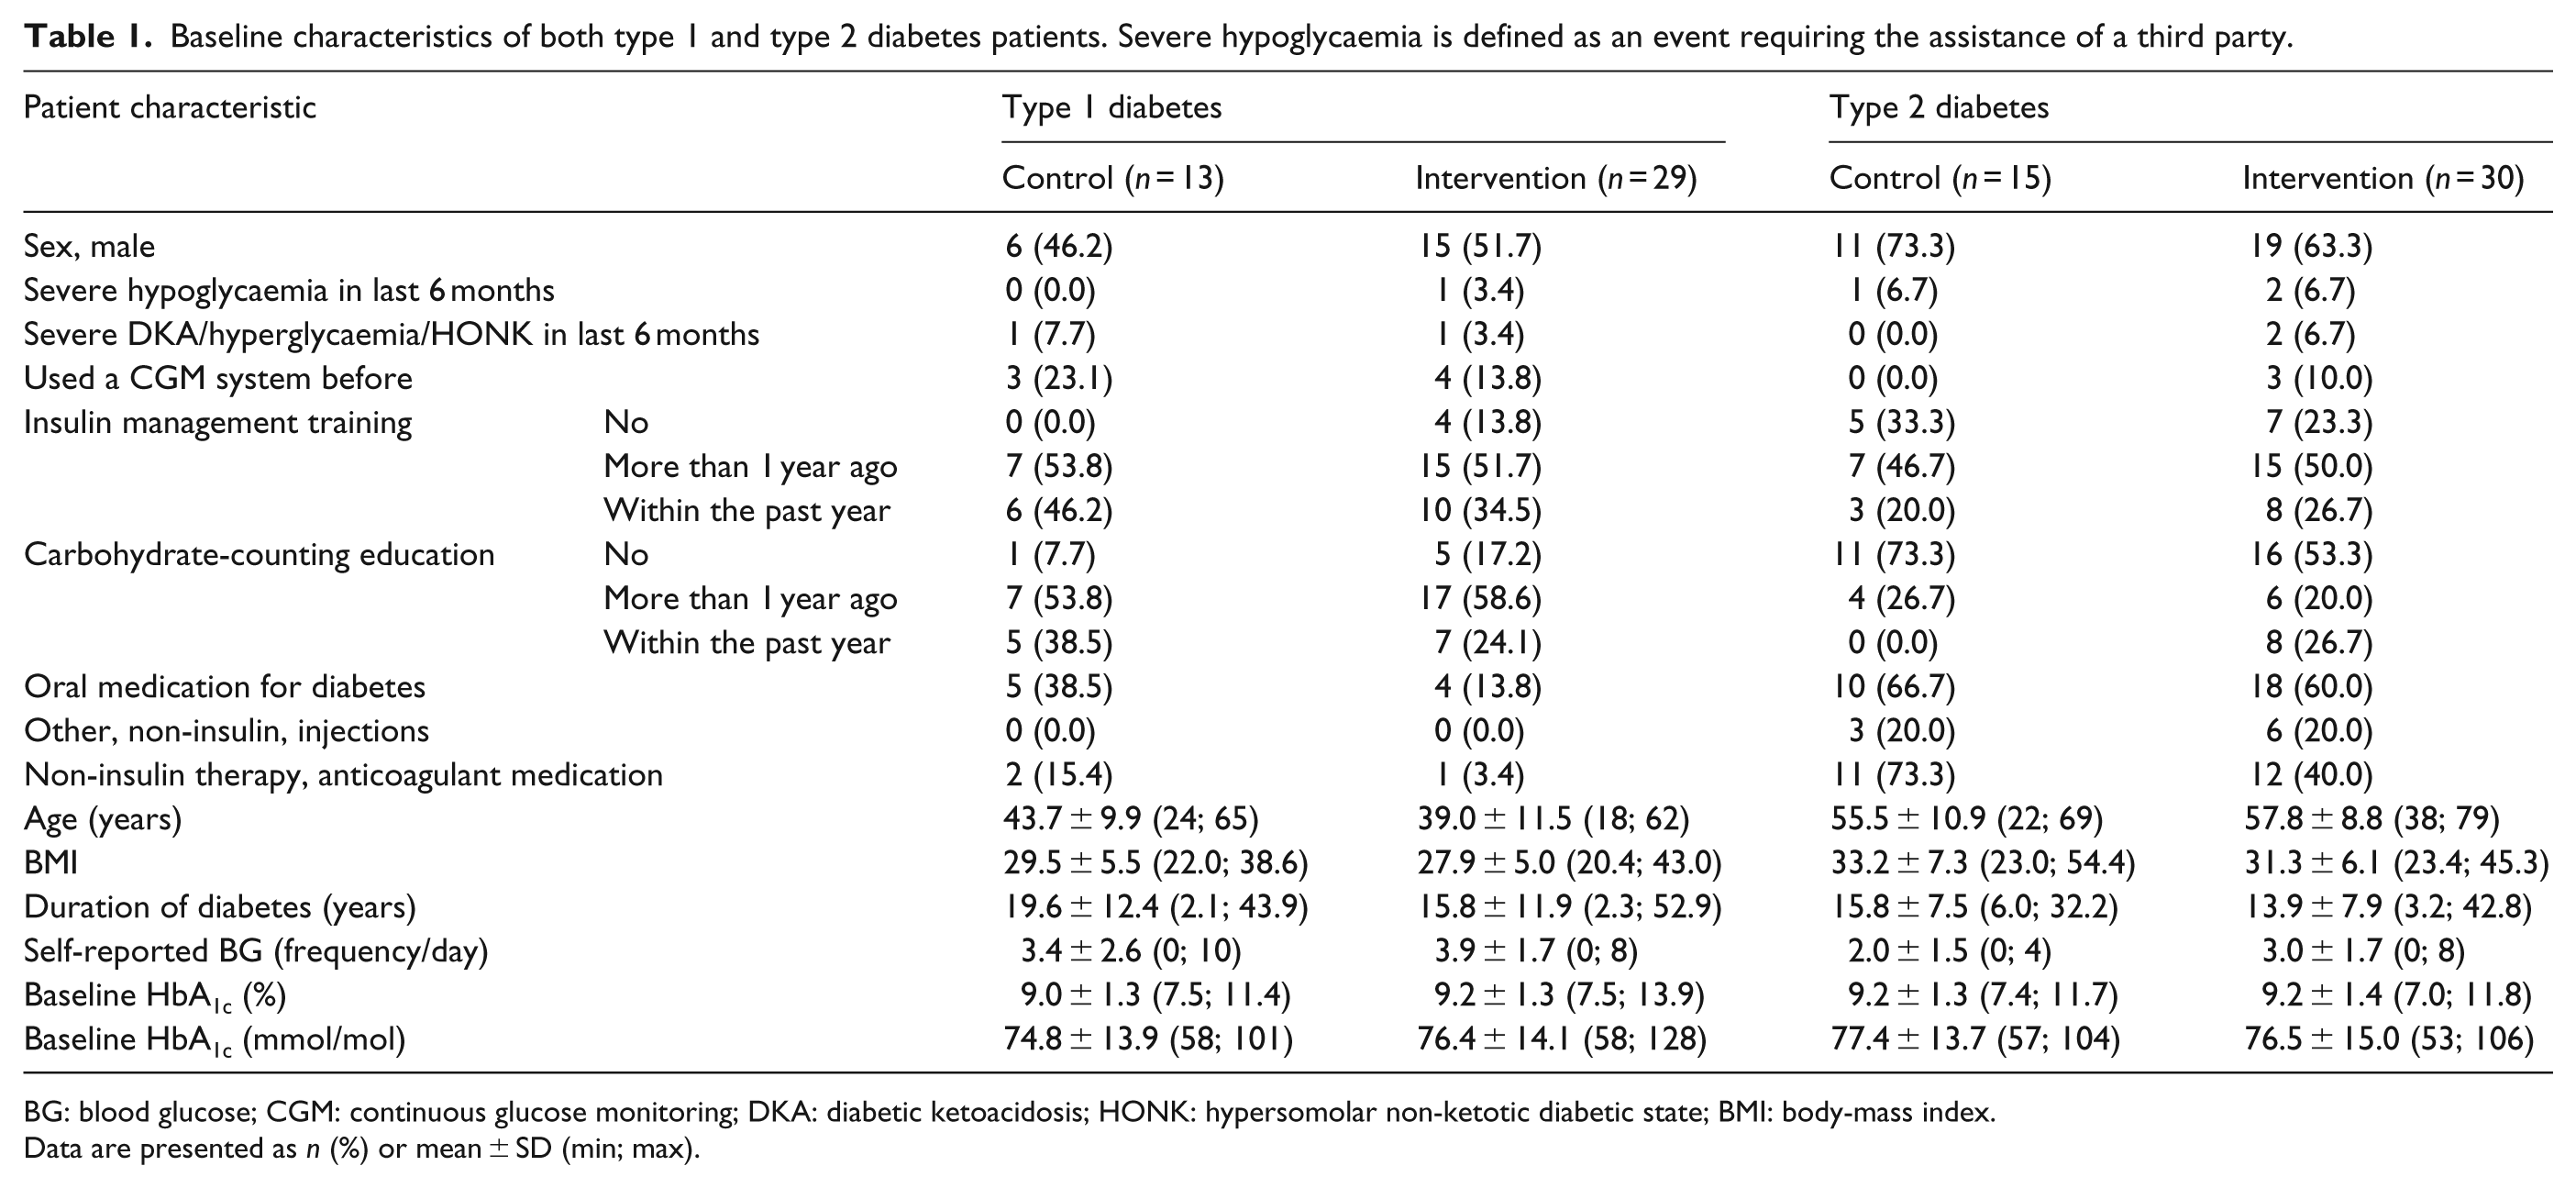
BG: blood glucose; CGM: continuous glucose monitoring; DKA: diabetic ketoacidosis; HONK: hypersomolar non-ketotic diabetic state; BMI: body-mass index.
Data are presented as n (%) or mean ± SD (min; max).
Time spent in glucose target range
Within-group analysis in the intervention group has shown that patients with type 1 diabetes had a time in range for the baseline phase of 10.9 ± 3.0 h/day and 10.8 ± 3.9 h/day for the final phase, representing a non-significant mean difference of −0.1 ± 3.3 h/day, 95% confidence interval (CI): −1.29; 1.19, p = 0.9345.
In contrast, patients with type 2 diabetes showed a significant increase of time in range from 13.3 ± 5.2 h/day for the baseline phase to 14.7 ± 5.8 h/day for the final phase, with a mean difference of 1.4 ± 3.5 h/day, 95% CI: 0.05; 2.73, p = 0.0427.
Secondary endpoints
Within-group analysis in the intervention arm
Patients with type 1 diabetes showed a significant reduction in time in hypoglycaemia, associated with a trend towards a drop in HbA1c (Table 2). Weight was increased in this group, whereas SMBG testing frequency was reduced from baseline (Table 2). Number of glucose excursions <3.9 mmol/L decreased from 0.9 ± 0.7 to 0.7 ± 0.7/day, representing a reduction of −0.2 episode/day (−0.41, 0.02; p = 0.0695), with a non-significant reduction of excursions <2.2 mmol/L at −0.1 episode/day (−0.19, 0.05; p = 0.215). Glucose variability measured as standard deviation (SD) of glucose readings was reduced from 4.0 ± 0.8 to 3.8 ± 0.7 mmol/L (p = 0.0352).
Within-group analyses comparing baseline (first 2 weeks) with end of study (last 2 weeks).
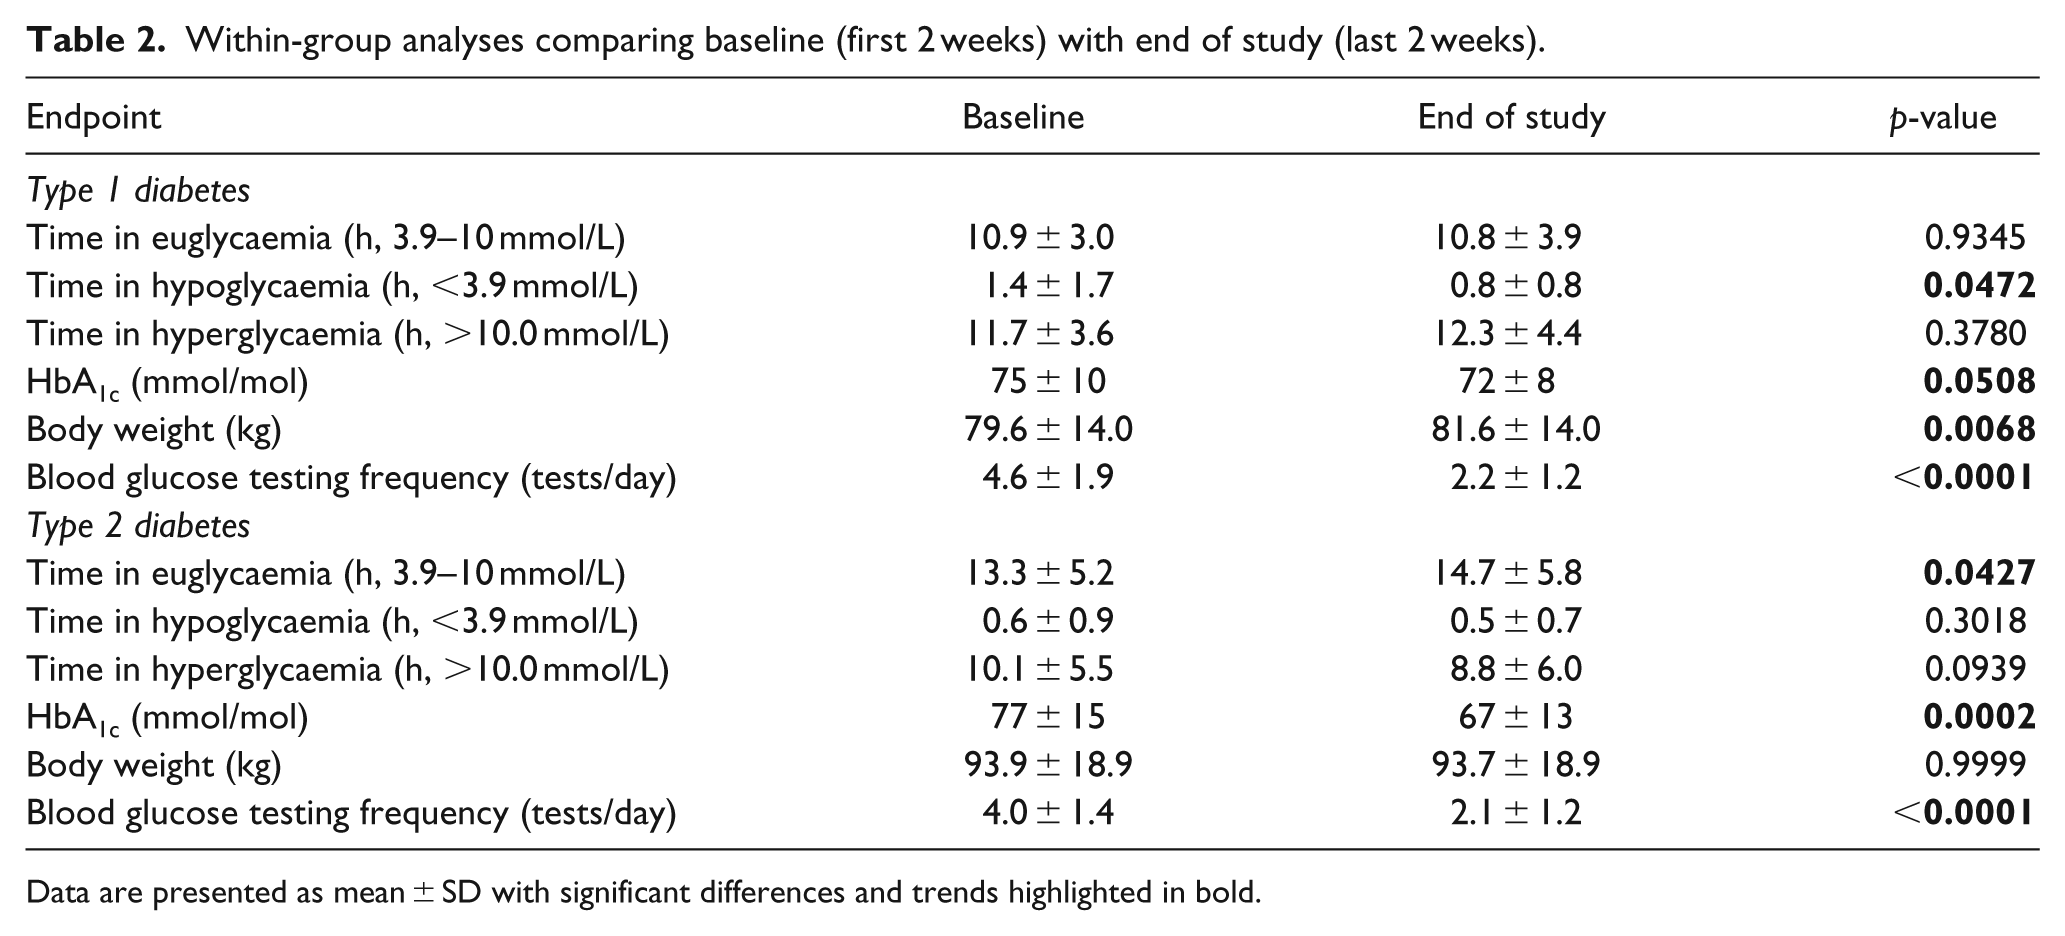
Data are presented as mean ± SD with significant differences and trends highlighted in bold.
In patients with type 2 diabetes, there was a significant increase in time in euglycaemia, associated with a reduction in HbA1c (Table 2). Despite the improvement in glycaemic control, there was no increase in time spent in hypoglycaemia and there was no weight gain (Table 2). Glycaemic excursions <3.9 and <2.2 mmol/L showed no difference comparing baseline with end of study (data not shown). For glucose variability, SD of glucose readings decreased from 3.0 ± 0.7 to 2.8 ± 0.7, a difference that showed a trend (p = 0.073).
Between-group analysis of intervention versus control arms
This was an exploratory analysis to study differences between the intervention and control groups. Although there was no difference in time spent in euglycaemia in the final 15 days (days 86–100) comparing type 1 diabetes patients in the intervention and control arms, there was a numerical reduction in time spent in hypoglycaemia in the intervention arm by −0.32 h/day (p = 0.187) associated with lower HbA1c by 3 mmol/mol, a difference that failed to reach statistical significance (Table 3). Baseline-adjusted number of hypoglycaemic excursions <3.9 mmol/L at end of study were 0.77 ± 0.16 and 0.68 ± 0.10 for control and intervention group, respectively (p = 0.614), whereas excursions <2.2 mmol/L were 0.13 ± 0.05 and 0.09 ± 0.03, respectively (p = 0.390).
Secondary endpoints comparing intervention and control group.
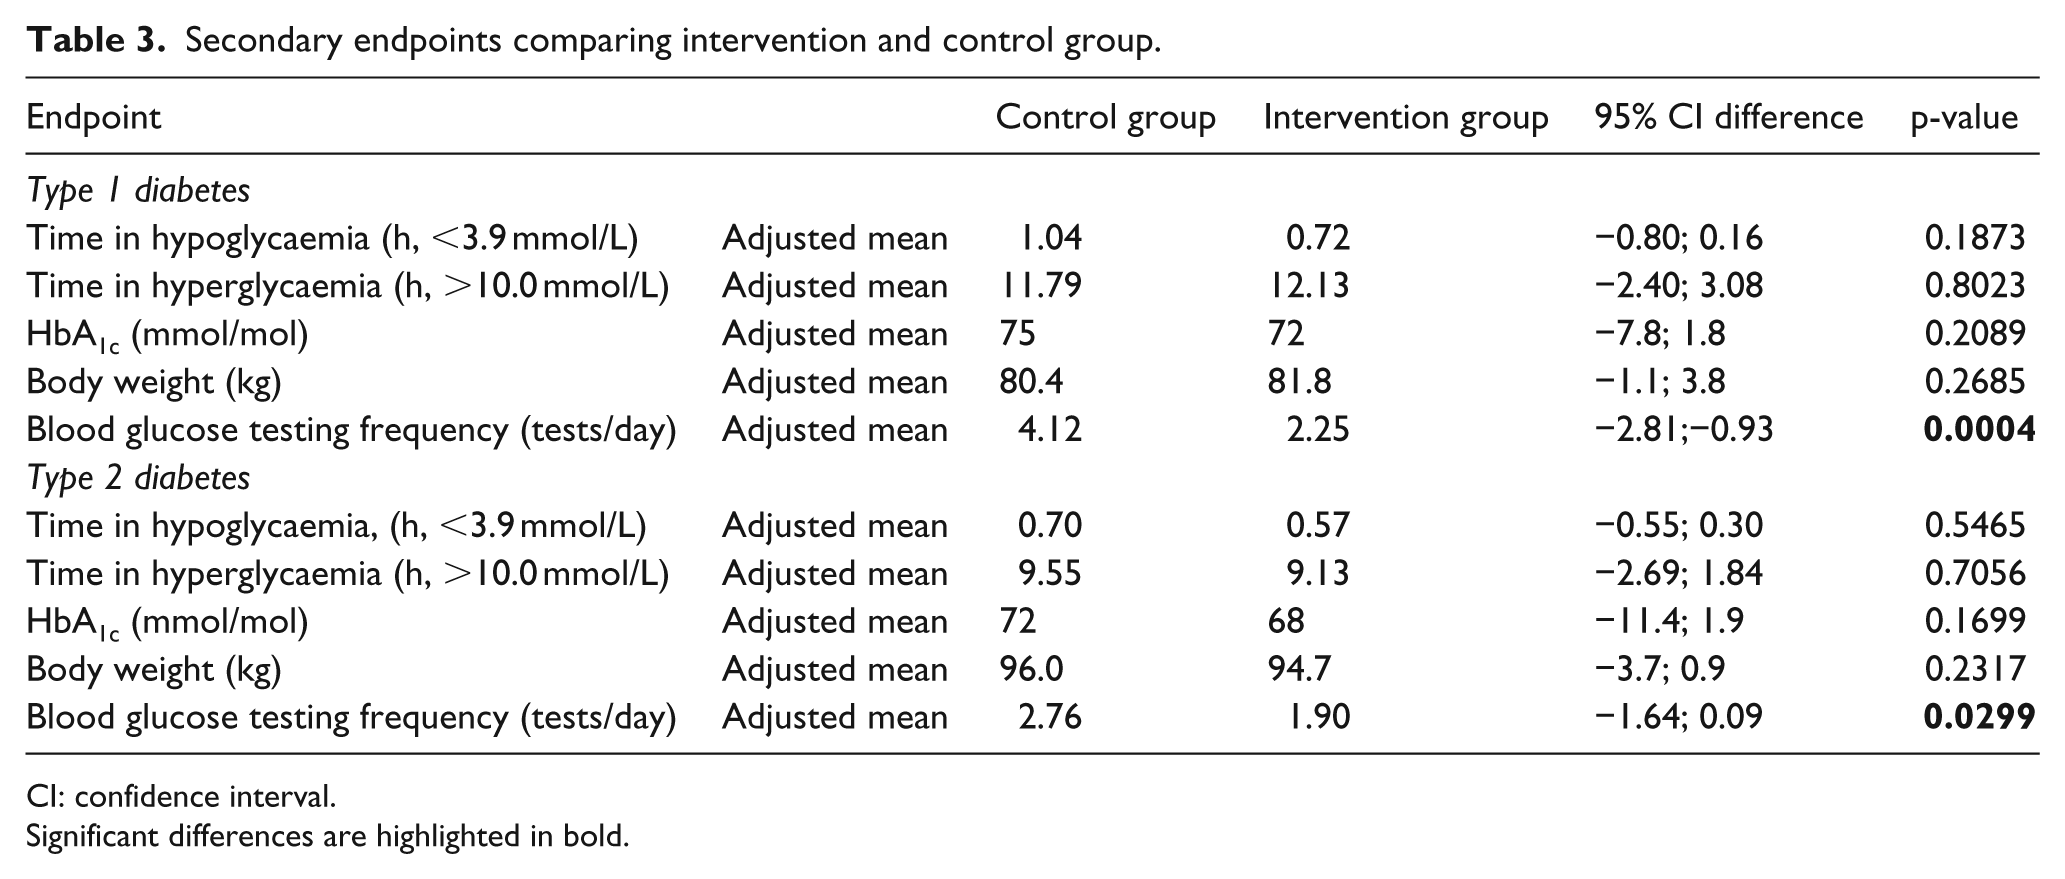
CI: confidence interval.
Significant differences are highlighted in bold.
In type 2 diabetes patients, time spent in euglycaemia was largely similar in control and interventional arms but HbA1c showed a numerical decrease, without an increase in hypoglycaemia (Table 3). Patients in the intervention group showed significantly reduced BG test frequency (Table 3).
In type 1 diabetes patients, total daily insulin dose was significantly reduced in the intervention group comparing baseline with end of study (63.2 ± 29.3 and 47.2 ± 23.8 units, respectively; p = 0.0053), whereas the change in the control group was not significant (53.3 ± 33.4 and 44.5 ± 33.1, respectively; p = 0.449).
Despite the improved diabetes control in the type 2 diabetes patients in the intensive arm, there was a trend towards a reduction in total daily insulin dose comparing baseline with end of study (83.3 ± 92.1 and 62.4 ± 48.8, respectively; p = 0.0874) with no significant difference detected in the control group (101.3 ± 75.8 and 84.8 ± 71.9, respectively; p = 0.235).
Patient-reported outcomes measures
All patients completed DTSQ. Patients with type 1 diabetes were more satisfied with the change they experienced in hyperglycaemia from baseline to end of study in the intervention group than in the control group (0.37 vs −0.90, respectively, p = 0.0252). There were no significant differences reported in satisfaction between the groups with regard to the change in time spent in hypoglycaemia (−0.58 vs −1.24, respectively, p = 0.3257) or overall satisfaction (12.69 vs 11.61, respectively, p = 0.5765). Patients with type 2 diabetes in both the intervention and the control groups did not show a significant difference in their satisfaction with the change time spent in hyperglycaemia from baseline to end of study (0.55 vs 0.19, respectively, p = 0.5465), time spent in hypoglycaemia (−0.05 vs −0.47, respectively, p = 0.4746) or overall treatment satisfaction (13.39 vs 13.52, respectively, p = 0.9368).
Safety assessments
Of the 49 patients with type 1 diabetes who provided consent, 23 patients (7 control, 15 intervention and 1 not randomised) experienced an adverse event (46.9%). None of these were serious device-related events; two adverse events were related to the study device and one adverse event was possibly related to the study device. Two adverse events were related to participation in the study and ten were possibly related to participation in the study. Of 49 patients, 31 (63.3%) had sensor insertion site symptoms.
Of the 56 patients with type 2 diabetes, 27 (8 control and 19 intervention) experienced an adverse event (48.2%). None of these were serious device-related events. Five adverse events were related to the study device and one adverse event was possibly related to the study device. Five adverse events were related to participation and five were possibly related to participation. Of 56 patients, 48 (87.3%) had sensor insertion site symptoms.
Discussion
This multicentre study investigated the effects of CGM together with a structured AGP on glycaemic control in individuals with type 1 or type 2 diabetes. Our data yielded a number of novel findings, including (1) CGM with structured AGP in type 2 diabetes increases time in euglycaemia and improves HbA1c without increasing hypoglycaemia, (2) the same intervention in type 1 diabetes does not alter time in euglycaemia but reduces hypoglycaemia and displays a trend towards improvement in HbA1c, (3) the intervention is associated with reduction in SMBG frequency in both type 1 or type 2 diabetes patients and (4) although the study was designed to investigate within-group differences, a largely similar pattern emerged when comparing the intervention to the control group in an exploratory analysis.
CGM with alarm function turned off was chosen due to the reported anxiety associated with continuous glucose feedback 26 and our desire to understand the effects of AGP on glycaemic control while keeping variables to a minimum. Previous work on 16 insulin-treated type 2 diabetes patients demonstrated that short-term CGM is accurate, reduces glucose excursions and may therefore improve glycaemic control. 21 The significant increase in time in euglycaemia in type 2 diabetes patients explains the large reduction in HbA1c in the relatively short period of the study. Interestingly, this did not occur at the expense of increased risk of hypoglycaemia, achieved with lower total daily dose of insulin and was not associated with a significant change in body weight. Although the difference in time spent in euglycaemia comparing the intervention with the control group was small and non-significant, the trend towards lower HbA1c in the intervention group can be explained by lower glycaemic excursions. 21
Studies using CGM in insulin-treated type 2 diabetes patients are limited, which is surprising given that less than a fifth of these individuals reach target HbA1c. 27 Cosson et al. 28 conducted the first randomised multicentre study that involved 25 patients with type 2 diabetes, and have shown that CGM was associated with improved HbA1c compared with SMBG after 3 months. However, CGM was limited to 48 h, and there was a large drop-out rate, making general applicability of the results uncertain. In a larger study of 65 patients with poorly controlled diabetes, individuals randomised to CGM showed superior improvement in HbA1c over a period of 3 months compared with SMBG. 22 However, patients included were a mixture of insulin and non-insulin users, and so the study failed to clarify whether CGM is useful in patients with longer duration of diabetes and who require insulin therapy. 22 Therefore, our study remains the largest to date to use CGM in MDI-treated type 2 diabetes patients for an extended period of time, and to utilise AGP to improve glycaemia. In addition, we are the first to comprehensively demonstrate that tightening glycaemic control using CGM does not increase the risk of hypoglycaemia and is not associated with weight gain in the short term.
In contrast, within-group analysis of patients with type 1 diabetes failed to show increased time in euglycaemia following CGM. However, there was a significant decrease in time spent in hypoglycaemia, which was associated with a trend towards lower HbA1c and significant reduction in total daily insulin dose. A similar trend was apparent comparing the intervention with the control group. Previous work has shown that CGM use can improve glycaemic control in type 1 diabetes, although this remains an area for debate. 29 An important finding in our study is the trend towards an improvement in HbA1c despite similar time spent in euglycaemia at baseline and end of study. This finding is probably due to decreased incidence of hypoglycaemia resulting in reduced glucose excursions. These results are similar to those seen by Battelino et al., 30 who documented a decrease in time spent in hypoglycaemia and a reduction in HbA1c in patients with type 1 diabetes using CGM with enabled alarm function.
The frequency of SMBG tests per day was reduced significantly in patients with type 1 or type 2 diabetes in the intervention arm, despite the need to perform additional glucose tests (approximately once per day) to calibrate the FSN sensors. This suggests that patients in the intervention group were proactive in checking and understanding their glucose results from the FSN receiver, and had the confidence in the data to manage their glycaemia.
There are a number of limitations to our study that should be acknowledged. First, the study was powered to investigate within-group differences and therefore data related to between-group analyses are underpowered. Second, the short period of the study fails to provide concrete conclusions on the long-term effectiveness of such an approach. Third, although the study had a structured design, there was flexibility in adjusting insulin therapy according to the need of each patient at the discretion of the investigators. This may have increased the variability of the data, although it has the advantage of better reflecting the ‘real-life’ situation. Overall, however, our work provides enough evidence to conduct large multicentre clinical trials to investigate the role of AGP on improving glycaemic control and reducing hypoglycaemia in insulin-treated individuals with diabetes.
In summary, this study demonstrates that the combination of CGM without alarm function and AGP is associated with increased time spent in euglycaemia and reduction in HbA1c without increasing hypoglycaemic episodes or resulting in weight gain in individuals with type 2 diabetes. The same intervention in type 1 diabetes reduces time spent in hypoglycaemia and shows a trend towards lower HbA1c.
Footnotes
Acknowledgements
Trial registry: ![]() , NCT01713348. The authors would like to thank the staff and patients who participated in the study from St. James’s University Hospital, Leeds, UK; County Durham and Darlington NHS Foundation Trust, County Durham, UK; Heart of England NHS Trust, Heartlands Hospital, Birmingham, UK; University Hospital Ayr, Ayr, UK; Rotherham Hospital NHS Foundation Trust, Rotherham, UK; Tameside Hospital NHS Foundation Trust, Ashton-under-Lyne, UK; Ipswich Hospital, Ipswich, UK; Royal United Hospital, Bath, UK; Royal Wolverhampton Hospital NHS Trust, New Cross Hospital, Wolverhampton, UK. Also, the authors would like to thank Zoe Welsh, Abbott Diabetes Care, for help with data analysis and provision of statistical support. Ramzi A Ajjan was a study investigator and wrote the manuscript; Kamal Abougila, Srikanth Bellary, Andrew Collier, Bernd Franke, Edward B Jude, Gerrard Rayman, Anthony Robinson and Baldev Singh were all study investigators and contributed to the writing and reviewing of the manuscript. The corresponding author will be the guarantor for this article.
, NCT01713348. The authors would like to thank the staff and patients who participated in the study from St. James’s University Hospital, Leeds, UK; County Durham and Darlington NHS Foundation Trust, County Durham, UK; Heart of England NHS Trust, Heartlands Hospital, Birmingham, UK; University Hospital Ayr, Ayr, UK; Rotherham Hospital NHS Foundation Trust, Rotherham, UK; Tameside Hospital NHS Foundation Trust, Ashton-under-Lyne, UK; Ipswich Hospital, Ipswich, UK; Royal United Hospital, Bath, UK; Royal Wolverhampton Hospital NHS Trust, New Cross Hospital, Wolverhampton, UK. Also, the authors would like to thank Zoe Welsh, Abbott Diabetes Care, for help with data analysis and provision of statistical support. Ramzi A Ajjan was a study investigator and wrote the manuscript; Kamal Abougila, Srikanth Bellary, Andrew Collier, Bernd Franke, Edward B Jude, Gerrard Rayman, Anthony Robinson and Baldev Singh were all study investigators and contributed to the writing and reviewing of the manuscript. The corresponding author will be the guarantor for this article.
Declaration of conflicting interests
The author(s) declared no potential conflicts of interest with respect to the research, authorship and/or publication of this article.
Funding
The study was funded by Abbott Diabetes Care.